Automatic hemolysis identification on aligned dual-lighting images
of cultured blood agar plates
Mattia Savardi? Alessandro Ferrari?† Alberto Signoroni?∗
?Information Engineering Dept., University of Brescia, Brescia (Italy) †Futura Science Park, Copan Group S.p.A., Brescia (Italy)
Abstract
Background and Objective. The recent introduction of full laboratory automation systems in clinical microbiology opens to the availability of streams of high definition images representing bacteria culturing plates. This creates new opportu-nities to support diagnostic decisions through image analysis and interpretation solutions, with an expected high impact on the efficiency of the laboratory workflow and related quality implications. Starting from images acquired under different illumination settings (top-light and back-light), the objective of this work is to design and evaluate a method for the detection and classification of diagnostically relevant hemolysis effects associated with specific bacteria growing on blood agar plates. The presence of hemolysis is an important factor to assess the virulence of pathogens, and is a fundamental sign of the presence of certain types of bacteria.
Methods. We introduce a two-stage approach. Firstly, the implementation of a highly accurate alignment of same-plate image scans, acquired using top-light and back-light illumination, enables the joint spatially coherent exploitation of the available data. Secondly, from each segmented portion of the image containing at least one bacterial colony, specifically designed image features are extracted to feed a SVM classification system, allowing detection and discrimination among different types of hemolysis.
Results. The fine alignment solution aligns more than 98.1% images with a residual error of less than 0.13mm. The hemolysis classification block achieves a 88.3% precision with a recall of 98.6%.
Conclusions. The results collected from different clinical scenarios (urinary infections and throat swab screening) to-gether with accurate error analysis demonstrate the suitability of our system for robust hemolysis detection and classi-fication, which remains feasible even in challenging conditions (low contrast or illumination changes).
Keywords: Digital Microbiology Imaging, Full Laboratory Automation, Hemolysis identification, Machine learning, Image alignment, Image classification
1. Introduction
Besides its leading role in the development of modern microbiology, bacteria culturing on agar plates remains a gold standard procedure for bacteria identification in the workflow of Clinical Microbiology Laboratories (CML) all
5
around the world. By looking at the bacteria culture, the skilled microbiologist obtains a first (so called presump-tive) interpretation of possible ongoing infections affect-ing the patients’ heath. This is a fundamental step in the diagnostic process to initiate a prompt and
appropri-10
ate antibiotic therapy and to guide the selection of specific analytic and diagnostic phases (e.g. antibiogram, MALDI-TOF mass spectrometry, PCR for pathogen DNA or RNA amplification) that allows the confirmation or definition of
∗Corresponding author email: [email protected]
a more effective treatment. Moreover, there is
diagnosti-15
cally relevant information about pathogenic identification and virulence that is immediately available from bacteria culturing which is impossible or difficult to see from other procedures. One of the most important examples from this is hemolysis associated with bacteria colonies cultured on
20
blood agar plates.
Hemolysis is a peculiar process caused by hemolysin, a group of proteins produced by certain microorganisms, causing the lysis (i.e. the dissolution) of the red blood cell membrane in the growth substrate. The ability to
25
identify the occurrence of this process is very important in order to classify known types of pathogens and, in some type of analysis, such as throat swab screening, is a very effective way of distinguishing positive samples. Moreover, the presence of hemolysis is also a factor of virulence for
30
Figure 1: Color distribution (RGB channels) along the colony axis (yellow line) in the cases of Alpha (Left), Beta (Middle) and Gamma (Right) hemolysis. The images are taken from back-lit plates.
microbiologists seek the presence of hemolysis by looking at back-lit plates.
Hemolysis can manifest itself in three different ways [2] (also depicted in Fig.1):
35
• Alpha (α) hemolysis: partial lysis of red blood cell membrane that visually produces a green or brown discoloration in the medium.
• Beta (β) hemolysis: associated with a complete lysis of red blood cells, it produces a lightened (yellowish)
40
and near transparent halo around the colony. • Gamma (γ) hemolysis: despite the apparently
con-tradictory term, this indicates the lack of hemoly-sis. There should be no reaction in the surround-ing medium so that the area near the margin of the
45
colony looks uniform and red (the color of the blood agar substrate).
The assessment of the presence of hemolysis has a signifi-cant impact in terms of the speed of presumptive identifi-cation of dangerous pathogens but does not involve trivial
50
visual tasks for the microbiologist. The difficulties faced are due to the fact that timely recognition may not be easy because of the mild effects of hemolysis, especially in its early stages. In fact, hemolysis produced by bacteria takes time to form, and so the sooner even the initial stages can
55
be recognized, the faster the diagnostic process will be, because it allows the identification on plates incubated for a shorter time.
The need to find automated solutions for the quan-titative assessment of bacteria growth (especially for the
60
tedious but diagnostically relevant counting of the number of Colony Forming Units CFU on a plate) is documented in surprisingly far-dated trials [3][4]. Despite the merit and intuitions of these pioneering works, the complexity and variety of pre-analytical procedures in CMLs have meant
65
that sample preparation and plate reading remained man-ual and exclusively carried out by skilled technicians and microbiologists until recently. Visual CMLs diagnostics us-ing computer vision/intelligence solutions is now strongly motivated by the ongoing rapid diffusion of Full
Labora-70
tory Automation (FLA) systems [5] which are expected to
change radically the working patterns of modern CMLs. FLA systems are able to process automatically hundreds to thousands of samples per day in standardized conditions and produce huge streams of digital images documenting
75
the bacterial growth from the seeded and incubated plates. This new digital revolution is establishing needs and new outlooks of advanced image analysis and understanding tools able to improve the speed of diagnostics and relia-bility of the widespread clinical procedures involving
(dig-80
itized) bacteria culture plates. As a reference FLA system for the creation of our experimental database (see Sec.2), we consider the WASPlabTM(Copan, Italy), which is able to record high definition plate images at different incu-bation times and in different lighting conditions, including
85
combinations of front-light and back-light, to produce nat-urally appearing images for specialist readings on diagnos-tic workstations. The hemolysis halo can vary greatly in terms of both color and dimension: the width of hemolysis that we want to isolate goes from 0.25 mm to 2.5 mm and
90
over. High spatial resolution images such as those gener-ated by the line scan system mounted on WASPlab enable the observation of phenomena which are barely visible to the naked eye and our objective is to identify hemolysis as early as possible.
95
There are two main technical achievements of our work: we designed a keypoint based solution to achieve the ro-bust, fast and accurate alignment of images acquired under widely different lighting conditions and displaying criti-cal aspects that make this task particularly challenging.
100
Based on this alignment we developed a joint dual-image classification of bacterial colony segments for the detec-tion and classificadetec-tion of even the subtle effects produced by hemolysis. This is a task that is often problematic even for the skilled specialist and for which we obtained fully
105
satisfactory results in different clinical scenarios (a near perfect recall on unseen images from clinical routine at the cost of an acceptable number of false positives).
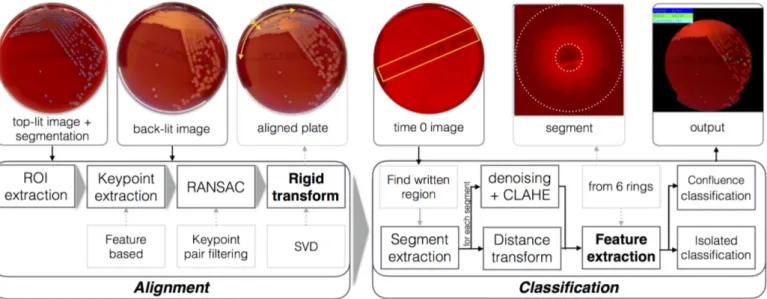
An overall scheme of the proposed system is presented in Fig.2. This is divided in two consecutive phases. The
110
first issue is related to the fact that the information rel-evant to the precise detection of hemolytic effects is dis-tributed over images taken with different illumination set-tings, so these images must first be finely spatially co-registered. This is mainly due to the fact that colony
bor-115
ders are clearly visible in front-light images (while they are blurred in back-light ones), whereas the hemolytic halo is only visible in back-light images. The alignment cannot be taken for granted in practice and, in our case, only a coarse alignment of the two kinds of image is in fact
120
initially provided. We exploit an automatically extracted feature-point based alignment procedure (see Sec.3) that, notwithstanding the high morphological and color hetero-geneity of the considered images, actually succeeds, in the large majority of cases, in achieving the desired alignment
125
result. Once the images are co-registered, we adopt a ma-chine learning approach based on specifically designed fea-ture evaluation and SVM classification (see Sec.4) to
de-Figure 2: General scheme of the proposed automated hemolysis identification system, comprising plate alignment (on the left) and classification phases (on the right).
tect and distinguish between the different types (Alpha, Beta or Gamma) of hemolysis on both single colony and
130
whole plate setups. The experimental tests, documented in Sec.6, were conducted on different clinically relevant scenarios and demonstrate the workability and high per-formance of our solution. Further considerations and a preliminary evaluation of the clinical impact of the
pro-135
posed method are given in Sec.7.
2. Dataset creation
Since the assessment of the effect of hemolysis requires the presence of red blood cells, here we only consider bac-teria cultures on blood agar plates. Blood agar is a generic
140
medium (i.e. it allows the growth of very different types of bacteria) and is one of the most commonly used in micro-biology analysis. It is cheaper than other more selective media but, on the other hand, it allows a greater vari-ety of morphology and concentration (load) in the
pro-145
duced growth. To meet the requirements of high reliabil-ity and robustness of the diagnostic process, a database of hemolytic and non-hemolytic colonies must be created that actually represents this variety, including many hemolysis examples of different shape, intensity and dimension.
Fail-150
ure to recognize hemolytic segments (i.e. false negatives) must not occur. With this in mind, we collected a dataset of 235 plates, produced by the inoculation on REMEL 5% sheep blood agar media of urine samples collected during routine lab screening tests. Images have been digitized by
155
means of WASPLab automation system which acquires, by linear scanning, 16-mega-pixel color images. These high spatial resolution images (0.0265 mm/pixel) are produced by moving the plate under a trilinear camera equipped with telecentric lenses. Different lighting settings can be
160
used according to laboratory practice. In our case, two different illumination modes were adopted for each plate:
a top-lit image, i.e. where the plate is illuminated from above, and a back-lit image, i.e. where the plate is illumi-nated from below, but still scanned from the top. With
165
the acquisition of the back-lit images, a moderate top-light component is present in order to allow better visual inter-pretation of these images (microbiologists are familiar with this type of illumination). As we will see, this also turns out to be useful for the fine plate alignment phase.
More-170
over, for each plate, we also have a time-0 image, acquired before the streaking that is used to normalize different acquisitions with respect to variations of the growing sub-strate. From the digitized plates, we were able to extract (after the segmentation described in [6]):
175
• 1946 countable colony segments, i.e. containing up to 5 colonies,
• 298 confluent growth segments, i.e. containing more than 5 colonies.
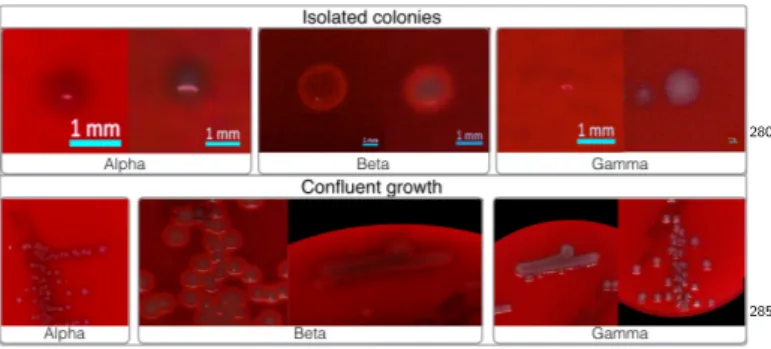
Some examples are shown in Fig.3. Approximately 6% of
180
the dataset is related to α–hemolysis, 17% to β–hemolysis, and the rest to γ–hemolysis (i.e. non-hemolytic) segments. These proportions reflect both the variability and the dis-tribution encountered in clinical practice. A GUI was cre-ated to facilitate the specialists in the labeling process and
185
to reduce interpretation errors as far as possible. In partic-ular, a first microbiologist assigned one of the three labels to each segment, along with an optional free text anno-tation (mainly used to remark doubtful cases), while a second expert specialist double-checked the label selection
190
and the annotations. In a third step, only the plates with residual uncertainties (about 5% of the total) were dis-cussed jointly and a shared decision was made. Residual disagreement or other difficulties did not arise from the interactions between the domain experts.
195
hemolysis, discarding uncertain cases. Metadata was cre-ated for each segment comprising a unique segment iden-tifier, its bounding box, the type of hemolysis it exhibits and possible annotations. This information is also linked
200
to the analyzed plate by means of an identifier and saved in json format for an easy dataset management.1
Since blood agar plates are widely employed in bacteri-ology labs worldwide and considering that sought pathogens are almost the same in many clinical contexts, our database
205
can be considered a good representation of the clinical in-terest even beyond urine tract infections screenings. This is discussed in Sec.7, where preliminar validation of the system on plates cultured from throat swab collection spec-imens is presented.
210
3. Fine plate alignment
As pointed out above, hemolysis is caused by a certain amount of toxins produced by micro-organisms. The ac-tion of these agents leads to an effect that is located in a ring virtually extending the colony margin. The
dimen-215
sions, intensity and shape of the produced halo may vary greatly, but the area of interest is always concentric in rela-tion to the colonies (and, more in general, to colony aggre-gates of the same strain) and of even thickness along their perimeter. Therefore, an accurate mask of segments is
re-220
quired, in order to analyze only the region where we could expect hemolysis, starting from the margin of the colony (aggregate). Moreover, since the hemolysis classification is independent from the colony appearance, we prefer to exclude the colonies themselves from the learning process,
225
because they could carry information confusing the classi-fier. Unfortunately, back-lit images are not really suitable for accurate colony boundary identification. This is due to the hemolysis effect itself and to the light filtered and scat-tered into the blood substrate that blurs and sometimes
230
masks the real border of the colonies. This happens in con-junction with the relatively high noise present in back-lit images, especially if we seek small colonies.
1The complete Hemolysis Dataset will be released for research use
on the website www.microbia.org.
Figure 3: Example of hemolytic segments included in the dataset taken from back-lit images. Here we modified the gamma and con-trast of these images to improve the visibility of the hemolytic re-gions.
A segmentation mask can be much more successfully extracted from the top-lit image, but to do so, we
ab-235
solutely need to find a robust method of accurately co-registering the two images. This is needed because even just a few pixels of misalignment worsen the performance of the classification in that this would lead to extracting features from incorrect positions; this is relevant since we
240
also want to identify very thin halos (in the order of few pixels). Unfortunately, the desired level of alignment can-not be taken for granted in general. In particular, me-chanical vibrations on the conveyor during the transporta-tion of the plates and small stop-and-start imperfectransporta-tions
245
of the scanning intervals cause image misalignments that are present on images of the same plate acquired using dif-ferent lighting. Although the WASPLab software provides barcode-based coarse image alignment, this is not accurate enough for our purposes.
250
To solve our fine alignment problem, we initially con-sidered different approaches. Information-theoretical tech-niques, like the one in [7][8], besides being quite slow, do not work in our scenario probably because the mutually informative visual portion that could be used for the
align-255
ment occupies only a tiny portion of the whole images. We then moved to considering feature-based methods, where the alignment is performed by finding distinctive keypoints in both images [9]. After keypoint location using saliency-based analysis (aka feature extraction), an associated
de-260
scription of the nearby region of each keypoint is computed (feature description). For image alignment applications, keypoint detection and description should allow candidate correspondence to be found between co-located keypoints in the images to be aligned. The feature extraction phase
265
should return a considerable number of keypoints whose location is robust to image variations such as different il-lumination and viewpoint. In our case, although top-lit and back-lit images seem to be too morphologically dif-ferent, the presence of a top-light component in back-lit
270
images, though subsidiary, actually creates the possibility of detecting common feature points on which to estimate reliably an image alignment transformation.
It is clear that, if we cannot extract at least two corre-sponding keypoint pairs, the problem of rigid
transforma-275
tion estimation does not have a unique solution, and all the following steps are compromised. On the contrary, in presence of multiple correspondences, we should be able to discard outliers and possibly skim less accurate corre-spondences for the estimation of a solution that minimizes
280
the overall keypoint alignment error. For this reason, the descriptors associated with co-located keypoint must be quite robust to image variations in order to promote easily recognizable correspondences. Another significant prob-lem is the relevant similarity of colonies of the same strain,
285
which is likely to generate fake correspondences. This re-quires a robust rigid transformation estimation with effec-tive outlier detection and rejection.
Fig.4 shows a diagram of the alignment stage with vi-sual examples of the functional blocks described below.
Figure 4: Fine alignment block pipeline. In input, there are the two images from the same plate with different illumination, in which we select the minimum number of regions that leads, at the end of the keypoint extraction, matching and filtering, to obtaining at least 30 keypoint pairs. Finally, we apply SVD to estimate the correct transformation.
3.1. Keypoint extraction
We considered many of the most popular feature ex-traction [10] and description tools [11],[12]. Comparative studies highlight the application-dependency of their per-formance [13],[14],[9]. We then conducted rapid testing
295
to select the most performing techniques in our context. Given the nature of the images of interest, the most appro-priate keypoint detection approaches here are those based on the analysis of a differential multiscale representation of the image, which allows the localized search of visually
300
interesting regions (blob detection) [9],[10]. With regard to keypoint descriptors, binary-valued descriptors [15] did not demonstrate robustness to the changes in image illu-mination and this is particularly evident for dark images. Moreover, since binary descriptors are usually paired with
305
corner detectors, they often fail to extract enough key-points in images, as in our case, where rounded shapes prevail.
Real-valued (image gradient based) methods [9] per-formed better because, in general, they find good matching
310
inside colonies. Indeed, the problem here is mostly that the bottom illumination, as well as causing a higher noise level, highlights effects, such as hemolysis, that visually change the margin of the colonies, introducing discrepan-cies in the keypoint description.
315
Therefore, we considered many suitable keypoint ex-traction and description approaches and selected the two we found to give best performance, which turned out to be SIFT [16] and KAZE [17][18]. Our pre-selection proved to be in line with studies that consider wide benchmark and
320
high resolution images [14].
SIFT features [16] are detected by finding local max-ima in a Difference of Gaussian (DoG) pyramid, generated from the image, which works as a blob detector. The SIFT descriptor is based on a Histogram of Oriented Gradients
325
(HOG). Rotation invariance is assessed by assigning the orientation derived from HOG to each keypoint, and then
rotating the descriptor according to the main direction. In contrast, the KAZE detector builds a nonlinear scale-space, where nonlinear diffusion filters are used instead of
330
Gaussian filters, in which important image details can be highlighted while removing noise [17]. The KAZE descrip-tor is an adaptation to the nonlinear scale-space of the M-SURF descriptor [19]. The rotation invariance is ob-tained in a similar way to SIFT and SURF, computing
335
the main orientation of the descriptor. 3.2. Keypoint matching
Once the keypoints have been derived from the two images, either with SIFT or KAZE, we need a matching system to test all the possible correspondences. Since the
340
descriptors should be invariant to rotation, translation and illumination, a common method is to adopt an exhaus-tive approach, trying all the possible matches to find the best one, typically relying on an L2 distance measure on
descriptors. As an alternative, we also tested a solution
345
based on FLANN (Fast Library for Approximate Nearest Neighbors) [20]. This approach is faster because it searches for an approximate nearest neighbor solution, although it may be slightly less accurate. However, many colonies on the plate can be very similar, and this is likely to
gener-350
ate many ambiguous correspondences. Therefore, starting from an ordered list of distances between each keypoint in the first image and all the keypoints in the other image, we introduce a method of retaining only matches that are far enough from the second closest one in each list (as also
355
suggested in [16]). Following appropriate tests, a distance ratio threshold of 0.7 was adopted for this correspondence selection. This turned out to be a good tradeoff between the intrinsic similarity between keypoints of interest and the need to have unambiguous matchings.
360
3.3. Keypoint pair filtering and alignment estimation The selected matches are used to estimate a mapping function that can be applied to the target image in order to
co-register it to the reference image. Since we are dealing only with possible rotation or shifting along the two axes of the plate due to mechanical vibration induced by the con-veyor during acquisition, the mapping function should be a 2D rigid transformation. Therefore, we must guarantee the preservation of distances between every pair of points and, to do that, we exploit the method described in [21] for rigid transformation estimation by means of least-square minimization over a singular value decomposition (SVD). In particular, we want to compute the optimal translation vector t and rotation matrix R that minimize:
n
X
i=0
k(Rpi+ t) − qik2 (1)
with P = {p0, p1, ..., pn} and Q = {q0, q1, ..., qn} the
two sets of corresponding keypoint from the target and reference image respectively. This leads to a transforma-tion that, if applied to the back-lit image, produces an
365
aligned version in relation to the top-lit image (note that det(R) = 1 because we want a rigid transformation).
Unfortunately, a good descriptor matching score is not guaranteed to be spatially correct. In our case, the high dissimilarity of the two acquisitions, in conjunction with
370
the morphological similarity that can exist inside colonies, is likely to lead to fake keypoint correspondences, and is exacerbated by the noise present in the back-lit im-age. Such outliers must be removed to avoid worsening the rigid transformation estimation. To address this
prob-375
lem, a solution based on the Random Sample Consensus (RANSAC) algorithm [22] can be adopted. This is an iter-ative resampling technique that generates good candidate solution that, in our case, corresponds to a vector of at least two matches.
380
A generic RANSAC iteration k works as follows: • Randomly select a subset of original keypoint pairs
(P(k), Q(k));
• Compute, using the SVD-based method, a rigid trans-form estimation (R(k), t(k)) using the previously se-385
lected keypoint pairs;
• Test all the remaining keypoint pairs (P \ P(k), Q \
Q(k)) against the computed model according to the
projection error e(k). If e(k)< T (where T is a
prede-fined threshold) the selected keypoint pairs are con-sidered inliers; e(k)= v u u t |P(k)| X i=0 pi(k)− (R(k)qi(k)+ t(k)) 2 (2) • k ← k + 1.
This is repeated until an iteration limit K is reached on k. Thanks to the low complexity of RANSAC, high values of K (order of hundreds) can be adopted without significantly
390
increase the computation time. Eventually, the SVD so-lution is recomputed with all the keypoint pairs found as inliers to find the final (R, t) transformation.
3.4. Random region selection speed-up
Since there are many steps in the analysis of each plate
395
image and laboratories (and thus FLA systems) are re-quired to handle as many as one thousand plates per day, the processing time becomes a critical parameter. Thus we are interested in reducing the time needed to estimate the (R, t) transformation as much as possible. The process can
400
be accelerated by making use of the relevant a-priori infor-mation we have: the colony segmentation mask. The seg-mentation mask components can be considered as regions of interest to localize the keypoint extraction. Therefore, we can start to extract features only from a small and
ran-405
domly chosen number of regions around colonies instead of working on the whole image.
Using keypoint-pair extraction as a central element, we implement a co-registration method that automatically se-lects the minimum number of keypoints in order to
accel-410
erate this phase, without any unwanted compromise in terms of robustness and precision of the results. This works by recursively adding regions until we reach at least 30 keypoint pairs before estimating the rigid transforma-tion. The choice of 30 correspondences represents a
cross-415
validated value: we empirically verified that the error de-creases exponentially in relation to valid keypoint pairs and, beyond that threshold, we have almost no improve-ment.
4. Hemolysis classification
420
Once the front- and back-lit images of the same plate are finely co-registered, we are ready to jointly exploit the information deriving from both of them. Observing a line passing through the center of the colony, it is immediately clear that there are quite different trends in the
trichro-425
matic pixel levels for the three types of hemolysis (Fig.1). This is, with good approximation, invariant with respect to the chosen angle, if we do not consider the light reflections on the colonies. In particular, observing the Alpha hemol-ysis case and focusing on the red component, we observe
430
a decreasing trend, from a background value, along the hemolysis halo, until the margin of the colony is reached. In the Beta case, we observe dual behavior, since the pix-els become brighter approaching the colony. Finally, in presence of Gamma hemolysis, the red color distribution
435
around the colony remains, as expected, in the range of the background value. These observations formed the starting point for the design of the automatic hemolysis classifica-tion system described in the following.
4.1. Preprocessing
440
Back-lit images are quite noisy and this can cause prob-lems, especially for the interpretation of very small colonies. For this reason, all the segments to be classified are pre-processed with a bi-lateral filter [23] for noise reduction. This guarantees edge-preserving filtering that is
compu-445
tationally fast and that works without any particular as-sumption. This way, the border of the colonies, especially
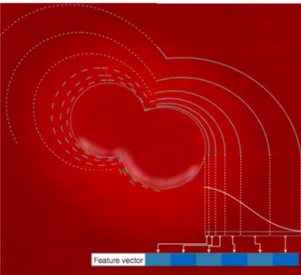
Figure 5: Feature extraction from six concentric rings.
the light sparkle, will not be faded, leaving the region around the colonies, from which we will extract relevant features, without unwanted components from the margins.
450
Moreover, this choice almost avoids altering the computa-tional load of the classification pipeline. Since the images have low contrast, and in order to highlight the hemol-ysis effect, we also apply Contrast Limited Equalization (CLAHE) [24] to the red channel only. CLAHE works
455
only on small regions in the image, enhancing the con-trast of each of them in an adaptive way. Adjacent re-gions are thus combined using bi-linear interpolation to get rid of the artificial boundaries created by equalizing each region in a different way. Since we apply only soft
460
equalization, this does not introduce any arbitrary varia-tion that could create difficulties for the learning phase. CLAHE limits amplification by clipping the histogram at a predefined value, thus it does not discard a peak in the histogram, but redistributes it among all the bins. The
465
parameters should be chosen cautiously because, as a side effect, CLAHE also amplifies noise and we clearly do not want to trade equalization for a problematic increase of noise. However, thanks to the application a soft equaliza-tion only, this problem does not occur.
470
4.2. Feature selection
The previously emphasized behavior of the three types of hemolysis prompts us to extract features from an area surrounding the colony segment margin, excluding the seg-ment itself (that does not carry information about
hemol-475
ysis), in a way that is invariant to the considered direction. In order to implement this idea, we first divide the area surrounding the colony (colony segment) into six con-centric rings (curves), as shown in Fig.5. These curves are created by setting thresholds for a distance transform computed from the margin of the colony segment. The thresholds are chosen to be initially close to the colonies and increasingly distant from each other while we become more distant from the colony segment boundary. From
each region we extract the mean value, the variance and also a color histogram with eight bins for each color chan-nel. This guarantees shape independence, making features robust to different types of colony segments. A Feature Vector FV is created by taking the difference of the mean and variance of consecutive regions Ri, and by
concate-nating them with the histograms: M = [Mic]i∈[1,...,6], c∈{R,G,B}
M1c= mean(R1)c
Mic= mean(Ri)c− mean(Ri+1)c, i 6= 1
V = [Vic]i∈[1,...,6], c∈{R,G,B}
V1c = var(R1)c
Vic = var(Ri)c− var(Ri+1)c, i 6= 1
H = [Hi(b,c)]i∈[1,...,6], b∈[1,...,8], c∈{R,G,B}
Hi(b,c)= ColHist(Ri)
FV = [M, V, H]
(3)
for a total feature dimension of 3108.
In order to make the classification as independent as possible from factors affecting the background color of the agar (different agar manufacturer, plate conservation
con-480
ditions, illumination variations, color calibration settings), we take advantage of time-0 images available from WAS-PLab (acquisitions of the plate just before streaking) by normalizing values extracted from each ring in relation to the background mean and variance values derived from
485
time-0 images. As we will verify, subtracting the mean from each value coming from the concentric rings and di-viding by the variance leads to a considerable increase in possibility of adapting our method to different plates and acquisition parameters.
490
4.3. Classification
Given the high number of FV components, dimen-sionality reduction is advisable prior to machine learning. Principal Component Analysis (PCA) [25] allows only the most significant vectors to be kept by projecting the
in-495
put data using Singular Value Decomposition, so that the maximal data variance (energy) is retained. Then, we clas-sified the reduced feature vectors using a Support Vector Machine (SVM) [26] approach with Radial Basis Function (RBF) kernel. In particular, to address our multi-class
500
classification problem, we used a one-against-one commit-tee, where three binary classifiers are trained to discrimi-nate between every possible couple of different classes, and a majority decision is taken.
Since there are appreciable visual differences between
505
isolated (countable) and confluent colony segments in the dataset, we keep these categories separated to achieve bet-ter results. Therefore, two independent classifier trainings are implemented accordingly. For each classifier, the re-lated dataset portion is split into a 70% training set and a
510
30% validation set. Cross-validation is performed on the 30% of the training set, then included for training with
the final model. Finally, a Recursive Feature Elimination (RFE) algorithm [27] is applied to select features by re-cursively considering smaller and smaller subsets: at first,
515
the training is performed with the initial set of features (retained PCA components); subsequently, RFE considers smaller and smaller feature sets by pruning features with the lowest weight. The weights correspond to the coeffi-cients used by SVM to make its prediction. This procedure
520
is repeated recursively on the pruned set, keeping only those coefficients that do not cause the (cross-validation) classification score to decrease.
Testing relies on the colony counting described in [6] to establish to which of two types a given segment belongs
525
and to select the proper classifier. 4.4. Written portion issues
Ad-hoc solutions may be required to deal with spe-cific issues that can arise depending on the plate man-ufacturer. This problem concerns the presence of written
530
portions printed by the manufacturer on the bottom of the plate (Fig.6). These writings are almost invisible in top-lit images but their shadow, blurred by the light scattering within the agar, is clearly visible with back-lit images. Any bacteria growing in this area, can prevent correct
hemoly-535
sis interpretation (especially in case of type α). Therefore, where present, these regions, should be excluded from the detection and interpretation of hemolysis on back-lit im-ages. The information printed on the plates is extremely important (type of agar, best-by date and plate
manufac-540
turer), but it would be advisable to have this data printed on the side, so as not to interfere with computer vision techniques. In our case, in order to estimate the portion of the plate where the classifier should refrain from tak-ing decisions, it is sufficient to adopt specifically tuned
545
adaptive thresholds for the time-0 back-lit images in rela-tion to the background reference level. We have estimated that 10% of the segments, on average, lie above the written area (with a worst-case of 67% in our dataset). Because the problem is structural and also affects human
interpre-550
tation, this is beyond what can be reasonably addressed here and calls for further discussion about plate manufac-turing processes in the digital microbiology imaging era.
5. Implementation
We provide2 a Python and Jupyter Notebook [28] im-555
plementation of the proposed software, divided into three esay-to-use notebooks that follow the presented pipeline.
First, the fine alignment software (Sec.3), which auto-matically takes care of the complete alignment process. In input, it needs the back- and top-lit images of the plate,
560
and the segmentation mask, and returns an aligned version
2All the notebooks, python code and the complete dataset (both
train and test) is attached as additional material and will be released for research use on the website www.microbia.org upon acceptance.
Figure 6: Output of the system with writing on the back (white dot-ted line) that masks bacterial growth and discarded colonies (green crosses).
and debug images to visualize how the method is work-ing. Then, the feature extraction and dimensionality re-duction, and an example of parameter selection in order to tune the SVM classification model. This script loads the
565
dataset and metadata in order to train an SVM classifier (Sec.4). Finally, the hemolysis detection pipeline, start-ing from the full plate dataset provided, comprehensive of annontations, counting and segmentation masks, gives the classification results as an overlay of the plate images.
570
6. Results
We provide experimental results on the proposed meth-ods of hemolysis identification and interpretation: the front-and back-lit image alignment (Sec.6.1), front-and the isolated and confluent segment classifiers (Sec.6.2). To evaluate
575
how well the proposed method generalizes to new images, we will also validate the whole pipeline on new clinical plates (coming from the same WASPLab equipment but taken at another time), including a discussion based on an exhaustive error analysis (Sec.6.3). Finally, a
computa-580
tional load breakdown and related observations are given in Sec.6.4.
6.1. Fine plate alignment
All the tests to evaluate the robustness and accuracy of our image alignment solution have been carried out
us-585
ing the images of the dataset described in Sec.2. Careful manual alignments of all the image pairs were produced by an expert technician and used as the benchmark for measuring the automatic alignment error. This is defined as the modulus of the maximum displacement error (with
590
reference to the segment centers) on the plate compared to the ground-truth position. In fact, we are not inter-ested in breaking down the rotation and shift error, but
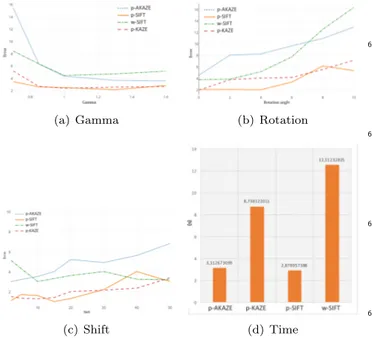
(a) Gamma (b) Rotation
(c) Shift (d) Time
Figure 7: Comparison of the error vector length versus the tested pa-rameters. For comparisons we consider the proposed methods com-posed by keypoint extraction from a subset of selected regions with the three tested algorithms: SIFT (p-SIFT), KAZE (p-KAZE) and AKAZE (p-AKAZE). To make a comparison we also plot the results obtained with SIFT-based keypoint extracted from the whole image (w-SIFT)
in evaluating the maximum displacement that they jointly produce on the plate.
595
Firstly, we observed that the use of FLANN, as an alternative to brute force feature matching, leads to only minor variations in both accuracy (<0.5% average error in-crease) and computational time (about 3% gain). This can be justified by the fact that we had already pre-selected of
600
good regions in which to search for keypoints (see Sec.3.4). However, since even small timing savings are relevant in lab-automation, and virtually no accuracy degradation was observed, we kept the FLANN option operating in our sys-tem.
605
Robustness and computational comparison. At first, we are interested in comparing the feature extraction methods selected in Sec.3.1, i.e. SIFT [16] and KAZE [17] (and its speed-up version AKAZE [18]), especially from a robust-ness point of view. To this end, we deliberately introduced
610
variations to our data by modulating the image contrast and by using a range of known rotations and translations of the reference alignments. In particular, gamma correction from 1/0.7 (darker) to 1/1.6 (lighter), artificial rotations up to 10 degrees and pixel shifts up to 50 pixels were used
615
on pre-aligned images of our dataset. Another important comparison we are interested in is execution time.
Fig.7 shows the results of the tested variations, in par-ticular p-SIFT, p-KAZE and p-AKAZE refer to the pro-posed pipeline, with region selection before the keypoint
620
extraction (see Sec.3.4). Instead, w-SIFT refers to SIFT descriptor extracted from the whole images, and it is used
as a reference. We play with gamma correction in order to evaluate robustness against images with different illu-mination and contrast. The results (see Fig.7a) highlights
625
the fact that both p-KAZE and p-SIFT respond almost in the same way, and that, with very dark images we get poor results: this leads us to apply a contrast enhancement to the images as a pre-processing phase, and this is why the pre-processing described in 4.1 is actually executed before
630
the alignment.
If we consider the problem of rotation (Fig.7b), we can see an expected error increase with the rotation an-gle, which is steeper for w-SIFT solution. In fact, the controlled extraction of keypoint from interest regions
sig-635
nificantly improves the performance, especially for large rotations lets focus the extraction on informative regions. On the other hand, p-AKAZE displays an error of about 6 pixels more than the other proposed methods almost anywhere.
640
We get good shift results (Fig.7c) with both SIFT and KAZE features with our pipeline. As was the case before, p-AKAZE performs worse when considering large shift val-ues. Finally, our method, given that it is focused on key-point extraction only in meaningful regions, is shown to
645
outperform significantly w-SIFT in terms of computational speed (Fig.7d). p-KAZE remains rather time-consuming and leads to approximately the same degree of error per-formance as p-SIFT. p-AKAZE is almost as fast as p-SIFT but with a definitely worse error performance. Thus, here
650
we choose to adopt SIFT feature extraction because it is the best compromise reached in terms of precision and speed. However, p-KAZE is another valid option if com-patible with application timing constraints.
Accuracy assessment. Here, we validate the selected
align-655
ment method against the real misalignments on the database images. To better evaluate the improvements, in Fig.8 we plot the histograms, with their probability density func-tions, in relation to the displacement error before (in light blue) and after (in green) the proposed fine alignment.
660
The residual misalignment is divided into three different classes of error, according to the length of the maximum displacement error vector (dashed line in Fig.8):
• Class I: perfect match; deviation is less than 0.13 mm (5 pixels), which is not significant in terms of
665
the subsequent classification.
• Class II: acceptable deviation; deviation is up to 0.40 mm (15 px), which can produce erroneous classifica-tion on smaller colonies.
• Class III: poor match; deviation up to 1.33 mm (50
670
px), the colonies are almost out of alignment and this is likely to generate hemolysis detection errors even on bigger colonies.
The fine alignment results can be considered very sat-isfactory, as shown in Fig.8 (green), since 98.1% of
align-675
Figure 8: Displacement error before and after the proposed method. Histogram height shows a density such that the area under the curve is unitary.
which is satisfactory considering the size of the smaller colonies where to detect hemolysis. Only 0.5% of the tested plates show a Class III deviation and 1.4% Class II. Furthermore, no plates exceed 1.33 mm deviation.
680
This method has proved to be surprisingly robust to images that display very marked differences due to com-plex unconventional effects, caused by the change in illu-mination. As far as we could observe, this achievement is not documented in other works.
685
6.2. Dataset segment classification
Here we present the results of the two different classi-fiers for the countable and confluent classes in our initial database (Sec.2). First, we consider the 2000 countable colony segments extracted from more than 500 clinical
690
plates. 20 PCA components are enough to retain 99% of the variance of the original 3108-dimension feature vec-tors. During the learning phase, model selection aimed at high recall, in order to minimize failure to detect hemoly-sis (false negatives). This comes at the price of some
ad-695
ditional, but less critical, false positives. The results are highly satisfactory with a precision of 98.1%, a recall of 98.5% and an accuracy of 98.1%. Looking at Fig.9,where we selected representative visual results of both correct and incorrect classifications, we can observe some
signifi-700
cant aspects. Alpha hemolysis displays high variety, cor-rectly classified but, if the region showing alpha hemolysis is too wide, with little contrast or very small, it is classified as Gamma. Almost the same happens in the case of Beta hemolysis. In the case of Gamma hemolysis, on the other
705
hand, if we are looking at a gamma colony close to a Beta hemolysis colony, we could wrongly classify the segment as Beta, due to the high sensitivity of the proposed solution. For confluent case, the dataset consists of 300 segments from the same 500 plates. 22 PCA components were
re-710
tained. The precision here is 88.6% with a recall of 87.5% and an accuracy of 87.5%. This, although significantly lower than the previous case, is due to the complexity of the task in crowded areas.
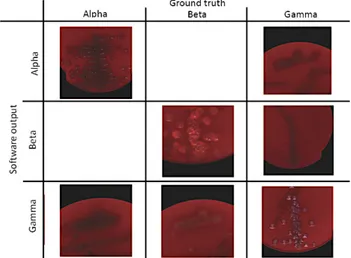
Figure 9: Some visual results of the isolated model in a confusion matrix-like grid.
Figure 10: Some visual results of the confluent model in a confusion matrix-like grid.
Fig.10 shows some examples of good and tricky
classi-715
fications. In particular, the difficulty of classifying hemol-ysis in confluent areas if the effect produced is too soft is a considerable problem. Other classification ambiguities can be due to color and texture mix-ups caused by too many neighboring colonies surrounding the target colony
720
or aggregate.
In conclusion, the proposed method can assess the prob-lem of hemolysis classification on all segment types, with more criticism for the confluent case. This allows us to produce a classification of the whole plate, which is very
725
important from a clinical point of view, as we discuss in Sec. 7.2.
6.3. System validation and error analysis
Aiming at validating the system for the main target clinical scenario, we run our complete analysis and
classi-730
fication pipeline over another set of 350 unseen plates, for a total of 1743 segments (including both countable and con-fluent). As was the case for the dataset discussed in Sec.2,
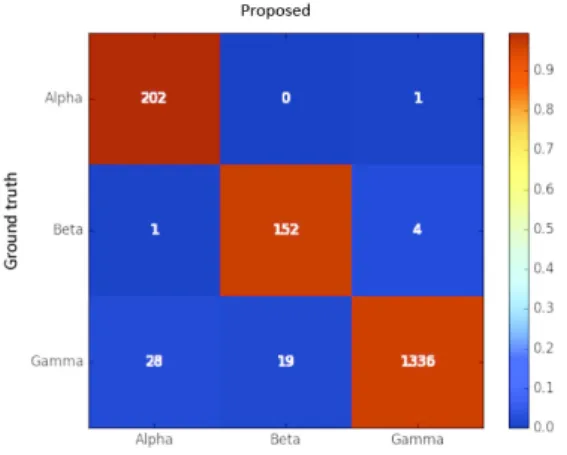
Figure 11: Confusion matrix of the hemolysis classification pipeline, using the validation dataset.
Table 1: Erroneous classification distribution.
Alignment Confluence Near border Other
48% 25% 18% 10%
they were digitized with WASPlab, randomly selected and collected in anonymized form, from the microbiology lab
735
screening routine, but at different time. Looking at the confusion matrix of Fig.11, we can see that only 5 seg-ments with hemolysis are not recognized (0.3% false neg-atives). Moreover, if we look at the overall plate results, there is no hemolytic plate (plates in which there is at least
740
one alpha or beta hemolysis colony) where our algorithm failed to identify at least one segment as hemolytic. On the other hand, there are nearly 2.75% false positives. Pre-cision however, considering the strict recall requirements, reaches 88.3% (See Fig.12) with a recall of 98.6%.
745
Now we perform more detailed error analysis consider-ing the whole image processconsider-ing pipeline, where a classifi-cation of the error causes has been conducted and shown in Table 1.
Even though, as shown, the proposed co-registration
750
method is quite robust, about half of the errors are due to residual misalignments. In fact, especially for smaller colonies, even a very small error could potentially produce a incorrect classification. There are two main effects of residual misalignment that can generate classification
er-755
Figure 12: Result comparison on the analyzed setups: isolated, con-fluent and both segments on the test-set; blind test (on both kinds of segments) from a real clinical scenario.
rors. The first, mainly responsible for false positives, is when the residual displacement is smaller than the ment dimension. In this case, slices of the interior seg-ment are misplaced onto the supposed halo region where discrimination features are computed. For certain types
760
of bright colored colonies, such as Staphilococcus aureus, this can cause β-hemolysis misclassifications, whilst for dull-colored ones, such as Streptococcus agaliactiae, this could produce α-hemolysis errors. If, on the other hand, the residual displacement is comparable or superior to the
765
segment dimension, the discrimination region erroneously falls over the background area and thus it is identified as γ-hemolytic, possibly causing false negatives.
Colony growth could lead to project shadows onto other colonies, especially near a confluent area. In this case,
770
shadows produce an effect similar to that caused by the α-hemolysis. Another type of error leading to similar ef-fects is due to a particular kind of diffuse covering growth, called swarming, which can occur with certain kinds of bacteria (e.g. some E. coli serovars). Both effects cause
775
darkened areas possibly leading to misclassifying γ- as α-hemolysis (false positive), while usually the result is not affected in presence of β-hemolysis. Together, these effects cause 30-35% of errors. There is also a portion of errors determined by glare near the border of the plate, or by the
780
high noise present when evaluating very small colonies, ac-counting for another 20-25% of errors (again likely to be false positives). Finally, we have errors due to very noisy regions and micro-colonies or doubtful cases that account for the last 10%.
785
6.4. Computational Aspects
Finally, in Fig.13, we present the timings of the pro-posed solution for all the described blocks. The alignment is definitely the more time consuming part, while the clas-sification phase is very fast. In particular, while many
al-790
gorithmic parts were taken from optimized C++ libraries or were easy to optimize, the region selection is imple-mented in Phyton and it is the only part working on the whole high-resolution image. For alignment, the majority (> 90%) of the computation time is taken up by the SIFT
795
OpenCV implementation.
Figure 13: Computational speed of all the proposed stages. Based on a Python implementation running on an Intel i7 6700k CPU.
7. Discussion
The relevance of the proposed method and of the ob-tained results is twofold. On the one hand, this study is one among the first in the context of Digital Microbiology
800
Imaging (DMI) and related to the emerging field of Full Laboratory Automation systems. On the other hand, it can be considered with a view to the clinical applications on which it may have most impact.
7.1. Hemolysis identification in a FLA context
805
Few recent studies have already demonstrated the op-portunities of modern image understanding for CML tasks, especially in the DMI context of modern FLA systems [6, 29, 30]. In [6] the problem of bacteria colony counting is addressed using a Deep Learning approach. The
com-810
plex task of bacteria species identification has been first approached in [29] with a modular divide et impera solu-tion, where a chain of supervised classification stages solves different nested tasks, leading progressively to the target identification problem. Another processing and
classifica-815
tion chain has been proposed in [30] for the classification of major urinary infections. Other works approach bacte-ria identification using hyperspectral datasets [31, 32, 33] or forward-scattering techniques [34, 35]. All the above works concentrate on bacterial colonies without
consider-820
ing their possible interactions with the growing medium, while here we address for the first time the problem of automated hemolysis analysis, which involves the interac-tion between growing pathogens and blood agar which is of high diagnostic significance. Moreover, differently from
825
other works, we also exploit a combination of plate illumi-nations targeting both detection and classification issues. The complexity of the task and the necessary sensitivity crucially require a timely and accurate support for the clin-ical diagnosis. With the proposed system, despite some
830
errors, the accuracy results are already highly satisfactory as well as being produced at a speed compatible to the analysis and FLA workflow. The nature and causes of er-rors have been analyzed and specific solutions should be studied for them in future works.
835
7.2. Clinical impact and throat swab screening scenario It is important to point out that hemolysis is associ-ated with bacterial strain (serovar) that must be carefully brought to the attention of the clinical microbiologist be-cause of its intrinsic virulence and the fact that it is
pro-840
duced by pathogens of utmost importance like Strepto-cocci Groups A, C and G. In general, the more virulence factors a strain expresses, the more severe the infection that it causes. This is why the proposed solution is el-igible to be used in combination with other rapid
diag-845
nostic tools, resulting in a valuable complementary tool. For instance, mass spectrometry Maldi-TOF [36], which is nowadays the gold standard for the rapid identification of bacteria, cannot distinguish between serovars of bacterial
species or hemolytic production. Thus, with our
comple-850
mentary analysis, we can automatically produce a relevant diagnostic factor for the timely assessment of the virulence of certain bacterial strains and ultimately save valuable time in the identification of the correct antibiotic ther-apy for the patient. A significant impact of the proposed
855
solution can be in the screening of throat swabs. The im-portance of investigating throat swab specimens cultured on blood agar plates is related to the fact that seeking the presence of β-hemolysis is the gold standard for the identification of Streptococci, which are the most common
860
causes of bacterial pharyngitis [37]. Throat swab culture is a very widespread test for the diagnosis of bacterial throat infections [38]. These infections can be very aggressive and must be identified without errors, because they can re-sult in a number of conditions, from strep throat to
pneu-865
monia or tonsillitis, or even meningitis. If, for instance, Group A streptococcal bacteria appear (in most of the cases Streptococcus pyogenes), the individual is probably affected by strep throat. Meningitis could be caused by Neisseria meningitidis and Candida albicans, a fungus
re-870
sponsible for mouth and tongue infections. Streptococcal bacteria are very contagious: they can be spread through airborne droplets and, an infected person can easily pass the bacteria on, through coughing, sneezing, sharing food or drinks. With screening, we refer to a medical protocol
875
used to identify infections in a supposedly healthy popula-tion, that is before any signs or symptoms appear. This is a very important method used in sensitive environments, like hospitals, to guarantee prompt intervention and man-agement. In order to avoid over-diagnosis, a test used in a
880
screening program must have good sensitivity in addition to acceptable specificity, especially for a disease with low incidence.
Here we want to assess primarily the capabilities of the proposed system to be properly applied in this scenario,
885
where main interest is focused on β-hemolysis detection. The substrate and the method of analysis are the same as the ones described for UTIs, so we use the same pro-posed and trained classification pipeline that we exploited for the core part of this work. Therefore, this different
890
clinical setting has the dual advantage of being a relevant generalization test bed and of representing a highly rele-vant case study.
Since, in this context, the outcome is binary (positive, neg-ative), with a positive result for even just one β-hemolitic
895
colony, we analyzed the whole set of segments of a plate with an ensemble block that takes as input the identifi-cation performed respectively by the two different classi-fiers (on countable and confluent segments), divided by the number of colonies present in a segment. Therefore,
900
we stack the prediction made by the countable classifier in 5 bins, according to the number of colonies in the seg-ment (from 1 to 5), and in 5 bins also for the confluent classifier, again according to the estimated counting (from 6 to 10) and where the 10th bin also includes segments
905
Figure 14: Confusion matrix of hemolysis identification in a screening scenario.
decision tree classifier trained on 100 plates which is tuned so as to maintain the recall as high as possible with the aim of reliably increase the precision. The performance analysis is based on an experimental dataset obtained in
910
standardized laboratory conditions, for the task of throat swab screening, and is carried out by selecting 200 plates featuring usual throat flora and pathogens. The obtained results are already promising as shown see in Fig.14: false negative plates are only 1%, with a precision of 75% and a
915
recall of 96%. In a screening scenario like this, the achieved precision is valuable for creating priority lists or for an au-tomatic discarding policy that leads to a load reduction for the laboratory technician. Moreover, there is still room for improving these results, especially by adopting more
pow-920
erful ensemble learning approaches and by targeting false positive reduction. Many erroneous cases are plates with soft β-hemolysis and a light background, presenting a con-fluent grown region with a lot of noise, while plates that feature well-formed hemolysis on many segments are never
925
missed.
8. Conclusion
In this study, we presented technical solutions for auto-matic hemolysis detection and classification on blood agar plates. This had never been addressed before, nor had it
930
been associated with freely taken images nor with respect to the huge stream of images generated by the newest FLA systems. The main achievements are the robust dual-light image alignment and the hemolysis classification modules. The former addresses a very challenging problem, due to
935
the difference in terms of illumination and appearance be-tween the images to be aligned, with very good results both in terms of timing and, mostly, reliability. In partic-ular, we achieved perfect matching in more than 98% of the tested images, with the worst case featuring an error of
940
less than 1.33 mm. The hemolysis was classified for every colony segment, achieving good recall results, though at the cost of a certain number of false positives. We reached
a precision of 88% and a recall of 98% using unseen im-ages. Possible causes of error were investigated and, in
945
particular, we found that alignment errors are indeed the most frequent cause of misclassification. A problem with written portions under the plate can also lead to the loss of important hemolytic colonies. We only partially trakle this aspect by detecting the printed area and avoiding making
950
any decision on it. Being related to plate manufacturing processes, we recommend manufacturers solve the prob-lem by producing plates with written parts located in less crucial regions (like the plate border) in order prevent ob-struction of image analysis and understanding techniques.
955
We also tested our hemolysis classification tool to a rel-evant clinical microbiology screening scenario, where the ability to identify β−hemolysis is fundamental for the di-agnosis. To this end, we used the segment-based infor-mation of hemolysis to suggest β−hemolytic plates. The
960
ultimate goal here is to accelerate and simplify throat swab screening and to reduce the turnaround time for the iden-tification of the best antibiotic therapy, allowing no stone to be left unturned in the use of all the information present on the culture plate. Promising results have been obtained
965
in this generalization scenario strictly relating to our core technology.
Acknowledgments
This work was partially supported by the Italian Min-istry of Education, Universities and Research (MIUR)
un-970
der the Smart Factory Cluster initiative, Adaptive Man-ufacturing Project: CTN01 00163 216730. The authors would also like to express their sincere thanks to the sci-entific and technical staff of Copan SpA (Brescia, Italy) for their essential support in providing anonymized material
975
for the creation of the image database. A special thanks to dr. Pietro Casella for his valuable clinical support.
References
[1] K. C. James Jorgensen, Michael Pfaller, Manual of Clinical Mi-crobiology, Eleventh Edition, ASM Press, 2015.
980
[2] S. Hogg, Essential microbiology, John Wiley & Sons, 2013. [3] H. Mansberg, et al., Automatic particle and bacterial colony
counter., American Association for the Advancement of Science. Science 126 (1957) 823–7.
[4] H. E. Kubitschek, Electronic counting and sizing of bacteria,
985
Nature 182 (4630) (1958) 234–235.
[5] C. Doern, M. Holfelder, Automation and design of the clinical microbiology laboratory, Manual of Clinical Microbiology, 2015. [6] A. Ferrari, S. Lombardi, A. Signoroni, Bacterial colony count-ing with convolutional neural networks in digital microbiology
990
imaging, Pattern Recognition 61 (2017) 629–640.
[7] P. Viola, W. M. Wells III, Alignment by maximization of mutual information, International Journal of Computer Vision 24 (2) (1997) 137–154.
[8] J. P. Pluim, J. A. Maintz, M. A. Viergever,
Mutual-information-995
based registration of medical images: a survey, IEEE Transac-tions on Medical Imaging 22 (8) (2003) 986–1004.
[9] M. Hassaballah, A. A. Abdelmgeid, H. A. Alshazly, Image Fea-tures Detection, Description and Matching, Springer Interna-tional Publishing, 2016, pp. 11–45.
[10] Y. Li, S. Wang, Q. Tian, X. Ding, A survey of recent advances in visual feature detection, Neurocomputing 149, Part B (2015) 736 – 751.
[11] K. Mikolajczyk, C. Schmid, A performance evaluation of local descriptors, IEEE Transactions on Pattern Analysis and
Ma-1005
chine Intelligence 27 (10).
[12] M. H. Lee, M. Cho, I. K. Park, Feature description using local neighborhoods, Pattern Recognition Letters 68, Part 1 (2015) 76 – 82.
[13] D. Mukherjee, Q. M. Jonathan Wu, G. Wang, A comparative
1010
experimental study of image feature detectors and descriptors, Machine Vision and Applications 26 (4) (2015) 443–466. [14] K. Cordes, L. Grundmann, J. Ostermann, Feature
evalua-tion with high-resoluevalua-tion images, in: G. Azzopardi, N. Petkov (Eds.), Computer Analysis of Images and Patterns, CAIP 2015,
1015
Springer International Publishing, 2015, pp. 374–386.
[15] J. Heinly, E. Dunn, J.-M. Frahm, Comparative evaluation of binary features, in: Computer Vision – ECCV 2012: 12th Euro-pean Conference on Computer Vision, Florence, Italy, October 7-13, 2012, Proceedings, Part II, Springer Berlin Heidelberg,
1020
Berlin, Heidelberg, 2012, pp. 759–773.
[16] D. G. Lowe, Distinctive image features from scale-invariant key-points, International journal of computer vision 60 (2) (2004) 91–110.
[17] P. F. Alcantarilla, A. Bartoli, A. J. Davison, Kaze features, in:
1025
European Conference on Computer Vision, Springer, 2012, pp. 214–227.
[18] P. F. Alcantarilla, T. Solutions, Fast explicit diffusion for ac-celerated features in nonlinear scale spaces, IEEE Trans. Patt. Anal. Mach. Intell 34 (7) (2011) 1281–1298.
1030
[19] M. Agrawal, K. Konolige, M. R. Blas, Censure: Center sur-round extremas for realtime feature detection and matching, in: D. Forsyth, P. Torr, A. Zisserman (Eds.), Computer Vision – ECCV 2008: 10th European Conference on Computer Vision, Springer Berlin Heidelberg, 2008, pp. 102–115.
1035
[20] M. Muja, D. G. Lowe, Fast approximate nearest neighbors with automatic algorithm configuration., VISAPP (1) 2 (331-340) (2009) 2.
[21] M. R. Sorkine Olga, Least-squares rigid motion using SVD, Technical notes, Department of Computer Science, ETH Zurich
1040
(2016).
[22] M. A. Fischler, R. C. Bolles, Random sample consensus: a paradigm for model fitting with applications to image analy-sis and automated cartography, Communications of the ACM 24 (6) (1981) 381–395.
1045
[23] C. Tomasi, R. Manduchi, Bilateral filtering for gray and color images, in: Computer Vision, 1998. Sixth International Confer-ence on, IEEE, 1998, pp. 839–846.
[24] A. M. Reza, Realization of the contrast limited adaptive his-togram equalization (clahe) for real-time image enhancement,
1050
Journal of VLSI signal processing systems for signal, image and video technology 38 (1) (2004) 35–44.
[25] I. Jolliffe, Principal component analysis, Wiley Online Library, 2002.
[26] C. Cortes, V. Vapnik, Support-vector networks, Machine
learn-1055
ing 20 (3) (1995) 273–297.
[27] I. Guyon, J. Weston, S. Barnhill, V. Vapnik, Gene selection for cancer classification using support vector machines, Machine learning 46 (1-3) (2002) 389–422.
[28] H. Shen, Interactive notebooks: Sharing the code, Nature
1060
515 (7525) (2014) 151.
[29] A. Ferrari, A. Signoroni, Multistage classification for bacterial colonies recognition on solid agar images, in: 2014 IEEE Inter-national Conference on Imaging Systems and Techniques (IST) Proceedings, IEEE, 2014, pp. 101–106.
1065
[30] P. Andreini, S. Bonechi, M. Bianchini, A. Garzelli, A. Mecocci, Automatic image classification for the urinoculture, Computers in Biology and Medicine 70 (2015) 12–22.
[31] G. Turra, N. Conti, A. Signoroni, Hyperspectral image acqui-sition and analysis of cultured bacteria for the discrimination
1070
of urinary tract infections, in: 2015 37th Annual International
Conference of the IEEE Engineering in Medicine and Biology Society (EMBC), IEEE, 2015, pp. 759–762.
[32] S. Arrigoni, G. Turra, A. Signoroni, Hyperspectral image anal-ysis for rapid and accurate discrimination of bacterial
infec-1075
tions: A benchmark study, Computers in Biology and Medicine 88 (Supplement C) (2017) 60 – 71.
[33] D. F. Leroux, R. Midahuen, G. Perrin, J. Pescatore, P. Imbaud, Hyperspectral imaging applied to microbial categorization in an automated microbiology workflow, in: Proc. SPIE (vol.9537),
1080
2015, pp. 953726(1–9).
[34] U. Minoni, A. Signoroni, G. Nassini, On the application of op-tical forward-scattering to bacterial identification in an auto-mated clinical analysis perspective, Biosensors and Bioelectron-ics 68 (2015) 536–543.
1085
[35] W. M. Ahmed, B. Bayraktar, A. K. Bhunia, E. D. Hirleman, J. P. Robinson, B. Rajwa, Classification of bacterial contamina-tion using image processing and distributed computing, IEEE Journal of Biomedical and Health Informatics 17 (1) (2013) 232– 239.
1090
[36] E. Carbonnelle, C. Mesquita, E. Bille, N. Day, B. Dauphin, J.-L. Beretti, A. Ferroni, J.-L. Gutmann, X. Nassif, Maldi-tof mass spectrometry tools for bacterial identification in clinical micro-biology laboratory, Clinical biochemistry 44 (1) (2011) 104–109. [37] UK standards for microbiology investigations, investigation of
1095
throat related specimen, Standards Unit (9).
[38] D. Mertz, R. Frei, B. Jaussi, A. Tietz, C. Stebler, U. Fl¨uckiger, A. F. Widmer, Throat swabs are necessary to reliably detect carriers of staphylococcus aureus, Clinical Infectious Diseases 45 (4) (2007) 475–477.