Scuola Dottorale in Economia e Metodi Quantitativi
Dottorato in Economia dell’Ambiente e dello Sviluppo
Ciclo XXVI
"Three Essays in Energy Efficiency Innovation"
Dottorando: Alessandro Palma
Comitato di Tesi: Prof.ssa Valeria Costantini (Primo Relatore) Dott. Francesco Crespi (Secondo relatore) Prof. Anil Markandya (Relatore esterno)
1
PhD Thesis
by
Alessandro Palma
"Three Essays in Energy Efficiency Innovation"
ESSAY I
Mapping innovation systems through patent analysis.
The case of technologies for energy efficiency in the residential sector.
2
Mapping innovation systems through patent analysis.
The case of technologies for energy efficiency in the
residential sector.
Alessandro Palma, Departiment of Economics, Roma Tre University
Abstract
This work is an attempt to shed some light in the poorly explored field of residential energy efficiency technologies. Recent efforts by advanced economies, and especially European Union, are directed towards enhancing energy efficiency performances in all economic fields. Although attempts for mapping green technologies have intensified recently, the specific field of energy efficiency in electrical appliances for the residential sector mostly remains uncovered. In order to overcome this problem, in this work an ad
hoc classification method based on a combination of semantic and class-based search has
been developed. By using Boolean operators, specific search strings were used for searching patent applications, following a multi-level top-down approach applied to European Patent Office applications. Patent collection has been also integrated with the new Cooperative Patent Classification in energy efficiency technologies. Interesting trends in terms of distribution across countries and technologies emerge from the dynamics of such patents. Further specific investigation upon the drivers of such patterns should help policy makers in designing proactive support tools fostering innovation and efficiency for achieving the challenging environmental goals envisaged by the international agenda.
3 1. Introduction
There is overwhelming consensus among economists on retaining technological change a key driver in increasing resource efficiency. Such a broad agreement is shared by policy-makers who consider energy efficiency (EE) as a crucial economic and environmental long-run objective.
As clearly emphasized by the European Union (EU) and the International Energy Agency (IEA), EE represents one of the most effective mean for achieving several goals, as increasing energy security, fostering international cost competitiveness, and reducing polluting emissions (EC, 2011, 2012, 2013; IEA, 2010, 2012). In particular, achieving a more secure, sustainable and affordable energy system is a key challenge for the future world development.
Although the mitigating effect of the recent economic and financial crisis, the growth of energy demand, the alarming trend of greenhouse gas (GHG) emissions, the high volatility of fossil fuel prices, the increased concerns over the security and availability of oil and gas supplies, appear to be continuous and represent threats that must be resolutely addressed to reach a long-lasting sustainable growth. As a concrete example, the EU climate and energy package (the so-called 20-20-20 strategy) explicitly asks for Member States to reach a 20% improvement in the EU’s EE by 2020, independently from international environmental agreements.
The role of EE in reducing final energy consumption and CO2 related emissions has been generally significant, strongly limiting final energy consumption for the richest OECD countries (IEA, 2009). In particular, it has been estimated that the overall improvement in EE in the EU countries was around 1.3% per year between 1990 and 2010, translating in a gain of 11% in energy consumption, while in the US the annual EE improvements was even higher (1.5%), leading to a gain of 22% in the same period (IEA, 2012).Moreover, it is worth noting that EE trends over the past decades are extremely divergent across countries and sectors, where the residential sector seems to provide the highest potential for achieving energy saving and CO2 emissions reduction goals.
A clear specification of the jargon is here necessary, since energy saving and EE are not completely overlapping terms. To this purpose, it is important to conceptualize energy as an input into the production of desired energy services (e.g., heating, lighting, motion, etc.), rather than as an end itself (Gillingham et al., 2009; Linares and Labandeira, 2010). Indeed, EE is a sub-set of the energy saving (or energy conservation) domain. This latter is a broader concept since energy saving can be achieved by increasing the EE or by reducing the level of economic activity which may also reflect a change in consumers’ behaviour. EE on the other hand, is the relationship between the produced output and the energy consumed to produce it, often called energy services. Precisely, EE can be defined as the ratio of useful outputs to energy inputs for a system. The underlying system may be an individual energy conversion device (e.g., a boiler), a building, an industrial process, a firm, a sector or an entire economy. Thus, a general characteristic of EE is the use of less energy inputs for an equivalent (or even augmented) level of economic activity or service. In other words, gains in EE can raise the level of energy services, reduce the level of energy inputs or produce both effects.
Given this definition, achieving higher EE performance intrinsically relies on technological innovation as a mean for improving productivity of the energy input. In this respect, the present study takes advantage of the increasing attention devoted to the analysis of eco-innovation by the international scientific community, which is focusing on a growing number of technological domains, and it is performing more and more accurate statistical and economic analyses (Arundel and Kemp, 2011; Berkhout, 2011; Borghesi et al., 2013; Horbach et al., 2012; Kemp and Oltra, 2011; Markard et al., 2012; OECD, 2011).
Although huge research efforts in defining and measuring innovation patterns in green technologies, several fields still remain uncovered. In order to partially fill this gap, the aim of this paper is to map technological
4
innovation for EE in the residential sector for electrical appliances, by providing an original ad hoc classification method for gathering information on patent data. As a matter of fact, although the recent attempts made by both the World Intellectual Property Organization (WIPO) and the European Patent Office (EPO)1 for developing classification systems able to map “green technologies”, the specific domain of residential EE remains partially uncovered, while a classification system for electrical appliances is coming to light only recently. One difficulty for mapping patents in the EE sector is due to the fact that this latter rarely constitutes the final aim of a patent, but it is the result of one or several innovative contents of the patent itself, which may also be not explicitly mentioned in the main search text fields (title, abstract and claims). This makes EE a latent technological domain.
Given this particular characteristic, we try to solve this issue using Boolean operators. Specific search strings are used for searching patent applications, following a multi-level top-down approach, thus providing a list of classes and keywords able to describe in a comprehensive way all operators and technologies currently belonging to the field of EE in electrical appliances.
The rest of the paper is structured as follows. Section 2 provides a description of energy consumption trends over the past decades for selected advanced economies highlighting divergences across sectors in gaining stable efficiency standards, and then focusing on the residential sector. Section 3 lays out the methodology adopted for building a dataset containing patents related to the specific domain of EE in four domestic electrical appliances. Section 4 describes technological innovation patterns in such field by relying on patent data for main international players. Section 5 concludes.
2. Energy efficiency trends and technological options for the residential sector
As highlighted by the European Commission, EE is one of the central objectives for achieving long-term energy and climate goals (EC, 2010). By looking at energy consumption projections for the next decades, within the end-use sectors, EE measures need to play the biggest role in the next twenty years and they are supposed to contribute for the largest part of CO2 emissions reduction (IEA, 2012). In particular, end-use electricity efficiency alone is projected to contribute for 6% in Europe and 8 % in the US in reducing CO2 emissions reduction. In light of this, further decoupling of energy use from economic growth is required.
With respect to the other energy commodities, electricity use grew rapidly in OECD countries, largely because of the increased penetration of many different appliances affecting the demand for energy, which appears to be continuously increasing in the residential sector (IEA, 2009). Besides the population growth, this is due to the fact that modern lifestyle depends heavily on the availability of devices, systems and equipment fuelled by electricity but, at the same time, the use of residential appliances and equipment contributes significantly to raise the level of GHG emissions due to their marginal but strongly pervasive effect.
The reduction of the overall residential energy demand is a function of the level of EE, which in turns depends on the availability and adoption of new energy-efficient technologies and their dynamics. Regarding this, the average time of technology turnover is a key indicator for increasing the level of EE, and it depends on the duration of equipment and infrastructures and strongly differs among them. According to IEA (2010), the technology turnover can vary from 40-120 years for a building, 10-30 years for heating and cooling devices to few months for the lighting sector. Furthermore, the availability and diffusion of EE technologies as well as the rate of turnover may also differ among countries.
Among the wide range of technologies related to EE in the residential sector, the specific domain of domestic electrical appliances is extremely interesting from several points of view. The rapid growth of electrical
1
5
appliances (electronic devices in particular) is correlated to the growth of information and communication technologies (ICTs) and consumer electronics, so that in 2009 these products accounted for 15% of global residential electricity consumption and this share is projected to increase over time. According to IEA (2009), their diffusion has partially offset the gains achieved in EE with traditional electrical appliances (freezers, refrigerators, washing machines, etc.).
Relevant patterns can be grasped by looking at technology adoption curves here built for EU at 15 members where punctual data on the diffusion of EE technologies are available (Enerdata, 2012),for the electrical appliances taken into account (fridges and refrigerators, dishwashers and washing machines). From Figure 1it is worth noting that in 2010 the most advanced EE standard for refrigerators labelled as A++ class, which is supposed to incorporate the best available technology, has not achieved yet the turning point. More generally, in this sample of countries the average rate of technology adoption of new electrical appliances labelled as Class A, A+ and A++, hence embodying new EE technologies, has been particularly fast over the last 20 years, with an average rate of diffusion of 3.3% per year.
Fig.1 – EU15 technology adoption curves for large electrical appliances (1990-2010)
Source: own elaborations on Enerdata (2012)
According to this evidence, the key role of technology development in the field of domestic electrical appliances strongly requires a deep analysis, in order to better understand existing dynamics and to provide to policy makers information for selecting and implementing the right regulatory instruments in the next future.
3. Measuring innovation in energy efficiency
3.1. Patents vs. other innovation measures
There are a number of possibilities for measuring innovation activities. As most economic variables, the problem of measurement is directly related to the availability and the quality of specific data. After several years, the international scientific community seems to have achieved a reasonable level of data standardization and
0% 25% 50% 75% 100% 1990 1991 1992 1993 1994 1995 1996 1997 1998 1999 2000 2001 2002 2003 2004 2005 2006 2007 2008 2009 2010 Class A dishwashers Class A washing machines Class A indep. freezers Class A+, A++ refrigerators Class A refrigerators
6
reliability, even though the methodologies of analysis and related results are continuously in progress, leading to different metrics and interpretations of innovation performances (Archibugi and Pianta, 1996; OECD, 2005; Sirilli, 1997).
The most used innovation input and output indicators have been subject to much criticism (Sirilli, 1997)2. On the one hand, the growing literature on innovation indicators has shown that the resources devoted to research and development (R&D) represent only one source of innovation and that other innovation inputs might be relevant but are not easily measurable. On the other hand, patents have been shown to be imperfect indicators of the inventive activity: the level of information they can supply to researchers strongly depends on some important limitations (see, among all, Griliches, 1998). The first limitation is that patents are only one of the different mechanisms for protecting innovations, along with lead time, industrial secrecy or purposefully complex specifications (Frietsch and Schmoch, 2006). Indeed, the patenting behaviour can be different among firms. In particular, inventors may prefer secrecy to prevent public disclosure of the invention imposed by patent law, or to save the significant fees attached to patent filing (Archibugi and Pianta, 1996; Jaffe and Trajtemberg, 2004). Moreover, the possibility to innovate “around the patent” as well as the detailed description included in the patented innovation constitutes a source of diffusion of information and might translate in a limitation to patent (Oltra et al., 2010). As a consequence, patented innovations only represent an incomplete share of the invention process. However, there are very few examples of economically significant inventions which have not been patented (van Pottelsberghe et al., 2001).
The propensity to patent may also differ among countries depending, respectively, on the nature of the technology and on the risk of imitation in one country (Cohen et al., 2000). Hence, patenting activity is more likely to concern countries with technological capabilities as well as strict enforcement of intellectual property rights. Besides this, a number of empirical studies confirm that the propensity to patenting depends also on the specific industrial sector under scrutiny(Arundel and Kabla, 1998; Malerba and Orsenigo, 1996; Pavitt, 1984).
A further source of limitation is that a national patent grants only the exclusive right to use the technology in a given country; it does not mean that the patent owner will actually do so. This could significantly bias researcher’s results if applying for protection was not costly, so that inventors might patent widely and indiscriminately. But this is not the case in practice. First of all, patenting activity is costly – including the costs of preparation for the application process and the administrative costs and fees associated with the approval procedure. Moreover, if the enforcement is weak, the publication of the patent in the local language can increase vulnerability to imitation. As a result, inventors are unlikely to apply for patent protections in a country, unless they have the relatively certainty of the potential market associated to the discovered technology. The possibility to deposit patents in the international patent offices such as EPO or WIPO allows firms for a multi-country protection of their inventions (van Zeebroeck et al., 2006).
Lastly, the value of individual patents is heterogeneous since patents differ greatly in their technical and economic significance. Many of them reflect minor improvements of little economic value so that the distribution of patent value is skewed (Griliches, 1998). Notwithstanding, the OECD Triadic Patent Family database assumes relevant importance in recognizing high-quality patents, since the use of patent families enables to focus on the most valuable innovations. Besides this, several methods have been developed to enrich the level of information related to patents value (Lanjouw et al., 1998) such as the use of weights based on the number of times a given patent is cited in subsequent ones (Hall et al., 2005) or indexes based on multiple indicators (Lanjouw and Schankerman 2004).
2More importantly, the relationship between research inputs and successful-innovation outputs in terms of new economic useful knowledge emerged as a complex, non-linear, process (Baskerville and Pries-Heje, 2004; Kline and Ronseberg, 1986).
7
Despite these limitations, the use of patent data is widespread in the economics of innovation literature. Patents provide a public wealth of information on the nature of the invention and the applicant for rather long time series, indicating not only the countries where inventions are made, but also where these new technologies are used and derive from. Patent data frequently represent the direct result of R&D processes, a further step toward the final output of innovation that is useful knowledge through which firms are able to generate new income. Patent applications are usually filed early, hence they can be interpreted not only as a measure of innovative output, but also as a proxy of innovative activity (Popp, 2005).Moreover, patent data are subject to an extensive updating process of their informative content, continuously enriched by national and international patent offices. These latter, for administrative purposes and according to international procedures, classify patent data in specific technological areas (classes). The most important classification system is the International Patent Classification (IPC) developed by WIPO in 1971. Such classification system should allow researchers to properly identify relevant patents in specific technological domains. However, as it will be shown in this paper, there are cases in which the selective power of IPC classification is poor and alternative methods have to be implemented to properly select patents and investigate the characteristics and evolution of specific technological sectors.
3.2. Patents classification in environmental-friendly technologies
The importance of analysing the dynamics of eco-innovation increased over time, also due to the growing concerns of climate change and to the central role of facing it through the use of new greener technologies. Eco-innovation has been defined within the Measuring Eco-Innovation (MEI) project financed by the European Commission as “the production, assimilation or exploitation of a product, production process, service or management or business method that is novel to the organization (developing or adopting it) and which results, throughout its life cycle, in a reduction of environmental risk, pollution and other negative impacts of resources use (including energy use) compared to relevant alternatives” (Kemp and Pearson, 2008, pp. 7). According to this latter, eco-innovation is defined by the OECD as “the creation or implementation of new, or significantly improved, products (goods and services), processes, marketing methods, organizational structures and institutional arrangements which – with or without intent – lead to environmental improvements compared to relevant alternatives” (OECD, 2010).
In measuring the level of eco-innovation, patents have been increasingly exploited to build innovation indicators (Hascic et al., 2009; Johnstone et al., 2010; Lanjouw and Mody, 1996; Nameroff et al., 2004; Popp, 2002). However, in order to properly select eco-patents, the environmental gain should be described and appear in the patent descriptive content (Oltra et al., 2010). Unfortunately, this important requirement is not always present when one looks for eco-patents and most of the patent analysis over time in green technologies must be performed exploiting more complex methodologies than a simple search based on standard technological classifications (Costantini et al., 2013).
Patent documents contain several items for analysis, which can be mainly grouped into two main categories. The first category includes structured items, uniform in semantics and in format across patents (such as patent number, filing date, issued date, or assignees), while the other is composed of unstructured items, that is free texts different in length such as the fields of invention description, abstract or claims (Lee et al., 2009). In order to properly capture and explore the patents content in such a lack of application-specific classification systems, a large strand of literature developed in the last twenty years has tried to apply techniques and methodologies aimed to identify and analyse in detail some specific technological domains using both structured and non-structured patent items. An example of the former is given by top-down class-based analysis, relying on
8
standardized classes mainly aiming at defining the technological content of patents (Deerwester et al., 1990; van Zeebroeck et al., 2006).
The patent analysis of eco-innovations mainly relied on two existing classifications, namely IPC Green Inventory developed by WIPO and the European Classification system (ECLA) Y02class available in EPO. Green Inventory consists in a long list of IPC classes which have been identified according to the specific environmental-friendly purpose, but unfortunately, among the numerous technology domains, it does not include specific fields for EE technologies. Looking at ECLA, among Y02 classes it is only recently that specific fields associated with EE are available, with specific reference to the building sector including also appliances. However, these are very limited in scope and data coverage is extremely poor. Recently, EPO and USPTO have agreed together to work toward the formation of a partnership to explore the development of a joint classification system based on ECLA. The resulting classification is named Cooperative Patent Classification (CPC) and it incorporates the best classification practices of the two offices. Such a new classification system is still in development and cannot be considered complete. Indeed, one of the aim of the present work is to show that the new CPC is only of limited usefulness when it is necessary to identify a specific sector which does not fit the end use or the criteria used in the classification, in this case the EE technologies of domestic electrical appliances.
Recognizing the shortcomings of the previous strand of methodologies, data mining is proposed as an alternative. This second approach focuses on techniques able to analyse non-structured patent items, and it has been intensively investigated during the last decade (Andal, 2006; Kim et al., 2008; Lee et al., 2009; Matsuo and Ishizuka, 2004; Schutze and Pedersen, 1997; Tseng et al., 2007a,b; Uchida et al., 2004). Most of this literature relies on the exploitation of catchword tools, basically using keywords extracted from non-structured patent data, scientific publications, lists of keywords deriving from experts (De Looze and Lemarie, 1997; Noailly and Batrakova, 2010; Park et al., 2012; Yoon and Park, 2004) or the use of descriptors chosen by professional indexers and search engines (Coulter et al., 1998). In any case, it is worth noting that the ex-ante selection of keywords might reflect preconceptions, different backgrounds and points of view of the words’ selectors as well as differences in the trainings and backgrounds of professional indexers (Corrocher et al., 2007).
3.3. A complete methodology for mapping energy efficiency in the residential sector
As previously stated, due to their nature, EE technologies are only partially and roughly represented in the set of international patent classifications. One difficulty in mapping patents embodying EE technologies relies on the fact that these latter rarely constitute the final aim of a patent, but they are the result of one or several innovative contents of the patent itself, which may be also not explicitly mentioned in the text fields. EE is pervasive, not only operating in the most advanced technologies but, comparatively, in the entire realm of technologies using energy. Indeed, within a single technology paradigm, it is possible to find different EE levels, so that it is possible to compare, in terms of energy use, different appliances using the same technology. In other words, there is not always full identification between technology improvements and EE gains, since this latter can or cannot be included in the innovative content of a patent. In some other cases, the identification is very weak and gains in EE have few links with patented technological improvements because it can simply derive by the use of better quality materials (e.g. windows insulation) or concepts difficult to patent (e.g., buildings orientation).
A recent work by Noailly and Batrakova (2010) tries to fill this gap for the building sector for a limited number of countries and a limited field of technologies. They used patent applications per year in selected areas of environmental technologies in buildings, classified by applicant country and priority date. As the authors state,
9
“assigning IPC classes to relevant technologies was a challenging task since energy-efficient technologies in buildings touch upon a large number of diverse IPC classes. Patents on insulation, for instance, can be found in the IPC section of Fixed Construction, Chemistry and Metallurgy, Mechanical Engineering, as well as Performing Operations/Shaping” (Noailly and Batrakova, 2010, pp. 7806). In order to identify the relevant patents, they referred to technical experts from Ecofys and from the Netherlands Patent Office, providing IPC classes related to specific technologies together with a list of keywords for describing the state-of-the-art of EE technologies in the building sector3. Although this last work represents an important contribution in mapping EE technologies, it does not consider the important domain of domestic electrical appliances. Indeed, electrical appliances represent an important share in final energy consumption and have a very high potential impact in terms of EE gains for the multiplicative effect due to their capillary diffusion (IEA, 2009). These characteristics make the development of technologies for domestic electrical appliances an important source for reducing final energy consumption and for mitigating harmful GHG emissions.
In order to overcome the aforementioned drawbacks, we tried to mind the gap in mapping EE technologies using patent data, following the work of Noailly and Batrakova (2010) but focusing on domestic electrical appliances. In doing so, we made use of both top-down and bottom-up approaches for catching patent applications, adopting a multi-stage process. We combined the new CPC-Y02B classes4 with a set of keywords deriving from an ENEA team of experts,5 who extensively work on EE technologies. The validation of selected keywords is obtained following the inverse process of patents selection, extracting a sample of patents by some important producers of electrical appliances. In particular, we identified five large producers in the field of electrical appliances, namely Bosch, Electrolux, General Electric, Matsushita and Whirlpool, using standard CPC classes related to each single appliance (see Appendix for details). Once identified such producers, we extract a sample of 100 patent applications (20 for each producer) which has been analysed using full text as searching space. Then, the text of patents sample was vectorialised using a specific toolbox of Matlab named Text to Matrix Generator (Zeimpekis and Gallopoulos, 2006), and this allowed us to measure, through a co-occurrence analysis, the degree of matching of selected keywords within the patent texts. Then we proceed to the first phase of patent extraction (semantic search) using the Thomson Reuters Core Patents search engine. Such a process is characterized by two levels of searching using keywords together with Boolean operators (AND, OR, NOT). The first search level was performed on full-text, including the most important non-structured items such as title, abstract, claims and description of patent applications. This was used in order to identify, as widely as possible, the EE macro-domain with respect to the universe of patent applications in the considered period. A second level search string, end-use oriented, was applied to reduce the macro-domain to a meso-domain, on those patents classifiable as inherent to EE technologies applied to residential sector, using words like “refrigerator”, “washing machine” and so on. This reduced the set of applications to four large electrical appliances: refrigerators, freezers, washing machines and dishwashers.
As a second stage of search, we used patent classes relying on the new CPC-Y02B classification6. This allowed us not only for enriching our sample of patent applications, but also to compare the two different methodologies of patents extraction, as showed in Table 1. As a final step, we tested the content of a sample of 15% of total
3 The building sector includes the following sub-sectors: insulation and demand reduction (heat saving, water saving, cooling reduction), high-efficiency boilers, heat and cold distribution, ventilation, solar energy and other renewables, lighting, building materials.
4 CPC-Y02B classes are those related to “climate change mitigation technologies related to buildings, e.g. including housing and appliances or related end-user applications”. For more information, see:
http://www.cooperativepatentclassification.org/cpc/scheme/Y/scheme-Y02B.pdf
5 ENEA, Italian National Agency for New Technologies, Energy and Sustainable Economic Development. 6 Based on the version scheme CPC 04-2013, available from April 13, 2013.
10
extracted applications as further validation process. The complete list of CPC – Y02 classes used for extracting patent applications can be found in the Appendix.
3.4. Dataset description
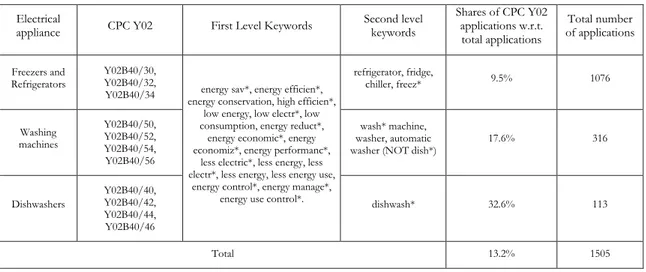
We collected a set of 1,505 patent applications in the time span 1990-2010, eliminating those applications found twice by using both methods, respectively applying keywords and CPC-Y02B classes.
Table 1 provides dataset summary statistics with a comparison between the two applied methodologies for identifying relevant EE patent applications in domestic electrical appliances, namely the class-based method using the new CPC-Y02 classification and the semantic method using keywords.
As shown, the share of ECLA applications is only a small part of the total applications with EE relevance in the electrical appliances taken into account. Such a share is not constant among the different appliances and seems to be an inverse function of the number of patents in each appliance, since the greater is the total number of appliance-specific applications, the lower is the share of those identified using CPC Y02 classification.
Table 1 – Dataset description (patent applications)
Electrical
appliance CPC Y02 First Level Keywords Second level keywords
Shares of CPC Y02 applications w.r.t. total applications Total number of applications Freezers and Refrigerators Y02B40/30, Y02B40/32,
Y02B40/34 energy sav*, energy efficien*, energy conservation, high efficien*,
low energy, low electr*, low consumption, energy reduct*,
energy economic*, energy economiz*, energy performanc*,
less electric*, less energy, less electr*, less energy, less energy use,
energy control*, energy manage*, energy use control*.
refrigerator, fridge, chiller, freez* 9.5% 1076 Washing machines Y02B40/50, Y02B40/52, Y02B40/54, Y02B40/56 wash* machine, washer, automatic
washer (NOT dish*) 17.6% 316
Dishwashers Y02B40/40, Y02B40/42, Y02B40/44, Y02B40/46 dishwash* 32.6% 113 Total 13.2% 1505
4. Technological innovation for energy efficient electrical appliances
4.1 Distribution across technological domains
Patenting activity in terms of EPO applications related to EE technologies in four electrical appliances (refrigerators, independent freezers, dishwashers and washing machines) in the period 1990-2010 is described in Figure 2 by using a three year moving average as in Johnstone et al. (2012).
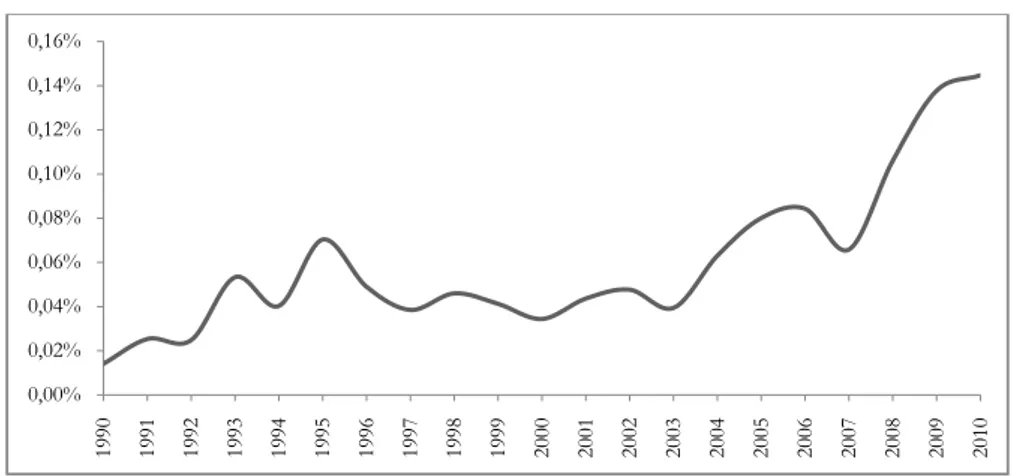
The observed dynamics shows that there has been a slight growth in the first decade (1990-2000) followed by a positive shift in the second decade, in particular in the second part (2005-2010), when the number of applications followed an exponential trend. Moreover, the same increasing behaviour is followed by the ratio between EE applications and the total number of application registered at EPO in each year, as showed in Figure3, which confirms the growing interest in patenting EE technologies incorporated in electrical appliances with respect to the total patenting activity registered at the European Patent Office (EPO). In the case of freezers and refrigerators, the increasing trend was even more emphasized.
11
One of the reasons behind this difference is the stronger need for EE technologies in appliances whose adsorbing power capacity is continuous, as in refrigerators and freezers. On the other hand, the behaviour of patenting activity for dishwashers and washing machines is further similar, even though, differing by refrigerators and freezers, the final purpose of the appliances are different. The similar patenting trend in this last case might be due to the fact that one single patent (e.g. a patent on energy management system) can be applied to both appliances having different objectives but similar technologies, an interesting case of technological knowledge having horizontal usefulness (Antonelli, 2003, 2008). Such a feature is particularly interesting to be investigated and the Essay III provides further explanation on this issue.
As a matter of fact, the fridge and refrigerator domain takes the lion’s share during last five years with an exponential divergence with respect to the other technologies.
Fig. 2 – Patent applications in EE technologies, 1990-2010 (three-year moving average)
Source: own elaborations on EPO
Fig. 3 – Share of patent applications in EE technologies on total patent applications, 1990–2010 (three-year moving average)
Source: own elaborations on EPO
0 25 50 75 100 125 1990 1991 1992 1993 1994 1995 1996 1997 1998 1999 2000 2001 2002 2003 2004 2005 2006 2007 2008 2009 2010
Dishwashers Freezers and Fridges Washing Machines
0,00% 0,02% 0,04% 0,06% 0,08% 0,10% 0,12% 0,14% 0,16% 1990 1991 1992 1993 1994 1995 1996 1997 1998 1999 2000 2001 2002 2003 2004 2005 2006 2007 2008 2009 2010
12
4.2 Distribution across countries
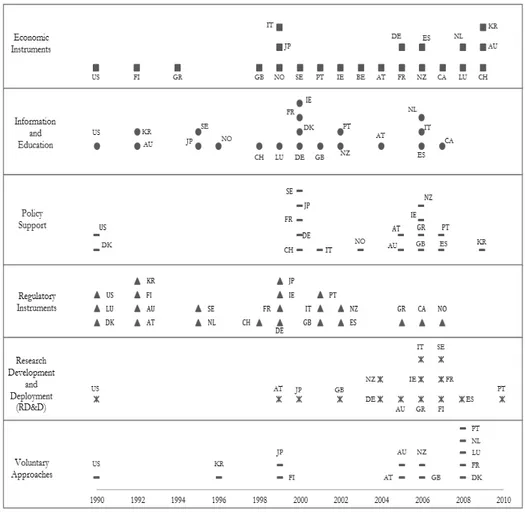
Although the cross-country comparison simply based on a patent count implies some bias (see Li, 2008), we can draw some empirical evidences with respect to the geographical location of the assignees. Figure 4 plots the dynamics of patent applications over time in selected countries obtained by considering the residence country of the assignee.
Fig. 4 – Distribution of applications by assignee country, 1990-2010 (three-year moving average)
Source: own elaborations on EPO
This evidence shows that in terms of number of applications, Japan and United States hold the lion’s share of innovation efforts in most innovative EE appliances, representing almost the 70% of the total sample. If we look at the internal comparisons, Japan’s patenting activity seems to have focused more on refrigerators and freezers, while US maintained a constant innovative effort across the different appliances, as showed in Figure5.
A further interesting aspect is the common increasing trend, particularly rapid since 2000, of the top five assignee countries, namely Japan, United States, South Korea, Germany and Italy. The United States was the only country showing an evident fall since 2007, with a negative peak in 2009 falling back at 2005 values, and a new moderate growth in 2010.South Korea, on the other hand, showed a constant increasing trend of patenting activity in EE technologies, followed by Germany and Italy.
Figure 6 represents the dynamics of specialization in EE patenting activity over the period 1990-2010. It was measured as the number of applications by a given country in a year, divided by the total number of applications in the same year, for all the electrical appliances taken into account in the analysis. At a first glance, we can observe a modest but constant increasing specialization in EE in the last five years of the considered period (2005-2010) in all of the countries with the exception of two important ones, namely United States and Japan, whose specialization in EE patenting activity seems to be highly fluctuating. In particular, the specialisation dynamics of the United States and Japan followed an opposite behaviour over the entire period of analysis, deserving further empirical investigations. A further interesting trend is provided by looking at the behaviour of Germany and Italy. Indeed, their dynamics appears similar, being constituted by a first fall from 1990 to 1995, followed by three years of rising specialisation performance, a second longer fall occurred from 1998 to 2007 and a new growth afterwards. After 2006, specialization patterns appear slightly different form the past, as German specialization trend is faster than the Italian one.
0 10 20 30 40 50 60 70 1990 1991 1992 1993 1994 1995 1996 1997 1998 1999 2000 2001 2002 2003 2004 2005 2006 2007 2008 2009 2010 JP US KR DE IT Others
13
Fig. 5 – Shares of patent applications by assignee country and appliance, 1990-2010
Source: own elaborations on EPO
Fig. 6 – Shares of patent applications in EE technologies per year, by first ten assignee countries (three-year moving average)
Source: own elaborations on EPO.
43,7% 25,4% 10,5% 7,2% 5,0% 2,7%5,1% Total applications JP US KS DE IT BE Others 31,8% 30,0% 15,0% 8,8% 3,5%3,5% 7,0% Dishwashers DE US IT BE JP KS Others 49,8% 26,3% 10,1% 4,9%3,5% 1,2% 4,0%
Freezers and refrigerators
JP US KS DE IT NL Others 37,6% 19,6% 14,2% 9,1% 9,1% 5,0% 5,0% Washing machines JP US KS BE IT DE Others 0% 10% 20% 30% 40% 50% 60% 70% 1990 1991 1992 1993 1994 1995 1996 1997 1998 1999 2000 2001 2002 2003 2004 2005 2006 2007 2008 2009 2010 JP US KS GE IT BE ES NL SW TU
14
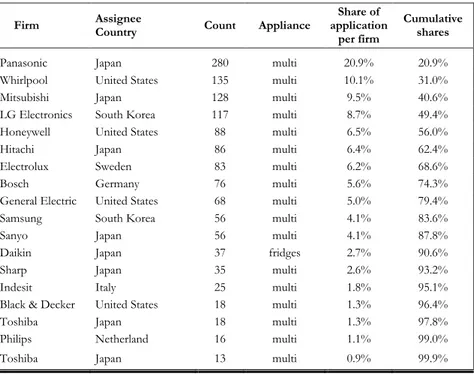
4.2 Big players and firms comparison
If we look at the firms’ performances (Table 2), the distribution of patent applications is mostly concentrated in few large innovator firms. More than 50% of the distribution is held by five corporations, namely Panasonic (with the 21% of the patent applications) followed with a large distance by Whirlpool, Mitsubishi, LG and Honeywell. It is worth noting that none of these firms is a single-appliance corporation, hence all of them produce different types of appliances with the exception of Daikin, a Japanese air conditioner producer. Moreover, three out of five firm headquarters are located in Asia, especially in Japan, which alone hosts eight out of eighteen corporations, confirming its leading role as a fruitful location for firms producing EE technologies in the technological domain here investigated.
Among firms located in Europe, Bosch (Germany), Electrolux (Sweden), and Indesit (Italy) assumed a prominent role although their contributions are smaller with respect to the Asian market players.
Table 2 – Top innovator firms
Firm Assignee Country Count Appliance application Share of
per firm
Cumulative shares
Panasonic Japan 280 multi 20.9% 20.9% Whirlpool United States 135 multi 10.1% 31.0% Mitsubishi Japan 128 multi 9.5% 40.6% LG Electronics South Korea 117 multi 8.7% 49.4% Honeywell United States 88 multi 6.5% 56.0% Hitachi Japan 86 multi 6.4% 62.4% Electrolux Sweden 83 multi 6.2% 68.6% Bosch Germany 76 multi 5.6% 74.3% General Electric United States 68 multi 5.0% 79.4% Samsung South Korea 56 multi 4.1% 83.6% Sanyo Japan 56 multi 4.1% 87.8% Daikin Japan 37 fridges 2.7% 90.6% Sharp Japan 35 multi 2.6% 93.2% Indesit Italy 25 multi 1.8% 95.1% Black & Decker United States 18 multi 1.3% 96.4% Toshiba Japan 18 multi 1.3% 97.8% Philips Netherland 16 multi 1.1% 99.0% Toshiba Japan 13 multi 0.9% 99.9%
Source: own elaborations on EPO
5. Conclusions
The present study provided new evidence in the poorly explored technological domain of EE incorporated in domestic electrical appliances and traces the road for further investigation in the field of eco-innovation.
A first important conclusion arises from the comparison of different methodologies aimed to identify relevant patent applications in latent technological domains. The differences between semantic and class-based methods of patent documents extraction is, per se, an interesting result, showing that CPC-Y02 classification, at the moment, only tells a part of the story and provides a weak catching power when latent technological domains such as EE in electrical appliances are under scrutiny. A first implication of this result is that much more effort is required from patent offices in order to develop ad-hoc and comprehensive classifications able to fully map residential EE technologies.
15
With respect to the analysis of innovation dynamics in this domain, the increasing interest in producing new patents embodying technologies to reduce energy consumption is confirmed also by the analysis of time trends, both in absolute values and relative shares of total EPO application.
Regarding the sectoral analysis, although the distribution of patents varies among countries, most of the effort in generating EE technologies is concentrated in freezers and refrigerators and such a trend is stable over time.
The geographical distribution of patent applications seems to be skewed toward Asian countries. Japanese and Korean corporations, in particular, assumed a prominent role in the development of new EE technologies for residential electrical appliances, followed by American and European firms. Interesting trends can be noted by disentangling the specialisation of countries. For instance, United States and Japan, which represents the most important countries hosting top innovating firms, show opposite trends during the entire period of observation. Moreover Germany and Italy, two important manufacturing countries, follow exactly the trend traced, respectively, by Japan and United States, suggesting possible market interconnection dynamics between countries leaders in EE innovation (Japan and United States) and potential followers (Germany and Italy).
A further result derives from the joint analysis of the technology adoption curve and the trend of applications. Indeed, we observe a correlation among the level of diffusion (that we can interpret as market demand of a specific appliance) and the growth level of technologies in the appliance measured through the patent count. In particular, a positive correlation can be established, showing that the more the penetration rate of technology, the higher the number of applications for that specific appliance. This evidence suggests the importance of the role of demand-pull drivers in generating innovation (energy prices and demand-based policies such as energy labelling). Moreover, since the effect varies across different appliances, a possible explanation can rely on the different level of energy consumption that each appliance requires. Indeed, the correlation seems to be particularly strong in the case of refrigerators and freezers, which differ from other appliances for their continuous energy absorption and whose consumption followed a relevant decrease in the last 15 years as confirmed by IEA (2009). However, further analysis is required to determine the determinants and the size of this effect.
16 References
Andal M., Oyanagi S., Yamakazi K. (2006). Research on text mining techniques to support patent map generation. Forum on Information Technology, pp. 111–112.
Antonelli C. (2003). Knowledge Complementarity and Fungeability: Implications for Regional Strategy.Regional Studies, 37(6-7), pp. 595-606.
Antonelli C. (2008). Localised Technological Change: Towards the Economics of Complexity, London, Routledge.
Archibugi D., Pianta M. (1996). Measuring technological change through patents and innovation surveys. Technovation, 16 (9), pp. 451-468.
Arundel A., Kemp R. (2011). Measuring eco-innovation, UNU-MERIT Working Paper Series No. 2009-017, Maastricht, The Netherlands.
Arundel, A., Kabla I. (1998). What percentage of innovations are patented? Empirical estimates for European firms. Research Policy, 27 (2), pp. 127-141.
Baskerville R., Pries-Heje J. (2004). Short cycle time systems development. Information Systems Journal, 14, pp. 237-264
Berkhout F. (2011). Eco-innovation: reflections on an evolving research agenda. International Journal of Technology, Policy and Management, Vol. 11, pp. 191-197.
Borghesi S., Costantini V., Crespi F., Mazzanti M., (2013). Environmental innovation and socio-economic dynamics in institutional and policy contexts. Journal of Evolutionary Economics, 23(2), pp.241-245. Cohen W. M., Nelson R. R., Walsh J. P. (2000). Protecting Their Intellectual Assets: Appropriability Conditions
and why U.S. Manufacturing Firms Patent. NBER Working Paper No. 7552.
Corrocher N., Malerba F., Montobbio F. (2007). Schumpeterian Patterns of Innovative Activity in the ICT Field. Research Policy, Vol. 36 (3), pp. 418-432.
Costantini V. Crespi F. Curci Y. (2013). BioPat: An Investigation Tool for Analysis of Industry Evolution, Technological Paths and Policy Impact in the Biofuels Sector. In The Dynamics of Environmental and Economic Systems. Eds. Costantini V., Mazzanti M.
Coulter N., Monarch I., Konda S. (1998). Software engineering as seen through its research literature: a study in co-word analysis. Journal of the American Society for Information Science, 49 (13), pp. 1206-1223.
Deerwester S. C., Dumais S. T., Landauer T. K., Furnas G. W., Harshman R. A. (1990). Indexing by latent semantic analysis. Journal of the American Society of Information Science, 41 (6), pp. 391-407.
De Looze M-A., Lemarie J. (1997). Corpus relevance through co-word analysis: an application to plant proteins. Scientometrics, 39 (3), pp. 267-280.
EC (2010). COM/2010/639. Communication from the Commission to the European Parliament, the Council, the European Economic and Social Committee and the Committee of the Regions. Energy 2020 – a strategy for competitive, sustainable and secure energy. European Commission. Brussels.
EC (2011).COM/2011/0109. Energy Efficiency Plan 2011. Communication from the Commission to the European Parliament, the Council, the European Economic and Social Committee and the Committee Of The Regions. European Commission, Brussels.
EC (2012). Directive 2012/27/EU of the European Parliament and of the Council of 25 October 2012 on energy efficiency, amending Directives 2009/125/EC and 2010/30/EU and repealing Directives 2004/8/EC and 2006/32/EC. Official Journal of the European Union, pp. 3-58.
EC (2013). COM(2013) 253. Energy Technologies and Innovation. European Commission, Brussels.
Frietsch R., Schmoch U. (2006). Technological Structures and Performance as Reflected by Patent Indicators, in National Systems of Innovation in Comparison. Chapter 3. Springer
Gillingham K., Newell R., & Palmer K. (2009). Energy Efficiency Economics and Policy. Annual Review of Resource Economics, Vol. 1, pp. 597 -620.
Griliches Z. (1998). Patent Statistics as Economic Indicators: A Survey. In R&D and Productivity: The Econometric Evidence. Ed. ZviGriliches. National Bureau of Economic Research. University of Chicago Press. Hascic I., de Vries F., Johnstone N., Medhi N. (2009). Effects of environmental policy on the type of innovation:
The case of automotive emission-control technologies. OECD Journal. Economic Studies, Vol. 2009/1. Horbach J., Rammer C., Rennings K. (2012). Determinants of eco-innovations by type of environmental impact
- The role of regulatory push/pull, technology push and market pull. Ecological Economics, 78, pp. 112-122.
Hall B. H., Jaffe A., Trajtenberg M. (2005). Market Value And Patent Citations. Rand Journal of Economics Vol. 36 (1), pp. 16-38.
17
IEA (2010). Energy Technology Perspective 2010. OECD-IEA Publishing, Paris. IEA (2012). Energy Technology Perspectives 2012. OECD-IEA Publishing, Paris.
Jaffe A., Trajtenberg M. (2004). Patents, Citations, and Innovations: A Window on the Knowledge Economy. Journal of Economic Literature, 42 (4), pp. 1158-1160.
Johnstone N., Hascic I., & Popp D. (2010). Renewable Energy Policies and Technological Innovation: Evidence Based on Patent Counts. Environmental and Resource Economics, 45, 133-155.
Johnstone N., Hascic I., Poirier J., Hemar M., Michel C. (2012). Environmental policy stringency and technological innovation: evidence from survey data and patent counts. Applied Economics, 44 (17), 2157-2170.
Kim Y. G., Suh J. H., Park S. C. (2008). Visualization of patent analysis for emerging technology. Expert Systems with Applications, 34(3), 1804–1812.
Kemp R., Pearson P. (2008). Measuring eco-innovation. Final Report MEI project, UNU-MERIT. Maastricht. Kemp R., Oltra V. (2011). Research Insights and Challenges on Eco-Innovation Dynamics. Industry &
Innovation, Vol. 18, pp. 249-253.
Kline S.J., N. Rosenberg (1986). An overview of innovation. In R. Landau & N. Rosenberg (eds.), The Positive Sum Strategy: Harnessing Technology for Economic Growth. Washington, D.C., National Academy Press, pp. 275–305
Lanjouw J., Mody A. (1996). Innovation and the international diffusion of environmentally responsive technology. Research Policy, 25 (4), pp. 549-571.
Lanjouw J., Pakes A., Putnam J. (1998). How to Count Patents and Value Intellectual Property: Uses of Patent Renewal and Applications Data. Journal of Industrial Economics, 46, 4, pp. 405-433.
Lanjouw J., Schankerman M. (2004). Patent quality and research productivity: measuring innovation with multiple indicators. Economic Journal, 114 (495), pp. 441-465.
Lee S., Yoon B., Park Y. (2009). An approach to discovering new technology opportunities: keyword-based patent map approach.Technovation, 29 (6/7), pp. 481-497.
Li X. (2008). Geography of innovation activities: problems and perspectives. South Centre Research Paper 18, Geneva, Switzerland.
Linares P., Labandeira X. (2010). Energy Efficiency: Economics and Policy. Journal of Economic Surveys, (24)-3, pp. 573-592.
Malerba F., Orsenigo L. (1996). The dynamics and evolution of industries. Industrial and Corporate Change, 5 (1), pp. 51-87.
Markard J., Raven R., Truffer B. (2012), Sustainability transitions: An emerging field of research and its prospects, Research Policy, Vol. 41, pp. 955-967.
Matsuo Y., Ishizuka M. (2004). Keyword Extraction from a Single Document using Word Co-occurrence Statistical Information. International Journal on Artificial Intelligence Tools. (13)-1, pp. 157-169.
Nameroff T.J., Garant R.J., Albert M.B. (2004). Adoption of green chemistry: An analysis based on US patents. Research Policy, 33 (6-7), pp. 959-974.
Noailly J., Batrakova S. (2010). Stimulating energy-efficient innovations in the Dutch building sector: Empirical evidence from patent counts and policy lessons. Energy Policy, 38, 7803-7817.
OECD (2005). Oslo Manual: Guidelines for Collecting and Interpreting Innovation Data, 3rd Edition, OECDPublishing, Paris.
OECD (2010). Eco-Innovation in Industry: Enabling Green Growth, OECD Publishing, Paris.
OECD (2011). Fostering Innovation for Green Growth, OECD Green Growth Studies.OECD Publishing, Paris
Oltra V., Kemp R., De Vries F.P. (2010). Patents as a measure for eco-innovation. International Journal of Environmental Technology and Management 13 (2) , pp. 130-148.
Park H, Yoon J., Kim K. (2012) Identifying patent infringement using SAO based semantic technological similarities. Scientometrics. Volume 90 (2), pp. 515-529.
Pavitt K. (1984). Sectoral patterns of technical change: Towards a taxonomy and a theory. Research Policy, 13 (6), pp. 343-373.
Popp D. (2002). Induced Innovation and Energy Prices. American Economic Review, 92, pp. 160-180.
Popp D. (2005). Lessons from patents: using patents to measure technological change in environmental models. Ecological Economics, 54 (2), pp.209-226.
Schutze H., Pedersen J. (1997). A co-occurrence-based thesaurus and two applications to information retrieval. Information processing & Management, vol. 33(3), pp. 307-318.
Sirilli G. (1997). Science and technology indicators: the state of the art and prospects for the future, in: Antonelli G. and De Liso N. (eds) Economics of structural and technological change. London, Routledge.
18
Tseng Y., Lin, C., Lin, Y. (2007a). Text mining techniques for patent analysis. Information Processing and Management 43 (5), 1216–1247.
Tseng Y., Wang Y., Lin Y., Lin C., Juang D. (2007b). Patent surrogate extraction and evaluation in the context of patent mapping. Journal of Information Science 33 (6), 718–736.
Uchida H., Mano A., Yukawa T. (2004). Patent map generation using concept-based vector space model. In: Proceedings of the Fourth NTCIR workshop, June 2–4, Tokyo, Japan.
Van Pottelsberghe B., Dernis H., Guellec D. (2001). Using Patent Counts for Cross-Country Comparisons of Technology Output. STI Review, 27.
Van Zeebroeck N., Van Pottelsberghe De La Potterie B., Han W. (2006). Issues in measuring the degree of technological specialisation with patent data. Scientometrics, 66 (3), pp. 481-492.
Veefkind V., Hurtado-Albir J., Angelucci S., Karachalios K., Thumm N. (2012). A new EPO classification scheme for climate change mitigation technologies. World Patent Information (34), pp. 106-111.
Yoon B., Park Y. (2004). A text-mining-based patent network: Analytical tool for high-technology trend. Journal of High Technology Management Research, 15 (1), pp. 37-50.
Zeimpekis D., Gallopoulos E. (2006). TMG: a Matlab toolbox for generating term-document matrices from text collections. In Grouping Multidimensional Data: Recent Advances in Clustering. Eds. J. Kogan, C. Nicholas and M. Teboulle, pp. 187-210, Springer.
19 Appendix
List of CPC classes related to the large electrical appliances considered for keywords validation. CPC general Class related to each appliance
Relating to refrigerators or freezers
F25D
See http://www.cooperativepatentclassification.org/cpc/scheme/F/scheme-F25D.pdf
Relating to dish-washers
A47L 15/00
See http://www.cooperativepatentclassification.org/cpc/scheme/A/scheme-A47L.pdf
Relating to washing machines
D06F
(excluding D06F31/00, D06F43/00, D06F47/00, D06F58/12, D06F67/04, D06F71/00, D06F89/00, D06F93/00, D06F95/00 as well as their subgroups).
See http://www.cooperativepatentclassification.org/cpc/definition/D/definition-D06F.pdf
List of CPC-Y02B classes and related descriptions.
Y02B 40/00- Technologies aiming at improving the efficiency of home appliances
Y02B 40/30
Relating to refrigerators or freezers (not used see subgroups)
Y02B 40/32 Motor speed control of compressors or fans Y02B 40/34 Thermal insulation
Y02B 40/40
Relating to dish-washers (not used, see subgroups)
Y02B 40/42 Motor speed control of pumps Y02B 40/44 Heat recovery e.g. of washing water
Y02B 40/50
Relating to washing machines (not used, see subgroups)
Y02B 40/52 Motor speed control of drum or pumps Y02B 40/54 Heat recovery, e.g. of washing water Y02B 40/56 Optimisation of water quantity Y02B 40/58 Solar heating
List of assignee countries.
NATO Code Country NATO Code Country
AU Austria UK United Kingdom
BE Belgium IT Italy BR Brazil JP Japan SZ Switzerland KS Korea CH China NL Netherlands GE Germany SW Sweden ES Spain TU Turkey
1
PhD Thesis
by
Alessandro Palma
"Three Essays in Energy Efficiency Innovation"
ESSAY II
Policy Inducement Effects in Energy Efficiency Technologies.
An Empirical Analysis on the Residential Sector.
2
Policy Inducement Effects in Energy Efficiency
Technologies. An Empirical Analysis on the
Residential Sector.
Alessandro Palma, Departiment of Economics, Roma Tre University
Abstract
Energy efficiency technologies represent a key driver for the reduction of the energy demand, leading to environmental and economic benefits. This aspect appears to be particularly relevant in the residential sector, where the demand for energy has not showed a decreasing trend over the last two decades. The study provides a wide-ranging empirical analysis of the drivers of innovation, with a particular focus on the policy side, in residential energy efficiency technologies. The panel analysis of 23 OECD countries over the period 1990-2010, confirms the importance of adopting a systemic perspective when eco-innovation is under scrutiny. In particular, the innovation system, both national and sectoral, together with the environmental and the energy systems, spurred the propensity to innovate and significantly shaped the rate and direction of technical change in the residential sector. A general policy inducement effect is found to be relevant, but the size of its contribution for new EE technologies changes if disaggregated policy instruments are investigated. It can be noted a positive and significant impact not only driven by standard regulations, but also by policies aimed at improving the level of consumer’s information and awareness. The role of policy mix as well as of policy coordination and coherence also positively affect the innovative activity in EE residential technologies. These evidences lead to noteworthy policy implications and suggest the way to further develop research in this field.
3 1. Introduction
Energy efficiency (EE) represents one of the most effective mean for achieving several goals, as increasing energy security, fostering international cost competitiveness, and reducing polluting emissions. In particular, achieving a more secure, sustainable and affordable energy system is a key challenge for the future world development (EC, 2011; IEA, 2010, 2012a). In this context, the availability and adoption of new energy-efficient technologies represents a key driver for reducing the overall energy demand as it influences the levels of EE (EE). This aspect appears to be particularly relevant in the residential sector, where the demand for energy to power residential appliances and equipment does not show a slowing trend with, on the contrary, a continuous growth over the last 20 years in electricity demand.
The understanding of the determinants of the pace of inventive activities in this sector therefore appears to be an important step for the design of appropriate policies to foster the generation and diffusion of environmental technologies aiming at increasing EE. However, the residential sector is a complex system in which several energy services are used such as space heating, cooling systems, water heating systems, lighting and several electrical appliances. This implies that relevant research efforts are needed to properly map the evolution of technologies in this sector and to systematically collect information of specific policy strategy.
Given the limited number of studies that analysed the drivers of innovation in this field, I propose a comprehensive analysis of the factors affecting the dynamics of EE technologies in the residential sector, with a specific attention to the role played by public policies. In so doing, I contribute the current literature: i) by including in the analysis the domain of electrical appliances which – although rather unexplored – constitute an important share of residential energy consumption for their large potential due to the multiplicative effect of each single appliance; ii) by extending the country coverage of the empirical analysis to a comprehensive number of high-income OECD countries; iii) by analysing the impact of the full array of policy instruments that are supposed to influence innovation activities.
The rest of the work is organised as follows. Section 2 shows the consumption patterns as well as the innovation dynamics in EE in the residential sector for better understanding the energy-growth decoupling process occurred in most of OECD countries. In Section 3, I describe the data used for the econometric analysis, with a particular focus on the policy framework, while Section 4 lays out the empirical strategy and presents the model results. Finally, Section 5 concludes with some policy implications and further research lines.
2. Consumption patterns and innovation dynamics in EE for the residential sector
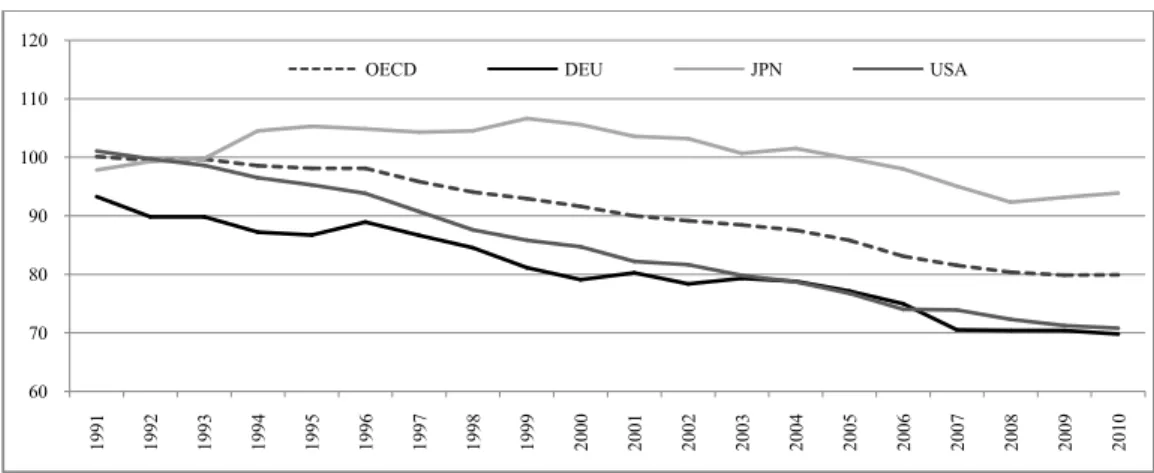
2.1 Energy consumption trends and energy-growth decoupling
During the past decades energy consumption trends have changed substantially after the first oil shock, due to several modifications occurred in energy policy as well as in consumption behaviours, especially in the developed world. Decreasing dynamics in energy and carbon intensity may be detected in almost all economic sectors, with a stronger effect in the manufacturing industries. By looking at the last two decades (1990-2010), it is worth noting that there are some divergences especially when the residential sector is under scrutiny. By comparing index numbers taking 1990 as base year, built on the ratio between total energy consumption and Gross Domestic Product (GDP) for selected OECD countries (Figure 1), the average trend for OECD countries as well as the path for three major energy consumers (namely Germany, Japan and the US), is continuously decreasing over time, with the exception of Japan up to 2004. The residential sector shows, on average, a similar dynamics for OECD economies, with increasing values for Japan and a less evident negative trend for Germany
4
(Figure 2). Index numbers built on the ratio between energy consumption in the residential sector and household final consumption expenditures provides interesting differences with the previous overall trend, where the divergence between Japan and the rest of OECD countries appears much higher.
This evidence provides a first broad picture of cross-country specific features, signalling that some countries have reduced efforts to improve EE in the residential sector with respect to others, while other countries obtained EE gains especially in this sector. Reasons behind these divergences may be detected in several directions.
A first explanation can be found by the different policy stringency adopted in OECD countries during these two decades for EE in the residential sector. Indeed, the number of policies has increased substantially after year 2000 (see Section 3), with countries as Japan, the United Kingdom and the US adopting more stringent and pervasive policies only recently, while other countries as Denmark, Finland and Germany introduced a relatively smaller number of policies, but they have been adopted them since the early 1990s. It is also worth noting that the effectiveness of environmental policies is closely related to the adopted instruments. Several differences arise when comparing for instance command and control with market-based instruments (Baumol and Oates, 1988), where the latter are considered as cost effective as well as more suitable for pushing technological change (Porter and van der Linde, 1995).
Figure 1 – Energy intensity trends in total economy, 1990-2010 (1990=100)
Source: own elaborations on IEA (2012b), World Bank (WDI, 2013)
As a matter of fact, this field of analysis requires a complex framework, where several driving factors may help explaining divergent performance trends, as institutional and technological capabilities, as well as the more general innovation system at country level. It is also true that gains in resource efficiency are forced to be strictly related to technological innovation, giving impulse to a large number of scientific contributions trying to disentangle this issue.
60 70 80 90 100 110 120 1991 1992 1993 1994 1995 1996 1997 1998 1999 2000 2001 2002 2003 2004 2005 2006 2007 2008 2009 2010
5
Figure 2 – Energy intensity trends in the residential sector 1990-2010 (1990=100)
Source: own elaborations on IEA (2012b), World Bank (WDI, 2013) 2.2 Eco-innovation and energy efficiency
Broadly speaking, the reduction of the overall residential energy demand can be thought as a function of the level of EE, which in turns depends on the availability and adoption of new EE technologies, such as intelligent building design and high-performance buildings including highly efficient heating, ventilation and water heating systems. With respect to this, the dynamics of employed technologies in the residential sector is a key issue.
Considering the strong linkage between the energy system, the environment and innovation processes, EE can be well included EE into the broader eco-innovation framework (Kemp and Pearson, 2008; OECD, 2010). In this work, I am particularly interested in understanding how public policies may induce innovation efforts at the country level. By relying on the growing literature analysing different technological environmental domains (Arundel and Kemp, 2011; Berkhout, 2011; Borghesi et al., 2013;; Haščič et al, 2009; Horbach et al., 2012; Johnstone et al., 2010; Kemp and Oltra, 2011; Lanjouw and Mody, 1996; Markard et al., 2012; Nameroff et al., 2009; OECD, 2011; Popp, 2002), a patent-based analysis seems to be the most appropriate way to study innovation dynamics in this field due to lack of specific data on efforts in research and development (R&D), especially in the private sector.
Despite some relevant limitations, the use of patent data is widespread in the economics of innovation literature (see Archibugi and Pianta, 1996; Arundel and Kabla, 1998; Cohen et al., 2000; Griliches, 1990; Hall et
al., 2005; Jaffe and Trajtemberg, 2004; Malerba and Orsenigo, 1996; Oltra et al., 2010; Pavitt, 1984; Lanjouw et al.,
1998; Lanjouw and Schankerman 2004; van Pottelsberghe et al., 2001; van Zeebroeck et al., 2006). Indeed, patents provide a public wealth of information on the nature of the invention and the applicant for rather long time series, indicating not only the countries where inventions are made, but also where such new technologies are used and derive from. Patent data frequently represent the direct result of R&D processes, a further step toward the final output of innovation that is useful knowledge through which firms are able to generate new profit sources. Moreover, patent applications are usually filed early (Griliches, 1990), hence they can be interpreted not only as a measure of innovative output, but also as a proxy of innovative activity (Popp, 2005). Besides this, it is worth noting that patent data are subject to an extensive updating process of their informative content, continuously enriched by national and international patent offices. In addition, EE technologies are only partially and roughly represented in the set of international patent classifications.
60 70 80 90 100 110 120 1991 1992 1993 1994 1995 1996 1997 1998 1999 2000 2001 2002 2003 2004 2005 2006 2007 2008 2009 2010