2018
Publication Year
2021-02-09T08:01:51Z
Acceptance in OA@INAF
ALMACAL IV: a catalogue of ALMA calibrator continuum observations
Title
BONATO, MATTEO; LIUZZO, Elisabetta Teodorina; GIANNETTI, ANDREA;
MASSARDI, MARCELLA; De Zotti, G.; et al.
Authors
10.1093/mnras/sty1173
DOI
http://hdl.handle.net/20.500.12386/30251
Handle
MONTHLY NOTICES OF THE ROYAL ASTRONOMICAL SOCIETY
Journal
478
Number
arXiv:1805.00024v1 [astro-ph.GA] 30 Apr 2018
ALMACAL IV: A catalogue of ALMA calibrator
continuum observations
M. Bonato
1,2⋆, E. Liuzzo
1, A. Giannetti
1, M. Massardi
1, G. De Zotti
2, S. Burkutean
1,
V. Galluzzi
3,4, M. Negrello
5, I. Baronchelli
6, J. Brand
1, M. A. Zwaan
7, K. L. J. Rygl
1,
N. Marchili
8, A. Klitsch
7,9and I. Oteo
10,71INAF−Istituto di Radioastronomia, and Italian ALMA Regional Centre, Via Gobetti 101, I-40129, Bologna, Italy 2INAF−Osservatorio Astronomico di Padova, Vicolo Osservatorio 5, I-35122, Padova, Italy
3INAF−Osservatorio Astronomico di Trieste, Via Tiepolo 11, I-34143, Trieste, Italy
4Dipartimento di Fisica e Astronomia, Universit`a di Bologna, via Gobetti 93/2, I-40129 Bologna, Italy 5School of Physics and Astronomy, Cardiff University, The Parade, Cardiff CF24 3AA, UK
6California Institute of Technology, Pasadena, CA
7European Southern Observatory, Karl-Schwarzschild-Str. 2, D-85748 Garching, Germany 8INAF−IAPS, Via Fosso del Cavaliere 100, I-00133 Roma, Italy
9Centre for Extragalactic Astronomy, Department of Physics, Durham University, South Road, Durham DH1 3LE, UK 10Institute for Astronomy, University of Edinburgh, Royal Observatory, Blackford Hill, Edinburgh EH9 3HJ, UK
2 May 2018
ABSTRACT
We present a catalogue of ALMA flux density measurements of 754 calibrators ob-served between August 2012 and September 2017, for a total of 16,263 observations in different bands and epochs. The flux densities were measured reprocessing the ALMA images generated in the framework of the ALMACAL project, with a new code de-veloped by the Italian node of the European ALMA Regional Centre. A search in the online databases yielded redshift measurements for 589 sources (∼78 per cent of the total). Almost all sources are flat-spectrum, based on their low-frequency spectral in-dex, and have properties consistent with being blazars of different types. To illustrate the properties of the sample we show the redshift and flux density distributions as well as the distributions of the number of observations of individual sources and of time spans in the source frame for sources observed in bands 3 (84−116 GHz) and 6 (211−275 GHz). As examples of the scientific investigations allowed by the catalogue we briefly discuss the variability properties of our sources in ALMA bands 3 and 6 and the frequency spectra between the effective frequencies of these bands. We find that the median variability index steadily increases with the source-frame time lag increasing from 100 to 800 days, and that the frequency spectra of BL Lacs are sig-nificantly flatter than those of flat-spectrum radio quasars. We also show the global spectral energy distributions of our sources over 17 orders of magnitude in frequency. Key words: galaxies: photometry – galaxies: active – galaxies: abundances – sub-millimetre: galaxies
1 INTRODUCTION
The Atacama Large Millimeter/submillimeter Array (ALMA) calibrators comprise many hundreds of bright, compact radio sources, distributed over about 85 per cent of the sky.
Every ALMA science project includes observations of calibrator sources (mostly bright quasars in the mm and sub-mm regime) to set the flux density scale, to measure the
bandpass response, and to calibrate amplitude and phase of the visibilities of the science targets (Fomalont et al. 2014). Such observations represent a significant fraction (gen-erally .30 per cent) of each execution block (EB). If the calibrator is a phase calibrator, it is observed many times during the same EB. If it is a bandpass or an amplitude cal-ibrator, it is typically observed once per EB. Therefore each calibrator can be observed several times, on different dates, in different ALMA bands and array configurations, for one or multiple science projects.
2
M. Bonato et al.
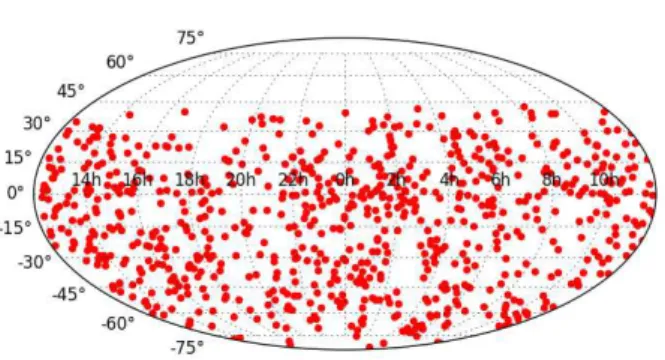
Figure 1.Mollweide plot showing the spatial distribution of the ALMACAL calibrators considered in this paper.
in the ALMA Science Archive have been exploited to carry out a novel, wide and deep (sub-)millimetre survey, AL-MACAL (Oteo et al. 2016), and to investigate detected sources of special interest (Oteo et al. 2017; Klitsch et al. 2017). The ALMACAL survey, in fact, takes advantage of the high sensitivity reached in the fields of ALMA calibrator observations to blindly extract a multi-band, multi-epoch survey of dusty star forming galaxies. Together with this primary goal, the same observations offer a unique oppor-tunity to investigate spectral behaviour and variability of a large sample of bright extragalactic sources, the calibrators themselves, mostly AGNs across the whole (sub-)millimetric band.
In this paper we present a catalogue of observations of the ALMA calibrators collected, so far, for the ALMACAL project purposes. Their multi-epoch, multi-frequency mea-surements over a poorly explored spectral region constitute a rich database, well-suited for a variety of scientific investi-gations, some of which will be more extensively detailed in future papers of our collaboration.
This paper is structured as follows. In Section2, the cat-alogue is introduced. An account of the source classification is given in Section3, where we also compare the frequency spectra of BL Lacs and flat-spectrum radio quasars (FS-RQs). In Section4, we describe the main properties of the catalogue and, as an example of its scientific exploitation, we briefly discuss the variability properties of our sources in ALMA bands 3 and 6. In Section 5, we present the global spectral energy distributions (SEDs) of sources, built collect-ing data from online databases. Finally, Section6contains a short summary of the paper.
2 THE SAMPLE
The catalogue consists of continuum measurements of cali-brators, obtained during the majority of the ALMA science observations between August 2012 and September 2017. In total, we collected 16,263 observations1 of 754 calibrators.
Being a collection of data from a heterogeneous sample of
1 From the initial sample, we removed ∼1.7 per cent of the images
that showed anomalies.
Figure 2. Pie chart showing the fractions of our ALMACAL calibrators in the different classes of classification (see Sect.3).
science projects, our observations vary within a wide spec-trum of different frequency setups, array configurations and integration times.
The details of calibration and imaging for the AL-MACAL data are described byOteo et al.(2016). Here we summarise a few pieces of information, useful for a compre-hensive description of the presented catalogue. For our pur-poses we considered all the ALMA projects in the epochs 2012-2017 and, in them, the extragalactic calibrators at any observing band. The full data deliveries available in the ALMA archive were retrieved for datasets for which the pro-prietary period had expired, while only the calibrator data was considered for the remaining projects, after an official re-quest through an ALMA Helpdesk ticket. Calibration scripts produced during the ALMA Quality Assessment procedure and distributed through the archive were run to generate the calibration tables that were applied to all the calibra-tors (in some cases differently with respect to what usually done for the archived data, for which, expecially in the first observing cycles, tables were applied only to science targets and phase calibrators). Data were self-calibrated taking ad-vantage of the presence of the calibrator in the phase center and images are produced with the calibrator present and subtracted (in the visibility domain). The latter are used in the ALMACAL collaboration to investigate the background looking for dusty galaxies. The former are used in the present paper to investigate the calibrator population properties.
For the calibrators, the flux densities were uniformly measured from the ALMA images2 using a new code
de-veloped by the Italian node of the European ALMA Re-gional Centre (ARC). This software is part of a suite of tools aimed at easing the ALMA Science Archive mining: the ALMA Keyword Filler tool package (AKF;Liuzzo et al. 2018) and the Keywords of Astronomical FITS-images Ex-plorer (KAFE;Burkutean et al. 2018). The AKF codes are particularly useful to compare image products or to iden-tify the images to be selected for several scientific purposes. KAFE is a web-based FITS image post-processing analy-sis tool. It exploits AKF and complements selected FITS files with metadata based on a uniform image analysis ap-proach while also offering advanced image diagnostic plots.
2 We derived the flux densities through an image analysis, instead
of simply using model fit values, because the former approach provides robust measurements for both resolved and non-resolved sources, while model fit flux densities are reliable for non-resolved observations only
Table 1.Example of the catalogue content. The complete catalogue is available as supplementary material in the electronic version of the paper and on the website of the Italian ARC (http://arc.ia2.inaf.it)
ALMA name Class.1 z RA [deg] DEC [deg] Flux density [Jy] Error2[Jy] band ν [GHz] Date of obs.3
J1215-1731 4 0.669 183.9448 −17.5293 0.8602 0.043 3 95.4394 2013/03/16/07:19:31 0.3067 0.0153 7 340.686 2013/12/15/08:39:49 0.3017 0.0151 7 340.686 2013/12/15/10:03:31 0.7859 0.0393 3 95.4366 2014/04/03/07:14:35 0.7464 0.0373 3 95.4364 2014/04/05/03:54:26 0.7704 0.0385 3 95.4363 2014/04/05/05:12:34 0.4389 0.0219 6 225.342 2014/06/04/23:04:00 0.4141 0.0207 6 225.342 2014/06/05/01:11:37 0.7479 0.0374 3 112.496 2014/07/19/21:26:25 0.3421 0.0171 6 225.347 2014/08/16/17:37:15 0.3828 0.0191 6 225.347 2014/08/17/22:00:12 0.8924 0.0446 3 87.7719 2014/08/31/17:44:11 0.8265 0.0413 3 96.2087 2014/08/31/18:48:36 0.299 0.015 6 236.054 2016/03/03/04:19:24 0.3266 0.0163 6 234.085 2016/03/03/05:08:35 0.2093 0.0105 7 336.465 2016/09/15/14:43:43 0.1941 0.0097 7 336.465 2016/09/15/16:11:47 0.286 0.0143 6 226.385 2016/09/17/14:14:40 0.2708 0.0135 6 226.384 2016/09/17/15:28:17 0.276 0.0138 6 226.385 2016/09/18/13:53:52 0.255 0.0127 6 226.386 2016/09/22/17:58:47 0.3933 0.0197 4 138.666 2016/10/29/12:16:54 0.2432 0.0122 6 242.138 2016/11/11/11:15:06 0.264 0.0132 6 237.584 2016/11/19/12:35:00 0.4141 0.0207 4 138.672 2016/12/24/07:40:12 0.3785 0.0189 6 242.127 2017/03/18/02:30:48 0.2491 0.0125 7 348.498 2017/07/23/22:52:04 0.3571 0.0179 6 237.549 2017/08/08/20:29:36 ... ... ... ... ... ... ... ... ... ...
Notes.1 Classification: 1=Flat-spectrum radio quasar (FSRQ); 2=BL Lac; 3=BL Lac-galaxy dominated; 4=Blazar uncertain type;
5=BL Lac candidate; 6=Steep spectrum; 7=Uncertain.
2 The uncertainty is given by summing in quadrature the r.m.s. and a typical ALMA calibration error equal to 5 per cent of
the flux (see text).
3 Observing time in the format [YYYY/MM/DD/hh:mm:ss], UTC time.
Figure 3.On the left, high- versus low-frequency spectral indices of FSRQs and BL Lacs of our sample. αlow is calculated between
1.4 GHz (or 0.84 GHz for sources outside the NVSS area) and 4.8 GHz; αhighis between the effective frequencies (listed in Table1) in
4
M. Bonato et al.
KAFE’s applicability to multi-instrument images in the ra-dio to sub-mm wavelength domain makes it ideal for data sample studies requiring uniform data diagnostic criteria.
After the estimation of the r.m.s. (σ) in an image, the code masks the pixels with a flux density below 5 σ and obtains the source flux density by integrating over the re-maining pixels. This is enough to cope both with isolated point-like and extended sources, definition which strongly depends on the observing strategy and phase decoherence and might vary for our targets from one observation to the other.
The number of observations in the different ALMA bands are: 5100 in band 3 (84−116 GHz), 639 in band 4 (125−163 GHz), 6319 in band 6 (211−275 GHz), 3584 in band 7 (275−373 GHz), 393 in band 8 (385−500 GHz), 220 in band 9 (602−720 GHz) and 8 in band 10 (787−950 GHz). The ALMA measurements of the 754 calibrators are included as supplementary material in the electronic ver-sion of the paper and on the website of the Italian ARC
(http://arc.ia2.inaf.it). The catalogue gives the ALMA
name, the source classification, its redshift (if available), the equatorial coordinates (J2000), the flux density measured in each observation with its error, the effective observing frequency, and the date and UTC time of the observation. The error is essentially given by the uncertainty in the flux density calibration (errors due to instrumental noise are typ-ically smaller by more than two orders of magnitudes); we adopt a calibration uncertainty of 5 per cent (E. Fomalont, private communication)3. An example of the content of the
catalogue is given in Table1. The coordinates are the aver-age between the positions measured in the different ALMA observations.
We have recovered the redshifts of 589 sources (∼78 per cent of the total), using the Astroquery4affiliated
pack-age of astropy5on the NASA/IPAC Extragalactic database6
(NED), VizieR7 and SIMBAD8databases. Redshifts for 256
calibrators were provided by Mahony et al. (2011). When-ever multiple redshifts of the same source were found, we give the median value.
In Fig.1, we show the Mollweide projection of the po-sitions of the ALMA calibrators, obtained through KAFE.
3 SOURCE CLASSIFICATION
Most sources of our catalogue (489, i.e. ≃67 per cent) are in-cluded in the 5th edition of the Roma Multi-frequency Cat-alogue of Blazars9 (BZCAT;Massaro et al. 2009). BZCAT
sources are divided into 5 sub-classes: FSRQs, BL Lacs, BL Lacs-galaxy dominated, Blazars of uncertain type, BL Lac candidates.
3 The debate about the precise value of the calibration
uncer-tainty is still open in the ALMA community. Our results about the differences in flux density of the different calibrators for short time spans (see Sect.4) support the adopted 5 per cent level.
4 https://astroquery.readthedocs.io/en/latest/ 5 http://www.astropy.org/ 6 https://ned.ipac.caltech.edu/ 7 http://vizier.u-strasbg.fr/viz-bin/VizieR 8 http://simbad.u-strasbg.fr/simbad/ 9 http://www.ssdc.asi.it/bzcat/
Figure 4. Flux density distributions of sources detected in ALMA band 3 (solid blue line) and band 6 (dashed red line).
Figure 5.Redshift distributions of the sources detected in ALMA band 3 (solid blue line) and band 6 (dashed red line).
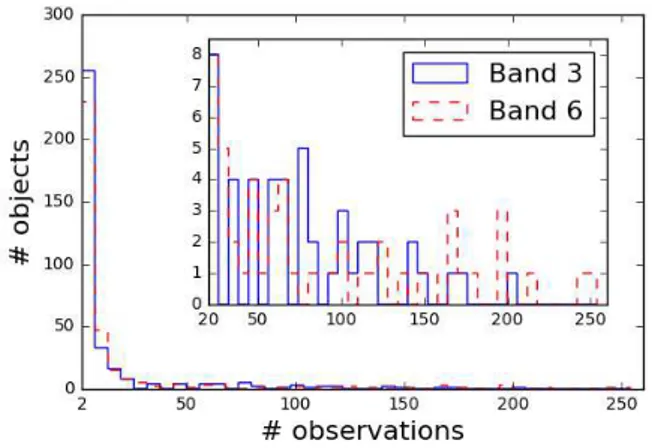
Figure 6.Distributions of the number of observations per source in ALMA band 3 (solid blue line) and in band 6 (dashed red line); bin width = 6. We only considered sources with ≥2 observations. In the zoomed-up inset plot, we show the portion of ≥20 obser-vations only.
Figure 7. Distributions of the rest-frame time spans of source observations (i.e. ∆t = [tlast observation−tfirst observation]/[1 + z])
in ALMA band 3 (solid blue line) and in band 6 (dashed red line). We only considered sources having redshift measurements and ≥2 observations.
We split the remaining 265 sources into the two clas-sical sub-populations of steep-spectrum and flat-spectrum sources. As usual, such classification is based on the low-frequency (between ≃ 1 and ≃ 5 GHz) spectral index, αlow,
adopting αlow= −0.5 (Sν∝ να) as the boundary value. The
flat-spectrum population is essentially made by blazars. We computed αlowusing the 1.4 GHz flux densities from
the NRAO VLA Sky Survey (NVSS; Condon et al. 1998) complemented with those at 843 MHz from the Sydney Uni-versity Molonglo Sky Survey (SUMSS; Mauch et al. 2003), combined with those at 4.85 GHz from the Green Bank 6 cm (GB6;Gregory et al. 1996) or from the Parkes-MIT-NRAO (PMN;Griffith & Wright 1993) survey catalogues.
The low frequency spectral index could be computed for all but 13 sources (out of 265), that were classified as “uncertain”. Sources with αlow < −0.5 were classified as
steep-spectrum, provided they did not show clear variability or γ-ray emission. Only 10 sources satisfy the criteria for a steep-spectrum classification.
The overwhelming majority, 731 sources, i.e. ∼97 per cent of the sample, are classified as blazars (since they belong to the BZCAT catalogue or they fulfill the criteria presented above). This includes also those with αlow< −0.5 but with
statistically significant variability and/or γ-ray emission (31 sources). We classify as “Blazar uncertain type” our blazars without a BZCAT classification.
The classification assigned to each source is given in the second column of Table1. The pie chart (Fig.2) illustrates the numerical proportions of sources in the different classes. The classical physical models of blazars predict a steepening of their radio spectra at millimeter wave-lengths (Kellermann 1966; Blandford & K¨onigl 1979). Statistical evidence of such steepening has been re-ported by several authors (Gonz´alez-Nuevo et al. 2008;
Planck Collaboration XIII 2011; Planck Collaboration XV
2011;Planck Collaboration XLV 2016). The ALMA data
al-low us to check this prediction on a much larger sample than was possible before.
Tucci et al. (2011) went one step further. Their most
successful physical evolutionary models of radio sources
en-tail different distributions of break frequencies (the frequen-cies where the spectra steepen), for BL Lacs and FSRQs. They argue that BL Lacs have substantially higher break frequencies, implying that their synchrotron emission comes from more compact regions. Their best model, C2Ex, that successfully fits number counts and spectral index distribu-tions of extragalactic radio sources over the 5–220 GHz fre-quency range, predicts, for bright blazars (S5GHz > 0.1 Jy,
like sources in our sample), that the break frequencies of most FSRQs are well below 100 GHz while those of most BL Lacs are well above this frequency (cf. their Fig. 7). The ALMA data are well suited to test this prediction.
The left panel of Fig.3shows the distribution of high-frequency spectral indices (αhigh, from the effective
frequen-cies of ALMA band 3 [84−116 GHz] to those of band 6 [211−275 GHz]) versus αlow for FSRQs and BL Lacs. The
right panel shows the distributions of such αhighindices.
Most low-frequency spectral indices are in the range from −0.5 to 0.8, while most of the high-frequency ones range from −1.3 to 0. Within these ranges there is no corre-lation between the high- and low-frequency spectral indices. The median spectral indices substantially steepen from low to high frequencies. For FSRQs we have αlow,median≃ 0.11
(with first and third quartile values of about −0.10 and 0.29) and αhigh,median≃ −0.65 (first and third quartile values of
about −0.85 and −0.51). For BL Lacs αlow,median ≃ 0.05
(first and third quartile values of about −0.18 and 0.22) and αhigh,median≃ −0.48 (first and third quartile values of about
−0.61 and −0.33). The global (FSRQ + BL Lac) median high-frequency spectral index αhigh,median ≃ −0.63 (with
first and third quartile values of about −0.80 and −0.45) is in good agreement with those found byMassardi et al.(2016) for the Planck –ATCA Co-eval Observations (PACO) bright sample: αmedian,100−143 GHz = −0.67 (with first and third
quartile values of −0.94 and −0.45); αmedian,143−217 GHz =
−0.57 (with first and third quartile values of −0.83 and −0.45).
There is thus evidence of a flatter median αhigh of BL
Lacs compared to FSRQs. The statistical significance of the difference was estimated using the two-sample Kolmogorov-Smirnov (KS) test, i.e. computing
X2= 4 D2 mn
m + n (1) where D is the KS statistics, that is the largest discrepancy between the cumulative distributions of high-frequency spec-tral indices of the two source populations, FSRQs and BL Lacs, comprising m = 117 and n = 36 sources, respectively. We find D = 0.346 corresponding to a 0.2 per cent prob-ability that the two populations are drawn from the same parent distribution. A simpler, although less rigorous, illus-tration of the significance of the difference can be obtained considering that the ratio of the numbers of FSRQs in the bins −1.1 . αhigh .−0.5 and −0.5 . αhigh .0) is ∼ 2.4
(the FSRQs in the two bins are 71 + 30 = 101; see the right panel of Fig.3). If the 15 + 20 = 35 BL Lacs were extracted from the same parent population we would expect a similar ratio between the two bins, i.e. the expected number of BL Lacs in the first bin would be 71 × (35/101) ∼ 24.6 and in the second bin would be 30 × (35/101) ∼ 10.4. Based on the Poisson statistics, the probability of getting in the second
6
M. Bonato et al.
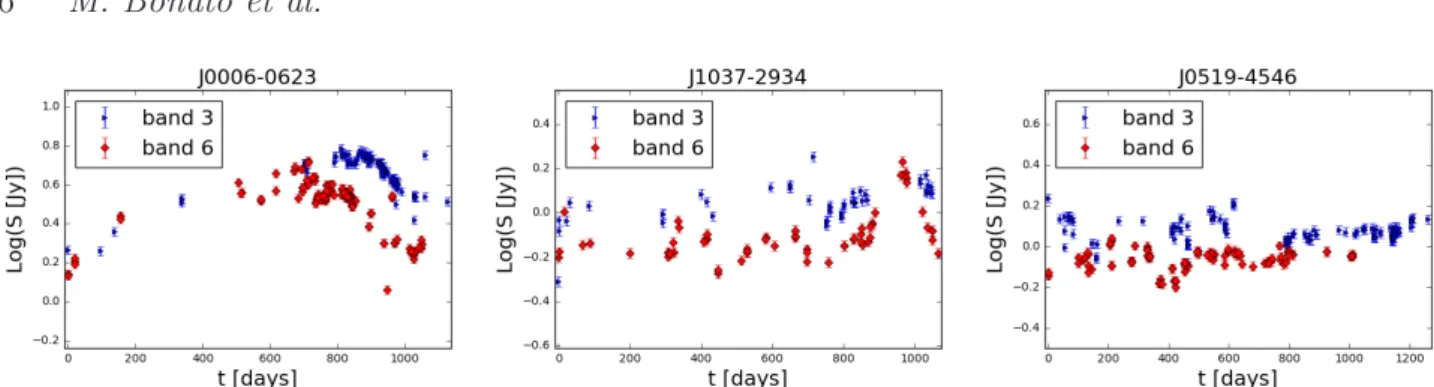
Figure 8.Light curves of three of the most frequently observed sources in our sample. The time is in the source frame. All three sources show significant variability but with remarkably different flare morphology. In the case of J0006−0623 ALMA observations have monitored the entire duration of a big flare, lasting for years, showing that it had a similar amplitude in band 6 and in band 3 but a shorter duration in band 6. J1037−2934 shows, in both bands, a sequence of relatively short duration, moderate amplitude flares, the last of which, best monitored in band 6, is the most prominent one. The rise times of the flares are generally shorter than the decay times, consistent with the results byNieppola et al.(2009). Also J0519−4546 shows a sequence of moderate amplitude, short flares, but they are followed by a relatively quiescent period.
bin 20 objects when 10.4 are expected is ≃ 0.3 per cent, close to the result of the KS test.
The statistically significant difference between the dis-tributions of αhigh for the two populations might be
con-sistent with higher break frequencies for BL Lacs compared to FSRQs, as suggested by the Tucci et al. (2011) model. HoweverPlanck Collaboration XLV(2016) did not find sig-nificant differences in the break frequencies of the two popu-lations for their complete flux-density-limited sample of 104 extragalactic radio sources detected by the Planck satellite, but reported average spectral indices above the break fre-quency significantly steeper for FSRQs than for BL Lacs.
4 PROPERTIES OF THE SAMPLE
The flux density distributions of sources in the two most frequented ALMA bands (bands 3 and 6) are shown in Fig.4. They extend from ∼1 mJy to ∼15 Jy, with a peak at ∼0.2 Jy. For comparison, the minimum flux densities of sources in the “extragalactic zone” (|b| > 30◦) listed in
the Second Planck Catalogue of Compact Sources (PCCS2;
Planck Collaboration XXVI 2016) are 232 mJy at 100 GHz
and 127 mJy at 217 GHz. Therefore, the ALMA observations reach much fainter flux densities than the Planck ones, but there is a large overlap between the two sets of observations. As mentioned in Sect.2we have recovered redshift mea-surements for ≃78 per cent of our sample (589 sources). The redshift distributions of sources detected in bands 3 and 6 are shown in Fig.5. Both distributions peak at 0.5 < z < 1 and have tails extending up to z ∼ 3.5.
Figure6shows the distribution of the number of obser-vations of a given source, again in bands 3 and 6, for sources with ≥2 observations. The distributions peak at the lowest bin (2-8 measurements) but there is a significant number of sources with tens of measurements, up to ∼ 250; sources with ≥20 observations are 46 in band 3 and 52 in band 6.
The time span distribution of measurements in the source frame (∆tsource= ∆tobserver/(1 + z), where ∆tobserver
is the time between the first and the last observation) is shown in Fig.7. We excluded all the sources lacking redshift measurements. Although for most sources the time span is
relatively short (less than a few hundreds of days), for some sources observations cover a few years (in the source frame); sources with ∆tsource≥ 2 years are 20 in band 3 and 28 in
band 6.
The light curves in bands 3 and 6 of three of the most frequently observed sources are shown in Fig.8. Monitoring of blazars is important to understand which mechanisms drive their violent variability and what is the duty cycle of their activity. The interest on multi-frequency blazar moni-toring has gained momentum since the launch of the Fermi Gamray Space Telescope. In fact the overwhelming ma-jority of detected extragalactic γ-ray sources are blazars and Fermi has gathered spectacular γ-ray light curves of hun-dreds of them (Abdo et al. 2010;Abdollahi et al. 2017). The poorly explored few-mm to sub-mm spectral region covered by ALMA observations is important in this context since flux densities in this region appear to be particularly well correlated with those at 1 GeV (Fuhrmann et al. 2016).
An obvious use of multiple observations is the calcula-tion of the variability index (V I), defined as (Sadler et al.
2006):
V I = 100 hSi ×
r P[Si− hSi]2−P(σi)2
N (2)
where Si and σi are the flux density measurements of a
source measured in a given band and the associated uncer-tainties, N is the number of measurements, and hSi is the mean flux density.
Obviously, the variability index can be reliably mea-sured only if the amplitude of flux density variations is sub-stantially larger than the 5 per cent calibration uncertainty, although Eq. (2) gives values of the variability index <5 per cent. Reliable variability indices are measured for 31 out of 41, 30/33, 29/33 and 26/26 (band 3) and 25/30, 36/39, 35/39 and 37/37 (band 6) sources for time spans of 100, 200, 400 and 800 days (within ±30 per cent, in the source frame), respectively. All sources with ≥ 2 measurements on these timescales are included.
In Table2the median, first quartile and third quartile values of the VI for the different source frame timescales and in the two different bands are listed.
Applying the two-sample KS test to the VI distribu-tions of the 100 and 800 days of timescales, we find that the
Figure 9. Examples of SEDs of our sample reconstructed using the collection of photometric data described in Sect.5: ‘NED’ from the NASA/IPAC Extragalactic database (https://ned.ipac.caltech.edu/); ‘AT20G’ fromMurphy et al.(2010); ‘PCCS2’ from Planck Collaboration XXVI(2016); ‘PACO’ fromMassardi et al.(2016); ‘GLEAM’ fromHurley-Walker et al.(2017); ‘CRATES’ from Healey et al.(2007); ‘ALMA’ are the new observations presented in this paper. The complete SED collection for our sample is available on the website of the Italian ARC (http://arc.ia2.inaf.it).
Band Time span VImedian VI1stquartile VI3rdquartile
[days] [%] [%] [%] 3 100 5.9 1.7 11.8 200 12.8 5.7 24.3 400 14.2 4.5 24.8 800 23.9 13.9 32.8 6 100 8.1 4.4 12.2 200 11.9 7.0 20.2 400 14.3 8.1 25.6 800 21.3 18.6 33.4
Table 2.Median, first quartile and third quartile values of the variability indices for 4 different source frame time spans (100, 200, 400 and 800 days) in ALMA band 3 and 6.
probability that the two sub-samples are drawn from the same parent distribution is extremely low (<0.1 per cent in both bands, with D=0.588 in band 3 and D=0.732 in band 6). This is a direct consequence of the fact that the char-acteristic timescale of blazar variability in blazar sources is ∼3 years (see e.g.Nieppola et al. 2009).
Measured flux densities of the same source for short time spans are expected to be only weakly affected by vari-ability. Differences among such measurements are therefore an estimator of systematic errors that afflict our observa-tions, and primarily of the calibration error. The median absolute values of differences among measurements in bands 3 and 6 done within 30 days in the source frame are of ≃ 4 per cent for band 3 and of ≃ 5 per cent for band 6, consistent with the adopted calibration error of 5 per cent.
5 GLOBAL SPECTRAL ENERGY
DISTRIBUTIONS (SEDS) OF SOURCES As mentioned in Sect.3, our source classification is based on external data. For each source in our sample, we have col-lected the photometric data available on the NASA/IPAC Extragalactic Database (NED) using Astroquery with a search radius of 10 arcsec and excluding Galactic sources.
The NED data were complemented by cross-matching our catalogue with: the Australia Telescope 20GHz Sur-vey Catalog (AT20G; Murphy et al. 2010), the PCCS2
(Planck Collaboration XXVI 2016), the PACO catalogue
(Massardi et al. 2016), the GaLactic and Extragalactic
All-sky MWA survey (GLEAM;Hurley-Walker et al. 2017), the CRATES survey (Healey et al. 2007).
The cross-matching was done using the following search radii: 5 arcsec around the ALMA positions for the AT20G catalog; 16, 13.5, 6.5, 4.85, 3.6, 2.45, 2.45, 2.35 and 2.1 ar-cmin (i.e. half FWHM) for the 30, 44, 70, 100, 143, 217, 353, 545 and 857 GHz PCCS2 catalogues, respectively; 20 arcsec for the GLEAM catalog; 70 arcsec for the CRATES one. For the PACO catalog we exploited the AT20G identifica-tions byMassardi et al.(2016). We considered PCCS2 data only for sources with |b| > 10◦to avoid wrong identifications
(with Galactic sources). In all the cases, the search yielded a unique identification.
In this way we obtained SEDs extending over 17 or-ders of magnitude, from radio to γ-rays. The complete SED collection is available on the website of the Italian ARC
(http://arc.ia2.inaf.it). Some examples are shown in
Fig.9. We found γ-rays measurements for 248 sources (∼33 per cent of the sample).
8
M. Bonato et al.
6 SUMMARY
We have presented a catalogue of ALMA flux density mea-surements of calibrators, observed between August 2012 and September 2017, in the framework of the ALMACAL project. The ALMACAL images were reprocessed using a new code developed by the Italian node of the European ALMA Regional Centre. This has yielded 16,263 flux den-sity measurements in different ALMA bands and at different epochs of 754 calibrators. A search in online databases has yielded redshifts for 589 sources (∼78 per cent of the total). Most (489, i.e. ≃67 per cent) of our sources are clas-sified as blazars of various types in the BZCAT catalogue. Almost all of the remaining sources have properties (flat low-frequency radio spectrum, clear variability in different bands, γ-ray emission) consistent with a blazar classifica-tion. In total, ∼97 per cent of the sources are classified as blazars.
To illustrate the properties of the sample, in view of its exploitation for scientific investigations, we have focussed on the most frequented ALMA bands, i.e. bands 3 and 6. For these bands we have shown the redshift and flux density distributions of catalogued sources, the distribution of the number of observations of individual sources and of time spans in the source frame.
Several sources have tens of measurements in a band, covering several years. As an example of the variety of sci-entific investigations allowed by the catalogue, we have pre-sented unprecedented band 3 and 6 light curves of three sources and estimates of the variability indices on timescales of 100, 200, 400 and 800 days in the same bands.
Through an analysis of flux density differences for short time spans, in bands 3 and 6, we have found that the sys-tematic errors are consistent with the adopted calibration error of 5 per cent.
We have also found that the ALMA data show highly significant evidence of a difference between the high-frequency (ν ∼> 100 GHz) spectra of FSRQs and BL Lacs: at wavelengths a few mm the average spectra of BL Lacs are flatter than those of FSRQs. This is expected if the synchrotron emission of BL Lacs comes from more com-pact regions than the emission of FSRQs, as argued, e.g.,
byTucci et al.(2011).
Finally, by collecting data from online databases, we have reconstructed the SEDs of our sources over 17 orders of magnitude in frequency. Both the catalogue and the SEDs are available to the community.
ACKNOWLEDGEMENTS
We thank Ian Smail for his useful comments. We are in-debted to Edward Fomalont for enlightening discussions, highly valuable suggestions and for his extensive work, to-gether with Ruediger Kneissl and Antonio Hales, on ALMA calibrator catalogs and calibration error estimation. This paper and the AKF and KAFE development are part of the activities for the ALMA Re-Imaging Study approved in the framework of the 2016 ESO Call for Development Studies for ALMA Upgrade (PI: Massardi). The study ac-knowledges partial financial support by the Italian Minis-tero dell’Istruzione, Universit`a e Ricerca through the grant
‘Progetti Premiali 2012 - iALMA’ (CUP C52I13000140001). GDZ acknowledges support from ASI/INAF agreement n. 2014-024-R.1 for the Planck LFI Activity of Phase E2 and from the ASI/Physics Department of the university of Roma–Tor Vergata agreement n. 2016-24-H.0 for study activities of the Italian cosmology community. MN ac-knowledges support from the European Union’s Horizon 2020 research and innovation programme under the Marie Sk lodowska-Curie grant agreement No 707601. This research has made use of the NASA/IPAC Extragalactic Database (NED), which is operated by the Jet Propulsion Laboratory, California Institute of Technology, under contract with the National Aeronautics and Space Administration.
REFERENCES
Abdo A. A., et al., 2010,ApJ,722, 520 Abdollahi S., et al., 2017,ApJ,846, 34 Blandford R. D., K¨onigl A., 1979,ApJ,232, 34 Burkutean S., et al., 2018,JATIS, submitted
Condon J. J., Cotton W. D., Greisen E. W., Yin Q. F., Perley R. A., Taylor G. B., Broderick J. J., 1998,AJ,115, 1693 Fomalont E., et al., 2014, The Messenger,155, 19
Fuhrmann L., et al., 2016,A&A,596, A45
Gonz´alez-Nuevo J., Massardi M., Arg¨ueso F., Herranz D., Tof-folatti L., Sanz J. L., L´opez-Caniego M., de Zotti G., 2008, MNRAS,384, 711
Gregory P. C., Scott W. K., Douglas K., Condon J. J., 1996, ApJS,103, 427
Griffith M. R., Wright A. E., 1993,AJ,105, 1666
Healey S. E., Romani R. W., Taylor G. B., Sadler E. M., Ricci R., Murphy T., Ulvestad J. S., Winn J. N., 2007,ApJS,171, 61 Hurley-Walker N., et al., 2017,MNRAS,464, 1146
Kellermann K. I., 1966,ApJ,146, 621
Klitsch A., Peroux C., Zwaan M. A., Smail I., Oteo I., Biggs A. D., Popping G., Swinbank A. M., 2017, preprint, (arXiv:1712.00014)
Liuzzo E., et al., 2018,ALMA memo, submitted Mahony E. K., et al., 2011,MNRAS,417, 2651
Massardi M., Bonaldi A., Bonavera L., De Zotti G., Lopez-Caniego M., Galluzzi V., 2016,MNRAS,455, 3249
Massaro E., Giommi P., Leto C., Marchegiani P., Maselli A., Perri M., Piranomonte S., Sclavi S., 2009,A&A,495, 691
Mauch T., Murphy T., Buttery H. J., Curran J., Hunstead R. W., Piestrzynski B., Robertson J. G., Sadler E. M., 2003,MNRAS, 342, 1117
Murphy T., et al., 2010,MNRAS,402, 2403
Nieppola E., Hovatta T., Tornikoski M., Valtaoja E., Aller M. F., Aller H. D., 2009,AJ,137, 5022
Oteo I., Zwaan M. A., Ivison R. J., Smail I., Biggs A. D., 2016, ApJ,822, 36
Oteo I., Zwaan M. A., Ivison R. J., Smail I., Biggs A. D., 2017, ApJ,837, 182
Planck Collaboration XIII 2011,A&A,536, A13 Planck Collaboration XLV 2016,A&A,596, A106 Planck Collaboration XV 2011,A&A,536, A15 Planck Collaboration XXVI 2016,A&A,594, A26 Sadler E. M., et al., 2006,MNRAS,371, 898
Tucci M., Toffolatti L., de Zotti G., Mart´ınez-Gonz´alez E., 2011, A&A,533, A57
This paper has been typeset from a TEX/LaTEX file prepared by the author.

![Figure 7. Distributions of the rest-frame time spans of source observations (i.e. ∆t = [t last observation − t first observation ]/[1 + z]) in ALMA band 3 (solid blue line) and in band 6 (dashed red line).](https://thumb-eu.123doks.com/thumbv2/123dokorg/8102445.124954/6.892.83.415.144.374/figure-distributions-source-observations-observation-observation-alma-dashed.webp)