1278
=
How efficient is government in providing public services? The answer to this question should inform our decision of whether to provide the service and in what form. In particular, it should impinge on the choice between direct public provision and outsourcing to private contractors (Oliver Hart, Andrei Shleifer, and Robert W. Vishny 1997).
A key related question is what determines how efficiently a certain public service is provided. This paper proposes a distinction between active waste and passive waste in determining the cost of public services. While this dichotomy has been present, in various forms and with dif-ferent names, in discussions of the role of government at least since James M. Buchanan and Gordon Tullock (1962, ch. 18), our contribution is to develop a formal framework and provide quantitative evidence.
Active waste is such that its presence entails direct or indirect benefit for the public decision maker. In other words, reducing waste would reduce the utility of the decision maker. The clas-sical example is corruption in procurement, whereby the public official inflates the price paid for a certain good in exchange for a bribe. Active waste is perceived to be a key issue in public management. For some, it is even the key issue. It makes, for instance, the top-four list on the World Bank’s Challenge to Reduce World Poverty: “Combat corruption, or there is not much that can be done that is effective.”
Passive waste, in contrast, is such that its presence does not benefit the public decision maker. In other words, reducing waste would (weakly) increase the utility of the decision maker. Passive waste can derive from a variety of sources. One is that public officials simply do not possess the skills to minimize costs. A second is that public officials have no incentive to minimize
Active and Passive Waste in Government Spending:
Evidence from a Policy Experiment
By Oriana Bandiera, Andrea Prat, and Tommaso Valletti*
We propose a distinction between active and passive waste as determinants of the cost of public services. Active waste entails utility for the public decision maker, whereas passive waste does not. We analyze purchases of standard-ized goods by Italian public bodies and exploit a policy experiment associated with a national procurement agency. We find that: (i) some public bodies pay systematically more than others for equivalent goods; (ii) differences are cor-related with governance structure; (iii) the variation in prices is principally due to variation in passive rather than active waste; and (iv) passive waste accounts for 83 percent of total estimated waste. (JEL H11, H57, H83)
*Bandiera: Department of Economics, London School of Economics, Houghton Street, London WC2A 2AE, UK (e-mail: [email protected]); Prat: Department of Economics, London School of Economics, Houghton Street, London WC2A 2AE, UK (e-mail: [email protected]); Valletti: Business School, Imperial College London, South Kensington Campus, London SW7 2AZ, UK, and Department of Economics, University of Rome “Tor Vergata” (e-mail: t.valletti@ imperial.ac.uk). We thank two anonymous referees, Tim Besley, Allan Collard-Wexler, Steven Kelman, Clare Leaver, Marco Manacorda, Nicola Persico, Imran Rasul, Philipp Schmidt-Dengler, Gustavo Piga, Giancarlo Spagnolo, Scott Stern, and audiences at Bologna, Brunel, Caltech, Columbia, Harvard-MIT, IFS, Kellogg, Namur, NBER, NYU, Oxford, Pompeu Fabra, Penn, Princeton, Rome, Rotterdam, Royal Holloway, and USC. This paper is part of the Polarization and Conflict Project CIT-2-CT-2004-506084 funded by the EC-DG Research Sixth Framework Programme.
costs. Another potential cause of passive waste, following Steven Kelman (1990, 2005), is that excessive regulatory burden may make procurement cumbersome and increase the average price that the public body pays. A stark example is provided by the procurement system in use by the US military. Under this system, tender documents are excruciatingly detailed, like the 26-page description of chocolate cookies or brownies.1 More important, the requirement that all char-acteristics be specified ex ante makes it difficult to use existing commercial production lines, greatly increasing fixed costs.
Identifying whether waste is active or passive has important policy implications. While in a first-best world both active and passive waste would be kept in check by making public officials residual claimants of the value of the public body they manage, such high-powered incentives are often unfeasible because of risk aversion and/or limited liability. Compensating public officials for the risk they would face if their pay were to vary one-to-one with the value of the public body would be extremely costly. Similarly, limited liability would make high-powered incentives impossible due to the large difference between the public officials’ wealth and the value of public bodies. In addition, some of the objectives of public bodies are difficult to measure, especially quality, given that the output is not sold. Bengt Holmström and Paul Milgrom (1991) show that a principal who faces an agent with multiple tasks, some of which cannot be measured, may find it optimal to eschew high-powered incentives even on the tasks that can be measured, and instead restrict the set of actions that the agent takes.2
In a second-best world, delegation becomes a key issue: what decisions should the agent be allowed to take? A robust lesson from the optimal delegation literature (e.g., Ricardo Alonso and Niko Matouschek 2008) is that the agent should have more discretion when his preferences are close to the principal’s. Active waste is a sign of preference misalignment: the agent benefits from waste because she acquires a share of the surplus. Indeed, the standard solution is to call for stricter rules and external controls. In contrast, the same kind of policy can have detrimental effects if the key problem is passive waste due to regulatory burden, as in Kelman’s (1990, 2005) assessment of waste in the US federal government. Fighting this kind of passive waste requires giving public officials more discretion, not less.
Identifying active and passive waste from observed costs of public services is challenging, as both forms of waste result in high costs and are thus observationally equivalent. Our identi-fication strategy exploits a policy experiment in Italy’s public procurement system that affects the behavior of public bodies differently depending on whether waste is active or passive. In the period we consider, public bodies can purchase generic goods through two channels: either on their own or through a central procurement agency. The agency, named Consip, establishes agreements with suppliers of generic goods which commit to selling a specified product at given price to any Italian public body. While Consip exists throughout our sample period, at any given point in time, only a subset of our sample goods are available from the Consip catalog. This is due to the fact that agreements for different goods have different start and end dates, and dif-ferent durations. Hence, for the same public body and the same good, we observe periods when the public body must purchase the good on its own and periods when it can also buy it from Consip.
A simple theoretical framework makes precise how the choice to buy from Consip can shed light on the nature of waste. When a Consip agreement is not active, the price that a public body pays for a certain good (controlling for quality and quantity) is a function of: (i) the propensity
1 Available at http://www.dscp.dla.mil/subs/support/specs/mil/44072.pdf.
2 The difficulty of using high-powered incentives is not limited to the public sector. It also applies to firms. Michael C. Jensen and Kevin J. Murphy (1990) argue that it is a serious problem even for CEOs, who are the top-paid agents in our society and whose performance is measured publicly by the share price.
of that specific public body to engage in active waste, and (ii) the ability of that public body to avoid passive waste. Thus, with information about prices only, one cannot identify active and passive waste. When a Consip agreement is active, the public body chooses between buying from Consip or outside Consip. As Consip offers no opportunity for active waste, the probability that a public body buys from Consip is a decreasing function of active waste, but an increasing func-tion of passive waste. Putting together informafunc-tion about prices paid when a Consip agreement is not active with decisions to buy from Consip when a Consip agreement is active is enough to establish whether price differences among public bodies are due to differences in active or passive waste. Note that our identification strategy relies exclusively on the fact that, by defini-tion, a public official who engages in active waste derives utility from the price level he chooses, while an official who engages in passive waste would be happier with lower prices. Our simple revealed-preference argument is still valid if: Consip is itself affected by active or passive waste (all that matters is that it charges the same price to all public bodies); public bodies are intrin-sically reluctant (or eager) to buy from Consip; and the mere presence of a Consip agreement affects prices, or opportunities for active waste, offered by other suppliers.
Our dataset contains very detailed information on individual purchases of 21 generic goods, such as printers and gasoline, by 208 Italian public bodies between 2000 and 2005. For each purchase, this includes quantity, brand, model, specifications, delivery conditions, and—most important—the price paid. The data have two key features. First, sample goods are standard-ized and bought by most public bodies, which allows us to measure waste as the difference in prices paid for the same good across the public sector. Second, we observe the same public body purchasing several goods at several points in time both when Consip agreements are active and when not. We are thus able to estimate the average price paid by each public body when buying on the open market, and the decision to buy from Consip when it is feasible to do so.
The analysis yields five main findings. First, the average prices paid by different Italian public bodies vary substantially. The public body at the ninetieth percentile of the fixed effect distribu-tion pays on average 55 percent more than the one at the tenth percentile. If all public bodies were to pay the same prices as the one at the tenth percentile, sample expenditure would fall by 21 percent; if we do not include public bodies below the tenth percentile for which savings are nega-tive, sample expenditure would fall by 27 percent. Since public purchases of goods and services are 8 percent of GDP, if sample purchases were representative of all public purchases of goods and services, savings would be between 1.6 percent and 2.1 percent of GDP.
Second, differences across public bodies are correlated with institutional characteristics rather than geography or size. Semi-autonomous bodies (universities and health authorities) pay the lowest prices. Compared to these, the average town government pays 13 percent more. The dif-ference increases further for regional governments (21 percent) and social security institutions (22 percent), while the average ministry tops the list with 40 percent higher prices.
Third, our reduced-form estimates indicate that bodies that pay higher prices when buying from Consip is not feasible are more likely to buy from Consip when they are given the chance. Within our theory, we interpret this finding as an indication that differences in passive waste play an important role in explaining price differences among public bodies.
While the reduced-form estimates indicate that price differences are mostly due to passive waste, they do not allow us to quantify the magnitudes of active and passive waste. To this pur-pose we bring our model to the data and, making specific functional form assumptions, estimate the active and passive waste parameters for each public body. Our fourth finding is that, on average, at least 82 percent of estimated waste is passive. Recalling that the public body at the ninetieth percentile paid on average 55 percent higher prices than the public body at the tenth percentile, our estimates indicate that, at the average values, if passive waste were eliminated the difference would be at most 10 percent.
Fifth, low active waste is not coupled with high passive waste, implying that in our sample there seems to be no trade-off between rules and discretion. Relative to central public bodies, autonomous public bodies have less passive waste and the same level of active waste. To the extent that giving autonomy to purchasing managers in central public bodies would make them behave like their counterparts in universities or health authorities, our evidence indicates that more discretion would not lead to higher active waste.
Overall our findings are consistent with the hypothesis that, in aggregate, most waste in the procurement of generic goods by the Italian public sector is not due to corruption but to inef-ficiency. Our results do not in any way imply that corruption is not an important issue in public procurement in Italy. They just indicate that passive waste seems to have an even larger effect.
Empirical economic analysis of government inefficiency and corruption can be divided into two strands, according to whether it makes use of opinion surveys or direct measurements of outcomes.3 The second approach, to which our paper belongs, is less developed and more recent. Examples include Rafael Di Tella and Ernesto Schargrodsky (2003), Ritva Reinikka and Svensson (2004), Benjamin Olken (2006, 2007), Marianne Bertrand et al. (2007), David Fisman et al. (2006), Raymond Fisman and Edward Miguel (2007), Ari Hyytinen, Sofia Lundberg, and Otto Toivanen (2007), and Claudio Ferraz and Frederico Finan (2007, 2008).
The paper that is closest to ours is Di Tella and Schargrodsky (2003), who study prices paid for a number of basic inputs by hospitals in Buenos Aires in 1996–1997. During that period there was a crackdown in corruption involving hospital audits. The authors estimate that average prices paid by hospitals went down 10 percent as a result of the crackdown. The authors also find a sig-nificant (and negative) effect of public managers’ wages on the prices paid by hospitals, which is consistent with the theory of corruption by Gary S. Becker and George J. Stigler (1974).
Within the direct-measurement approach, our paper offers a number of original contributions. First, the Consip natural experiment allows us to distinguish empirically between active and passive waste. While our estimates of active waste are in line with the available estimates of corruption,4 we differ from the rest of the literature in pointing out that passive waste could actu-ally be much larger than active waste—about four times as much in our estimates. Second, our data provide comparable measures of waste for a number of public bodies which differ by mode of governance, geographical location, and size. This allows us to see how waste depends on insti-tutional arrangements. Third, our sample is representative of an amount of public spending cor-responding to 2.5 percent of Italy’s GDP, and hence our estimates have large-scale implications.5 Last, in contrast to most corruption studies, we back out the preference parameters of the utility function of public officials. This is similar in spirit to Pinelopi Goldberg and Giovanni Maggi (1999), who estimate the utility weights of public welfare and lobby contributions in determining the level of trade protection granted to different sectors.
The remainder of the paper is organized as follows. Section I provides information on the context and the policy experiment. Section II presents the theoretical framework. Section III discusses our identification assumptions and the plausibility of alternative theories. Section IV describes the data. Section V presents the empirical analysis. Section VI concludes.
3 See Susan Rose-Ackerman (1999) and Jakob Svensson (2005) for surveys.
4 See the conclusion for a detailed comparison of our corruption estimates with Di Tella and Schargrodsky (2003), Olken (2006), and Ferraz and Finan (2007a).
5 Emmanuelle Auriol (2006) models the distinction between capture (a firm obtains a trading advantage through corruption) and extortion (a firm makes facilitation payments to avoid being excluded). Auriol proves that capture imposes a deadweight cost while extortion does not: calibration on available international data indicates that the total cost of capture is between 1.2 and 2.9 times the amount of the bribes.
I. Institutional Background and the Policy Experiment
This section provides background information on public procurement in Italy and describes the key features of the Consip policy experiments.
A. types of Public Bodies
The Italian public administration displays a high level of organizational and cultural heterogeneity.
Broadly, one can identify three models of public bodies (PBs) in Italy, with substantial differ-ences in terms of autonomy and accountability:
(i) Napoleonic bodies. The central administration (PBs for which the national govern-ment is responsible) follows a classical top-down, civil service model. The prototypical Napoleonic body is the ministry, typically headed by a career politician. In practice, the operations of the ministry tend to be controlled by entrenched civil servants.
(ii) US-style local bodies, namely, regions, provinces, and towns. Since the end of the 1990s, the CEOs of local PBs (the region’s governor, the province’s president, and the town’s mayor) have been elected directly and have broad powers. The region/province/town council cannot remove the CEO without calling for new elections. As in the United States, local elections tend to focus on practical local issues and candidates’ personali-ties, rather than national ideological positions.
(iii) Semi-autonomous bodies. The most important example comes from the health system. While the system is publicly funded, the provision is delegated to about 200 local health authorities. Each health authority is headed by a director general, appointed by the regional government, who has a standard private law employment contract, as also other high-level managers do. The compensation of directors and managers is high by the stan-dards of the Italian public administration and can include a performance-related compo-nent. Each health authority enjoys substantial budgetary and administrative autonomy.6 Italian PBs may be affected by local culture. Robert Putnam (1993) and several other authors have argued that there are structural differences in the social capital between the South and the North. Andrea Ichino and Maggi (2000) have documented systematic output differences for the same private organization (a bank) between branches located in the North and in the South. Finally, public bodies also vary in size, which can also affect active and passive waste.
B. Public Procurement and the Policy Experiment
In Italy, public spending for goods and services accounts for about 8 percent of GDP (€125 billion in 2006)—a figure which is in line with other OECD countries (Denis Audet 2002). Of this, 40 percent is spent on generic goods such as desktops, paper, and telephones, which are the focus of this paper.
6 For the purpose of this research, we put universities in the category of semi-autonomous bodies. While the central government sets nationwide rules regarding professorial salaries and promotion criteria, individual universities have full control of day-to-day activities and can raise funds. University presidents are elected by the university staff.
Public spending for goods and services is regulated by procurement law. The legislation is specific to the type of PB, and it distinguishes between central, local, and semi-autonomous bod-ies.7 In general, within each PB there is a purchasing manager (or a whole purchasing division) responsible for procuring the goods and services that other members of the public body need.
In the late 1990s, the Italian government launched a program to reduce public expenditure for goods and services. A key component of this program was the creation of a central procurement agency, Consip, whose purpose is to coordinate the procurement of commonly purchased goods and services. The rationale behind Consip is twofold. First, since contracts, tender documents, and eventual litigation, are centralized, Consip can save on transaction costs. Second, compared to individual PBs Consip has more buyer power that can be exploited to obtain lower prices.
Consip procures goods and services via framework agreements. These are general contracts between a procuring entity and a supplier for the delivery of goods and services within a certain time frame at specified price and conditions. Public bodies can buy the goods or services speci-fied in the contract, at the terms and conditions therein. Goods can be purchased online from the Consip catalog or ordered via fax or phone. Consip agreements typically cover the supply of up to N units of a certain good that can be sold in a certain period, until a final date t. Within these limits, the agreement is said to be “active” and the selected provider commits to fulfill any order at the terms of the contract. Consip does not commit to buy any units, so that if no public body places an order, no single unit is sold.
After initial pilots in 2000, Consip established 70 agreements concerning more than 40 prod-uct categories in the period up to the end of 2005. Total purchases from the Consip catalog in that period amounted €14 billion, that is, 12 percent of total procurement expenditures in 2005. The value of purchases of the same products and services from other sources was €26 billion, or 22 percent of total procurement expenditures in 2005. Thus, conditional on a product being offered, the value of Consip purchases accounted for a third of the value of total purchases of that product.
The key feature for our identification strategy is that PBs can choose whether to buy from Consip or on the open market. The precise extent to which they are free to choose varies by year and by institutional class as specified in the Budget Act. This choice was entirely free for all PBs in 2004 and 2005. Instead, all PBs were required to buy from Consip if an agreement for an equivalent good was active in 2003. This requirement also applied to central PBs between 2000 and 2002, while all other PBs were free to choose during that period. In practice, even when PBs were formally required to buy from Consip, they could justify out-of-Consip purchases by claim-ing that Consip goods did not satisfy their specific requirements.
II. A Model of Active and Passive Waste in Procurement
Consider a purchasing manager working for a PB. He receives requests for goods and services from various parts of the organization and he procures the requested products from commercial producers.
7 Italian legislation is available at http://www.normeinrete.it. For central public administrations see Regio Decreto RD 827/24 (1924). For local administrations see Decreto Legge DLGS 267/00 (2000). For semi-autonomous bodies see Decreto Legge DLGS 502/92 (1992). It is impossible to provide a precise mapping of these transpositions, as they differ by public bodies even within the same institutional class. For instance, within the central public administration there are rules that differ by type of Ministry. For purchases valued at 130,000 euros or above, the procurement market is regulated by an EU Directive.
Let us first examine the situation when Consip is not present. Suppose that at a certain time t the manager working for public body i must purchase a certain quantity of a fully specified good g. The total price that the manager pays for this good is denoted by
pigt= fgt(bigt , �i),
where bigt≥ 0 is a variable under the control of the manager, which represents the direct benefit (i.e., a “bribe”) that the manager receives for that transaction. The other argument of the price function, �i, is an exogenous variable which represents the “inefficiency” of the manager in organization i. The final price, pigt, is an increasing function of both bigt and �i. We will discuss the nature of bigt and �i shortly.
The purchasing manager has the following objective function: Ωigt= −pigt+ βibigt,
where βi is the active waste propensity parameter for public body i. The objective function con-tains a normalization: one could include a multiplicative parameter πi in front of the price.
The purchasing manager feels a pressure to keep prices low. This may be because he is genu-inely motivated to save public money or because he knows that he will face negative conse-quences if he overpays. The purchasing manager may also like private benefits. That happens when βi> 0 (βi can also be negative, representing a manager with moral scruples, who will in equilibrium choose bigt 5 0).
Our two key parameters are βi and �i, and it is worth devoting some time to their interpreta-tion. We assume that PBs have persistent differences, due to cultural, institutional, or historical characteristics.
In this context, the parameter βi is best interpreted as a set of norms that is conducive to active waste. For instance, the risk of prosecution may be higher for certain PBs than for others because of a culture of whistleblowing. A higher risk of prosecution means that private benefits are less appealing (for instance, βi can incorporate a probability of getting caught that is linear in the amount of the bribe).
The passive waste parameter �i may come from a variety of sources. One possibility, follow-ing Kelman (1990, 2005), is that red tape may limit flexibility and increase the average price that the PB pays. Red tape in turn depends on the mode of governance of the PB, which—as we argued earlier—varies greatly within the Italian public administration. Another possibility is that the human capital of purchasing managers varies across PBs. Finally, passive waste might also be due to “laziness.” Purchasing managers in certain PBs face less incentive or more cost to exerting effort for finding good deals. Such possibility is best explored by assuming that effi-ciency is endogenous and depends on the effort exerted by the purchasing manager.8
What is the equilibrium when Consip is not present? The manager determines the private benefit ˆ b igt and thereby the price ˆ p igt through the first-order condition (we make the standard assumptions on differentiability and concavity of the function fgt, and suppose that the nonnega-tivity constraint on the private benefit is not binding):
∂ ____ ∂b
igt fgt(bigt, �i) = βi.
8 In Appendix 1 (all the appendices are posted on the AER Web site, http://www.aeaweb.org/articles.php?doi=10.1257/ aer.99.4.1278), we extend our model to let passive waste be endogenous, in which case the purchasing manager would decide both the amount of private benefit that he gets and the amount of effort that he puts in. The results are qualita-tively the same. In particular, the identification strategy is unchanged.
The equilibrium payoff for the manager is ˆ
Ω igt = − ˆ p igt+ βi ˆ b igt. We then have our first result:
PROPOSITION 1: If there is no consip deal, the price paid by public body i is an increasing function of both the passive waste parameter �i and the active waste parameter βi.
This result highlights the inability to identify the cause of waste from price data alone. A high price can be due to passive waste or active waste.
How do things change when we add Consip to the picture? We make two assumptions: (i) The price that Consip charges for good g at time t is the same for every public body (and
it is denoted with p gtc );
(ii) If manager i buys from Consip, he receives no private benefit. We do not make any assumption on the process through which the Consip price p gtc is generated or whether the Consip price is better or worse than the out-of-Consip prices.
In particular, our results are valid as stated even if Consip itself is subject to active and passive waste. Our identification strategy relies exclusively on the fact that Consip treats all public bodies in the same way.
Manager i’s payoff if he buys from Consip is ˆ
Ω igtc = − p gtc + νigt,
where νigt is some idiosyncratic preference for Consip with continuous distribution over the real line.
When Consip is present, the purchasing manager has the option to buy outside Consip. However, the out-of-Consip price function may be different from the price function that the manager faced before Consip appeared. This could be due to a number of reasons. The presence of a Consip reference price may make out-of-Consip prices more competitive. Also, the bargaining power in the active waste relation may be altered (the purchasing manager may have to agree to a lower price in order to obtain the same private benefit). We take the most general view and we assume that the new price function is different from the previous one (we denote it as ˜ f gt instead of fgt). The only maintained assumption is that ˜ f gt is increasing in both bigt and �i. Hence, the total price that the manager pays if he buys outside Consip is
pigt= ˜ f gt(bigt, �i).
The presence of Consip may also create additional effects that do not work through price. For instance, a purchasing manager may feel pressured into buying from Consip in order not to appear corrupt. Or the risk of getting caught taking a bribe is now higher. We capture this through an additional term h( p gtc , bigt) (which is likely to be negative). In particular, it could be the case that h( p gtc , bigt) = − δg− θbigt, indicating that a manager who chooses to buy outside Consip incurs a fixed stigma plus an additional risk of prosecution which increases with the amount of kickbacks.
In sum, the utility of a manager who buys outside Consip when a Consip deal is available is Ω igtn = − ˜ f gt(bigt, �i) + h( p gtc , bigt) + βi bigt.
As before, the manager chooses bigt to maximize Ω igtn . We assume that ˜ f and h are smooth and satisfy the standard conditions for the existence and uniqueness of an interior solution. The maximal payoff is denoted with ˆ Ω igtn .
The manager chooses between buying from Consip and getting payoff ˆ Ω igtc , or buying outside Consip and receiving payoff ˆ Ω igtn . We can now state:
PROPOSITION 2: If a consip deal is active, the probability that public body i buys from consip is an increasing function of the passive waste parameter �i and a decreasing function of the active waste parameter βi.
PROOF:
The manager buys from Consip if ˆ Ω igtc ≥ Ω igtn . The probability that he buys from Consip is then given by
Pr
[
νigt≥ p gtc + ˆ Ω igtn]
.Note that p gtc does not depend on �i and βi. It is enough to prove that ˆ Ω igtn is increasing in βi and decreasing in �i. To see this, apply the envelope theorem to
ˆ
Ω igtn = − ˜ f gt( ˆ b igt, �i) + h( p gtc , ˆ b igt) + βi ˆ b igt. We have ∂ ˆ Ω igt n ____ ∂� i = − ∂ ___ ∂�i ˜ f gt( ˆ b igt, �i) < 0; ∂ ˆ Ω igt n ____ ∂β i = ˆ b igt> 0, which proves the statement.
Proposition 2 captures the essence of the distinction between active and passive waste, and it can be understood as a classical revealed-preference result. A higher βi denotes a situation where the manager can benefit more from active waste. This corresponds to an improvement of his choice set, which can only make him better off. Instead, a higher �i corresponds to a worsening of the manager’s choice set: for every bigt he chooses, he gets less utility. Thus, an increase in βi makes out-of-Consip purchases more appealing and an increase in �i makes them less appealing. Our basic argument requires only an assumption on the monotonicity of the choice sets and it applies to a class of models that is much larger than the one we consider in this simple setup.
Proposition 2, combined with Proposition 1, permits identification of the source of waste. Take a PB that overpaid for a certain good g before Consip arrived. If the PB buys from Consip, we should be more likely to conclude that it was passive rather than active waste. We can make this point more precise. Suppose that, in the population of PBs, the parameters βi and �i are distrib-uted according to a joint normal distribution (βi, �iǀ
__
β , __ � , σ β2 , σ �2 , ρ). Assume that ρ is bounded
away from −1 and 1. For simplicity, suppose that every public body i makes one purchase when Consip is not present (at time 1) and one purchase when Consip is present (at time 2). Let pi1
denote the price that PB i pays at time 1, and si2 the decision to buy from Consip at time 2 (si2= 1
if i buys from Consip). In the equilibrium of our model, both pi1 and si2 are stochastic variables
that depend on βi and �i(and on other stochastic variables). One can study the joint equilibrium distribution of those two variables. In particular, one can ask whether those variables are posi-tively or negaposi-tively correlated.
PROPOSITION 3: Hold fixed __β , __ � and ρ. For any given σ β2 , cov[ p
i1 , s i2] is increasing in σ �2 and there exists a __ σ �2 such that cov[ p
i1 , s i2] ≥ 0 if and only if σ �2 ≥ __ σ �2. conversely, for any given σ �2 , cov[ p
i1 , s i2] is decreasing in σ β2 and there exists a σ __ β2 such that cov[ p i1 , s i2] ≥ 0 if and only if σ β2 ≤ __ σ
β2 .
PROOF:
The variable p i1 is increasing in both βi and �i(Proposition 1). The variable s i2 is decreasing
in βi and increasing in �i(Proposition 2). Hold the variance σ β2 constant. If σ �2 → 0, cov[ p i1 , s i2]
is determined by βi only. Hence, cov[ p i1 , s i2] < 0. If instead σ �2 → ∞, cov[ p i1 , s i2] is determined by
�i only and cov[ p i1 , s i2] > 0. Conversely, hold the variance σ �2 constant. If σ β2 → ∞, cov[ p i1 , s i2] is
determined by βi only. Hence, cov[ p i1 , s i2] < 0. If, instead, σ β2 → 0, cov[ p i1 , s i2] is determined by
�i only and cov[ p i1 , s i2] > 0. Given that all the functions involved are smooth, it is easy to check
that cov[ p i1 , s i2] is continuous in σ �2 and σ β2 . Given the monotonicity implied by Propositions 1
and 2, cov[ p i1 , s i2] is increasing in σ �2 and decreasing in σ β2 . By a fixed-point argument, there must
exist values __ σ �2 and __ σ
β2 that satisfy the statement in the Proposition.
Proposition 3 will guide our empirical analysis. It characterizes an observable statistics, cov [ p i1 , s i2], in terms of the underlying distribution of active and passive waste parameters. To
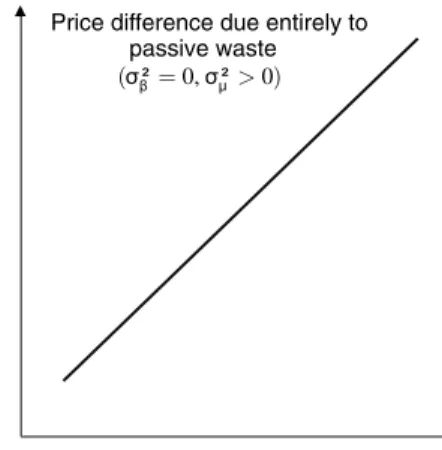
under-stand the proposition, consider two extreme cases illustrated in Figure 1. Suppose first that all PBs are equally corruption-prone (βi= β for all i). Any pre-Consip difference between the prices that PBs pay is due to the ability parameter �i. When a Consip deal is available, the most efficient bodies will buy outside Consip while the less efficient ones will buy from Consip. The covari-ance term is positive. If instead all PBs are equally efficient (�i= � for all i), price differences are due to preferences for private benefits. The bodies that like private benefits are least likely to buy from Consip and the covariance term is negative.
The proposition has a clear limit, which will inform the reduced-form analysis. The observed relationship between pre-Consip prices and switching decision is informative on the variance of � and β but not on their absolute value. For instance, finding that the public bodies that pay the highest prices are more likely to purchase from Consip is consistent both with all PBs being equally corrupt and with them all being equally clean. In other words, the reduced-form analysis will allow us to assess only whether price differences are due to differences in � or differences in β. The issue is of interest because there are very large systematic differences in prices paid by different public bodies. This limit will be overcome, in the structural estimates, at the cost of making explicit assumptions on what reference price we should expect an efficient and noncor-rupt public body to pay.
III. Alternative Theories
Our empirical strategy depends on the validity of Proposition 2, namely, on the fact that the probability of buying from Consip is increasing in the passive waste parameter �i and decreasing in the active waste parameter βi. Biases in the estimates of βi and �i, if any, derive from the term
Recall that h, defined in Section III, represents the additional benefit or cost that a purchasing manager faces if he buys outside Consip when a Consip deal is available. We let this cost be a function of the Consip price and of the private benefit that the purchasing manager receives. This encompasses a large number of cases. In particular, it covers a situation where the risk of pros-ecution is higher for purchasing managers who do not use Consip.
Also, recall that the price function f is allowed to be different in a generic way ( ˜ f ) just because Consip is present, which takes care of a number of other situations, including:
(i) A change in the bargaining power between supplier and purchasing manager (both in terms of prices and private benefits);
(ii) A stronger desire to keep prices under control; (iii) The ability to get better prices from other suppliers.
However, there is a potentially relevant situation which is not covered by our setup and which may give rise to a bias. Assume that the term h depends directly on the active waste parameter, namely
h( p gtc , bigt, βi),
and that this dependence is negative. The more corruption-loving a public body is, the less utility it receives from buying outside Consip, holding the private benefit level bigt constant. If that is the case, Proposition 2 is no longer valid: the probability of using Consip may be increasing in the parameter βi. The following section suggests two scenarios where that can occur.
It is important to reiterate that the possibility that the presence of a consip deal makes pur-chasing managers more afraid to take bribes is immaterial to our identification strategy. As seen above, our model incorporates the possibility that managers are more reluctant to seek private benefits when they could be buying the good from Consip, and our revealed-preference argument is still valid (more corrupt managers are still less likely to buy from Consip than their honest counterparts). In order for there to be a bias, the fear of getting caught must depend not only on the observable decisions that the PB makes (and hence, in equilibrium, on the public body’s taste
Figure 1. Model Prediction
Probability of buying from Consip
Out-of-Consip price
Price difference due entirely to passive waste ( = 0, µ> 0)
Price difference due entirely to active waste ( > 0, µ= 0)
Probability of switching to Consip
for private benefits βi) but also directly on the parameter βi. This, of course, is a much stricter requirement because βi is a preference parameter rather than an observable decision.
A. Endogenous monitoring
The expression h( p gtc , bigt) allows for the risk of prosecution to be a function of the decision to buy from Consip, of the price, and of the amount of bribe paid for that purchase, but it does not consider the possibility that the risk of prosecution is a function of the public body’s taste for private benefits directly. There are two sets of circumstances under which this can happen:
(i) Targeted enforcement. Suppose that there exists a monitoring authority and that it has soft information about the private type of purchasing managers, i.e., their taste for pri-vate benefits, but this is not enough to initiate action. When a Consip deal is present, the monitoring authority can punish corrupt purchasing managers directly if they choose not to use Consip. This makes the cost of buying outside Consip higher for purchasing man-agers with high β’s. In equilibrium, corrupt managers are more likely to buy from Consip and our estimates of β are biased downward.9
(ii) Selective auditing. Suppose instead that, unlike in the case above, the monitoring author-ity does not have soft information about β’s. It could, however, still use the decision to buy outside Consip as a signal that the purchasing manager is corrupt. The monitor-ing authority could be more likely to audit all the purchasmonitor-ing managers who do not use Consip and, importantly, such audits would not be restricted to the current purchase but would also extend to purchases made when a Consip deal was not active. A purchasing manager with a high β has more to lose from an audit because he has engaged in active waste in past purchases. He therefore chooses to buy from Consip in order to avoid a selective audit. Again, our estimates of β are biased downward.10
To evaluate the practical importance of these two alternative theories, let us start by discussing who the monitoring authority is in Italy. In principle, a bad public employee faces both adminis-trative and judicial review. However, there is a general consensus that the risk of adminisadminis-trative punishment is minimal. According to Pietro Ichino (2006), no public employee has been dis-missed in the regular administrative way (scarso rendimento ) in the last ten years. Even when employees are found guilty of a crime against the public administration, they are not automati-cally fired. According to existing guidelines, they are dismissed only if they are sentenced to a prison term of at least three years.
On the other hand, judicial prosecution is a serious risk. For instance, between 1992 and 2002, the Milan district attorney secured convictions on corruption charges for 1,254 different indi-viduals (847 through plea bargains, 407 in trials). So, for our purposes it is reasonable to regard the judiciary as the key monitoring authority.
9 A classic example of targeted enforcement is the prosecution of the Prohibition Era gangster Al Capone. For years the US federal authorities suspected that Capone was involved in racketeering but they were never able to collect suf-ficient evidence. They later decided to switch tactics, and in 1931 they secured a conviction on tax evasion charges. This is a situation where the monitoring authority had reliable soft information and was looking for a way to “nail” the suspect on other charges. In such a situation Al Capone should have been extremely diligent in filing his tax returns— more so than other taxpayers.
10 If the monitoring authority’s strategy is endogenous, it is unclear what the features of the equilibrium of such a signaling model would be. If high-β PBs find it too dangerous to buy of-Consip, then the only ones who buy out-of-Consip are honest PBs (for idiosyncratic reasons or because they can get a better price). But, then, the monitoring authority should not use the decision to buy out-of-Consip as a signal of corruption.
In this context, the targeted enforcement story is implausible. Given that poor performance is not cause for penalty or dismissal, employees can be punished only for criminal acts. Not buying from Consip is not a crime in itself, nor is it evidence of a crime. So, there is no sense in which prosecutors can make use of the decision not to buy from Consip to “nail” cor-rupt purchasing managers, even assuming that they know ex ante who the corcor-rupt ones are. The selective auditing theory is potentially more promising and cannot be completely ruled out. In Section VB, we present a test based on the fact that the legal requirement to buy from Consip, and hence the relevance of selective auditing, varies both across public bodies and over time. Here we discuss three serious practical arguments against its plausibility.
First, if the district attorney wanted to use information on who buys from Consip to decide whom to investigate, she would be faced with a very noisy signal. Very few of the goods typically purchased by PBs are available from Consip at any given point in time, and Consip agreements for different goods have different lengths and different start and end dates. In addition, PBs do not commit to Consip, so that the same public body can buy some goods from Consip and oth-ers outside, or even buy the same good both from Consip and outside at different points in time. Indeed, almost all PBs (all but one in our sample) buy both from Consip and outside Consip when a deal is present, and the vast majority of them is in the 30/70 percent band.
Second, even if the district attorney could use the decision to buy from Consip as a signal that the purchasing manager is corrupt, auditing past purchases or monitoring future purchases is unlikely to be a fruitful line of investigation. Auditing past purchases is very costly, as pro-cessing statistical evidence is not what the district attorney is trained for. Even more important, price analysis is unlikely to be useful in court, since evidence that a manager pays too much for purchases is neither necessary nor sufficient to secure a corruption conviction.
In line with this, there are no reports of judicial use of Consip information. More generally, to the best of our knowledge, there are no reports of corruption investigations in Italy that began with collection of statistical evidence on prices. District attorneys focus their resources on gath-ering another kind of information: evidence of payments between suppliers and public officials. Indeed, a recently published anticorruption manual focuses almost exclusively on methods for tracking financial flows (OECD—Ministero dell’Economia e delle Finanze 2007). The typical anticorruption probe begins with the interception of a payment, either by chance or because of whistleblowing. This is typically sufficient evidence to secure convictions for the individuals involved. Next, the district attorney offers a plea deal to suspects if they can provide evidence —typically proof of payment— against other people. The cycle can be repeated and the inquiry can end up involving hundreds of people.
B. Active Waste through consip
One key identifying assumption is that the private benefit that purchasing managers derive from buying from Consip is zero. If that were not the case, namely if managers were to receive higher bribes on Consip purchases, our estimates would be biased because more corrupt purchas-ing managers would prefer to buy from Consip.
This possibility is extremely unlikely in practice. All Consip deals are signed with large national or international companies. The local purchasing managers send their orders directly to a national supplier so that transfers, if any, would have to come directly from the national sup-plier. For obvious auditing reasons, it is difficult to conceive that a large national company, or the Italian headquarters of an international company, is in a position to make large and systematic hidden cash payments. In contrast, when buying off Consip, purchasing managers can procure the goods from local agents, as large suppliers rely on a network of regional distributors. Such
agents may develop long-term relationships with purchasing managers and they are in a better position to make hidden cash transfers or offer other benefits.
IV. Data Description
We analyze data on procurement purchases of generic goods made by a sample of Italian PBs between 2000 and 2005. The data were collected in a survey designed and implemented by the Italian Statistical Agency (ISTAT) in three rounds, administered yearly between 2003 and 2005.
The survey covers a broad range of generic goods, such as office supplies and furniture, com-puters, and utilities. Sample goods were chosen on the basis of three criteria:
(i) Comparability, that is, homogeneous goods whose price depends on a few observable characteristics;
(ii) Diffusion, that is, goods that are purchased by most PBs; and
(iii) Relevance, that is, goods that account for a sizeable share of the budget for most PBs. The survey was administered to the office clerk responsible for receiving, paying, and filing invoices in each PB. The respondent was asked to report the unit price, the date of purchase, the quantity purchased, and several characteristics of each good.11 A list of the sample goods and the available characteristics is reported in Appendix 2. For durable goods, e.g., PCs, the manager was asked to report each purchase made in the five years before the survey. For nondurable goods and for services, e.g., phone contracts, the manager was asked to report information on the last purchase only.
The survey was administered to 500 PBs. Of these, 447 were selected by cutoff sampling on expenditures and account for 80 percent of the expenditure in goods and services by the Italian public sector as a whole. The remaining 53 PBs were added to the sample to represent institu-tional categories with small budgets, e.g., mountain town councils. The survey response rate was over 70 percent. Respondents and nonrespondents do not differ on observable characteristics such as location, annual expenditure, and institutional category.
In the analysis, we exploit two key sources of variation. First, we observe the same PB chasing several goods at several points in time. Second, we observe the same good being pur-chased both when a Consip agreement is active and when it is not. We are thus able to estimate the average price paid by each PB when buying on the open market, and the decision to buy from Consip when Consip agreements are active. Appendix Figure A1 shows that, importantly, agree-ments for different goods are switched on and off at different points in time; this allows us to control for time-specific unobservables that affect price and purchasing decisions.
Three rules define our working sample. First, as the identification relies on within PB varia-tion, we include in the analysis only PBs for which we have data on at least ten purchases.12 Second, to maintain comparability across PBs, we exclude goods that are purchased exclusively by a few PBs.13 Finally, we eliminate price outliers by dropping the bottom and top centile of the price distribution of each good. Our final sample contains 6,068 observations on purchases of
11 Copies of invoices were collected from a subsample of public bodies to cross-check the accuracy of responses. 12 This restriction eliminates 1,612 observations. Compared to the sample PBs, the excluded PBs have lower annual expenditure but are equally likely to purchase when a Consip agreement is active and equally likely to purchase from Consip.
13 Excluded goods are buses, refuse trucks, and biofuel, which are purchased by fewer than 20 PBs each, and CAT scanners, which are purchased exclusively by health authorities.
21 goods by 208 PBs over the 2000–2005 period. On average 52 percent of purchases are made when a Consip agreement is active and 48 percent when there is no active agreement.
Table 1A illustrates the sources of variation at the PB level. We classify sample PBs by the three governance classes discussed in Section IA, plus a residual class of PBs whose governance structure does not clearly fall into any of the three categories. PBs’ size, measured by annual expenditure in 2000, ranges from an average €3 million for mountain village councils to over €1 billion for ministries. Since the sampling strategy oversamples larger PBs, the share of total expenditure accounted for by PBs in our sample is proportional to the average PB size in a given class. Thus, ministries in the sample account for 92 percent of the total expenditure by the universe of ministries in Italy, sample universities account for 43 percent, and sample mountain village councils for 13 percent.
PBs in all classes buy on average 11 different types of goods. Table 1A shows that PBs in all institutional classes buy at least some goods from Consip when feasible. Central PBs are more likely to buy from Consip than local PBs and semi-autonomous bodies, a pattern we will analyze in more detail in Section VA. At the single PB level, 96 percent of the sample PBs buy from Consip at least once, and all PBs buy outside Consip at least once when there is an active agreement.
Table 1B, shows the average price paid and quantity purchased for each good. To ensure com-parability across different months and years, price is normalized by the monthly consumer price index. Table 1B highlights that, unconditionally, there is substantial variation in price, as for all
Table 1A—Sample Description (Public bodies sample)
Governance class Number of PBs Total expenditure by sample PBs in 2000 (€ million) Total expenditure by sample PBs over total expenditure by all PBs in 2000 (€ million) Average number of goods purchased Percentage of total purchases made when a Consip agreement is active Percentage of Consip purchases made when a Consip agreement is active Napoleonic bodies Ministries and government 12 13,368 0.92 12.2 59 62 Social security administration 3 1,952.90 0.78 10.5 61 57 Local governments Regional councils 12 1,683.90 0.61 10.6 51 26
Province and town councils 70 4,162.20 0.21 11.9 51 39 semi-autonomous bodies Health centres 81 6,894.20 0.48 11.8 56 35 Mountain village councils 11 34.2 0.13 10.5 54 33 Universities 13 354.5 0.43 12 53 34 Other 6 462.3 0.29 11.8 44 45
Notes: The “other” category includes: the National Statistical Institute (ISTAT), the Institute for International Trade (ICE), the Higher Institute of Health (ISS), the National Research Institute (CNR), a Veterinary Research Center, and a Regional Research Institute. Total expenditure by sample PBs equals yearly expenditure for goods and services summed over all sample PBs in a given class. Total expenditure by all PBs equals yearly expenditure for goods and ser-vices summed over all the PBs belonging to that institutional class.
Table 1B—Sample Description (Goods sample)
Good type Observations (1)
Average price (2) Average quantity per order (3) Percentage of days when a Consip agreement is active (4) Percentage of Consip purchases when an agreement is active (5) Car rental 160 399.5 4.81 53 68 (208.6) (9.58) Photocopier rental 466 510.69 13.06 58 64 (844.52) (30.18) Laptop 775 1,219.7 6.5 45 35 (458.52) (30.1) Desktop 648 992.5 16.0 39 47 (587.5) (62.84) Office desk 245 232.1 11.9 10 11 (171.9) (26.02) Office chair 280 96.6 30.4 25 5 (52.7) (86.2) Landline contracts 143 1.89 125,272 50 94 (0.74) (292,636) Projector 191 1,438.0 1.82 13 44 (647.3) (2.44)
Local network: switch 215 138.7 164.4 33 7
(269.9) (298.5)
Local network: cable 102 3.33 8,631.1 33 26
(4.71) (3,245.3) Motor oil 23 5.19 681.34 41 0 (2.01) (1,155.1) Heating diesel 248 3.85 293,583 50 30 (13.81) (504,625) Lunch vouchers 231 70.04 665,895 79 52 (4.57) (1,418,723) Refuse bins 63 152.63 290.76 0 0 (184.94) (768.58) Paper 755 2.40 6,546.5 32 9 (0.922) (2,2626.2)
Mobile phone contracts 183 0.041 1,244,620 57 59
(0.102) (5,011,294) MS Office software 155 233.2 151.1 56 20 (91.5) (483.1) Printer 294 483.95 22.6 43 47 (576.7) (96.9) Server 297 5,967.5 3.45 0 0 (6,772.6) (9.24) Car purchases 345 10,710.3 4.02 0 0 (6,112.7) (11.23) Fax 249 338.16 6.89 45 41 (158.85) (18.02) Total 6,068
Notes: For goods purchases, price equals the cost of one unit. Motor oil and heating diesel are measured in liters, cables are measured in meters. For goods rentals, price equals the monthly rent for one unit of the good. For landline con-tracts, price equals the per-minute charge for national calls. For mobile concon-tracts, price equals the per-minute charge for calls to landlines. Quantity equals the number of items in a single purchase, except heating diesel and motor oil, where quantity is measured in liters, cables, where quantity is measured in meters, and landline, mobile, and lunch vouchers, where quantity is measured as total yearly outlay. Column 4 reports the number of days during which an agreement was active over the total number of days in our sample. During our sample, Consip did not make agreements for refuse bins, car purchases, and servers. Column 5 reports the number of purchases from the Consip catalogue divided by the total number of purchases made while an agreement is active for the good in question.
goods the standard deviation is at least half the mean, and for some it is larger than the mean. Our aim in the next section is to assess how much of this variation can be explained by observed characteristics and to exploit information on the decision to buy from Consip to shed light on the reasons for the residual price variation. In line with wide variation in the size of different PBs, Table 1B also illustrates that for most goods, periods with and without active Consip agreements are of equal length. The last column in Table 1B shows that when an agreement is active, all the sample goods are purchased both from Consip and outside. The variation in the share reflects variation in the relative attractiveness of the Consip deal.
Our identification strategy throughout relies on the fact that we observe the same PBs making purchases when Consip agreements are active and when they are not. While the timing of agree-ments is plausibly exogenous to the individual PBs, the purchasing manager might affect the tim-ing of purchases. The identification then relies on the assumption that timtim-ing of purchases, that is, whether to purchase when an agreement is active, is not correlated with the parameters that determine the purchasing manager’s behavior (�i and βi in the model). This assumption would be violated if corrupt managers anticipate or postpone purchases to avoid periods when agreements are active, to avoid having to justify paying higher prices than Consip. Likewise, our identifying assumption would be violated if managers were to wait or to delay purchases in order to wait for an active agreement, for instance to minimize search effort. In Appendix 3, we present evidence on timing of purchases to check whether strategic timing is a concern in this setting. We rely on the intuition that if managers were to time purchases strategically, we should observe a spike or drop either just before or just after the start and/or the end of an agreement. Appendix 3 shows evidence against strategic timing, thus providing support for our identifying assumption.
V. Empirical Analysis
Our empirical analysis is organized in three complementary parts. We first document the dif-ferences in prices paid by different PBs for observationally identical goods and we exploit the cross-sectional variation in PB characteristics to shed light on the correlates of price differences. Public bodies in our sample vary on three dimensions that can potentially affect both active and passive waste: (i) mode of governance, (ii) size, and (iii) geography.
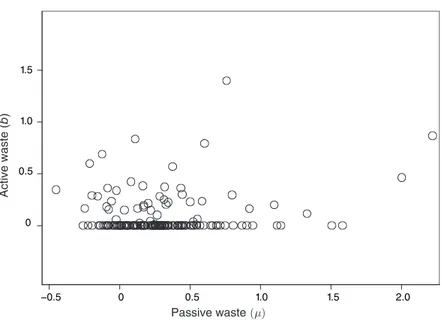
Second, we estimate the average price paid by each PB when Consip agreements are not avail-able and, informed by Proposition 3, we analyze the correlation between price differences and the decision to buy from Consip to shed light on the nature of waste. Proposition 3 shows that if most of the difference in prices across PBs is due to differences in passive waste, PBs that pay higher prices when goods are not available from Consip should be more likely to buy from Consip when feasible. In contrast, if most of the price difference is due to differences in active waste, PBs that pay higher prices when goods are not available from Consip should be less likely to buy from Consip, as this would imply foregoing private benefits.
Third, we fit our model to the data to back out the parameters of the purchasing manager’s objective function. This allows us to retrieve the active and passive waste parameters for each public body and provide evidence on the magnitude of the two forms of waste. This also allows us to establish whether there is a trade-off between the two forms of waste, namely whether pub-lic bodies that have lower passive waste also have higher active waste, and vice versa.
A. Price differences
Average Prices.—Our first step is to estimate the average price paid by each PB for all goods purchased as the PB fixed effect in a regression of price paid by PB i for good g at time t ( pigt) when no Consip agreement is active for good g. The log-price equation is
(1) ln pigt= Xigtγ + ρgln Qigt+ ηgt + θg+ wi+ εigt,
where Xigt is a vector of good-specific characteristics, Qigt is the quantity purchased, t is the time trend, θg are goods fixed effects, and wi are public bodies fixed effects.14 We allow the effect of quantity and of the time trend to be different for different goods.15 We control for quantity pur-chased to capture possible bulk discounts. We control for good-specific trends to capture price changes faced by all PBs at the same time. Therefore, the assumption needed to identify ρ as the causal effect of quantity on price is that all PBs face the same price schedule at any given point in time. To account for price differences due to transportation costs and market accessibility, we have also added several control variables to our baseline specification of (1).16 None of these sig-nificantly affected price, in line with the fact that our sample goods are produced by large firms and easily available at retail stores across the country.
Our coefficients of interest throughout are the estimated PB fixed effects, ˆ w i, as ωi= exp ( ˆ w i) is the average price paid by PB i on all the goods it buys. The distribution of PB fixed effects reported in Figure 2 indicates that different PBs pay considerably different prices for similar goods. For instance, the PB at the ninetieth percentile pays, on average, 55 percent higher prices than the PB at the tenth percentile. A back-of-the-envelope calculation suggests that if all PBs were to pay the same prices as the one at the tenth percentile, sample expenditure would fall by 21 percent. If we do not include public bodies below the tenth percentile for which savings would be negative, sample expenditure would fall by 27 percent. Since public purchases of goods and services are 8 percent of GDP, if sample purchases were representative of all public purchases of goods and services, savings would be between 1.6 percent and 2.1 percent of GDP.17
correlates of Prices.—The evidence above indicates that different PBs pay considerably dif-ferent prices for similar goods. The purpose of this section is to identify the PB characteristics that are correlated with these differences. PBs in our sample differ along three dimensions: (i) geography, (ii) size (expenditures), and (iii) institutional class. Geography can proxy for cul-tural factors that might affect both active and passive waste. Following Putnam (1993), several authors have argued that differences in social capital across Italian regions affect a wide range of economic outcomes, including the performance of the public sector. In what follows we ana-lyze whether prices differ systematically by geography and whether they are correlated to the standard social capital measures used in the literature. We group PBs in four geographic areas: North, Center, and Southern regions with and without high prevalence of organized crime.18
14 To select the characteristics to be included in X
igt, we estimate price regressions for each of the goods that include
all available characteristics and a time trend. We then choose the characteristics whose coefficients are significantly different from zero at the 10 percent level or higher. We thus drop characteristics for which there is little or no variation (e.g., all paper weighs 80g/m2) and characteristics that are highly correlated with others (see Appendix 2).
15 Results are robust to controlling for year × good fixed effects instead of good-specific time trends.
16 Geographical controls included regional dummies, town size, and driving distance from either Milan or Rome, both in kilometers and in hours.
17 To show that ˆ w
i captures PB-specific features as opposed to pure noise, we exploit the fact that we observe almost
all of the same PBs buying at least some of the same goods from Consip. We use these observations to estimate a “placebo” ˆ w iP as the PB fixed effect in the equivalent of (1) from Consip purchases. Since individual PBs have no
influ-ence over the Consip price, ˆ w iP by construction does not capture PB-specific features. Reassuringly, ˆ w i and ˆ w iP are not
correlated (correlation coefficient = − 0.07). Appendix Figure A3 shows that ˆ w iP exhibits considerably lower variation
than ˆ w i , and the Kolmogorov-Smirnov test rejects the null of equality of distributions ( p-value = 0.001). We compare
the fixed effect model (1) to a random effects model for both out-of-Consip and Consip purchases. The Hausman test rejects the null in the out-of-Consip sample but fails to reject in the sample of Consip purchases.
18 We classify Campania, Sicilia, Puglia, and Calabria as having high prevalence of organized crime, based on extensive evidence from the crime literature and news reports. Results are robust to redefining the group to include only Campania and Sicilia, the two most affected regions.
Donation is the number of blood bags (each bag contains 16 ounces of blood) per million inhabitants in province collected by AVIS, the Italian association of blood donors, in 1995 among its members.
The size of the public body might affect prices paid for several reasons. Private benefits might be easier to hide in purchases made by large PBs, but these could also pay lower prices because of bulk discounts. Large PBs may also be more bureaucratic, which could be correlated with passive waste.
Finally, PBs also differ by governance structure. As discussed in Section I, Italian PBs can be broadly grouped in three institutional classes: Napoleonic bodies, local governments, and semi-autonomous bodies. These three categories are subject to different procurement laws, and they differ by the level of autonomy and by the rigidity of their budget constraint. Procurement laws and the degree of autonomy should affect waste.
In Table 2 we analyze how the price paid when Consip agreements are not active depends on PB characteristics. Column 1 shows the correlation between prices, geography, and PB size. Column 2 shows the correlation with the social capital variables and column 3 with governance type. Finally we include all variables together in column 4.
Column 4 shows that, once we control for institutional class, neither geography nor size nor social capital is significantly correlated with prices. The coefficients of these variables remain precisely estimated and not significantly different from zero. Two of the three social capital vari-ables have the “wrong” sign, that is, they are positively correlated with price paid. Only the coef-ficient on the blood donations variable is negative and marginally significant (at the 11 percent
Figure 2. Average Prices of Goods not Purchased from Consip
Percentile 1 10 50 90 99
Average price 0.67 0.79 1 1.23 1.68
Notes: The average price for out-of-Consip purchases is estimated for each PB as the exponent of PB i’s fixed effect in the regression of log price on: goods fixed effects, good-specific trends, good-specific quantities, and good-specific characteristics, using the sample of purchases made when a Consip agreement was not active. The average out-of-Con-sip price for the PB at the tenth percentile is 0.79, and for the PB at the ninetieth percentile is 1.23.
Kernel density Average price 0 0.5 1.0 1.5 2.0 2.5 0.5 1.0 1.5 2.0
Table 2—Prices and PB Characteristics
(dependent variable is the average price for out-of-consip purchases: Linear model–standard errors in parentheses)
(1) (2) (3) (4) Geography (Omitted: North) South-oc 0.019 − 0.036 (0.050) (0.095) South − 0.005 − 0.062 (0.034) (0.059) Center 0.082** 0.008 (0.034) (0.036) size Log expenditure 0.024** − 0.010 (0.011) (0.018)
social capital variables
Donations − 2.43** − 1.23
(0.856) (0.758)
Referenda voter turnout 0.172 − 0.145
(0.268) (0.482)
Share of people who trust 0.024 0.147
(0.143) (0.158)
Governance types
(Category omitted: university) Napoleonic bodies
Ministries and government 0.397*** 0.394***
(0.103) (0.138) Social security 0.229*** 0.224*** (0.036) (0.076) Local bodies Regional councils 0.184*** 0.207*** (0.054) (0.069)
Province and town councils 0.109*** 0.126***
(0.029) (0.034) semi-autonomous bodies
Health centers 0.038 0.063*
(0.028) (0.037)
Mountain village councils 0.030 0.065
(0.065) (0.074)
Adjusted R2 0.0689 0.0592 0.2320 0.2515
Observations 202 189 202 189
Notes: The omitted category for the type variable is “universities.” The omitted category for the geographical vari-able is “North.” South-oc identifies the southern regions with high prevalence of organized crime (Campania, Puglia, Calabria, and Sicilia). Six PBs that do not belong to any of the three governance classes are excluded from the sample. Donation is the number of blood bags (each bag contains 16 ouncesof blood) per million inhabitants in province col-lected by AVIS, the Italian association of blood donors, in 1995 among its members. Referenda voter turnout covers participation in all referenda between 1946 and 1987 averaged through time at the province level. Share of people who trust is measured at the province level from the World Value Survey for Italy 1990 and 1999. Sample size falls because these variables are not available for eight provinces. More details on the construction of the social capital variables can be found in the appendix of Guiso et al. (2004), who kindly provided the data.
*** Significant at the 1 percent level. ** Significant at the 5 percent level. * Significant at the 10 percent level.