UNIVERSITY OF PISA
Department of Agriculture, Food and Environment
Master of Science
in
Plant and Microbe Biotechnologies
In vitro characterization of promiscuous biotinylation by
biotin ligase
Supervisors:
Candidate:
Dr. Marek Mutwil
Camilla Ferrari
Dr. Rodolfo Bernardi
Co-supervisor:
Prof. Annamaria Ranieri
iii
Contents
Abstract ... v
Acknowledgements ... vii
1. Introduction ... 1
1.1 Protein-protein interaction ... 1
1.2 Current methods ... 2
1.2.1 Biochemical methods... 2
1.2.2 Biophysical methods... 4
1.3 Upcoming techniques ... 5
1.4 Biotinylation reaction ... 6
1.5 Current techniques involving proximity dependent
biotinylation ... 10
1.5.1 INTACT
... 10
1.5.2 PUB-NChIP
... 11
1.6 BirA dependent promiscuous biotinylation ... 12
1.6.1 BioID
... 14
1.7 Aim of the project ... 16
2. Materials and methods ... 17
2.1 Cloning of BirA and GST in protein expression vectors .... 17
2.2 Expression analysis ... 18
2.3 Protein purification ... 19
2.3.1 Protein purification using histidine-tag
... 19
2.3.2 Protein purification using GST tag
... 19
2.4 SDS-PAGE analysis... 21
iv
2.6 Protein quantification ... 22
2.7 Protein activity assays ... 22
2.7.1 Optimizing substrate concentrations
... 22
2.7.2 Reaction time
... 23
2.7.3 Deducing temperature and pH optima for the reaction
... 23
3. Results ... 24
3.1 Protein expression ... 24
3.2 Proteins purification ... 25
3.2.1 Batch purifications
... 25
3.2.2 Affinity chromatography
... 28
3.3 GST cloning and purification ... 30
3.4 Activity assays ... 31
3.4.1 Optimization of substrate composition
... 32
3.4.2 Reaction time
... 35
3.4.3 Optimal temperature... 37
3.4.4 Optimal pH... 41
4. Discussion ... 43
Appendix I... 49
Bibliography ... 51
v
Abstract
Protein-protein interaction networks represent useful system to better understand the organization of the proteome and, moreover, provide a support for identifying protein functions. Thus, identification of these interactions would help to reach an improved comprehension of the entire cell. Most popular methods for detecting protein interactions are either in vitro assays or are based on heterologous systems, both of which do not represent true cellular environment. Thus, a lot of research is directed towards development of new methods that detect interactions under in vivo conditions, so as to preserve the spatio-temporal integrity of these interactions. One of such methods involve the biotin protein ligase (BirA) from Escherichia coli, which is responsible for catalyzing transfer of a small molecule, biotin, to a specific lysine residue (within a specific conserved sequence) of acceptor proteins. This reaction is highly specific, with only one protein in E. coli capable of being biotinylated in vivo. A mutation in BirA (R118G; BirA*), however, reduces this specificity such that the intermediate of reaction (biotinoyl-AMP) is released from the active site of the protein and can biotinylate any protein that it encounters. Based on this principle, if we fuse a protein with BirA*, the proteins that come in proximity of the fusion construct should be biotinylated and could further be identified by a streptavidin pull-down.
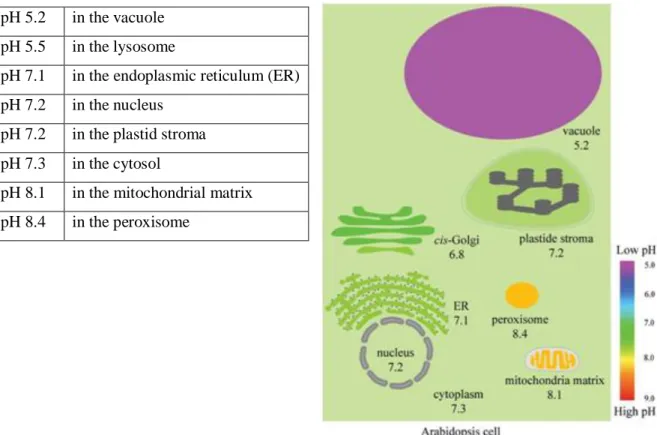
In order to develop this technique in plants, the enzymatic properties of BirA* need to be characterized. The current project was focused on purifying BirA* (codon optimized for expression in Arabidopsis thaliana) from bacteria and assessing its enzymatic properties under different physiological conditions. To this end, GST-6X Histidine fused BirA* was purified using inducible bacterial overexpression system and checked for promiscuous biotinylation of non-native target, i.e., free glutathione S-transferase (GST) protein. Further, the substrate concentration, temperature, reaction time and pH conditions for the progress of reaction were optimized. The results generated by the current study verify that BirA* can catalyze promiscuous biotinylation, therefore it would be worthwhile to extend this system in plants for detection of protein-protein interactions. Moreover, if BirA* is selectively overexpressed in a specific cellular compartment, it has potential to biotinylate most of the proteins within this compartment. As different cellular compartments differ in pH, the present study also
vi helped to short-list the compartments whose proteome could be deciphered using BirA*.
To summarize, the present study verified that BirA* based proximity-biotinylation technique could be used to develop an in vivo assay for detecting protein interactions and to decipher organellar proteome. Also, we were able to optimize the reaction conditions at which the enzyme is most active.
vii
Acknowledgements
I would like to express my gratitude and deepest appreciation to Dr. Marek Mutwil who gave me the great opportunity to work with his amazing group in a stimulating environment such as Max Planck Institute for Molecular Plant Physiology.
I gratefully acknowledge the precious advice of my supervisor Dr. Neha Vaid who helped me to carry out my project especially in writing this thesis, for her patience in answering my many doubts and for her support.
I also want to thank all of the colleagues and friends for the amazing time spent together and for the kind support they gave me in the discouraging moments.
A special thanks to Dr. Julia Smirnova for introducing me to ÄKTA Protein Purification Systems, a fundamental help to succeed in protein purification.
I would also like to express a sincere gratitude to Dr. Rodolfo Bernardi, who has always encouraged me to pursue this experience and motivate me in expanding my knowledge. I also want to express my gratitude to my parents for their love and understanding.
1
1. Introduction
“Understanding how cells work requires understanding how proteins function”. (Alberts et al., 2002)
Proteins are the most abundant macromolecule in the cell, constituting half of the dry-weight of an E. coli cell. Proteins are called the ‘workhorses’ of the cell, as they carry out the functions encoded by the genetic make-up of the living organism. They form structural and functional backbone of the entire cell and are involved in the majority of biological processes, such as DNA replication, transcription, protein translation, cell growth, proliferation, intracellular communication, apoptosis and many more. For many years, protein function analysis was based on the study of a single protein, however, it is now recognized that these processes are carried out not by proteins in isolation but instead complex protein networks, in which they interact with each other to carry out their biological activity. Consequentially, to understand the function of a protein within cell, it is of fundamental importance to analyze their function in context of their interacting partners.
1.1 Protein-protein interaction
Protein–protein interaction (PPI) is an event, due to electrostatic and/or biochemical forces, that leads to an intentional physical contact between two or more proteins. The interactions established between two proteins can modulate the biological function of the molecules involved. PPIs are widely present virtually in every cellular pathway such as, transport machinery across membranes, packaging of chromatin, network of sub-membrane filaments and signal transduction, regulation of gene expression etc. (Royer, 1999).
Proteins can interact amongst themselves mainly by utilizing non covalent interactions such as, hydrogen bond, salt bridges, hydrophobic bonds, van der Waals forces, and rarely by covalent interactions such as disulphide bonds. These interactions are formed at specific binding domain of each protein that can be composed of few amino acids or can be represented by a large surface on their tertiary structure. The size of this domain
2 and the type of interaction determines the strength of the binding. According to their strength, the interactions could be classified as stable/strong and transient/weak interactions. For example Ras proteins, a family of GTP-ase involved in signal transduction within the cell, form tight complex with their partner when they are bound to GTP. This complex becomes weak when GTP is replaced with GDP. G-proteins show the similar behavior: the Gα subunit complexed with GDP forms a strong transient interaction with Gβγ subunits, but the trimer dissociates when Gα subunit binds GTP (Ozbabacan et al., 2011).
1.2 Current methods
As PPIs are backbone of all cellular processes, several methods have been developed for their investigation. These include several biochemical methods (such as co-immunoprecipitation, yeast two-hybrid assay, bi-fluorescence complementation assay etc.) and biophysical approaches (such as fluorescence anisotropy, NMR spectroscopy, isothermal titration calorimetry etc.)
1.2.1 Biochemical methods
Amongst the most popular biochemical techniques is the yeast-two hybrid system (Y2H), which is based on the principle that eukaryotic transcriptional activators (GAL4, used in most cases) consist of two domains: a DNA binding domain that recognizes a specific DNA sequence and an activation domain, which summons and coordinates all of the elements required for transcription. An interaction between two proteins fused to these domains would bring the activation and binding domain in proximity, allowing transcriptional activation of GAL4, which is used as a marker (Chien et al., 1991). Y2H system, developed to screen whole cDNA libraries to identify interacting partners for a protein of interest, has been successfully employed in identifying protein interactions from several organisms. For example, this technique has helped in identification of plant disease resistance as the interaction between the protein RPS2 of Arabidopsis
thaliana and the product of the avirulence gene avrRpt2 of Pseudomonas syringae
3 development and their network of interactions, such as the products of most of floral homeotic genes belonging to the MADS box family and specific floral organ identity in
Antirrhinum (Davies et al., 1996). Another example of the application of Y2H is in the
study of self-incompatibility mechanisms to further characterize the interactions between the Brassica S-receptor kinase (SRK) and its substrates (Mazzurco et al., 2001).
Another classical method used to detect PPIs is pull-down assay, which is based on affinity purification of protein complexes from cell lysates. Affinity purification linked to mass-spectrometry has been successful in identifying proteins involved in plant immunity, as the interaction partners of the RPM1-interacting protein 4 (RIN4) complex from A. thaliana, target of AvrRpt2 of Pseudomonas syringae (Liu et al., 2009). Apart from Y2H and protein pull-down assay, both of which are able to identify several interacting partners for a particular protein, several techniques such as bi-fluorescence complementation assay (BiFC), fluorescence resonance energy transfer (FRET) assay etc., are generally employed to test the interaction of one protein with another. In these techniques, proteins for which interaction is being tested, are fused with two different tags/fluorophores. For example, in case of BiFC, the two proteins are fused to two halves of fluorescence protein (such as YFP) so that there is YFP fluorescence only if the two proteins interact. All the above mentioned techniques have been successful in identification/confirmation of several protein interactions. However, these techniques have several application and efficiency based limitations. Techniques such as BiFC are successful in confirmation of putative interactions but they cannot be applied for detection of protein interactions in a high-throughput manner. On the other hand, affinity purification that helps in identification of protein complexes is based on an in
vitro assay carried out on cell lysate where protein interactions lose their spatial
integrity.
Another limitation of these techniques is the lower probability of detecting transient/weak interactions due to stringent washing steps required to eliminate false positive interactions. Contrary to affinity purification, Y2H is an in vivo technique but faces problems of detecting high percentage of false positive and false negative interactions due to heterologous post-translational modification machinery and overexpression of protein of interest, leading to detection of unspecific/false interactions. Moreover, Y2H system does not maintain spatial integrity of interactions as proteins are assessed for their interaction inside yeast nucleus, which for most of the
4 proteins is a non-native environment for interaction. Also, proteins with localization tags to other cellular compartments might not be transported to nucleus and thus they would remain undetected by the system. In addition to these problems, the currently available techniques have not been very successful in detecting interactions for membrane-bound proteins, proteins present in low-abundance and weak/transient interactions.
1.2.2 Biophysical methods
The study of the interactions between proteins is covered not only by biochemical methods: the developing of biophysical tools has drastically increased, so that biophysical techniques became an important branch of the study of proteins interactions.
Amongst them, FRET similarly to BiFC, uses two proteins fused to two fluorophores, one of which emits fluorescence when being excited by emission wavelength of the other fluorophore, when both are present in very close physical proximity, thus serving as an indicator of interaction between the proteins being attached to them.
It was used to show specific interaction between the two photoreceptors, phytochrome B (phyB) and cryptochrome 2 (cry2), in Arabidopsis living cells occurring in flowering time, hypocotyl elongation and the light-dependent translocation of the complex to the nuclear speckles (Más et al., 2000). Similarly to BiFC, FRET cannot be applied for detection of protein interactions in a high-throughput manner. Differently from FRET, which needs the proteins to be tagged, the dual polarisation interferometry (DPI) does not require tags but one of the two proteins being investigated must be immobilized on the surface of a waveguide. Two light beams will pass through the waveguide producing an interference pattern. The presence of the interacting protein causes one of the light beams to form an altered polarization, thus changing the pattern, which is registered by measuring the refractive index and reflects a specific mass, density and thickness of the protein in real time (Freeman et al., 2004).
Another recent biophysical technique is the microscale thermophoresis (MTS), similarly to DPI, it permits to detect conformation, charge and size changes of a complex. The method is based on the registration of motion of the molecules along microscopic temperature gradients. Differently from DPI, it does not need an immobilized protein,
5 so, the measurements are closer to native conditions. Even if this method is highly specific, it shows a low sensitivity; it can reveal a lot of interactions but wrong predictions as well.
Amongst the biophysical techniques to detect PPIs, one of the most popular techniques is nuclear magnetic resonance (NMR). Currently many NMR-based methods have been developed; the basic principle is represented by magnetically active nuclei orientated by a strong magnetic field that absorbs electromagnetic radiations at specific frequencies. The characteristics of these frequencies depend on the chemical environment, influenced mostly by chemical bonds and molecular conformations. An example of the use of this method is represented by the partially characterization of the protein interactions of phytochrome A (phyA) in Avena sativa (Song et al., 2012). The advantage of this technique lays in its capability of capturing very weak interactions.
1.3 Upcoming techniques
New methods that can solve the limitations of existing techniques are currently being developed. One of these techniques is based on label transfer technology, in which bait protein is modified so as to covalently transfer a detectable probe on the proteins interacting with it. An example is given by the use of 3,4-dihydroxyphenylalanine-biotin-4′,5′-bis
(1,3,2-dithioarsolan-2-yl)fluorescein (DOPA-biotin-FlAsH) coupled with a tetra-cysteine sequence which represents the FlAsH receptor. Tagging a protein of interest with this sequence results, after the periodate oxidation, in the transfer of the biotin tag to the interacting protein. The proteins will not need a covalent modification (Liu et al., 2007; Fancy, 2000).
Many varieties of cross-linking reagents had been developed in the past years; few examples are nickel-peptide chelate which proved the hydrophobic interactions between F-actin and skeletal myosin sub-fragment 1 (Bertrand et al., 1997), oxidatively-activated manganese and iron porphyrins (Campbell et al., 1998) and photogenerated oxidant for a photo-induced cross liking (Fancy and Kodadek, 1999).
Several modifications of these techniques are currently available and being developed further. Amongst these are several modifications of biotinylation based methods.
6
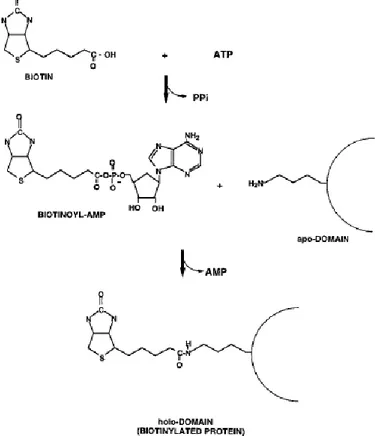
1.4 Biotinylation reaction
Biotinylation is a biochemical process that allows the attachment of a small molecule, biotin, to a protein, nucleic acid or to another molecule (Samols et al., 1988) (Fig. 1) and it is catalyzed by biotin protein ligase (BPL) family proteins. BPL family is composed of two groups: group I ligases, without an N-terminal DNA-binding domain and group II ligases (such as BirA) with an N-terminal DNA-binding domain (Mukhopadhyay et al., 2001). BirA represents the BPL of E. coli and carries out biotinylation reaction in two steps: in the first step biotin interacts with ATP to form the activated biotin called biotinoyl-5`-AMP (bio-AMP), while releasing a pyrophosphate. This bio-AMP remains hidden in BirA’s active site until it reacts with a specific lysine residue (Lane et al., 1964) of the biotin acceptor tag (BAT) sequence, which is a 15-amino acid consensus sequence (GLNDIFEAQKIEWHE) (Beckett et al., 1999), thus transferring biotin to the ε-amino group of the lysine residue in the target protein.
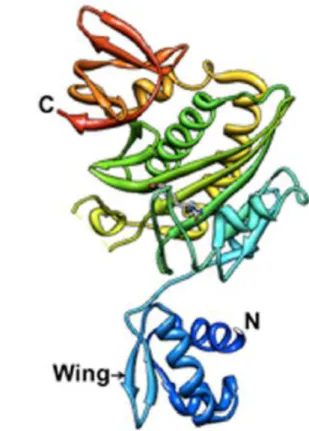
7 BirA is a monomeric 35 kDa protein composed by 321-amino acids arranged in three different domains (Wilson et al., 1992): N-terminal domain, central catalytic core, C-terminal domain (Fig. 2). The first domain is responsible for the DNA-binding capacity and contains an N-terminal winged helix-turn-helix (wHTH) structure. This kind of domain is common for a large number of bacteria and represents the conservation of the transcription repression function in ligases (Beckett, 2007). The central domain binds ATP and biotin to catalyze bio-AMP synthesis. It has a sequence that is well conserved between all of BPL members. The C-domain is involved in DNA binding, dimerization and catalytic function (Streaker and Beckett, 1999; Chakravartty and Cornan 2012). Enzymatic biotinylation is an extremely specific reaction and only one protein in E. coli (biotin carboxyl carrier protein subunit of acetyl-CoA carboxylase) and four proteins in
A. thaliana (homomeric acetyl-CoA carboxylase, heteromeric acetyl-CoA carboxylase,
geranoyl-CoA carboxylase, and methylcrotonyl-CoA carboxylase) are biotinylated in nature. All of these proteins are key enzymes in metabolic pathways and biotin represents an important cofactor. Furthermore, biotin also seems to be involved in gene regulation.
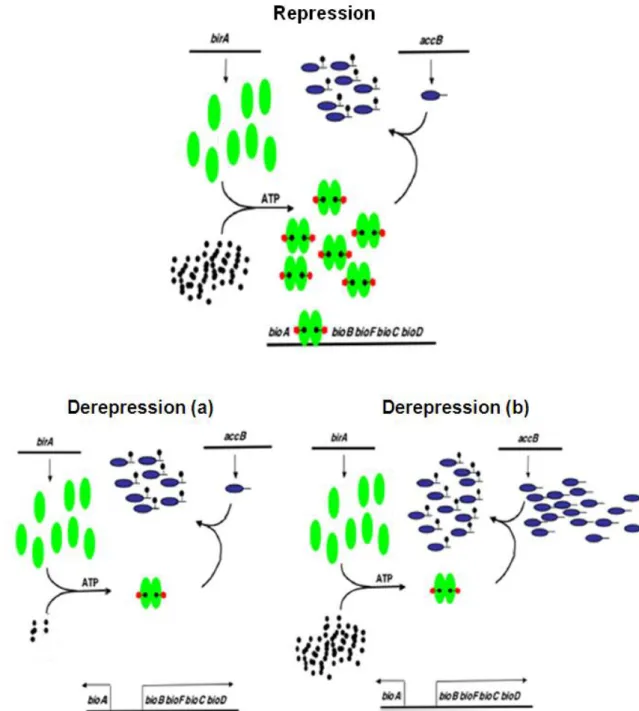
8 Biotinylation is a highly regulated process. Kinetic studies and thermodynamic measurements revealed that the affinity of the central domain is higher for biotin compared to ATP. It is suggested that biotin binds the domain as first, leading to reorganization thus facilitating ATP binding (Wilson et al., 1992). Biotinylation reaction is also regulated at transcriptional level. In presence of an excess of biotin, BirA dimerizes and binds the biotin biosynthetic operon (bioABFCD) leading to the inhibition (repression) of biotin synthesis. If there is, instead, a lack of biotin or an excess of acceptor proteins, the dimeric form will not be formed, the operon will be active and it will transcribe biotin (derepression) to carry out biotinylation reaction (Fig. 3).
9
Fig. 3. Biotin transcription regulation. BirA is represented by the green ovals, the black dots are biotin, the reds are bio-AMP and the blue tailed ovals are the natural acceptors, AccB. Repression occurs when biotin is abundant and this leads to BirA dimerization. In the dimeric form BirA binds biotin operon and biotin synthesis is stopped (repression). This will not occur when there is a lack of biotin or an excess of acceptor protein, so that there is biotin transcription (derepression) (Chakravartty and Cronan, 2013).
10
1.5 Current techniques involving proximity dependent
biotinylation
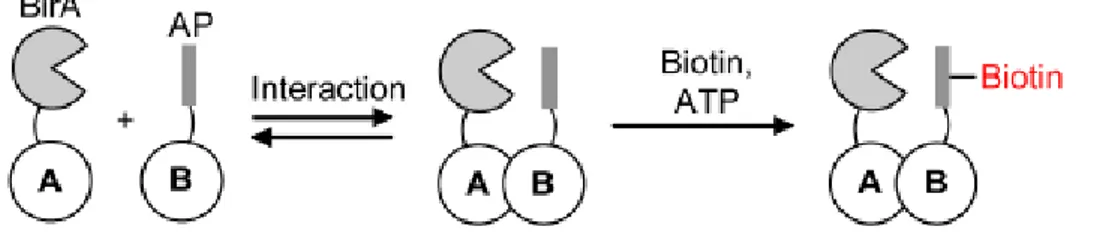
The current techniques utilizing biotin labeling to detect protein interactions are based on the specific biotinylation of BAT sequence by BirA. BirA is able to recognize this minimal recognition sequence with a high specificity and biotinylate it. In several variations of this method, BAT sequence and BirA are fused to two proteins under investigation. If they interact, then BirA would come in proximity of the BAT sequence and thus biotinylate it (Fig. 4). Some of these methods are described below.
Fig. 4. General model of BirA use to detect protein-protein interaction. BirA could be fused to a protein A and the acceptor peptide (AP) to a protein B that could interact with BirA. The interaction will be detected by the biotinylation of the acceptor peptide (Fernández-Suárez et al., 2008).
1.5.1 INTACT
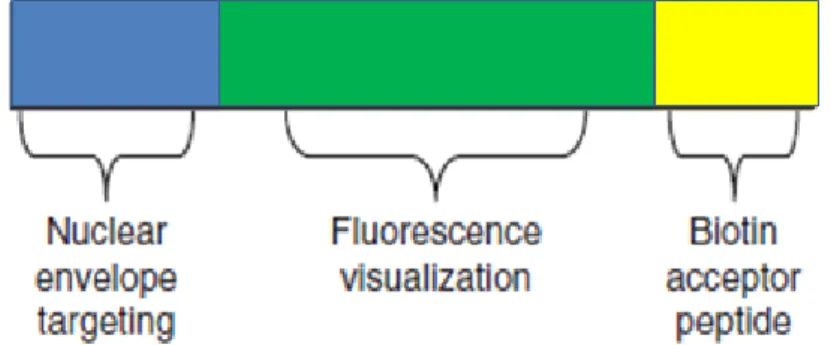
Isolation of Nuclei TAgged in specific Cell Types (INTACT) has been developed to isolate and purify cell-type-specific nuclei from the total pool of nuclei in a tissue. This method uses the BirA expression coupled with the expression of a nuclear targeting fusion protein (NTF). The fusion protein has to be composed by three different parts: a protein domain which allows the nuclear envelope association, a portion that allows the visualization (green fluorescent protein, GFP), and, finally, the biotin ligase recognition peptide (BAT) (Fig. 5). The expression of NTF and BirA in the same cell type leads the biotin-labeling of the nuclei only in those cells, which can subsequently be purified using streptavidin mediated affinity chromatography.
11 The same strategy has been successfully used in Arabidopsis thaliana (Deal and Henikoff, 2011), in Caenorhabditis elegans and in Drosophila melanogaster (Steiner et
al., 2012).
Fig. 5. The nuclear targeting fusion protein (NTF). The blue part is the nuclear domain; the green one represents GFP and the yellow, the peptide that will be biotinylated by BirA. (Modified from Deal and Henikoff, 2010)
1.5.2 PUB-NChIP
Proximity Utilizing Biotinylation with Native ChIP (PUB-NChIP) has been developed to detect the interaction between chromatin and a protein of interest. It is based on chromatin immunoprecipitation (ChIP), widely used to study in vivo association between a DNA sequence and a regulatory protein. In this strategy, E. coli BirA is fused to a protein of interest (transcription factor or another nuclear protein) and is co-expressed with a BAT-tagged histone. Under these conditions the histone will be incorporate into chromatin and BirA will biotinylate it every time the protein of interest interacts or will be close to it (Shoaib et al., 2013). The labeling gives the possibility of isolating DNA associated with the histone subpopulation in proximity to the protein of interest. It is called native ChIP because exploits the strong interaction established between core histones and DNA, escaping the risk of cross-linking during the purification (O’Neill and Turner, 2003; Ooi et al., 2010). With this modified approach it is also possible analyze the protein which interacts with the purified DNA and not only the DNA portion of the complex. Despite this seems that its resolution is lower compared to ChIP (Shoaib et al., 2013). The methods described above utilize specific
12 biotinylation reaction under in vivo conditions and can overcome limitation of identifying false positives and can detect transient and weak interactions. However, their application in identifying PPIs is still limited to identifying one-to-one interactions. Another modification in the BirA dependent biotinylation system called promiscuous biotinylation, however, seems to overcome this limitation.
1.6 BirA dependent promiscuous biotinylation
BirA mediated biotinylation reaction is a highly specific reaction which occurs between BirA and BAT sequence of the acceptor protein. The specificity is mainly due to the structure of the central domain of BirA, which after formation of bio-AMP in its active site, restructures itself, thus preventing leakage of bio-AMP into vicinity and also prevents access of non-specific proteins to the active site. The analysis of X-ray crystallographic structure of BirA showed that a loop like structure within active site controls the sequestration ability of the bound bio-AMP. This loop appears disordered in native state of protein and more ordered when biotin occupies the active site (Weaver
et al., 2001). It has been shown that in two mutants, G115S and R118G, with a
defective binding of biotin and bio-AMP, but not ATP, this loop is altered. The same altered bound capacity has been shown in BirA Δ1-34, protein lacking the N-terminal domain. In these mutants the biotin bound is weak but nevertheless, they are able to catalyze the formation of bio-AMP. Since the dissociation constants of these mutants for bio-AMP is greater compared to the wild-type, this molecule is released immediately (Kwon and Beckett, 2000; Xu and Beckett, 1996).
Moreover, it has been described that one of this mutant form of BirA (BirA*, R118G), which shows a dissociation constant for biotin 100-fold greater than the wild-type and for bio-AMP 400-fold greater, is getting itself biotinylated in vivo. This level of self-biotinylation increases with the enzyme concentration. This mutant acts exactly as a promiscuous biotinylation reagent, since it was found that it biotinylated not only itself, but also several different proteins that normally do not carry this modification (Choi-Rhee et al., 2004). Two hypothesis have been proposed to explain the promiscuous biotinylation of these mutants: it could be due to the chemical acylation by bio-AMP released from the mutant’s active site or, alternatively, to the capacity of the lysine side
13 chain of a promiscuous acceptor protein to access to the active site of the enzyme due to disordering caused by the mutation. The first hypothesis is the preferred as it seems highly unlikely that BirA* active site could rearrange itself to allow a generic lysine residue side chain the access, without losing the ability of sequestering bio-AMP (Choi-Rhee et al., 2004). Thus if BirA* is introduced in a cellular system, it would retain its catalytic activity to synthesize bio-AMP from biotin and ATP, but it would release bio-AMP in its vicinity soon after its formation. The released bio-bio-AMP, due to its reactive nature, should then be able to biotinylate any protein that comes in its close vicinity. To develop this characteristic as a technique to identify PPIs, if BirA* is fused to a protein of interest, the proteins present in its proximity will be biotinylated (Choi-Rhee et al., 2004). This includes the proteins that interact directly or indirectly (via complex formation) with the protein of interest. Thereafter, utilizing the extraordinary affinity between biotin and avidin/streptavidin (Kd = 10-14 M; Green, 1963), simple affinity purification would allow isolation of the tagged proteins in a rapid and easy manner. The formation of this bond is extremely rapid and is a permanent modification that persists through the life of the protein and once formed is not affected by variables such as pH, temperature, organic solvents and other denaturing agents.
This technique, if employed to the living system, should be able to overcome all the limitations encountered by the current techniques as it is an in vivo technique, that can maintain spatio-temporal integrity of the interactions, also can be utilized to identify whole complexes interacting with a protein including transient and weak interactions. Also, this technique is suitable to be extended to low expressing or membrane bound proteins. One could, however, contemplate about few possible problems associated with the technique. First, leakage of bio-AMP in a large cellular area rather than restricted vicinity could result in biotinylation of non-specific proteins leading to false positives. However, bio-AMP as such acyl-adenylate is an unstable molecule and, as a mixed anhydride, is highly labile to hydrolytic degradation. Thus even if the active molecule is diffused, it would be rendered ineffective soon after its leakage. Secondly, biotinylation being a very specific modification in nature could render the non-native biotinylated protein inactive, thus affecting its interactions. However, since biotin is a very small molecule, even smaller than a globular protein, it should not significantly interfere with the normal activity of the protein. Moreover, the small size permits many biotin molecules to bind to the same protein, thus allowing a better detection. Third problem could be associated with the control of the reaction. Biotin is always present in a cell
14 and can thus increase the bio-AMP cloud in an uncontrollable manner. However, Choi-Rhee et al. (2004) have shown also that biotin and ATP are necessary for the activity of this enzyme. Also, experiments by Roux et al. (2012) revealed that biotin level primarily regulates the biotinylation reaction; and its concentration in a standard complete media and thus in cellular environment is not sufficient to cause the reaction. Therefore, to build up the bio-AMP cloud, external supplementation of biotin is necessary. Based on this principle, proximity based biotinylation technique called BioID has been developed in yeast.
1.6.1 BioID
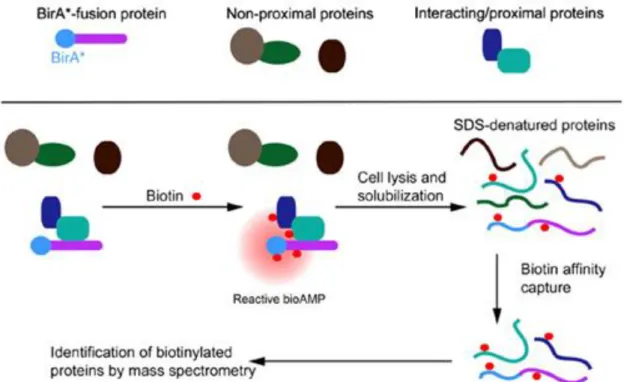
BioID, uses the modified form of E. coli biotin ligase (BirA*) to tag proteins. As mentioned above, the fusion between this enzyme and a protein of interest would allow identification of the other proteins that come in contact with it (Fig. 6). This methods has been used in mammalian cells by Roux et al. (2012), applying BioID to an intermediate filament protein in the nuclear lamina, lamin-A (LaA), and, by Morriswood et al. (2013) in Trypanosoma brucei, a protozoan parasite, to study its cytoskeletal structure exploiting the TbMORN1 protein. This technique allows to detect potential candidate interactors in their natural environment, included the membrane protein. Since the biotinylation occurred before solubilization, it is enough to detect even weak interactions.
It has been shown that this biotin supplementation has an effect only on BirA* and not on the wild-type form of the enzyme; in fact it was detected a massive stimulation of promiscuous biotinylation after the biotin addition (Fig. 7) (Roux et al., 2012).
15 Fig. 6. Model of BioID (Roux et al., 2012)
Fig. 7. Comparison between HeLa cells transfected with myc-BirA-WT or myc-BirA* with and without biotin supplementation (Roux et al., 2012).
16
1.7 Aim of the project
The above mentioned technique till date has only been applied in yeast or animal system. The project which I was a part of, aimed to transfer and further develop this method to detect PPIs in plants, the originality and the innovation of this, lies in its utilization. In addition to utilizing of this technique to identify PPIs, the project aims to extend the same principle to prepare an inventory of the proteins present in a particular cellular compartment. To achieve this, compartment localization tag would be fused to N-terminus of BirA* so that it is targeted to the compartment, where upon supply of excess of biotin, the whole compartment would essentially be filled with bio-AMP cloud, thus biotinylating all the proteins present in this compartment, without affecting proteins of any other compartment. This technique has advantage over the existing technique of sub-cellular fractionation that is generally employed to identify organelle proteome inventories, that it would be less time and skill consuming and would also prevent the problem of cross-contamination of proteins from other compartments, a problem most generally faced in sub-cellular fractionation technique.
Prior to its transfer to the plant system, it was essential to ascertain if the enzymatic characteristics of E. coli BirA* protein, allowed it to be utilized in plants. I was assigned to work on the in vitro characterization of protein activity under different physiological conditions. To achieve this, the gene was codon optimized for the expression in plant. The expression of prokaryotic proteins in other organisms usually leads to lower translation efficiency, so, some rare codons need to be replaced with others more frequent in plant cells. After that, the codon optimized gene was expressed in E. coli cells and purified. The purified protein was used in different assays to test the performance of protein activity under different conditions. The results indicate that the protein could be utilized for expression in plant system, and probably would be amenable to technology transfer to other crop species in future, thus opening new avenues in the field of proteomics.
17
2. Materials and Methods
2.1 Cloning of BirA and GST in protein expression vectors
Wild-type BirA (EG10123) from E. coli with R118→G mutation was codon optimized (from here forth referred to as BirA*) to allow efficient translation of the mRNAs in
Arabidopsis thaliana, and designed to express the enzymes with C-terminal HA-epitope
and FLAG tags to allow easier detection of the protein via immunoblotting. The synthesized gene was PCR amplified with high fidelity polymerase (Phusion Taq, Thermo Scientific, Hudson, NH, USA) using BirA specific primers (forward primer:
CACCAAGCTTAGCCTCGAGAGCC, reverse primer:
GCTAGCGCTGGTACCGCTGAATTC) and, cloned in pENTR™/SD/D-TOPO® vector (Invitrogen, Life Technologies, Grand Island, NY). The construct was subsequently sub-cloned in Gateway® Nova pET-60-DEST™ vector (Merck Millipore, Merck KGaA, Darmstadt, Germany) using LR clonase reaction (Invitrogen), as per manufacturer’s instructions. In order to purify GST protein as control, Gateway® Nova pET-60-DEST™ vector was modified by removing ccdB gene, lethal to most E. coli strains, using BamHI and PstI restriction enzymes (FastDigest, Thermo Scientific) followed by agarose gel purification using Zymoclean™ Gel DNA Recovery Kit (Zymo Research, Orange, CA) and nick filling (to generate blunt ends from the sticky ends) using Klenow Enzyme (Roche, Mannheim, Germany) as per manufacturer’s instructions. The vector was then re-circularized by ligating the blunt ends using T4 DNA Ligase (Roche) as per manufacturer’s instructions and transforming in E. coli DH5α competent cells (Invitrogen). The clones from both constructs were verified by sequencing analysis and transformed to Rosetta BL21(DE)pLysS chemically competent cells (Invitrogen). Briefly, 50 μL of Rosetta BL21(DE)pLysS competent cells were thawed on ice for 10 minutes and then incubated with 100 ng of purified pET-60-DEST™-BirA* or modified Gateway® Nova pET-60-DEST plasmid for another 10 minutes on ice, following which the cells were heat shocked by incubating in 42°C water bath for 30 seconds to allow the DNA enter into the cells and immediately incubated on ice for 2 minutes. The heat-shocked cells were further incubated for 1 h at 37°C at 200 rpm after addition of 1 mL LB medium. The transformation mixture (100 µL) was spread on LB plates with ampicillin (50 μg/mL, selection for the vector) and
18 chloramphenicol (50 μg/mL, selection for the competent cells) and incubated overnight at 37°C for selection of positive transformant, which were further verified by colony PCR. The PCR reaction mix composed of 0.25 mM dNTPs mix, 0.5 µM BirA* specific or Gateway® Nova pET-60-DEST, specific forward primer and reverse primers, 1.5 U DreamTaq DNA Polymerase (Thermo Scientific), 1X DreamTaq Buffer (containing MgCl2) and single bacterial colonies (picked by toothpick) was cycled for initial denaturation at 95°C for 10 min, 30 cycles of 95°C for 30 s, 58°C for 30 s, 72°C for 1 min and final extension at 72°C for 5 min. To check the PCR products, 5µL of reaction was loaded and run on 1% agarose (Sigma-Aldrich, Saint Louis, MO) gel, containing 5% GelRed™ (Biotium Inc., Hayward, CA) added for visualization of DNA bands and run at 100V till bands of DNA ladder (Thermo scientific) resolved and was visualized in UV-transilluminator 75S/02701 (Bio-Rad, Hercules, CA).
2.2 Expression analysis
A single PCR positive colony was used to inoculate 10 mL LB medium supplemented with ampicillin (50 µg/mL) and chloramphenicol (50 µg/mL), incubated overnight at 37°C on a shaker at 200 rpm and used as a primary inoculum to inoculated secondary culture (1%) supplemented with same antibiotics. The secondary culture was grown at 37°C at 200 rpm till the OD600 0.6-0.8, followed by the induction of the culture with 1 mM isopropyl ß–D-1-thiogalactopyranoside (IPTG) (Roche) and the incubation at 28°C for 6 hours at 200 rpm. IPTG is a synthetic analog of lactose and it is used to induce expression of cloned genes under control of the lac operon (Sambrook and Russell, 2001).
At the end of incubation period, the induced culture was harvested by centrifugation (Eppendorf Centrifuge 5810R, Swing-bucket rotor A-4-81) at 8000 rpmat 4°C for 20 min, and stored at -20°C until further used.
19
2.3 Protein purification
2.3.1 Protein purification using histidine-tag
For protein fused with 6x Histidine tag, nickel immobilized metal affinity chromatography (IMAC) was performed due to highly selective affinity of hexa-histidine for divalent metal ions. The purification was either performed manually with Ni-NTA agarose beads (Quiagen, Hilden, Germany) and HisPur Cobalt Spin Columns (Thermo Scientific) or using automated ÄKTA protein purification systems. For manual purification, the bacterial pellet was re-suspended in 10 mL of sonication buffer and incubated with 1 mg/mL lysozyme for 30 min at 28°C. The re-suspended culture was sonicated (Sonopuls homogenisator; Bandelin, Berlin, Germany), while being incubated on ice, using 3 cycles of 1 minute sonication at 70 amplitude and 1 minute of ice incubation to avoid heat induced protein degradation. The sonicated solution was then centrifuged (14000 g, 4°C, 2 min) and the supernatant was collected and used for protein purification. Prior to use, the Ni-NTA agarose beads were washed thrice with 3 bed volumes of native buffer (see appendix I). The washed beads were then incubated with the bacterial crude protein extract for 1 h at 4°C on a rotary shaker. After incubation, the unbound proteins were removed from column by two washes of 10 bed volumes of sonication buffer (see appendix I) and other two washes of 5 bed volumes of sonication buffer containing 20 mM imidazole. For protein elution, a step gradient of imidazole (40 mM, 100 mM, 150 mM, 300 mM, 500 mM, 1 M) was used and different fractions were analyzed using sodium dodecyl sulphate – polyacrylamide gel electrophoresis (SDS-PAGE) followed by Coomassie/Silver staining and western blot analysis.
In case of purification with HisPur Cobalt Spin Columns, the resin was washed once with 2 bed volumes of equilibration/wash buffer (see appendix I) and then incubated with the bacterial crude protein extract for 1 h at 4°C on a rotary shaker. Afterwards, the unbound proteins were washed out through three washes with 2 bed volumes of equilibration/wash buffer and then the protein were eluted with 1 bed volume of elution buffer (see appendix I).
For automated protein purification, the bacterial pellet was re-suspended in 30 mL of IMAC-buffer A (see appendix I) containing 1X protease inhibitors cocktail (Halt™
20 Protease Inhibitor Cocktail EDTA-Free, Thermo Scientific), 2 mM benzamidine and 2 mM aminocaproic acid, sonicated and centrifuged to collect crude bacterial protein extract which was subsequently filtered through 0.45 μm cellulose acetate syringe filter (Whatman, Florham Park, NJ).
The GE ÄKTA Explorer (Amersham Pharmacia Biotech, Piscataway, NJ) chromatography system, UNICORN 5.01 software with HisTrap-HP affinity column (GE Healthcare, Munich, Germany) were used for this purification as per manufacturer’s instructions. Briefly, 1 mL HisTrap-HP affinity prepacked column (Ni2+ immobilized on sepharose matrix) was washed with 2 column volumes of buffer A at flow rate of 1 mL/min. After washes, the protein was eluted by a linear imidazole gradient from 20 mM to 500 mM. The protein peak, which appeared at 370 mM imidazole concentration was collected and applied to the Superdex G-25 desalting column (HiTrap-Desalting; GE Healthcare) in order to change the buffer and remove contaminating salts. After desalting, the protein was eluted in 20 mM sodium phosphate buffer pH 7.
2.3.2 Protein purification using GST tag
For purification using GST tag, the bacterial pellet was sonicated and processed as mentioned above. The crude bacterial protein extract was subjected to two different types of purification, one, with magnetic GST beads (MagneGST™ Protein Purification System; Promega, Madison, WI) and another by Glutathione Sepharose 4B (GE Healthcare).
In the first case, the crude bacterial protein extract was incubated with magnetic GST beads for 1 h at 4°C under constant shaking. The beads were washed thrice using binding/wash buffer provided by manufacturer and eluted in three fractions of 100 µL elution buffer (see appendix I).
For purification with glutathione sepharose 4B, the resin was washed twice with 10 bed volumes of PBS (see appendix I) and incubated with crude bacterial protein extract for 1 h at 4°C on a rotary shaker. Before the elution, the unbound proteins were removed by three washes with 10 bed volumes of PBS. The elution was performed by three elutions with 1 bed volume of elution buffer (see appendix I).
21
2.4 SDS-PAGE analysis
SDS-Polyacrylamide (PAGE) were cast as described by Harlow and Lane (1988). The composition of resolving and stacking gels is described in appendix I. Prior to loading in gels, each sample was mixed with 1X Laemmli buffer (see appendix I), immediately boiled for 10 min and centrifuged at 13000 rpm for 15 min. The gels were run at 80V till the loading front entered the resolving gel and at 120V till loading front reached the bottom of the resolving gel. The gels were then carefully removed from the glass plates and used for either Coomassie/Silver staining or western blot analysis.
Gels stained through Coomassie brilliant blue staining were incubated for 1 h to overnight with Coomassie solution at gentle agitation and then subjected to de-staining solution for three hours. Fresh de-staining solution was added every hour.
Silver staining procedure was carried out using silver staining plus kit (Bio-Rad) as per manufacturer’s instructions.
2.5 Western blot analysis
Western blot analysis was performed to confirm presence of proteins of interest in bacterial protein extracts and purifications.
The proteins were resolved on 12% SDS-PAGE and then transferred on PVDF membrane (Immobilon-P, Merck Millipore) using Trans-Blot® SD Semi-Dry Transfer Cell (Bio-Rad). Briefly, the PVDF membrane (after 5 min incubation in 100% methanol) and blotting sheets were incubated in transfer buffer (see appendix I) for 2 min and assembled in the semi-dry transfer apparatus as per manufacturer’s instructions. The proteins were transferred on to PVDF membrane by applying 18 V for 1 h. The membrane was blocked by incubating in 3% blocking solution (3% Blotting Grade Blocking, Bio-Rad) in TBST buffer (see appendix I) for 1 h to overnight under constant shaking at 75 rpm at room temperature. The membranes were washed once with TBS (see appendix I) for 5 min and thrice with TBST for 5 min each, followed by antibody incubation 1:12,500 dilution of streptavidin Horseradish Peroxidase (HRP) Conjugate (Invitrogen), 1:20,000 dilution of anti-GST (Pierce, Thermo Scientific) as primary antibody followed by 1:20,000 dilution of HRP conjugated anti-rabbit antibody
22 (Sigma-Aldrich)in TBST and then they were subjected to several washing steps in TBS and TBST buffers. Detection of HRP conjugated antibody (and hence protein of interest) was carried out using SuperSignal West Pico Chemiluminescent Substrate (Thermo Scientific) for 5 min in dark followed by exposure to Amersham Hyperfilm ECL (GE Healthcare) in dark room and processed with an automated film developer (Hyperprocessor, Amersham Pharmacia Biotech, Piscataway, NJ) for variable times according to the signal strength.
2.6 Protein quantification
The protein concentration measurements were performed by Bradford assay (Bradford, 1976).
10 µL of protein standards/protein sample was mixed with 200 µL of 1:4 dilution (1 part Bradford reagent, 4 parts Milli-Q water) Bradford Reagent (Bio-Rad) in a 96 well microplate and incubated at room temperature for 30 minutes. The absorbance was measured at 595 nm using Synergy™ HT multiwell plate reader (BioTek Instruments, Winooski, VT) and Gen5 2.04 software. The protein concentration was determined by comparison with a standard curve prepared with BSA samples of known concentration ranging from 0.05 to 0.5 mg/mL for BirA*-GST and from 0.1 to 1 mg/mL for GST.
2.7 Protein activity assays
The activity of BirA*-GST protein was first optimized for different substrate concentrations (ATP and biotin concentration) and then tested under different physiological conditions, such as: time of incubation, temperature, and pH optima.
2.7.1 Optimizing substrate concentrations
First of all, the test to establish the concentration of biotin and ATP which enhance the protein activity was performed. We chose to test three different concentrations of ATP (5 mM, 10 mM, 15 mM) and three other for biotin (100 µM, 200 µM, 300 µM). To
23 enhance the solubility of biotin dimethylformamide (DFM) was used. All of the possible combinations were tested. The reaction was stopped by adding 1X Laemmli buffer to the reaction mix and boiling the mixture for 10 min. The samples were run in duplicate on 12% polyacrylamide gel and analyzed by silver staining and western blot analysis.
2.7.2 Reaction time
This experiment was carried out to estimate the minimum time required by BirA*-GST mediated GST biotinylation to reach its saturation. The reaction mixture was composed of 10 mM ATP (Thermo Scientific), 200 µM biotin (Sigma-Aldrich), 5.5 mM MgCl2, 100 mM KCl, 0.4 µg BirA*-GST, 0.8 µg GST. Each reaction tested for proximity biotinylation had a volume of 12 µL. The reaction was incubated at 37°C for 0 h, 2 h, 4 h or 20 h, then it was stopped as mentioned above and analyzed by silver staining and western blot analysis.
2.7.3 Deducing temperature and pH optima for the reaction
To optimize temperature for the reaction, the reaction mixture composed of 10 mM ATP, 200 µM biotin, 5.5 mM MgCl2, 100 mM KCl, 0.4 µg BirA*-GST, 0.8 µg GST was incubated at different temperatures for one hour. We tried first a wider range of temperatures (0, 4, 10, 16, 20, 28, 37, 42, 50°C) which were then narrowed to 28, 30, 35, 37, 40, 47, 50, 52°C and further to 35, 36, 37, 38, 39, 40, 41 and 42°C.
To assess the effect of different pH on the BirA* biotinylation, the reaction mixture (as explained above) was supplemented with either HCl or NaOH to achieve a pH range of 1 to 14 and incubated for 1 h at 37°C. The reaction mixtures were then inactivated by addition of 1X Laemmli buffer and analyzed by silver staining and western blot analysis.
24
3. Results
3.1 Protein expression
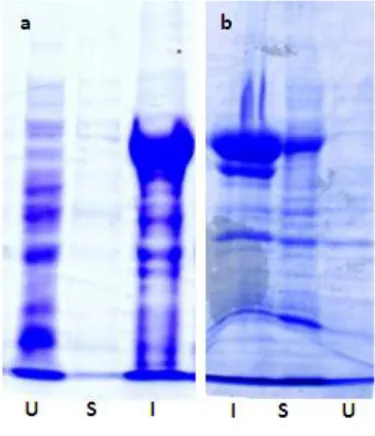
For the purpose of protein purification, they are generally overexpressed in bacterial system which can be a challenging task because several factors influence the process. The conditions for the expression have to be optimized for each protein, in order to obtain high yield of recombinant protein that are present in soluble form rather than inclusion bodies. The inclusion bodies are insoluble aggregates composed of densely packed denatured proteins (Kane and Hartley, 1988) and they are formed due to an inappropriate aggregation of partially folded or malfolded polypeptides (Mitraki and King, 1989), hence they represent an inactive form of the protein. As different proteins behave differently when subjected to induced overexpression, multiple experiments were set up to test different conditions of temperature and time of induction with IPTG. The conditions tested were: 3 h at 37°C; overnight at 20°C; 6 h at 28°C. After checking and comparing the uninduced and induced fractions, (separated in soluble and insoluble fraction, as mentioned in material and methods), 6 h induction at 28°C was chosen as the best induction conditions (Fig. 8) as under these conditions, there was an increase of the protein expression in the soluble fraction.
25
3.2 Proteins purification
3.2.1 Batch purifications
Gateway® Nova pET-60-DEST™ vector used for BirA*protein expression carries two different tags fused in frame with the gene namely: N-terminal GST tag and a C-terminal 6x-His-tag. Both tags were used for the purifications.
The soluble part obtained after sonication was used to perform the purification. As a first attempt to purify GST-6X Histidine fused BirA* protein, batch purification with Ni-NTA agarose beads was tried. This resin selectively binds proteins with hexa-histidine tag. NTA has four chelating sites for nickel ions and hexa-histidine is the amino acid that exhibits the strongest interaction with immobilized metal ion matrices, as nickel. Imidazole was used as an eluting agent because it is able to compete with the polyhistidine tag for binding to the resin. Several concentration of imidazole (from 20 mM to 1 M) and variable salt (NaCl) concentrations were used for elution. However, high protein purity could not be achieved by this method. According to the literature, Ni+2 chelate resins seem to achieve high protein yields with suboptimal purity. Cobalt
Fig. 8. Expression pattern of pET-60-DEST-CoBirA* under different conditions. (a) 3 hours incubation at 37°C. (b) 6 hours incubation at 28°C.
Respectively U is the uninduced fraction, S is the soluble part of the induced culture, I is the pellet from the induced culture.
26 instead, achieves high protein yield and purity with minimal optimization; it exhibits a more specific interaction resulting in less nonspecific interaction. Furthermore, cobalt resins display less metal leaching compared to Ni+2 resins. Therefore, we decided to switch to batch purification using cobalt spin columns. In this case as well, a protocol optimization with both salt and imidazole concentration was tried by increasing imidazole and NaCl concentrations in the washes to avoid the nonspecific interactions between proteins and the resins. These attempts did improve the purity level of protein, however, several impurities could still be detected (Fig. 9). The same results were obtained after a second purification, exploiting the GST protein fused to BirA*. We tried a second run of purification on the fractions coming from the two histidine purifications. Two different GST purifications were tested: one, using iron paramagnetic particles with reduced glutathione attached through its sulfhydryl group to the surface and encapsulated in cross-linked agarose and, another one, where the glutathione ligand was coupled via a 10-carbon linker to cross-linked 4% agarose. Glutathione is immobilized through its central carbon to preserve the essential structure necessary for efficient GST binding. In this case, the eluting agent used was glutathione as it competitively displaces the fusion protein bound to the resin, allowing it to be eluted. In this case as well, either the purity of the protein was not high or in the cases it was, the concentration of the protein was very low.
27 Fig. 9. Silver stained gels of GST-6X Histidine fused BirA*. (a) lane 1 marker, 2-9 elutions with a scale gradient of imidazole (100-150-300-500 mM) from Ni-NTA purification. Lane 10-12 elutions from GST purification using paramagnetic beads. The second purification was conducted on the sample in lane 2. (b) elutions with 150 mM imidazole from cobalt purification. (c) lane 1 marker, lane 2 elution from cobalt purification on which the second purification was based, lane 3-6 elutions from GST purification using sepharose beads.
28
3.2.2 Affinity chromatography
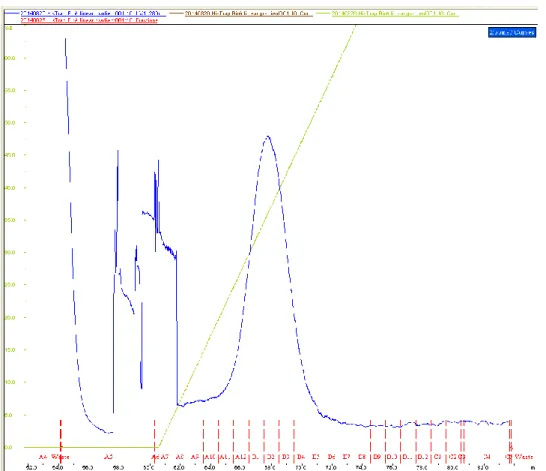
After attempts with batch purifications, a nickel immobilized metal affinity chromatography (IMAC) using the UNICORN™ controlled ÄKTAexplorer™ system was tried. The protein was eluted applying a linear gradient of imidazole and the peak appeared in correspondence to an imidazole concentration between 260 mM and 500 mM (Fig. 10). This peak included six fractions. These fractions were checked on 12% SDS-PAGE with silver staining (Fig. 11) and six of these were further chosen to be applied to the desalting column to prevent protein precipitation due to high ionic condition as well as to prevent interference of imidazole in subsequent assays. The fractions that appeared purer, albeit with a lower protein concentration (A12, B5), were mixed together. The same was done for the fractions more concentrated but with more impurities (B1, B2, B3, B4). After the desalting runs, two fractions of each pool were obtained. This run allowed to get rid of most of impurities, even though a loss of sample material was registered (Fig. 12).
Fig. 10. GST-6X Histidine fused BirA* IMAC chromatogram illustrates steadily increasing imidazole gradient (green) from 20 mM (100% buffer A) to 1 M (100% buffer B). The peak in the chromatogram obtained from absorbance values at 280 nm (blue) is caused by the elution of the protein. The previous not well defined peaks are because of impurities in the column.
29 F ig. 11 . H is T ra p p uri fic a tio n of Bi rA * -G S T us ing a n im id a zol e line a r gra d ie nt
30 Fig. 12. Desalted BirA*-GST fractions. Respectively 1 comes from the mixture between B1, B2, B3, B4 fractions and 2, from A12, B5 mixed together.
3.3 GST cloning and purification
As a control for the BirA* (GST fused) activity assays, GST protein purification was also attempted. As Gateway® Nova pET-60-DEST™ contains toxic ccdB cassette that prevents it from being cloned as an empty vector, a modified vector in which the ccdB gene was removed by enzymatic digestion was created. In order to generate blunt ends from sticky ends (caused by restriction digestion) nick filling by klenow enzyme was used. The sample was transformed initially in E. coli DH5α and later, after clone verification, in competent cells suitable for protein expression (RosettaDE3pLysS strain) (data not shown).
To purify GST protein, glutathione immobilized-paramagnetic particles were used (see materials and methods). The results as analyzed on 12% SDS-PAGE using Coomassie and silver staining revealed GST fractions with a high level of purity and good concentration (Fig. 13).
31 Fig. 13. GST purification on the mixed washes from the previous histidine purification. Coomassie (a) and silver staining (b). (a) lane 1 marker, 2-4 washes, 6-8 first elutions, 9-11 second elutions, 12-14 third elutions. (b) lane 1 marker, 2-3 first elutions.
3.4 Activity assays
The aim of the project was to study BirA*’s enzymatic activity in vitro in order to assess the possible use of this protein as a biotinylation agent. In order to test the promiscuous biotinylation we set up the reaction, using GST-6X Histidine fused BirA* and GST protein with the supplementation of ATP and biotin. As per the literature, under these conditions we should observe self-biotinylation of BirA* because of the presence of lysine residue within the N-terminus/HTH domain (Choi-Rhee et al., 2004) of BirA* and biotinylation of GST by the promiscuous BirA* due to interaction between GSTs (between GST provided as substrate and GST fused to BirA*).
In order to extend the usage of this protein as a detection method in plants, we performed different assays. The purpose was to identify the ranges in which BirA* showed higher promiscuous biotinylation so as to understand if this technique could be developed for several plant species (grown in different temperature conditions) and the cellular compartments (different pH). Since the most influential variables are temperature and pH, we performed two assays to test these two factors and other two
32 assays to identify the best concentration of ATP and biotin to supplement the reaction, and the time in which the reaction gives the best results.
3.4.1 Optimization of substrate composition
According to the literature, intracellular level of biotin is insufficient for BirA to carry out biotinylation reaction, thus, supplementation of media with biotin and ATP is essential (Choi-Rhee et al., 2004). Moreover, it has been shown in mammalian cells that a concentration of biotin-AMP similar or higher than 100 µM results in nonspecific biotinylation. On the contrary, 1 mM biotin gives lower signal compared to the one gave by 10 µM biotin; the explanation could be attributed to the difficulty to wash off biotin resulting in competition during streptavidin mediated pull-down assay (Howarth and Ting, 2008).
Therefore, optimization of biotin concentration was essential. Also, optimum ATP concentration was tested performing biotinylation experiments at three different concentrations which were chosen according to the ATP concentration in plant compartments.
The activity was checked by western blot using streptavidin antibodies after 1 and 24 hours incubation of the reactions. In the first experiment (1 h incubation, Fig. 14 a, b, c), GST biotinylation is lightly visible in most of the fractions except for the fraction where ATP has a medium concentration and biotin has the highest concentration (lane 7). Comparing this result with the silver stained gel the explanation become clear, the amount of BirA* is higher in this fraction compared with the others. A deeper analysis shows that in the lanes where ATP is at the lowest concentration (lane 2, 3, 4) we can observe the self-biotinylation of the BirA* but not of GST; however in the other lanes, where ATP is higher the GST biotinylation occurs. Except for the fraction mentioned before with a higher amount of BirA*, in all of the others the amount of BirA* loading was relatively similar.
In the other experiment (24 h incubation, Fig. 14d) we can see that after 24 hours the signal for BirA* self-biotinylation is present in every sample as well as the GST biotinylation. The difference resulted in the intensity of the signal reveals a higher biotinylation, both for the enzyme itself and the GST, with the middle conditions of ATP and biotin. The difference between the others is rather marked.
33 These results and those from the previous experiment led us to conclude that medium concentration for both the substrates would be the best to carry out all of the experiments.
Another thing came out from the second blot; unexpectedly the higher concentration of ATP seems to partially inhibit the reaction. In fact, if we compare the samples with the same amount of biotin but lower amount of ATP (Fig. 14d, lane 4) with those with the highest amount (Fig. 14d, lane 5), we can easily notice that in the latter lane the signal is lower.
34 F ig 14 . S ubs tra te ’s op tim isa tion as sa ys . ( a) sil ve r sta ine d g el of 1 h inc uba tio n e xpe ri m e n ts , 1 la ne is m a rke r, la ne s 2, 3 a n d 4 ha v e low er A T P c onc e n tra tion but re spe c tive ly low , m edi u m a nd hi gh bi o tin c o nc e nt ra tion; la n e s 5 , 6 a nd 7 h a v e m e d iu m c on c e n tra tio n of A T P a nd re sp e c tiv e ly low , m e di u m a nd hi gh of bi ot in a nd la ne 8 , 9 a nd 10 ha v e hi gh e r A T P c on c e n tr a tion and re spe c tive ly low , m e d ium a nd hi gh b iot in c on c e n tra tio n. (b) st rp -H RP b lot a nd (c ) a n ti-G S T bl ot . T h e tw o b lot s s how th e s am e loa d ing ord e r th a n the s ilv e r st a ine d ge l. (d ) st rp -H RP b lot o f 24 h in c ub a tion e xp e ri m ent s. L a ne 1 m a rk e r, la ne s 2 , 3 a nd 4 ha ve low e r bi o tin c onc e n tra tion a nd re spe c tive ly low , m edi u m a nd hi g h of A T P , l ane s 5 a nd 6 ha v e m edi u m bi o tin c o nc ent ra tion a nd re sp e c tiv e ly m e di um a n d hi gh c on c ent ra tion of A T P , l a ne 6 ha s hi ghe r c onc e nt ra tion o f A T P a nd b iot in a nd la ne 7 is th e n e g a tive c o nt ro l w ith hi gh e r A T P a nd bi o tin c onc e nt ra tion bu t w ithou t G S T .
35
3.4.2 Reaction time
Biotinylation, as all of the other enzymatic processes, is a time-dependent reaction; so, it became necessary monitoring the reaction progress over the time. The enzyme needs time to start the reaction and, after a while, it is possible detect the substrate saturation. In order to establish the time period in which the enzyme gives the best results in terms of GST-biotinylation, biotinylation reactions were incubated for different incubation times. For the reaction, three controls were set-up, two negative controls (BirA* without GST and second negative control containing GST without BirA*) and a proximity control. As the biotinylation is a proximity-dependent reaction, this control was set up to test if higher reaction volume would reduce GST biotinylation as compared to a reaction set-up in lower volume (same concentration of BirA* and GST). This experiment would help us deduce if GST biotinylation was due to crowding of reaction with GST and bio-AMP cloud or due to the fact that GST interacted with BirA*-GST and hence got biotinylated.
The control reactions were blocked after 4 hours.
As shown in figure 10, at time-point 0 (start of the reaction), no GST biotinylation was visible. The signal was already strong and saturated after 2 hours incubation at 37°C as no difference in level of biotinylation could be seen after 4 hours incubation at 37°C (Fig. 15).
36 F ig. 15 . T im e a ss ay m oni tor ing th e a ct iv ity of Bi rA * e nz ym e thro ugh th e ti m e. S ix e xp e ri m ent s w e re c ondu c te d. F irs t l a n e is 0 hour e xp e rim e nt , t h e n 2, 4 a nd 20. 4* re pre se nt th e prox im ity c ont ro l, B irA is the c ont rol w ithou t G S T a nd G S T is the c ont ro l w ithout B irA *. (a ) s ilve r s ta in e d g e l, (b ) i s st rp -H RP b lot a nd (c ) a n ti-G S T b lot . T h e lo a di ng or de r i s t h e sa m e for a ll of th e m .
37
3.4.3 Optimal temperature
The enzyme activity is mostly influenced by the temperature; in fact, for any chemical reaction, we can see an increase in the velocity of the reaction with the temperature. According to an empirical rule, the velocity increases two or three times every 10°C (Connors, 1990). Monitoring the enzyme activity at different temperature values generally gives a bell-shaped curve; the reaction rate increases with temperature to a maximum level, then, declines with further increases of temperature. This behavior is frequently described as temperature optimum. Majority of enzymes rapidly denature at temperatures above 40°C due to the instability of their 3-D structure, consequentially, leading to a decrease of product formation (Bisswanger, 2014).
The temperature dependency of BirA* activity was analyzed, initially, in large temperature range, between 0 and 50°C (Fig. 16A). The results showed higher activity between 28 and 42°C. After that, we tried the same assay with a narrower range, focusing only on the activity between 28 and 52°C (Fig. 16B). The activity was detected again between 28 and 42°C but was higher around 35-37°C. Finally, difference in the biotinylation activity was observed per degree rise in temperature. It showed that BirA* activity is almost the same between 35 and 42°C (Fig. 16C).
38 F ig. 16A . E ffe c t of te m p e ra tur e on b io tiny la tion a c tivi ty of B ir A *. ( a) s ilve r st a ine d ge l re pr e se n tin g 0 -50° C te m pe ra tur e ra nge , ( b ), (c ) bl o ts , st rp -H RP a nd a n ti-G S T re spe c tive ly , c orr e spondi ng to th e fr a c tions of ge l ( a ).
39 F ig. 16B . E ff e ct of te m pe ra tu re on bi o tin yl a tion a ct iv ity of B irA *. (a ) si lve r st a in e d ge l for 28 -30 °C te m p e ra ture ra ng e , (b ) st rp -H RP a nd (c ) a nt i-G S T bl o t c orr e spond ing to th e se fr a c tions .
40 F ig. 16C . E ffe c t of te m p e ra tur e on bi ot inyl a tion a ct iv ity of Bi rA *. ( a ), (b) , ( c ) si lv e r st a ine d ge l, st rp -H RP bl ot a nd a n ti-G S T bl ot from th e 35 -4 2 °C ra nge e xpe ri m e n ts .