Page 1
UNIVERSITY OF PISA
Research Doctorate School in
BIOLOGICAL AND MOLECULAR SCIENCES
Course in
EXPERIMENTAL AND MOLECULAR ONCOLOGY SSD: MED/06
XXV CYCLE (2010-2012)
THESIS TITLE:
ANALITIC AND CLINICAL VALIDATION OF
BIOMARKERS FOR NON INVASIVE EARLY
DIAGNOSIS OF BLADDER CANCER
Candidat e: Alessandro Apollo Tutor: Prof. Naccarato GA, Dr. Zavaglia K
Page 2
Page 3
“Yin and Yang”
“For the frog in the pond of the temple The lotus stems are tall, For the Divinities of the Everest mount One elephant is small”
“The Man is Sky and Earth in miniature” [Chinese Proverbs]
Page 4
SUMMARY
1. ABSTRACT 6
2. INTRODUCTION 9
2.1BLADDER CANCER:INTRODUCTION AND EPIDEMIOLOGY 9
2.2PATHOLOGY OF BLADDER CANCER (CLASSIFICATION OF BLADDER CANCER:TNMSTAGING
AND GRADING) 12
2.3CLASSIFICATION OF BLADDER CANCER (STAGING AND GRADING) 15
2.4CLINICAL FEATURES OF BLADDER CANCER 19
2.5STAGING OF BLADDER CANCER 20
2.6TREATMENT OF BLADDER CANCER 22
2.6.1 NON INVASIVE BLADDER CANCER 22
2.6.2 INVASIVE BLADDER CANCER 23
2.7MOLECULAR BIOLOGY OF BLADDER CANCER 24
2.7.1 FGFR3-TP53 PATHWAY IN BLADDER CANCER 26
2.7.2 CYTOKERATINE 19 AND 20(CK19 AND CK20) IN BLADDER CANCER 29
2.7.3 E-CADHERIN IN BLADDER CANCER 30
2.7.4 CD44 31
2.7.5 SURVIVIN 32
2.7.6 MIRNA AND BLADDER CANCER 32
2.8 GENETIC AND URINE: A NEW FRONTIER FOR AN NON-INVASIVE EARLY DIAGNOSIS OF
BLADDER CANCER 35
3. AIM 37
Page 5
4.1SAMPLE COLLECTION 39
4.2 DNA AND RNA EXTRACTION 40
4.3TP53 AND FGFR3 SEQUENCING 41
4.4 MRNA EXPRESSION ANALYSIS BY RT-PCR 42
4.5 MIRNA EXTRACTION FROM URINE SAMPLES AND MIRNA EXPRESSION ASSAY BY RT-PCR 44
4.6 STATISTICAL ANALYSIS 44
5. RESULTS 46
5.1GENE MUTATIONAL PROFILING 46
5.2GENE EXPRESSION PROFILING 50
5.3MOLECULAR GRADING MOLECULAR GRADING 56
5.4MOLECULAR MARKER IN URINE SEDIMENT 60
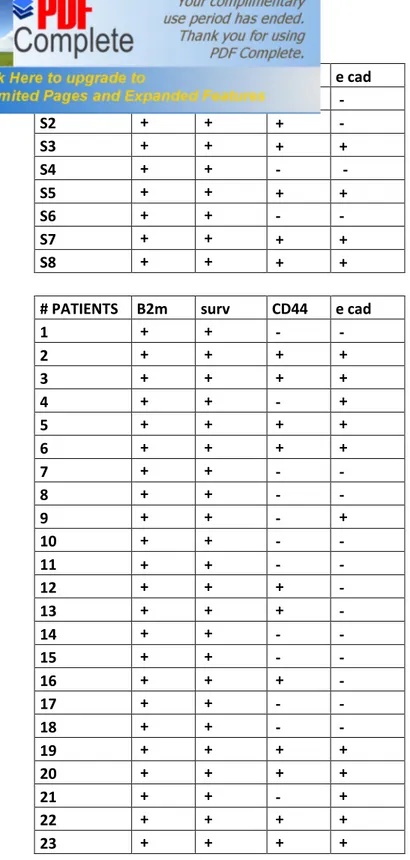
5.4.1 SURVIVIN,CD44 AND E-CADHERIN 60
5.4.2 MIRNA183 AND MIRNA96 DETECTION IN URINE SEDIMENTS: POSSIBLE BIOMARKERS FOR A NON
-INVASIVE EARLY DIAGNOSIS OF BC 62
6. DISCUSSION AND CONCLUSION 69
7. REFERENCES 72
8. ACKNOWLEDGEMENT 78
Page 6
1. ABSTRACT
Bladder cancer (BC) is the seventh most common cancer worldwide and its incidence has increased in the last 10 years. It is predominantly a disease of older males, with a median age at presentation of 60-65 years. There are geographical variations in incidence, in Europe the highest incidence rates for men are in northern Italy, Spain and Geneva, Switzerland.
The etiology is well defined, with the most common association being cigarette smoking and other factors including exposure to dyes and some industrial solvents, exhaust fumes.
Nearly 80% of new cases originate from diffuse flat hyperplasia also referred to as low-grade intraurothelial neoplasia. They are typically of low histologic grade, growing as superficial papillary protrusions, and have high propensity for recurrence but they practically never invade the bladder wall or metastasize. The remaining 20% of tumors are non-papillary and develop from severe displasia or carcinoma in situ (CIS), also termed high-grade intraurothelial neoplasia. About 10-15% of low grade superficial papillary tumors progress to invade the bladder wall and may metastasize [1].
Both types of cancer are significant problem for public health: papillary tumors are not usually life threatening but because of their high recurrence rate, they contribute to bladder cancer’s rank as most expensive in terms of clinical management. Although about half of muscle-invasive tumors do initially respond cisplatin-based chemotherapy, the development of drug resistance is the major problem, and the disease progression in resistant tumors is rapid and uniformly fatal [2].
Many factors, such as chromosomal anomalies, genetic polymorphisms, genetic and epigenetic alterations, contribute to tumorigenesis and progression of bladder cancer.
Page 7 Several authors have reported that the detection of single genetic abnormalities can improve diagnosis and surveillance of the disease
Different genes are well known to be involved independently in the development of BC, leading to loss of cell proliferation control (genes in FGFR3-p53 pathway), apoptosis resistance (i.e. Survivn) and promoting Epithelial Mesenchimal Transition (EMT) (i.e.: CK19, CK20, E cadherin and CD44).
MicroRNAs (miRNAs) are part of a class of small ribonucleic acid (RNAs). They are important regulatory molecules, involved in several cell processes, such as developmental timing, stem cell division and apoptosis. Dysregulated miRNAs have been identified in several human malignancies, including bladder cancer tissue samples, and may confer a “tumour signature” that can be exploited for diagnostic purposes.
To determine whether there is a correlation between the genetic profile and the histo-pathological feature of BC in an Italian population, we genetically characterized 66 Italian patients affected by BC, analyzing both TP53 and FGFR3 mutational status, and CK19-20, E cadherin, Survivin and CD44 gene expression levels.
We report also a prospective pilot study investigating the diagnostic ability of a two miRNAs in voided urine samples collected from patients with bladder cancer just prior to bladder tumour resection
Survivin was significantly over-expressed (p=0.019) in invasive tumors related to CK20 down-regulation (p=0.025). Using multivariate analysis we observed a significant positive relationship between CK19 and CK20 (p=0.0006), a significant association between E cadherin and CK20 in both High Grade (HG) and Low Grade (LG) tumors (p=0.0064 and p=0.0000, respectively) and a strong positive association between Survivin and CD44 (p= 0.0000) only in HG tumors. TP53 and FGFR3 mutations showed a heterogenic distribution.
Page 8 Gene expression data obtained by RT-PCR on CD44, E-cadherin and Survivin in urine sediments don’t show any significant value in discriminating BC patients from healthy donor group. On the contrary, the two miRNAs of interest were significantly up regulated in urine of BC patients than in healthy controls. Moreover, different statistical methods, like Discriminant Analysis (StatGraphics software) and Artificial Neural Network (ANN), showed a really strong predictive value (around 89% and 83% respectively) using miRNA expression value together in discriminating BC patents from healthy group.
Taken together, our findings on TP53 and FGFR3 mutational status support the well-known genetic heterogeneity of BCs. However our results put in evidence the role of CD44, CK20, CK19 and Survivin on invasiveness ability and apoptosis resistance in HG tumors.
The results on miRNA analysis provide rationale for further studies on validation of candidate miRNAs in voided urine and may potentially lead to the development of a non-invasive and sensitive test for bladder cancer diagnosis and recurrence surveillance.
Page 9
2. INTRODUCTION
2.1 Bladder Cancer: Introduction and Epidemiology
Bladder cancer is the fourth most commonly diagnosed malignancy in men and the ninth most commonly diagnosed malignancy in women (National Cancer Institute, annual report 2011)[4]. More than 50,000 men and 16,000 women are diagnosed with BC each year. The incidence of BC has increased in the last 10 years [5] and this makes it the fourth most frequently diagnosed cancer and the eighth most common cause of cancer-related death in males. This is predominantly a disease of older males, with a median age at presentation of 60-65 years.Although exact numbers for cancer incidence and outcome are difficult to obtain and inherently delayed, the International Agency for Research on Cancer provides statistics and estimates. Details are depicted in Fig. 1 and Fig. 2.
There are geographical variations in incidence, with increased rates in the Great Lakes region of the United States; northern Italy, Spain, and Switzerland in Europe and the Mediterranean basin in regions with an increased incidence of schistosomiasis [6].
UBC prevalence and mortality are mainly determined by the initial tumor stage, success of treatment, and other cause (competing) mortality. Non–muscle-invasive bladder cancer (NMIBC) have a high prevalence because their low progression rates allow many patients to survive a long time, while patients with muscle-invasive disease are at significantly higher risk of dying from their disease. The prevalence of UBC is among the highest for all urologic malignancies [3].
Mortality is mainly determined by progression rates of high-risk NMIBC and by cure rates of muscle-invasive BC. Current details of mortality are depicted in Fig. 1 and Fig. 2. In 2008, UBC was the eighth most common cause of cancer-specific mortality in Europe [7].
Page 10
Fig.1: Estimated age-standardized (European) incidence and mortality rates from urothelial bladder cancer per 100 000 in (A) men and (B) women (GLOBOCAN).
Page 11
Fig. 2. Estimated age-standardized (world) incidence and mortality rates from urothelial bladder cancer per 100 000 in (A) men and (B) women (GLOBOCAN).
The etiology is well defined, with the most common association being cigarette smoking and other factors including exposure to dyes and some industrial solvents, exhaust fumes, reduced intake of fluids, and analgesic abuse.
The activity of these carcinogens on a susceptible epithelium is believed to be the cause of BC. One such carcinogen is β-naphthylamine, a compound found in industrial dye and cigarette smoke. Therefore, smokers have a threefold higher risk of having BC. Smoking is estimated to be responsible for about half of all BC. Other carcinogens present in the dye, rubber and leather industries are strongly associated with this malignancy. Additional factors like dietary components, drugs, parasites, and inflammations of the bladder can contribute to the development of BC. It is still a matter of debate whether BC arises from a single
Page 12 transformed cell (clonogenic theory) or from multiple transformed cells (field change theory) [8].
2.2 Pathology of Bladder Cancer (Classification of Bladder Cancer: TNM
Staging and Grading)
Bladder cancer consists predominantly of urothelial carcinoma (UC), formerly known as Transitional Cell Cancer (TCC, FIG 3A).It can occur anywhere along the urothelial tract and may occur just at 1 site or may be multifocal. Approximately 90% of incident cases are UC, with about 5% to 10% being squamous cell carcinoma (FIG 3B), 4% to 5% adenocarcinoma, and the remainder consisting of rare cancers, such as small-cell anaplastic cancer, sarcoma, lymphoma, or melanoma. Tumors at other sites, especially the gastrointestinal tract, may metastasize to the bladder [9].
Squamous cell carcinoma of the bladder is associated predominantly with smoking and schistosomiasis as causative agents, and adenocarcinoma is found in association with smoking and possibly chronic urinary infection.Even “second-hand” environmental tobacco smoke has been shown to increase the risk of bladder cancer by nearly 40% in lifelong nonsmokers who work around smokers or who lived with smoking parents during childhood. Bladder cancer appears to have origins from a solid-tumor stem cell [10] which has the ability to differentiate into different histologic patterns. Metastases will occasionally exhibit different histologic patterns from the tumors of origin. These tumors are commonly associated with a field defect of the urinary mucosa, which may reflect carcinogen exposure.
Page 13 Urothelial carcinoma presents as either noninvasive or invasive disease (the term “superficial” is no longer in common use). The noninvasive group consists of either papillary tumors or flat carcinoma in situ. Noninvasive papillary carcinoma is the single most common presentation for bladder cancer and represents more than 60% of cases.This group of tumors rarely progress, and are associated with a highly favorable prognosis [11] and are considered genetically stable [12].
This is classified according to grade of disease, ranging from benign (papilloma) to high-grade (III-IV) tumors with a high risk of invasion. Lower differentiation (high high-grade) correlates with increased stage and reduced survival. The current World Health Organization nomenclature combines tumor differentiation into only low and high grades, based on the finding that tumor behavior is more accurately reflected in a 2-parameter system than via a continuum of grades I-IV.
Invasive tumors represent a significant risk of future tumor progression and death from the disease, by their attitude to develop resistance to the chemotherapy. These BCs are characterized by intrinsic genetic instability (Fig 4) [13].
Fig.3: Histopathology of urothelial carcinoma of the urinary bladder.
(A) TCC; (B) squamous cell carcinoma
Page 14
Fig 4: Genetic and histolopathological progression of BC [13].
These two broad groups probably represent genetically different entities, and genetic changes identified only in invasive tumours are probably important differences between the groups. However, these groups are clinically distinct, and since a clear developmental continuum does not exist, no conclusions can be drawn about the temporal sequence of events.
Page 15
2.3 Classification of Bladder Cancer (Staging and Grading)
The most widely applied classification of staging is the conjoint model of the American Joint Committee on Cancer and the Union Internationale Contre le Cancer [14].
Stage 0: (Papillary Carcinoma and Carcinoma in Situ): abnormal cells are found in tissue
lining the inside of the bladder. These abnormal cells may become cancer and spread into nearby normal tissue. Stage 0 is divided into
•Stage 0a: non invasive papillary carcinoma
•Stage 0is: carcinoma in situ, a flat tumor on the tissue lining the inside of the bladder. This cancer is very aggressive despite not being invasive.
Stage I: cancer has formed and invades subepithelial connective tissue Stage II: cancer invades superficial muscle, inner half
Stage III: cancer has spread from the bladder to the fatty layer of tissue surrounding it and
may have spread to the reproductive organs (prostate, seminal vescicles , uterus, vagina).
Stage IV: cancer has spread from the bladder to the wall of the abdomen or pelvis. Cancer
Page 16
Fig.5: Staging of the BC.
Moreover this staging considers also the Tumour, Node, Metastases (TNM) 2002 classification approved by the Union International Contre le Cancer (UICC, International Union Against Cancer) is widely accepted. (Table 1) [15].
Page 17
T (Primary tumour)
TX Primary tumour cannot be assessed T0 No evidence of primary tumour Ta Non-invasive papillary carcinoma Tis Carcinoma in situ (‘flat tumour’)
T1 Tumour invades subepithelial connective tissue T2 Tumour invades muscle
T2a Tumour invades superficial muscle (inner half) T2b Tumour invades deep muscle (outer half) T3 Tumour invades perivesical tissue:
T3a Microscopically
T3b Macroscopically (extravesical mass)
T4 Tumour invades any of the following: prostate, uterus, vagina, pelvic wall, abdominal wall
T4a Tumour invades prostate, uterus or vagina T4b Tumour invades pelvic wall or abdominal wall
N (Lymph nodes)
NX Regional lymph nodes cannot be assessed N0 No regional lymph node metastasis
N1 Metastasis in a single lymph node 2 cm or less in greatest dimension
N2 Metastasis in a single lymph node more than 2 cm but not more than 5 cm in greatest dimension,
or multiple lymph nodes, none more than 5 cm in greatest dimension N3 Metastasis in a lymph node more than 5 cm in greatest dimension
M (Distant metastasis)
MX Distant metastasis cannot be assessed M0 No distant metastasis
M1 Distant metastasis
Page 18 In addition, the histological classification of the World Health Organization (WHO) is generally applied throughout most of the world (Table 2). Histological grade provides significant prognostic information, especially for prediction of progression [15-16].
PTNM pathological The pT, pN, and pM categories correspond to the T, N, and M categories classification of the TNM classification
G Histopathological grading
GX Grade of differentiation cannot be assessed G1 Well differentiated
G2 Moderately differentiated
G3-4 Poorly differentiated/undifferentiated
Table 2: Histological grading of WHO and International Pathology Consensus Committee 1988 [15].
Several systems have been used to grade and classify bladder neoplasms. The system proposed by the World Health Organization (WHO) in 1975 distinguished papillomas from grades I, II, and III papillary transitional cell carcinomas (TCCs).
In 1998, the WHO and the International Society of Urologic Pathologists (ISUP) published a consensus classification system for urothelial (transitional cell) neoplasms. The clinical significance of this schema was validated by subsequent studies, and in 2004, it was accepted as the standard classification schema. The 2004 WHO classification includes urothelial papilla, papillary urothelial neoplasm of low malignant potential (PUNLMP), low-grade urothelial carcinoma (LGPUC) and highgrade UC (HGPUC) (Fig6).
Page 19
Fig.6: Relationship between 1973 and 2004 WHO classification of papillary tumors [16].
Finally, in according to this system, urothelial cancer (UC) is classified as low-grade and high-grade based upon the degree of nuclear anaplasia and architectural abnormalities [16].
2.4 Clinical Features of Bladder Cancer
The presentation of bladder cancer usually correlates with the extent of disease, with somewhat different patterns associated with noninvasive cancer, invasive tumors, and metastatic disease; there are also nonmetastatic manifestations of malignancy.Patients with noninvasive tumors commonly present with asymptomatic hematuria (diagnosed on urinalysis), visible hematuria, and/or urinary frequency, dysuria, burning. Invasive tumors have a similar pattern of presentation, although more advanced tumors may be associated with slowing of urinary stream, pelvic pain, dyspareunia.
Metastatic disease usually has manifestations at the site(s) of involvement [17]. Common sites of metastasis in bladder cancer include distant lymph nodes, lung, liver, and bone, and less commonly, brain or skin.
Page 20 The most common nonmetastatic manifestation of malignancy is the development of thrombosis, which is usually associated with advanced adenocarcinomas of the gastrointestinal tract. Bladder cancer is occasionally associated with the production of granulocyte-macrophage colony-stimulating factor or other cytokines, and a greatly elevated white blood cell count may reflect this phenomenon instead of infection. Tumors with squamous differentiation may cause hypercalcemia.
2.5 Staging of Bladder Cancer
Presentation with hematuria or other urinary symptoms will usually lead to urinalysis and assessment of possible infection or urinary calculi.
Urinalysis is a test that uses a chemical dipstick that changes color in response to the presence of certain features in the urine, such as white blood cells, red blood cells, and glucose.
In case of absence of infection or urinary calculi the next suggested test is urinary cytology and/or cystoscopic examination.
Urinary cytology is non-invasive and accurate for the diagnosis of high grade lesions (sensitivity up to 95%, specificity close to 100%), however it has a low sensitivity in detecting low grade tumors (the most frequent BC type) [18].
Cystoscopy, also called cystourethroscopy, is a procedure that is done to examine the lining
of the urethra and bladder. A small tube with a camera (cystoscope) is then inserted into the bladder through the urethra. In case of presence of abnormal tissue , will follow a biopsy. Cystoscopy is an efficient method to detect papillary tumors, however it is really invasive, and cause physiological and psychological discomfort to the patients. Moreover it might not detect flat tumors or carcinoma in situ.
Page 21 Imaging of the urinary tract may be carried out before or after cystoscopy [19].
An excretory urogram may delineate the anatomy of the urinary tract, including the presence of tumors of the bladder and upper tracts or hydronephrosis. Computed tomography (CT) urography is more commonly used as it can evaluate the renal parenchyma in addition to the urothelial surface. Magnetic resonance imaging (MRI) may also be helpful to define the local anatomy and the extent of an invasive tumor, while providing staging information about lymph nodes and distant sites of involvement.
The sensitivity and specificity of nonmuscle-invasive pelvic imaging are limited. Furthermore, CT and MRI scans performed soon after transurethral resection of bladder tumor (TURBT) may suggest increased depth and invasion due to the effect of postresection inflammatory infiltrate. The National Comprehensive Cancer Network recommends that pelvic CT before TURBT should be considered for patients with sessile or high-grade tumors. The role of the positron-emission tomography scan has not yet been well defined, although it is sometimes used to help define sites of potential involvement for further investigation, with a “positive” result being investigated further and a negative result being of only limited value [20].
Even in patients who are treated appropriately, BC often recurs and it can develop anywhere along the urinary tract, including the lining of the kidneys, ureters, urethra, and bladder. At 5 years the recurrence rates are 31–78% and progression rates are <1–45%. Repeat cystoscopy and urine cytology testing are recommended for surveillance, beginning three months after treatment ends. If there are no signs of recurrence, cystoscopy and urine testing are usually recommended every three to six months for four years, and then once per year [21].
Page 22
2. 6 Treatment of Bladder Cancer
2.6.1 Non invasive Bladder Cancer
Transurethral resection of bladder tumor (TURBT) is the hallmark of noninvasive bladder cancer treatment [22]and is sometimes followed by postoperative use of intravesical therapy (immunologic or cytotoxic reagents) to reduce the risk of recurrence [23].
Multiple random biopsies of apparently normal urothelium should be performed to identify occult carcinoma in situ if urine cytology is positive or in the presence of high-grade disease. Usually, endoscopic resection should be repeated within 4-6 weeks of the initial resection in patients with high-grade disease and/or T1 tumors because up to 50% will have evidence of invasion into the muscularis propria on repeat sampling.
The grade and stage of the tumor dictate subsequent clinical management. Patients with noninvasive, low-grade, papillary bladder cancer are at low risk of progression to invasive disease, although the risk of local recurrence may be as high as 70% to 80%. Adverse risk factors for recurrence include large tumor size, multifocality, or previous history of recurrence. Such tumors are often given adjuvant intravesical therapy (usually weekly instillations for 6-8 weeks) following resection, mostly with Bacillus Calmette-Guérin, which stimulates local mucosal immunity and reduces the risk of recurrence as much as 40% [24] After completing treatment, patients should be monitored closely with periodic cystoscopy, urine cytology, and/or tumor marker evaluation at 3- to 6-month intervals to detect recurrence. Patients with high-risk, noninvasive bladder cancer (ie, high-grade Ta, T1, or carcinoma in situ) have at least a 50% risk of developing invasive bladder cancer and a 35% risk of eventual death from bladder cancer. Moreover, those with persistent or recurrent
high-Page 23 grade disease after intravesical therapy will develop muscle invasion and progression in 80% of cases. Timely radical cystectomy with urinary diversion is recommended for patients with relapsed high-risk disease, particularly for those with long life expectancy.
2.6.2 Invasive Bladder Cancer
Radical cystectomy with bilateral pelvic lymphadenectomy is generally viewed as the standard treatment for clinically localized invasive bladder cancer. This traditionally requires the removal of the anterior pelvic organs, which include the bladder, prostate, and seminal vesicles in men and the bladder, urethra, uterus, ovaries, and vaginal cuff plus anterior vaginal wall in women. (NCCN Bladder Cancer)
Radical cystectomy, without adjuvant therapy, is curative in up to 60% to 70% of patients with invasive T2 bladder cancer,depending on prognostic factors [25].
The 5-year overall survival rate in large series of patients with T2-T3 disease ranges from 40% to 65%. Relapse reflects stage, grade, presence of lymphovascular invasion, nodal status, and expression of adverse molecular prognosticators. Radical cystectomy alone has been reported to be curative in 20% to 40% of patients with pelvic lymph node metastases, and the outcome is also determined by prognostic factors.
Page 24
2.7 Molecular Biology of Bladder Cancer
Bladder cancer is a major cause of health expenses and it presents formidable clinical challenges. Prevalence of bladder cancer is 6 times higher in developed countries and, since it is characterized by frequent recurrences, it represents one of the most costly malignancies to health care systems due to the requirement of intensive surveillance with cystoscopies and urinary cytologies, as well as frequent tumor resections under anesthesia [26.
Because the different morphologic subtypes of bladder cancer have quite different biological behavior and natural history, they have been the focus of molecular analysis . Due to heterogeneity of these tumors, new markers for tumor progression are clearly needed as clinical parameters, since tumor grade and stage are not accurate in predicting the biological behavior and thus in choice of treatment, especially in high risk cases [27].
Bladder cancer is a heterogeneous disease, and the pathomechanism of bladder carcinogenesis is still not fully understood . Classically, bladder cancer has been associated with exogenous and environmental risk factors. The two best known risk factors for bladder cancer are smok ing and occupational exposure. Compared with the general population, smokers are at 2 to 4 times greater risk of developing bladder cancer, and heavy smokers are at 5 times the risk. Occupational exposure to aniline dyes and aromatic amines such as 2-naphthylamine and benzidine has been implicated as the second most common risk factor for bladder cancer [28] .
However, most individuals with these known chimical or environmental exposures never develop bladder cancer while many bladder cancer cases develop among individuals without those known risk factors, suggesting that genetic factors also play an important role in bladder carcinogenesis.
Page 25 Human urothelial tumors develop along two major, largely independent but somewhat overlapping biological pathways, referred as papillary and non-papillary [28]. Papillary neoplasms (low grade lesions) are non muscle invasive BC (NMIBC, G1 or G2 grading), associated with a highly favorable prognosis [29; 30] and characterized by activating mutations of Fibroblast Grow Factor Receptor 3 (FGFR3) and wild-type Tumor Protein 53 (TP53); overall, they are genetically stable. Only 15% of these NMIBC papillary tumors acquire genetic alterations leading to progression and metastasis (high grade features). High-grade tumors (G3 grading) represent a significant risk of future tumor progression and death from the disease. The 50% of these tumors, in fact, develop chemo-resistance. Genetically high-grade flat lesions are characterized by loss of function of TP53 and intrinsic genetic instability [28].
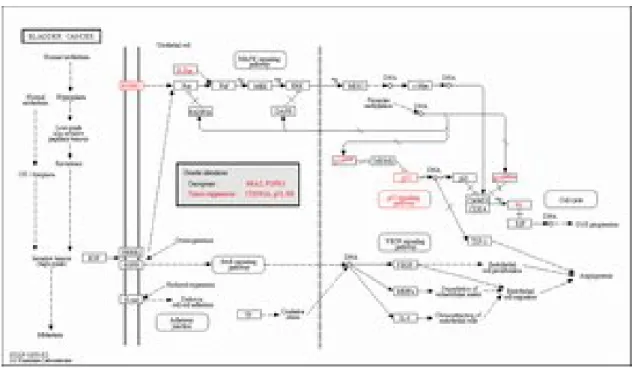
Therefore one of the most commonly mutated pathways in BC is FGFR3-TP53 pathway (Fig. 7): while TP53 mutations are common in invasive tumors, FGFR3 mutations are frequently found in low grade and low stage of bladder malignancies [31].
Moreover the development and progression of BC is also characterized by changes in protein and gene expressions. Most of these genes of interest are involved in pathways related to morphological transformation, Cytokeratines; cell-cell interaction , E-Cadherin; Cell-Matrix interaction, CD44; and resistance to apoptosis, Survivn, able to lead to a neoplastic transformation.
Then, gene regulation is a key factor in gaining a full understanding of molecular biology. MicroRNAs (miRNAs) are a class of small ribonucleic acid (RNAs) (20-25 nucleotides in length) that are important regulatory molecules within the cells of plants, animals and viruses. [32].
Since their discovery in 2001, miRNAs have been found to regulate several cell processes by negatively regulating gene expression at the post-transcriptional level. Through the use of
Page 26 several molecular techniques, dysregulated miRNAs have been identified in several human cancers [33] and, in some cases, may confer a “tumour signature” that can be exploited for diagnostic purposes. Several recent reports have detailed the miRNA expression profiles in bladder cancer cell lines and tissue samples. [34]. Up-regulated or down-regulated miRNAs
have been associated with tumour stage and grade, as well as prognosis.
Fig 7: FGFR3-p53 pathway in BC- Reference pathway. KEGG (website)
2.7.1 FGFR3-TP53 pathway in Bladder Cancer
FGFR3-p53 pathway is one of the most commonly mutated pathway in BC. Some genomic alterations are strongly associated with specific histopathologic tumor features like grade or stage. These include FGFR3 mutations in papillary tumors and p53 and/or Rb pathway alterations in muscle-invasive lesions.
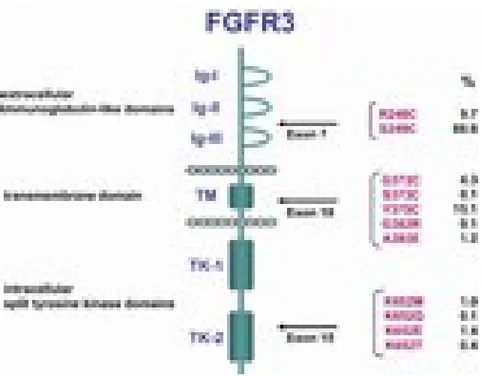
The FGFR family consists of 4 active members of high affinity cell surface-associated receptors (FGFRs 1–4) that are highly conserved both within the family and throughout
Page 27 evolution [35]. These receptors have a common structure, consisting of an extracellular domain that includes an amino terminal hydrophobic signal peptide followed by 3 immunoglobulin (Ig)-like domains, a hydrophobic transmembrane domain, and an intracellular tyrosine kinase domain. Fibroblast growth factors (FGFs) is the ligands for FGFRs and it binds the extracellular Ig-like domains II and III resulting in downstream signaling.Mutation of FGFR3 in BC is strongly associated with low tumor grade and stage. This strong association also led to investigations of urothelial papillomas, which are proposed precursor lesions for low-grade papillary bladder tumors. Activating mutations on FGFR3, such as R248C, S249C, G372C, S373C and Y375C, located in exons 7, 10 and 15, are very frequent in the development of BC [36].
One of the predicted effects of FGFR3 mutation is activation of the RAS-MAPK pathway.
Fig 8: Linear structure of FGFR3 protein. Percentages of common mutations are
Page 28 TP53 gene encodes tumor protein p53 (Fig. 9), which responds to diverse cellular stresses to regulate target genes that induce cell cycle arrest, apoptosis, senescence, DNA repair, or changes in metabolism. p53 protein is expressed at low level in normal cells and at a high level in a variety of transformed cell lines, where it's believed to contribute to transformation and malignancy. p53 is a binding protein containing transcription activation, DNA-binding, and oligomerization domains. It is postulated to bind to a p53-binding site and activate expression of downstream genes that inhibit growth and/or invasion, and thus function as a tumor suppressor. Mutants of p53 that frequently occur in a number of different human cancers fail to bind the consensus DNA binding site, and hence cause the loss of tumor suppressor activity. Alterations of this gene occur not only as somatic mutations in human malignancies, but also as germline mutations in some cancer-prone families with Li-Fraumeni syndrome [36].
Inactivating mutations on TP53 are the most frequent genetic alterations in human malignancies. The 80% of these “lost of function” mutations in BC are misssense mutations on exon 5-8, and localized in the DNA binding domain of the protein. Ecke T.H. et all (2008) showed that TP53 genetic analysis can provide valuable information in regards to tumor progression and recurrence, also in BC [37; 38]. Numerous studies have indicated that TP53 mutations are strongly associated with high tumor grade, invasive behavior, risk of recurrence, and adverse clinical outcome. TP53 mutations are generally mutually exclusive of FGFR3 mutations [28], and the rate of TP53 mutation is 2-fold higher in high-grade urothelial cancers than in low-grade tumors. However, has been observed that in T1G3 tumors, that are intermediate and heterogeneous group at the transition point in the model for bladder cancer progression, some resembling pTa and others pT2-4 tumors, FGFR3 and TP53 mutations are independently distributed rather than mutually exclusively [39].
Page 29
Fig 9. p53 protein structure [36].
2.7.2 Cytokeratine 19 and 20 (CK19 and CK20) in Bladder Cancer
Epithelial function or adaptation of epithelium to changing conditions usually is accompanied by transitions in the cytoskeleton of epithelial cells. Cytokeratins, the most important components of the cytoskeleton, are filaments with a diameter between 6 and 10 nm; they span the cell between the cytoplasm and nucleus, providing an internal scaffold that is functional in cell integrity. Different combinations of these keratins are present in different types of epithelia [40].
Cytokeratin 20, CK-20, is higher expressed in urothelial tumours in comparison with normal transitional epithelium. It can be considered as a marker of urothelial differentiation it is expressed in the umbrella cells of normal urothelium and reactive atypia. When CK20 expression in bladder tumours is limited to the umbrella cells, it is associated with a mild disease course, while expression in the entire urothelium in more than 10% of the tumour cells is associated with higher tumour grade and an increased risk of progression and
Page 30 recurrence. In urothelial carcinoma in situ, intense CK20 expression is found in the majority of malignant cells [41] (Fig 10).
Fig 10. Immunohistochemical stainin specific for CK20 detection. (A) Normal CK20
expression pattern in which only the superficial urothelial cells are positive. (B) Abnormal CK20 staining pattern, represented by CK20 expression in all cell layers. [41]
2.7.3 E-Cadherin in Bladder Cancer
Cell adhesion molecules (CAM) are required for maintaining a normal epithelial phenotype and abnormalities in CAM expression have been related to cancer progression, including bladder urothelial carcinomas. Cadherins represent a family of transmembrane glycoproteins that mediate homophile, calcium-dependent, intercellular adhesion. E-cadherin is the major cadherin molecule expressed by epithelial cells. The loss of E-cadherin expression or function in epithelial carcinomas has long been thought as a primary reason for disruption of tight epithelial cell-cell contacts and release of invasive tumor cells from the primary tumor. Indeed, E-cadherin serves as a widely acting suppressor of invasion and growth of epithelial cancers, and its functional elimination represents a key step in the
Page 31 acquisition of the invasive phenotype for many tumors. Recent evidence indicates, however, that in addition to the loss of the "invasion-suppressor" E-cadherin, another adhesion molecule, N-cadherin, becomes upregulated in invasive tumor cell lines and could have a potential role in metastasis formation [42].
It is well known that down-regulation of homotypic adhesion molecule, such as E-cadherin, proteins involved in cell polarity, with parallel up-regulation of fibronectin, vimentin, certain integrins and matrix metalloproteases (MMPs), and several transcriptional repressors of E-Cadherin expression (Twist, Snail, Slug, Zeb-1, and Zeb-2) play a key roles on Epithelial Mesenchimal Transition (EMT), process that occurs for acquiring tumor invasive properties. In fact, Cui D () reports that patients with more poorly differentiated bladder cancer were accompanied with a higher expression of N-cadherin and a lower expression of E-cadherin [43].
2.7.4 CD44
Another cell adhesion molecule (CAM) is CD44 and also alterations of CD44 glycoproteins have been shown to play an important role in progression of various malignancies, including urothelial cancer [44]. CD44 is a widely distributed cell surface adhesion molecule that plays an important role in several biological processes such as lymphocyte homing and activation, cell motility, cell–matrix interaction and the regulation of tumor cell growth and metastasis. Studies show clearly that altered adhesive function of tumour cells is important in the metastatic process and CD44 is assumed to be critical in the malignant progression of many human tumours such as BC [45].
Page 32 2.7.5 Survivin
The programmed cell death, apoptosis, is one of the most common way the cells use when something of irreparable occurs, like the neoplastic transformation. Defective apoptotic processes have been implicated in an extensive variety of diseases [46]. For example, the deregulation of genes belonging to Inhibitor of Apoptosis (IAP) gene family is a cancer cell ability to evade from apoptosis. Survivn gene is a member IAP gene family. Survivin is essential for the proper completion of various stages of cell division, from centrosomal functions to proper kinetochore attachment to spindle formation, through via the regulation of microtubule dynamics/stability. In particular its apoptotic action consists in counteracting cell death by interfering with caspase-9 processing, the upstream initiation of the intrinsic (mitochondrial) pathway of apoptosis. Generally Survivin is not expressed in normal tissues, while it is found in many tumors. Shariat et all show that the 78% of BCs present Survivin expression while there was no expression in respective normal tissues [47].
2.7.6 miRNA and Bladder Cancer
Since their discovery in the early 1990s, these small molecules have been shown to play an important regulatory role in a wide range of biological and pathological processes. Over 30% of human messenger RNAs (mRNAs) are regulated by miRNAs. It has been well established that miRNAs play an important role in various cellular processes such as differentiation, cell growth, and cell death. In cancer, these processes are commonly dysregulated, indicating the involvement of miRNAs in carcinogenesis.
MiRNA expression is dynamic, so their expression or target may be altered within the same cell depending on circumstance. This variability makes them potent modulators of cellular
Page 33 behaviour, as a single protein may cascade its message using few miRNAs onto many genes. Fig.11 shows the molecular processes leading to miRNAs maturation: from pre-miRNAs to mature miRNA, the only form able to repress the expression of specific target-genes by mRNA cleavage, and/or by translational repression [48].
Recent studies demonstrated that several cancer-specific microRNA are detectable in the serum from patients with breast, gastric colorectal and ovarian cancers. Hankeet al. demonstrated that miR-126 and miR-182 might be used as tumor markers to distinguish bladder cancer (BC) from healthy control (HC) [49]. These studies demonstrated that circulating microRNA might be detectable in serum and urine samples even if no cytosolic fraction is involved in a sample. Recently, Yamada et al found of the eight upregulated microRNA in their profiles of UC, miR-96, miR-183 and miR-190 were the top three upregulated microRNA [50]. These miRNAs seems to be related to both growth and migration increase, and apoptosis resistance [51].
Page 34
Figure 11. Illustrative overview of the miRNA network. RNA polymerase II (Pol II)
produces a 500–3,000 nucleotide transcript, called the primary microRNA (miRNA), or pri-miRNA, that is then cropped to form a pre-miRNA hairpin by a multi-protein complex that includes DROSHA (~60–100 nucleotides) (a simplified view is shown here). This double-stranded hairpin structure is exported from the nucleus by RAN GTPase and exportin 5 (XPO5)112. Finally, the pre-miRNA is cleaved by DICER1 to produce two miRNA strands, a mature miRNA sequence, approximately 20 nucleotides in length, and its short-lived complementary sequence, which is denoted miR* and sometimes called the passenger strand
Page 35 or 3p strand159. The thermodynamic stability of the miRNA duplex termini and the identity of the nucleotides in the 3′ overhang determines which of the strands is incorporated into the RNA-inducing silencing complex (RISC)160. In some cases, in which both the lead and passenger strands have a similar thermodynamic stability, both strands will be loaded. The single stranded miRNA is incorporated into RISC, which then targets it to the target 3′ untranslated region mRNA sequence to facilitate repression and cleavage. AA, poly A tail; m7G, 7-methylguanosine cap; ORF, open reading frame [50].
2.8 Genetic and Urine: a new frontier for an non-invasive early diagnosis
of Bladder Cancer
The early diagnosis of bladder cancer is central to its effective treatment. Screening for bladder cancer in patients with the symptoms of microscopic or gross hematuria or other irritative voiding symptoms is currently done with urinalysis, urinary cytology and cystoscopy. However, up to 25% of patients with bladder cancer may not have hematuria, even when they have a known bladder tumor. Cytology has low sensitivity and specificity, particularly for low-grade tumors; its results are not available immediately and are interpreter dependent. Cystoscopy is invasive, relatively expensive and uncomfortable for the patient. An ideal bladder cancer marker should be objective, noninvasive, easy to administer and interpret, and possess high sensitivity and specificity. Several efforts have been made to find noninvasive markers to assist in the detection of patients with bladder cancer. Recently, an increasing attention is focused on the role of miRNAs that can be easily isolated and amplified from voided urine using standard quantitative PCR techniques.
Page 36 Once thought to be unstable RNA molecules, miRNAs are now shown to be stably expressed in serum, plasma, urine, saliva, and other body fluids. Moreover, the unique expression patterns of these circulating miRNAs are correlated with certain human diseases, including various types of cancer [52].
Page 37
3. AIM
Despite some advances in prevention, early diagnosis and treatment, bladder cancer remains a source of significant morbidity and mortality. Given the high rates of recurrence of non-muscle invasive transition cell carcinoma, as well as the possibility of progression of higher risk disease, relatively close and long-term surveillance of the urothelium is the hallmark of bladder cancer management. Standard surveillance strategies of repetitive cystoscopy on an arbitrary schedule can be finessed through risk stratification, but are still invasive and associated with both expense and patient discomfort. Furthermore, flat lesions or carcinoma in situ (CIS) may be difficult to detect by visual inspection and the increased incidence of cancer in the upper urinary tract in these patients would highlight the need for accurate urine-based markers of TCC as an adjunct to cystoscopy.
Cytological study of exfoliated cells in the urine is beneficial for the diagnosis and surveillance of high-grade disease, but is often normal and of limited value for low-and intermediate- grade tumours. A number of novel immunoassays for cancer-associated proteins in voided urine have been investigated as diagnostic tool to replace cytology. Most of these markers appear to have a greater sensitivity than cytology, especially for detecting lower grade tumours, although often at a cost of specificity. Therefore, few markers have become integrated into the routine surveillance of patients at risk for recurrent TCC. A number of chromosomal abnormalities have been reported in TCC and have facilitated the search for molecular-based genomic tests to determine the presence of cancer cells in urine. The concept that the presence or absence of one molecular marker will aid clinical evaluation has not proved to be the case. This is not surprising when one considers the variation between
Page 38 individuals, the cross-talk between molecular pathways, and the heterogeneity of bladder cancer.
The advent of high-throughput techniques has enabled an evolution from single-marker research to a more global assessment strategy, and we have used these to identify promising biomarkers of BCa.
Using genomics approaches to profile the cellular components of voided urine, we have studied a panel of biomarkers that show promise for development into accurate assays for non-invasive BCa detection. We have performed a series of tests to evaluate the potential clinical utility of a number of these biomarkers. In this study, we combined data on 8 of our candidate biomarkers in a cohort of 66 subjects in order to derive an accurate and robust multivariate assay for a non-invasive detection of BCa.
Page 39
4. MATERIALS AND METHODS
4.1 Sample collection
A total of 66 samples, 49 formalin-fixed paraffin embedded (FFPE) tissues and 17 fresh tissues, were collected from patients treated at the Verisilia Hospital (Viareggio, Italy). Of the 66 subjects, 33 were histologically diagnosed as Low Grade (LG), and 33 as High Grade (HG) (Table 3).
Description of the population
Histogy n° patient
LG 33
HG 33
TOT 66
Table 3. Clinical feature of the study set.
Written informed consent was obtained from all the subjects.
58/66 were male and 8/66 female. The histopathological characteristics were available only for 49 FFPE samples. 27/49 were G3: 7 out of these 27 showed papillary morphology at histological diagnosis; 9/49 were G1 and and 13/49 were G2 (Table 4).
Page 40
Table 4. Histopathological characteristics of the study population. G3 tumors are
sub-classified in papillary and non papillary basing on their morphology.
4.2 DNA and RNA extraction
2 x 10µm and 4x10 µm sections were cut from FFPE tissues and processed for DNA and RNA isolation, respectively.
After surgery the fresh tissues were stored in RNAlater solution (Ambion) to avoid the RNA degradation and to stabilize the RNA until tissue homogenizing by GenleMACS dissociator (Milteny).
DNA was isolated using Nucleospin Kit (Macherey-Nagel) according to the manufacturing instructions. RNA extraction was performed by automatic system (Helix Extraction System, Diatech) according to the manufacturing instructions
Grade n° patients
G1 9
G2 13
G3 27
Papillary Non papillary
7/27 20/27
Page 41
4.3 TP53 and FGFR3 sequencing
PCR for TP53 (exon 4-9) and FGFR3 (exon 7, 10, 15) were performed in 30 µl final volume, containing 150 ng of genomic DNA, 1.25 Units of TaqGold (Applied Biosystem) 0.1- 1µM of forward and reverse primers. Each amplification was performed for 35 cycles. After an initial denaturation at 95°C for 10 min, each cycle was performed at 95 °C for 30 sec, 56 °C for 30 sec and 72 °C for 30 sec; final step 72 °C for 10 min. Primers used were designed using Primer3 software and are listed in Table 5.
PCR products were then purified, labelled and sequenced on ABI PRISM 3130XL Genetic Analyzer.
Page 42 TP53_4_1F AGGACCTGGTCCTCTGAC TP53_4_1R CTGGGAAGGGACAGAAGA TP53_4_2F CCCTGCACCAGCCCCCTCCT TP53_4_2R CCTAAGGGTGAAGAGGAATCCCA TP53_5F TGACTTTCAACTCTGTCTCCT TP53_5R TCAGTGAGGAATCAGAGGCC TP53_6F GAGAGACGACAGGGCTGGT TP53_6R AGGGCCACTGACAACCAC TP53_7F CTGCTTGCCACAGGTCTCC TP53_7R AGAAATCGGTAAGAGGTGGGC TP53_8F GGACAGGTAGGACCTGATTTCCTTAC TP53_8R TGCACCCTTGGTCTCCTCCAC TP53_9F GTGGAGGAGACCAAGGGTGCA TP53_9R AGGTAAAACAGTCAAGAAGAA FGFR3 7.1 F GAACAAGTTTGGCAGCATCC FGFR3 7.1 R CACTGTACACCTTGCAGTGGA FGFR3 7.2 F GTCATCTGCCCCCACAGAG FGFR3 7.2 R AGCACGGTAACGTAGGGTGT FGFR3 10.1 F GCAGTCCTGGATCAGTGAGA FGFR3 10 .1R AGGGCCTTGGAGCTGGAG FGFR3 15 F AGCCTCGATCTGTACCTTGG FGFR3 15 R GTGAACGCTCAGCCAAAAG
Table 5. TP53 and FGFR3 primers.
4.4 mRNA expression analysis by RT-PCR
After isolation, RNA was reverse transcribed in cDNA in a final volume of 20 μl, containing 5X RT buffer, 10 mM dNTPs, 50 ng/μl Random Primers, 0.1M DTT, 40 U/μl RNaseOUT, 50 μM oligo(dT), DEPC-Treated Water, 15 U/μl Cloned AMV reverse transcriptase (Invitrogen, Carlsbad, CA).
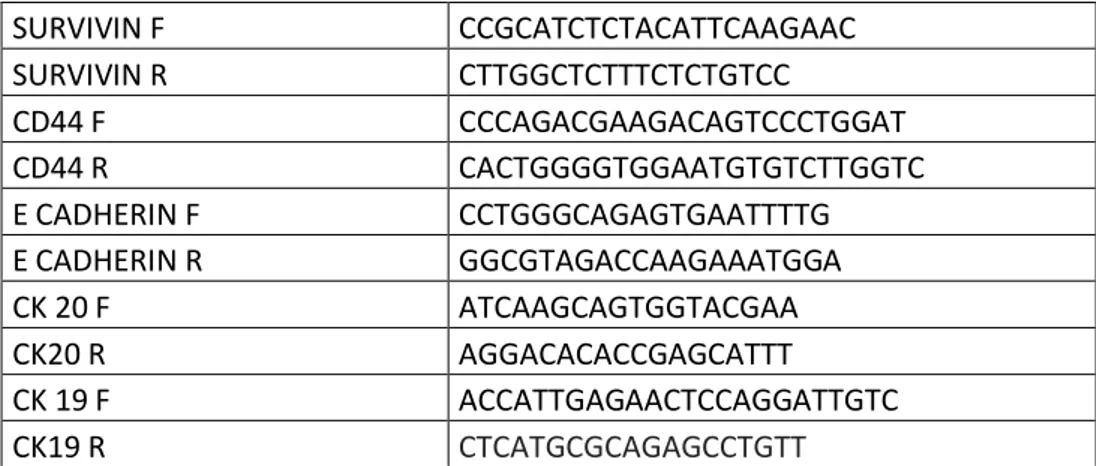
Page 43 The gene expression levels were analysed by quantitative Real-Time PCR (qRT-PCR) on the Rotor-Gene 6000 (Corbett, Qiagen) following the manufacturing instructions. Endogenous reference gene (beta 2 microglobulin) was used to normalize each gene expression level.. Real time PCR was performed in 25 µl final volume, containing 5 µl of cDNA, 12.5 µl of MESA GREEN qPCR MasterMix Plus (EUROGENTEC, San Diego, CA), 300 nM of each primer (Invitrogen, Carlsbad, CA) with the following cycling conditions: initial denaturation 95°C for 5 min; 40 cycles at 95 °C for 15 sec and 58 °C for 40 sec and 72 °C for 40 sec; final step 25 °C for 1 min. Primers used for CK19 and 20, CD44 and Survivin are showed in Table 6. Standard curves were generated for each gene to evaluate primer efficiency and for data analysis. To verify primers specificities, melting curve analysis was performed. Fluorescent data were acquired during the extension phase. After 40 cycles a melting curve for each gene was generated by slowly increasing (0.1 °C/s) the temperature from 60 °C to 95 °C, while the fluorescence was measured. For each experiment a no-template reaction was included as a negative control. SURVIVIN F CCGCATCTCTACATTCAAGAAC SURVIVIN R CTTGGCTCTTTCTCTGTCC CD44 F CCCAGACGAAGACAGTCCCTGGAT CD44 R CACTGGGGTGGAATGTGTCTTGGTC E CADHERIN F CCTGGGCAGAGTGAATTTTG E CADHERIN R GGCGTAGACCAAGAAATGGA CK 20 F ATCAAGCAGTGGTACGAA CK20 R AGGACACACCGAGCATTT CK 19 F ACCATTGAGAACTCCAGGATTGTC CK19 R CTCATGCGCAGAGCCTGTT
Page 44
4.5 miRNA extraction from urine samples and miRNA expression assay by
RT-PCR
Purification of miRNA was performed by using miRNeasy Mini Kit (Qiagen) according to the manufacturer’s instructions. Quantitative reverse transcription (RT) was performed
using miScript II RT Kit that is an integral component of the miScript PCR System for miRNA detection and quantification (Qiagen). cDNA generated with the miScript II RT Kit was used as a template for real-time PCR with the miScript SYBR Green PCR Kit with miRNA specific primers for miR-96 and miR-183 (Qiagen)
These 2 miRNAs were chosen based on previous reports of miRNA expression in bladder cancer specimens.
Quantitative polymerase chain reaction was run on an Rotor-Gene 6000 (Corbett, Qiagen) Samples were detected in duplivate and relative expression levels were calculated using U6 small nuclear RNA (RNU6B, Qiagen) as the endogenous control.
4.6 Statistical analysis
Statistical analyses were carried out by specific computer programs. In particular we used Multivariable Analysis a method based on the statistical principle of multivariate statistics, which involves observation and analysis of more than one statistical variable at a time. This technique is used to perform trade studies across multiple dimensions while taking into account the effects of all variables on the responses of interest. p-value ≤ 0.05 indicates statistical significance of the analysis. Chi-square and Fisher tests were used to analyze the
Page 45 distribution of TP53 and FGFR3 genetic alteration, while t-student was performed to study the distribution of markers gene expression in this study population. Partek® Genomics Suite™ was used to analyze together all the data obtained from RT-PCR and Sequencing Analysis, in relation to the histopathological information. Partek® Genomics, in fact, is a comprehensive suite of advanced statistics and interactive data visualization specifically designed to reliably extract biological signals from noisy data.
Discriminant analysis is a well-known multivariate statistical classification technique used to determine which variables discriminate between two or more groups, given several quantitative (independent) variables and a categorical (dependent) variable. The method extracts n-1 discriminant functions, n being the number of groups to discriminate among, which are linear combinations of the original quantitative variables selected. These functions may be used to calculate a set of discriminant scores that are employed to predict the status of a new observation.
An artificial neural network, often just called a neural network, is a mathematical model inspired by biological neural networks. A neural network consists of an interconnected group of artificial neurons, and it processes information using a connectionist approach to computation. In most cases a neural network is an adaptive system that changes its structure during a learning phase. Neural networks are used to model complex relationships between inputs and outputs or to find patterns in data.
Neural networks and conventional algorithmic computers are not in competition but complement each other. There are tasks are more suited to an algorithmic approach like arithmetic operations and tasks that are more suited to neural networks. Even more, a large number of tasks, require systems that use a combination of the two approaches (normally a conventional computer is used to supervise the neural network) in order to perform at maximum efficiency.
Page 46
5. RESULTS
5.1 Gene Mutational Profiling
More than 70% of low-grade noninvasive papillary urothelial neoplasms harbor FGFR3 mutations, strongly implying that FGFR3 activating mutation is one of the key genetic events underlying the genesis of low-grade urothelial tumors. Mutations between the IgII and IgIII domains (exon 7) are by far the most common, accounting for 50% to 80% of all mutations of FGFR3 . Mutations affecting the transmembrane domain (exon 10) account for 15% to 40%, and those affecting tyrosine kinase 2 domain (exon 15) account for 5% to 10%.
Urothelial cancer bearing FGFR3 mutation confers a better overall prognosis than cancer bearing TP53 mutation. TP53 mutations appear to indicate a worse prognosis and higher recurrence rate. Conversely, FGFR3 mutation is detectable in only 10% to 20% of invasive tumors. This suggests strongly that FGFR3 activating mutation is one of the key genetic events in the genesis of low-grade non invasive papillary bladder tumors. Activating FGFR3 mutations are found most frequently in G1 tumors (80%).
Alterations of the TP53 tumor suppressor gene play a crucial role in the carcinogenesis of many tumors, including bladder urothelial cancers
Numerous studies have indicated that TP53 mutations are strongly associated with high tumor grade, invasive behavior, risk of recurrence, and adverse clinical outcome. TP53 mutations are generally mutually exclusive of FGFR3 mutations, and the rate of TP53 mutation is 2-fold higher in high-grade urothelial cancers than in low-grade tumors. However, when assessing high-grade non–muscleinvasive tumors, FGFR3 and TP53 mutations are no mutually exclusive. These findings are interesting an suggest that doubly mutant T1G3 tumors either are at the crossroads of the 2 main molecular pathways or
Page 47 represent progression from low-grade papillary tumors to high-grad tumors by acquisition of TP53 mutations.
Because of the poor quality of the DNA extracted from the FFPE tissues we could not perform the TP53 and FGFR3 mutational status on all the samples.
Table 7 shows the distribution of both TP53 and FGFR3 genetic alterations (Single Nucleotide Polimorphisms [SNPs], missense and silent mutations) and it underlines the genetic heterogeneity in our study set.
TP53 mutations (missense and silent) were detected in 29 out of 59 (49%) patients.
In contrast with the recent molecular model proposed, those mutations were mostly presented by LG (56%) in comparison to HG tumors (44%), confirming a genetic heterogeneity of this desease proposed by some authors.
52 out of 59 (88.5%) patients showed P72R SNP on TP53 without any difference between HG and LG stage. Regarding the genotype frequence, 14% of the population was homozygote C/C, 41% showed heterozygote C/G profile, whereas the 45% was homozygote G/G. Generally the G allele frequence is around 66%, while the remaining C allele frequence was 34%. No significant difference about genotype and allelic frequence was found in the 42 healthy donor analyzed.
We found several unknown and known mutations for both TP53 and FGFR3 genes. Nine and 24 mutations result unknown for TP53 and FGFR3 respectively.
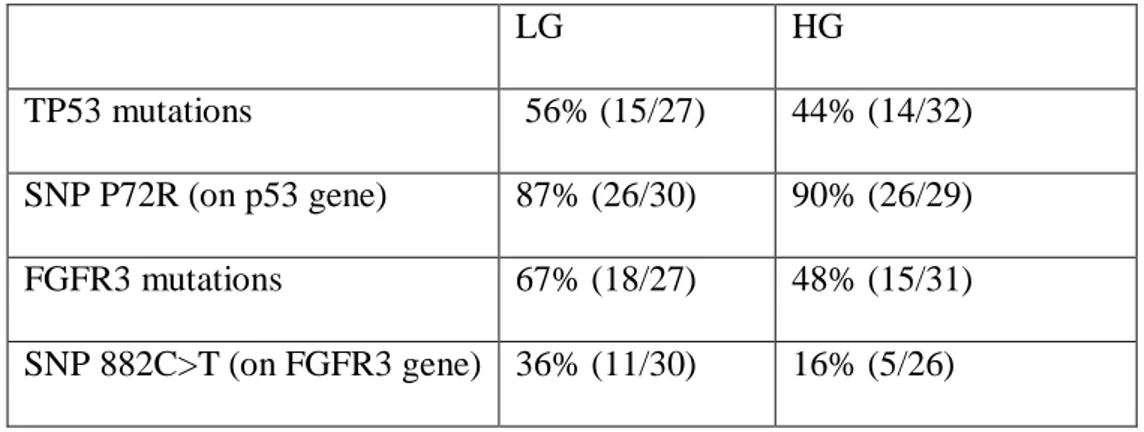
FGFR3 mutations, both missense and silent, were present from 67% and 48% of LG and HG tumors respectively. This distribution agree with the proposed theoretical molecular model. On the other hand, in contrast with the literature, we found R248C, S249C Y375C mutations in only 2/55 (4%), 3/55(5%) and 3/55(5%) respectively.
Page 48 33 out of 58 (57.5%) patients showed SNP 882 C-T (located on FGFR3 gene), particularly it was two-fold more in NIMBC (Table 7), suggesting a possible role that this SNP could have for LG carcinogenesis.
Table 8 and 9 show the distribution the distribution of TP53 and FGFR3 the mutations.
LG HG
TP53 mutations 56% (15/27) 44% (14/32) SNP P72R (on p53 gene) 87% (26/30) 90% (26/29) FGFR3 mutations 67% (18/27) 48% (15/31) SNP 882C>T (on FGFR3 gene) 36% (11/30) 16% (5/26)
Page 49
Page 50
Table 9. Detailed distribution of FGFR3 mutation in HG and LG tumors.
5.2 Gene Expression Profiling
It has been demonstrated that development and progression of BC is also characterized by changes in gene expression. Genes, like CK19, CK20, Survivin, CD44, E-Cadherine, not directly involved in FGFR3-p53 pathway, can play a strong role on BC development, especially on BC progression and invasiveness.
Page 51 Because of the poor quality of the RNA extracted from the FFPE tissues we could not perform the gene expression analysis on all the samples.
Multivariable analysis (Fig.11) showed a positive significant correlation between CK19 and CK20 mRNA expressions (p=0.0006), regardless of the histo-pathological features of the disease. Moreover, a significantly higher expression of CK20 was found in LG samples as compared to the HG ones (p=0.025), whereas the expression of surviving resulted significantly higher in HG samples as compared to the LG ones (p=0.019). (Fig 12)
CK19
CK20
Fig.11: Significant positive correlation between CK19 and CK20 by Multi Variable Analysis (StatGraphics software). This table shows Pearson product moment correlations
between each pair of variables in LG tumors. These correlation coefficients range between -1 and +1 and measure the strength of the linear relationship between the variables. Also shown in parentheses is the number of pairs of data values used to compute each coefficient. The third number in each location of the table is a P-value which tests the statistical significance of the estimated correlations. P-values below 0,05 indicate statistically significant non-zero correlations at the 95,0% confidence level. The following pairs of variables have P-values below 0,05: CK20 and CK19. CK19 CK20 CK19 0,5246 (39) 0,0006 CK20 0,5246 (39) 0,0006
Page 52
Fig. 12: gene expression mean of each marker in LG and HG population. The blue
closed circles show the gene expression distribution of each sample. * indicates significant analysis (p value < 0.05).
We performed a multivariate analysis on HG and LG separetely to seek to determine whether the markers were differently expressed within HG and LG groups. We observed a significant correlation of CK20 and E-cadherin (p=0.0064) in LG tumors (Fig. 13), while the expression of CK20 and Survivn were found strongly correlated with E-cadherine and CD44, respectively, in HG tumors (p= 0.0000 for both correlation) (Fig. 14).
Page 53 CD44
CK20
E_CAD
SURV
Fig.13: Significant positive correlation between E-Cadherin and CK20 in LG by Multi Variable Analysis (StatGraphics software). Pearson product moment correlations between
each pair of variables in LG tumors. Correlation coefficients range between -1 and +1 and measure the strength of the linear relationship between the variables.
In parentheses is the number of pairs of data values used to compute each coefficient.
P-values < 0,05 indicate statistically significant non-zero correlations at the 95,0% confidence level.. CD44 CK20 E_CAD SURV CD44 -0,0952 0,1378 -0,0570 (22) (22) (22) 0,6735 0,5408 0,8011 CK20 -0,0952 0,5624 0,0797 (22) (22) (22) 0,6735 0,0064 0,7246 E_CAD 0,1378 0,5624 0,1623 (22) (22) (22) 0,5408 0,0064 0,4706 SURV -0,0570 0,0797 0,1623 (22) (22) (22) 0,8011 0,7246 0,4706
Page 54 CD44
CK20
E_CAD
SURV
Fig.14: Significant positive correlation between CK19 and CK20, and between Survivin and CD44 in HG by Multi Variable Analysis (StatGraphics software). Pearson product
moment correlations between each pair of variables in HG tumors. Correlation coefficients range between -1 and +1 and measure the strength of the linear relationship between the variables.
In parentheses is the number of pairs of data values used to compute each coefficient.
P-values < 0,05 indicate statistically significant non-zero correlations at the 95,0% confidence level.
Finally, in order to identify the relation between the gene expression profiles (in terms of CD44, E-cadherin, Survivin and CK20 mRNA levels) and the BC histopathology, we performed a Hierarchical clustering (Fig. 15). We indentified arbitrary two groups significantly (p=0.0083): Group 1 mostly populated by HG tumors, while Group 2 by LG tumors. This analysis supports the previous results suggesting the significant role of that CD44, Survivin, CK20 and E-cadherine gene expression profiles could play to BC
CD44 CK20 E_CAD SURV CD44 -0,1017 -0,1027 0,8693 (19) (19) (19) 0,6787 0,6757 0,0000 CK20 -0,1017 0,8804 -0,1638 (19) (19) (19) 0,6787 0,0000 0,5028 E_CAD -0,1027 0,8804 -0,1121 (19) (19) (19) 0,6757 0,0000 0,6476 SURV 0,8693 -0,1638 -0,1121 (19) (19) (19) 0,0000 0,5028 0,6476
Page 55 aggressiveness and invasiveness. In fact NIMBC seems to have a stronger gene up-regulations then HG tumors. The Odds ratio describes statistically that Group 2 probabilistic power, around 8 fold more than Group 1, to characterize NMIBC.
Group 1 Group 2
HG 10 9
LG 3 20
Fig.15. (A) Hierarchical clustering. (B) Fisher distribution (p≤ 0.05). The Odds score
shows that Group 1 (mostly HG tumors) has an up-relation of all these genetic markers 8.1 times more than Group 2.
A
Page 56
5.3 Molecular Grading Molecular Grading
In order to investigate the relationship between the genetic profile and the BC histological grading we performed a molecular characterization on 49 patients having a defined histological grading at diagnosis. Considering CK19-20, CD44, E-cadherin and Survivin gene expression levels and both TP53 and FGFR3 gene alterations (SNPs and mutations) we performed a grading distribution by PCA (Principal Component Analysis) distribution (data not shown). The analysis revealed a strong heterogeneity in the distribution of the molecular markers in the studied population.
On the other hand, if we consider only the gene expression data, we observed an indicative trend about Survivin, E-cadherine and CD44 in relation to the grading, remarking the positive role that these genes could play in relation to BC aggressiveness and invasiveness (Fig.16).
Page 57 SURV s.d G1 0,1502286 0,2 G2 0,257 0,53 G3 0,74 1,14 p>0,05 E-CAD s.d. G1 0,97 1,25 G2 0,89 1,68 G3 0,38 0,78 p>0,05 CD44 S.D. G1 0.084286 0.22 G2 0.296667 0.56 G3 0.14 0.4 p>0,05 B A C