INTERACT – R
EsEARChINg
T
hIRd
C
ouNTRy
N
ATIoNAls
’ I
NTEgRATIoN
As
A
T
hREE
-
wAy
P
RoCEss
- I
mmIgRANTs
, C
ouNTRIEs
of
E
mIgRATIoN
ANd
C
ouNTRIEs
of
I
mmIgRATIoN
As
A
CToRs
of
I
NTEgRATIoN
Co-financed by the European Union
A Comparative Analysis
of the Migration and Integration
of Indian and Chinese Immigrants
in the United States
Kate Hooper
with
Susanna Groves
INTERACT Research Report 2014/32
© 2014. All rights reserved.
No part of this paper may be distributed, quoted or reproduced in any form without permission from
the INTERACT Project. CEDEM
INTERACT
Researching Third Country Nationals’ Integration as a Three-way Process -
Immigrants, Countries of Emigration and Countries of Immigration as Actors of
Integration
Research Report
Corridor Report
INTERACT RR2014/32
A Comparative Analysis of the Migration and Integration
of Indian and Chinese Immigrants in the United States
Kate Hooper *
with
Susanna Groves *
Robert Schuman Centre for Advanced Studies
This text may be downloaded only for personal research purposes. Any additional reproduction for other purposes, whether in hard copies or electronically, requires the consent of the Robert Schuman
Centre for Advanced Studies.
Requests should be addressed to [email protected] If cited or quoted, reference should be made as follows:
Kate Hooper, with Susanna Groves, A Comparative Analysis of the Migration and Integration of Indian and Chinese Immigrants in the United States, INTERACT RR 2014/32, Robert Schuman Centre for Advanced Studies, San Domenico di Fiesole (FI): European University Institute, 2014. THE VIEWS EXPRESSED IN THIS PUBLICATION CANNOT IN ANY CIRCUMSTANCES BE REGARDED AS THE
OFFICIAL POSITION OF THE EUROPEAN UNION
European University Institute Badia Fiesolana
I – 50014 San Domenico di Fiesole (FI) Italy
http://www.eui.eu/RSCAS/Publications/ http://interact-project.eu/publications/
INTERACT - Researching Third Country Nationals’ Integration as a Three-way Process - Immigrants, Countries of Emigration and Countries of Immigration as Actors of Integration
Around 25 million persons born in a third country (TCNs) are currently living in the European Union (EU), representing 5% of its total population. Integrating immigrants, i.e. allowing them to participate in the host society at the same level as natives, is an active, not a passive, process that involves two parties, the host society and the immigrants, working together to build a cohesive society.
Policy-making on integration is commonly regarded as primarily a matter of concern for the receiving state, with general disregard for the role of the sending state. However, migrants belong to two places: first, where they come and second, where they now live. While integration takes place in the latter, migrants maintain a variety of links with the former. New means of communication facilitating contact between migrants and their homes, globalisation bringing greater cultural diversity to host countries, and nation-building in source countries seeing expatriate nationals as a strategic resource have all transformed the way migrants interact with their home country.
INTERACT project looks at the ways governments and non-governmental institutions in origin countries, including the media, make transnational bonds a reality, and have developed tools that operate economically (to boost financial transfers and investments); culturally (to maintain or revive cultural heritage); politically (to expand the constituency); legally (to support their rights).
INTERACT project explores several important questions: To what extent do policies pursued by EU member states to integrate immigrants, and policies pursued by governments and non-state actors in origin countries regarding expatriates, complement or contradict each other? What effective
contribution do they make to the successful integration of migrants and what obstacles do they put in their way?
A considerable amount of high-quality research on the integration of migrants has been produced in the EU. Building on existing research to investigate the impact of origin countries on the integration of migrants in the host country remains to be done.
INTERACT is co-financed by the European Union and is implemented by a consortium built by CEDEM, UPF and MPI Europe.
For more information:
INTERACT
Robert Schuman Centre for Advanced Studies (EUI) Villa Malafrasca Via Boccaccio 151 50133 Florence Italy Tel: +39 055 46 85 817/892 Fax: + 39 055 46 85 755 Email: [email protected]
Robert Schuman Centre for Advanced Studies
Indian and Chinese nationals comprise two of the largest foreign-born nationality groups in the United States – and are growing rapidly. Indian and Chinese immigrants tend to enter the United States through skilled migration channels – either pursuing further education, or entering on temporary work visas for specialty occupations – and go on to enjoy higher employment rates and higher median household incomes than the US-born population. Despite these successes, these groups still face some integration challenges, like cultural integration and English language proficiency. Immigrant integration services in the United States are relatively decentralized, with crucial services provided by a wide array of actors. Federal funds are usually directed and supplemented by state and local government actors; who then work closely with civil society organizations, including Indian and Chinese diaspora groups, to provide support in areas like social services, language training, credential recognition, and naturalization assistance. Meanwhile, India and China are starting to expand their diaspora engagement activities to include integration services at destination.
INTERACT RR2014/32 © 2014EUI, RSCAS
Table of contents
Executive Summary ... 6
1. Introduction ... 7
2. History of Indian and Chinese Immigration to the United States ... 7
3. Contemporary Emigration from India and China to the United States ... 10
3.1 Migration Channels for Indian Nationals Entering the United States ... 11
3.2 Migration Channels for Chinese Nationals Entering the United States ... 13
4. Integration Trends of Indian and Chinese Migrants in the United States ... 16
4.1 Integration Outcomes for Indian Immigrants in the United States ... 16
4.2 Integration Outcomes for Chinese Immigrants in the united states ... 18
5. Institutional Framework for Integration in the United States ... 19
5.1 India and China’s Emigration and Diaspora Policies and Institutional Frameworks ... 19
5.2 US Integration Policy Framework ... 21
6. Conclusions ... 25
Annex I. Indian and Chinese Immigrants by Metropolitan Area ... 26
a. Immigrant Population from India to the United States ... 26
b. Immigrant Population from China to the United States ... 27
Annex II. Indian and Chinese Immigrants’ Socioeconomic Performance, Compared with the Total US Population ... 28
Annex III. Migration Channels for Indian and Chinese Immigrants to the United States ... 29
Executive Summary
Indian and Chinese nationals comprise two of the largest foreign-born nationality groups in the United States – and are growing rapidly. With populations of just over 2 million (each) in 2013, the Chinese and Indian-born populations each comprise 4.9 percent of the total foreign-born population in the United States (a near doubling of both populations in a span of just 15 years). Immigrants of both Indian and Chinese origin stand out among the US foreign-born population for their remarkable degree of socioeconomic success.* Indian and Chinese immigrants tend to enter the United States through skilled migration channels – either pursuing further education, or entering on temporary work visas for specialty occupations – and go on to enjoy higher employment rates and higher median household incomes than the US-born population. Their contributions to the United States are considerable – for example, Indian and Chinese immigrants have played an instrumental role in the development of the US information technology (IT) industry.** Despite these successes, these groups still face some integration challenges. Many Chinese immigrants struggle with English language proficiency, for example, which can pose a significant impediment to their social and labor market integration. Indian immigrants still encounter certain cultural barriers to integration, with recent research suggesting that many Indian immigrants and their descendants avoid interracial and intergroup marriage. Assessing these types of social, cultural, and civic integration represents an ongoing challenge for researchers in this field.
The Indian and Chinese governments play an indirect role in the integration of these groups in the United States. Both governments have established specialized ministries to build relations with their diaspora, though these efforts have traditionally centered on encouraging diaspora members to invest in and contribute to the homeland, rather than promoting integration at destination. However, India recently launched an Overseas Indian Centre stationed in its Washington DC embassy, and China has set up professional and student associations across the United States for its overseas nationals. Still, these efforts are nascent, and historically it has been the non-governmental organizations run by the Indian and Chinese diaspora that play a more important role in helping to successfully integrate Chinese and Indian immigrants and their descendants.
Because integration support in the United States is almost entirely decentralized, with the federal government devolving a great deal of responsibility and funds to state and local governments, most US states supplement federal benefits for immigrants. They in turn provide funding for the integration efforts of civil society actors including Indian and Chinese diaspora organizations. This enables many diaspora-based organizations to be actively involved in integrating new arrivals to their community, for instance by offering social services and assistance on issues like labor market integration and naturalization. In addition, Indian and Chinese nationals often rely on families and friends, rather than formal integration services; though this may change as more local governments open specialized immigrant affairs offices and the Indian and Chinese governments, alongside US-based diaspora organizations, become more involved with the integration of their nationals at destination.
While China and India currently lack many explicit government programs that aim to influence the integration of their nationals abroad, both governments court their skilled overseas nationals and their descendants to encourage them to contribute to their country of heritage – whether through their temporary or permanent return, remittance flows, investments, or sharing their skills, knowledge and networks. These programs encourage immigrants to maintain close political and economic ties with their country of origin while overseas, viewing their success overseas as a way to facilitate development at home.
*
Based on MPI analysis of the US Census Bureau’s 2010-2012 ACS data, which looked at indicators including educational attainment, employment status, professional status, household income, home ownership, and assets. See Annex II.
**
Saxenian (2002) estimates that by 2000, Chinese and Indian engineers were running 29 percent of technology businesses – comprising around 73,000 jobs – in the United States’ Silicon Valley.
INTERACT RR2014/32 © 2014EUI, RSCAS
1. Introduction
The United States has the largest immigrant1 population of any country in the world, hosting 20 percent of the world’s immigrants despite having only 5 percent of the world’s population (Nwosu, Batalova, and Auclair 2014). Of the 41 million immigrants in the United States in 2013, 29 percent (or 12 million) were born in Asia –compared to 5 percent in 1960. Indian and Chinese immigrants constitute a significant share of the relatively new, but fast-growing Asian immigrant community in the United States. In 2013, the Indian-born population was the second biggest US foreign-born nationality group (after Mexico), at 2.03 million, with the Chinese-born population ranked third (after the Philippines), at 2.02 million.2
Despite being a relatively new immigrant population, the Indian- and Chinese-born populations in the United States stand out for their high degree of socioeconomic integration. This paper compares the historical migration and integration patterns of the Indian- and Chinese-born populations in the United States, before offering a quantitative analysis of their current socioeconomic performance, using US American Community Survey (ACS) and Census data. This project’s research into the socioeconomic performance of these immigrant groups suggest that despite this success, they may still face some integration challenges – for example, limited English proficiency and experiencing social isolation.
This paper then maps out the types of integration support offered by the US government, the Indian and Chinese governments, and US civil society actors – including Indian and Chinese diaspora organizations. Interventions like US federal and state-level English language tuition, and the provision of welfare services and cultural support by Chinese and Indian diaspora organizations, can all play an important role in mitigating these effects. This paper assesses the integration of these two immigrant populations through a socioeconomic lens, utilizing ACS and Census data, before mapping out policy interventions that can foster their integration.
2. History of Indian and Chinese Immigration to the United States
3Today Indian and Chinese immigrants make up a substantial share of the US foreign-born population, but this was not always the case. Until recent decades, the United States had few residents of Indian birth, with Indian immigration to the United States only beginning in earnest in the 1970s. Chinese immigrants started arriving in large numbers during the 1980s; but unlike India, this followed an earlier period of immigration to the United States during the 19th century (see Figure 1). US immigration policies (and in the case of China, home government emigration policies) significantly shaped historical inflows of Asian immigrants to the United States, both in terms of their absolute numbers and their socioeconomic profile.
Immigrants from India and China live in all parts of the United States; however, the Indian immigrant population is more widely dispersed across the country than the immigrant population from China (see Annex I). While there are large concentrations of Indian immigrants in the states of California, New Jersey, and Texas, the majority of Indian immigrants reside outside of those three
1
This paper focuses on foreign-born (so-called first-generation) immigrants unless otherwise stated.
2 Approximately 2.03 million people of Indian birth and 2.02 million immigrants of Chinese birth resided in the
United States, each constituting 4.9 percent of the United States’ foreign-born population, respectively. Estimates are based on Migration Policy Institute (MPI) analysis of the US Census Bureau’s 2013 American Community Survey (ACS) and the 1980, 1990, and 2000 Censuses. Unless otherwise stated, estimates for the Chinese population include Hong Kong but exclude Taiwan.
3 Unless otherwise noted, data in this section come from MPI analysis of data obtained from the US Department
states. In contrast, over half of all Chinese immigrants in the United States live in either California or New York.4 The New York metropolitan area (which encompasses parts of New Jersey, Connecticut, and Pennsylvania and hosts the United States’ largest foreign-born population) is home to the greatest number of Indian and Chinese immigrants: 300,000 Indian immigrants and 500,000 Chinese immigrants live in this metropolitan area. Outside of the New York metropolitan area, there are large Indian immigrant communities in Chicago, Washington DC, San Francisco, and San Jose, California; and large Chinese immigrant communities concentrated in and around Los Angeles and San Francisco.5
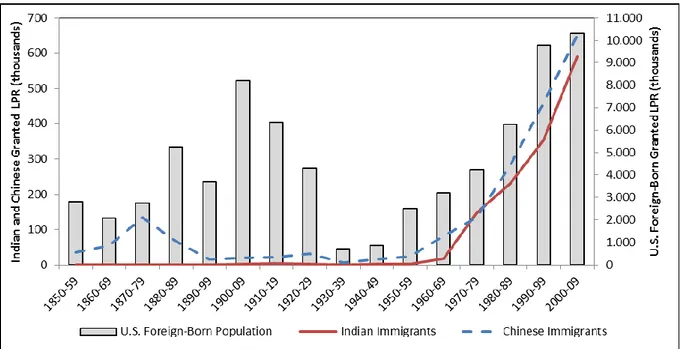
Figure 1. Indian and Chinese Nationals and US Foreign Born Granted Legal Permanent Resident Status (LPR) in the United States by Decade, 1850-2009
Source: Migration Policy Institute (MPI) analysis of data obtained from DHS, Yearbook of Immigration Statistics.
Note: from 1820 to 1867, figures represent alien passenger arrivals at seaports; from 1868 to 1891 and 1895 to 1897, immigrant alien arrivals; from 1892 to 1894 and 1898 to 2012, immigrant aliens admitted for permanent residence; from 1892 to 1903, aliens entering by cabin class were not counted as immigrants. Land arrivals were not completely enumerated until 1908.
The settlement of Indian immigrants in North America predates the United States’ founding, perhaps starting as early as 1635 with the appearance of an “East Indian” bonded laborer in Jamestown’s census records (McCartney 2003). Low levels of emigration from India to the United States continued throughout the 19th and early 20th centuries under British colonial rule in India, primarily consisting of Sikhs moving from the Punjab to California who most often found work as farmhands, on railroads, or in mills (Bay Area Council Economic Institute 2009). The Indian-born population was too small to appear in the US national census data of 1850, and of the nearly 19 million people who immigrated to the United States between 1820 and 1899, fewer than 700 were from India (Gibson and Lennon 1999). From 1900 to 1930, emigration from India to the United States expanded; still, just 8,500 Indians arrived during these decades, and even this small amount of growth was short lived. During the 30 years that followed, less than half that number of people of Indian origin (4,000) settled in the United States, and India remained an insignificant source of immigrants for the United States until the 1970s.
4 California is home to 350,000 Indian immigrants, New Jersey is home to 210,000 Indian immigrants, and
Texas is home to 165,000 Indian immigrants. In contrast, California is home to 700,000 Chinese immigrants, and New York is home to 435,000 Chinese immigrants.
A Comparative Analysis of the Migration and Integration of Indian and Chinese Immigrants in the United States
INTERACT RR2014/32 © 2014EUI, RSCAS 9
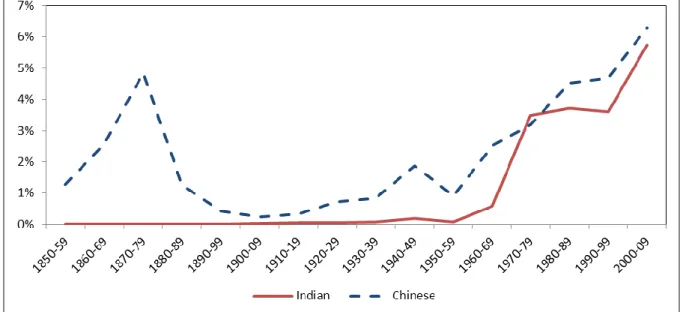
In contrast, 19th-century Chinese immigration to the United States was robust. Chinese immigrants first came to the United States in substantial numbers in the 1850s and 1860s in the midst of the First and Second Opium Wars in southern China and devastating famines, and principally settled in the country’s western regions. California’s gold rush, which began in 1849, offered the prospect of making an easy fortune and proved to be a strong lure for many displaced young Chinese men. Most of these immigrants were low-skilled, and took jobs in the gold mining, railroad, manufacturing, agricultural, and service industries, or started small businesses. By the 1870s, nearly 5 percent of immigrant arrivals to the United States were of Chinese origin (see Figure 2), making it the fifth largest arrival group by nationality that decade, behind Germany, the United Kingdom, Ireland, and Canada. In total, over 300,000 Chinese laborers came to the United States from 1850 to 1899, with the size of the Chinese-born population in the United States increasing from a small base of 1,000 in 1850 and peaking in 1880 with a population of over 100,000 (Gibson and Lennon 1999). However, as the US Chinese population grew, so did anti-Chinese sentiment, leading to ethnic discrimination and demands to restrict Chinese immigration (US Department of State n.d.).
Legislative changes in the United States made in the late 19th and early 20th centuries brought Chinese immigration to a halt and significantly limited immigration from other non-Western countries. During the 1880s, the US Congress passed a series of laws collectively referred to as the Chinese Exclusion Acts, which marked a turning point in US immigration laws. This landmark legislation severely curtailed the numbers of Chinese immigrants granted entry to the United States, and further pieces of legislation in the decades following effectively cut off Chinese, Indian, and other non-Northern and Western European population inflows to the United States.
Figure 2. Indian and Chinese Immigrants Granted LPR Status as Percentage of Total New LPR Status Grantees by Decade, 1859-2009
Source: MPI analysis of data obtained from DHS, Yearbook of Immigration Statistics.
Notes: from 1820 to 1867, figures represent alien passenger arrivals at seaports; from 1868 to 1891 and 1895 to 1897, immigrant alien arrivals; from 1892 to 1894 and 1898 to 2012, immigrant aliens admitted for permanent residence; from 1892 to 1903, aliens entering by cabin class were not counted as immigrants. Land arrivals were not completely enumerated until 1908.
Following the Chinese Exclusion Acts, other federal and state legislation introduced in the 1920s and 1930s barred Chinese, Indian, and other Asian peoples from qualifying for US citizenship, inter-marrying with US-born whites, or owning land (Naujoks 2013: 26). The result of these nationally restrictive policies for the Chinese and Indian born was that from 1920 to 1960, the US government granted only 61,500 immigrants from China and 6,250 immigrants from India legal permanent resident (LPR) status. In 1960, the Asian-born population in the United States totaled less than half a
million and made up about 5 percent of the overall foreign-born population (Gibson and Lennon 1999).
Although the Chinese population was the first national-origins group to be targeted by US nationally restrictive immigration policy, the situation for this group was the first to improve. When the United States and China became allies in World War II, Chinese Americans suddenly found themselves embraced by the American political establishment. In 1943, the United States repealed the Chinese Exclusion Acts, allowing Chinese residents living in the United States to naturalize, and introducing a token annual quota for Chinese immigrants.6 The United States finally repealed its national-origin quota immigration system with the Immigration and Nationality Act of 1965, having a visible and immediate impact on the scale of Indian, Chinese and other non-Western European immigration.
3. Contemporary Emigration from India and China to the United States
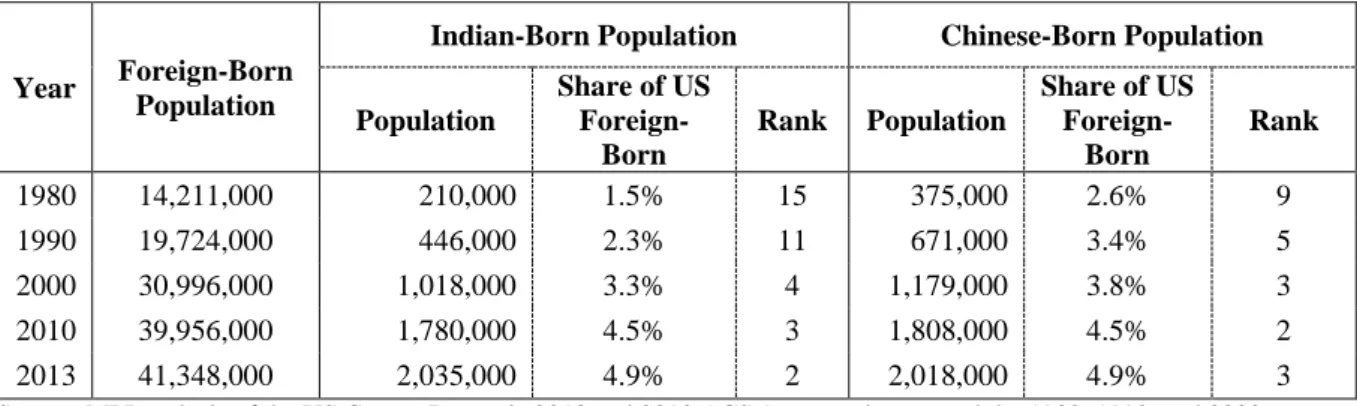
7Indian and Chinese immigrant communities are relatively new, yet fast-growing populations in the United States. When compared with the total US foreign-born population, both the Indian and Chinese immigrant communities are quite recent arrivals: 51 percent of Indian immigrants and 41 percent of Chinese immigrants arrived during or after 2000, compared with 36 percent of the overall foreign-born population.8 The Indian and Chinese immigrant communities have both grown rapidly since 1980, now ranking as the second largest and third largest foreign-born populations in the United States respectively (see Figure 3).
Figure 3. Total Foreign-, Indian- and Chinese-Born Populations in the United States, 1980 to 2013
Year Foreign-Born Population
Indian-Born Population Chinese-Born Population
Population Share of US Foreign-Born Rank Population Share of US Foreign-Born Rank 1980 14,211,000 210,000 1.5% 15 375,000 2.6% 9 1990 19,724,000 446,000 2.3% 11 671,000 3.4% 5 2000 30,996,000 1,018,000 3.3% 4 1,179,000 3.8% 3 2010 39,956,000 1,780,000 4.5% 3 1,808,000 4.5% 2 2013 41,348,000 2,035,000 4.9% 2 2,018,000 4.9% 3
Source: MPI analysis of the US Census Bureau’s 2013 and 2010 ACS 1-year estimates and the 1980, 1990, and 2000 Censuses. Estimates for China include Hong Kong and Macau, and exclude Taiwan.
Despite being relatively new populations in the United States, Indian and Chinese immigrants are well integrated into American society. This is partly due to the migration channels that Indian and Chinese immigrants use to enter the United States, which are very conducive to integration due to their selection requirements. Most Indian nationals enter via an employer-sponsored temporary worker program for the highly skilled (the H-1B visa),9 meaning that these immigrants have already secured a
6 This had numerous benefits for Chinese residents, allowing them to sponsor relatives for US permanent
residence, participate in military service, and gain access to jobs restricted to US citizens.
7
Unless otherwise noted, data in this section come from MPI analysis of data obtained from DHS 2013.
8 Unless otherwise noted, estimates for the diaspora population and its characteristics are based on MPI analysis
of the US Census Bureau’s Current Population Surveys (CPS), using five years of pooled data (2009 through 2013) collected in March of each year (US Bureau of Labor Statistics. 2009-2013).
9 The H-1B visa program – currently capped at 65,000, with up to 20,000 for workers with at least a master’s
degree or equivalent, and exemptions for employees of universities, non-profit organizations, and research institutions – enables US firms to hire foreign workers with at least a bachelor’s degree for specialty
A Comparative Analysis of the Migration and Integration of Indian and Chinese Immigrants in the United States
INTERACT RR2014/32 © 2014EUI, RSCAS 11
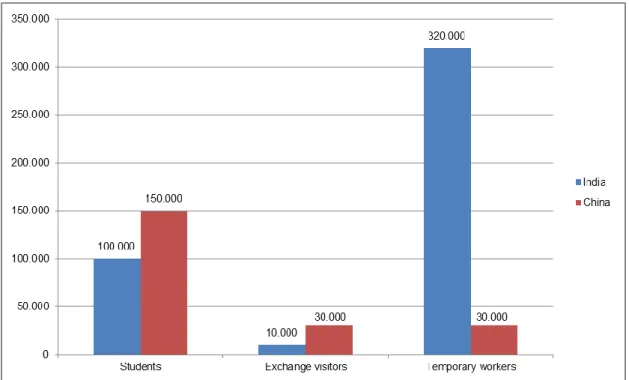
specialized position in the United States that makes use of their expertise and provides an income stream. Most Chinese immigrants enter on student visas, which suggests that they are highly educated or in the process of acquiring an advanced education.
Figure 4. Chinese and Indian Student and Temporary Worker Population as of January 2012
Source: Baker 2014: 3.
Both of these programs serve high-achieving migrants and reward beneficiaries that form strong social and professional networks in the United States. The university environment, for instance, facilitates cultural immersion and the building of social and professional networks. And while both the employment and student visa programs provide temporary legal status in the United States, they can also be stepping stones to legal permanent resident (LPR) status, and eventual naturalization, for individuals who succeed in these programs.10 The different channels used by each group are described in more detail below, with a breakdown of the data available in Annex III.
3.1 Migration Channels for Indian Nationals Entering the United States
Since most Indian nationals enter the United States through temporary admissions programs for skilled workers and students, this population is disproportionately highly skilled relative to India’s national population, the US foreign-born population, and the US general public. The Indian immigrant population in the United States is also a comparatively young population group. As of 2012, the median age of Indian immigrants was 37, which is younger than other foreign-born populations, but close to the US national median. A significantly higher proportion of the Indian immigrant population (84 percent) was working age – between the ages of 18 and 64 – than the US general public (63 percent).11
(Contd.)
occupations that require technical or theoretical expertise (for example, scientists, engineers, and computer programmers). Definition from US Immigration and Naturalization Services 2013.
10 Commonly referred to as Green Card holders, people with LPR status have the authorization to live and work
in the United States on a permanent basis and are on a path towards naturalization.
11
I. Indian nationals on temporary worker visas
Most Indian nationals enter the United States on temporary worker visas,12 like the H-1B visa and L-1 visa (a visa category open to foreign employees of international corporations with offices in the United States). In US fiscal year (FY) 2013, 65 percent of all H-1B visas and 29 percent of all L-1 visas were issued to Indian nationals.13 A significant number of Indian nationals also enter the United States as dependents of H-1B or L-1 visa holders. In FY 2013, 74 percent of H-4 visas (for family members of H-1, H-2, and H-3 visa recipients) and 33 percent of L-2 visas (for family members of L-1 visa recipients) went to Indian nationals (see Annex III). As of January 2012, around 320,000 Indian nationals were residing in the United States on temporary worker visas (both principals, and dependents) (Baker 2014).
II. Indian nationals on student visas
Indian nationals comprise the second largest group of international students enrolled in US colleges and universities, after Chinese nationals, and many among them plan on settling in the United States permanently after completing their studies. Approximately 100,000 Indian nationals studied in the United States during the 2012-13 academic year, comprising 12 percent of all international students in the United States, with 75 percent enrolled in a science, technology, medical, or mathematics degree program.14 Indian nationals received more PhDs in 2012from US universities than any other foreign national group, bar China; and 86 percent of surveyedIndian doctoral students intended to remain in the United States after graduating that year.15
III. Indian immigrants in legal permanent resident (LPR) status
Foreign nationals can apply for legal permanent resident (LPR) status through employment-based, family-sponsored, or refugee/asylee channels. As Figure 5 shows, Indian nationals are more likely to apply for LPR status through employment-based channels, and less likely to apply through family-based or refugee/asylee channels, than the overall foreign-born population granted LPR status. Indian nationals most commonly acquire LPR status (or a “Green Card”) through employment: just over half of the 68,000 Indian nationals granted LPR status in FY 2013 applied through this channel.16 In turn, nearly half (46 percent) obtained their new LPR status via family-based preferences, with very few Indian nationals acquiring Green Cards by applying for refugee or asylee status.
12 During US fiscal year (FY) 2013, Indian nationals entered the United States on temporary worker visas
363,000 times – note that a person who holds one of these visas may use it to enter the United States more than once, so these numbers represent entries, not individuals. The US fiscal year begins on October 1, and ends on September 30 of the designated fiscal year (for example, fiscal year 2013 ran from October 1, 2012 to September 30, 2013).
13 US Department of State, Bureau of Consular Affairs n.d.: “FY2013 NIV Detail Table”. 14
Most of these students were enrolled in graduate schools or participating in the F-1 student visa’s post-graduation Optional Practical Training (OPT) program. MPI analysis of Institute of International Education 2013.
15 In 2012, there were 2,230 Indian doctoral graduates (15 percent of all PhDs awarded by US universities to
students on a temporary visa). See National Science Foundation 2013: Table 25 (“Top 40 countries or economies of origin, ranked by number of doctorate recipients: 2012”), Table 53 (“Doctorate recipients with temporary visas intending to stay in the United States after doctorate receipt, by country of citizenship: 2006-12”).
16
The four main ways that immigrants obtain LPR status via their employment status are (1) by receiving an offer of a permanent job in the United States from an employer who is willing to sponsor the individual’s Green Card; (2) making an investment in an enterprise that creates new jobs in the United States; (3) demonstrating extraordinary talent in a profession; and (4) holding a designated specialty occupation (e.g. broadcaster, physician, or an employee of an international organization). See DHS 2013c.
A Comparative Analysis of the Migration and Integration of Indian and Chinese Immigrants in the United States
INTERACT RR2014/32 © 2014EUI, RSCAS 13
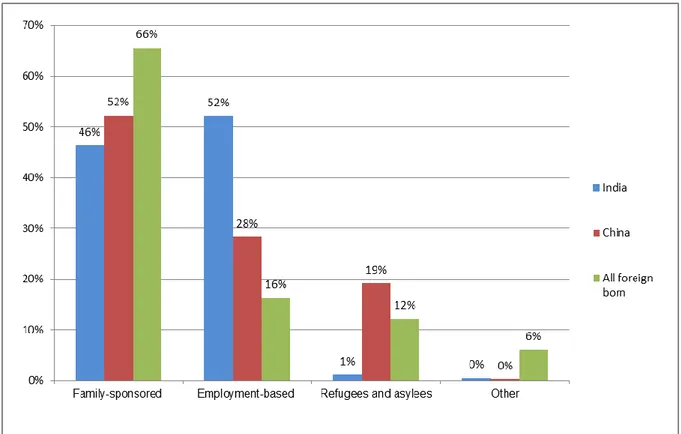
Figure 5. Chinese-, Indian-, and Foreign-Born Populations Granted LPR Status by Broad Class of Admission, FY 2013
Source: MPI analysis of data obtained from DHS, Yearbook of Immigration Statistics. Note that “family-sponsored” includes family-sponsored preferences and immediate relatives of US citizens, and “other” includes “other” and “diversity” categories.
IV. Indian immigrants’ access to US citizenship
In FY 2013, more Indian nationals gained US citizenship than all other national-origin groups except Mexico – 50,000, representing 6 percent of all naturalizations granted that year. As of 2012, 42 percent of Indian immigrants had naturalized, closely following the overall foreign-born population (of which, 44 percent have naturalized).17 Usually to become a naturalized US citizen a person must have held LPR status for three to five years, in addition to meeting other eligibility requirements (DHS 2013b). Given that most Indian immigrants in the United States arrived during or after 2000, this would suggest that many applied for citizenship shortly after they became eligible to do so. India does not recognize dual citizenship.
3.2 Migration Channels for Chinese Nationals Entering the United States
Temporary admissions programs for students and skilled workers are also the most significant migration channels for Chinese nationals entering the United States. A significant number of Chinese nationals also come to the United States as asylum seekers and as adopted children – but while they actually make up the greatest share of both of these migration channels in the United States, the absolute numbers are small relative to the number of Chinese-born students and skilled workers. Chinese immigrants in the United States are a comparatively old population, with a median age that exceeds both the US foreign-born and the US national populations. Nevertheless, the vast majority of
17 These figures are taken from the CPS data. In the 2010-12 ACS data, 46 percent of Indian immigrants were
Chinese immigrants (76 percent) were of working age, a far higher proportion than the US national average of 63 percent.18
I. Chinese nationals on student visas
Most Chinese migrants enter the United States on student visas, in contrast to migrants from India, who principally enter as beneficiaries of temporary worker programs (see Figure 4). Despite the current prevalence of Chinese students in US educational institutions, for decades the United States was not a country of destination for Chinese students. In fact, China sent no students to the United States from the 1950s until the 1974-1975 academic year.
Significant expansion in the size of the Chinese international student population in the United States began during the 1980s, and growth was rapid. By 1988, China had displaced Taiwan as the leading sender of international students to the United States and has remained in one of the top places ever since (Institute of International Education 2014a and 2014b). Since 2009, China has been the number one source country of international students in the United States, sending more than double the number of students as the second ranked country, India, in the 2012-13 academic year.19 The most popular fields of study for Chinese international students in the United States that year were science, technology, medical studies, or mathematics – together attracting 41 percent of the Chinese student population.20
Most Chinese students come to the United States for graduate studies, with 29 percent of all PhDs awarded by US institutions to students on temporary visas going to Chinese nationals in 2012. Like the Indian immigrant population, the vast majority of Chinese students who earned a doctoral degree in 2012 planned on staying in the United States post-graduation: 83 percent, compared to 71 percent of all international doctoral awardees.21 The number of Chinese students enrolling in undergraduate studies is growing rapidly too,22 fuelled by the enormous competition for admissions to undergraduate degree programs in China and the growing size of China’s wealthy middle classes who can afford the fees.23 Demand for higher education in China far outstrips Chinese universities’ enrolment capacity; though China is expanding its university system, only 3 percent of students who sat the gaokao (China’s national college entrance exam) in 2012 gained admission to a Chinese university and only
18 Though a similar share of Chinese immigrants and the US general public were aged 65 or older as of 2012 (16
versus 13 percent), far fewer Chinese immigrants were under the age of 18 (7 percent, compared with the US national average of 24 percent).
19
A record 236,000 Chinese students came to study in US-based academic programs in 2012-13. Students from China represented 29 percent of all foreigners admitted for study in the United States during the 2012 to 2013 academic year, up from 11 percent (or 62,000 individuals) in the 2005 to 2006 academic year. From 2001 until 2008 India was the top sender of students to the United States, but in 2009 China surpassed India and retained the preeminent position through the 2012 academic year (the most recent year for which data was publically available at the time of publication). MPI analysis of data from Institute of International Education 2014a and 2014b.
20 Twenty-nine percent of Chinese international students in the United States focused on business or
management studies that year, whereas 9 percent studied social sciences or the humanities and 5 percent fine or applied arts.
21 MPI analysis of data from National Science Foundation 2013.
22 During the 2012-13 academic year 40 percent of Chinese students in the United States were enrolled in an
undergraduate program: a 9 percentage point increase from three years prior. Institute of International Education 2011 and 2014a.
23 In 2012, about 7.7 million urban Chinese households had disposable incomes of at least $34,000, and
McKinsey projects that the size of the affluent class in China will expand to include some 32.1 million urban households by 2022 if current trends persist (Barton, Chen, and Jin 2013).
A Comparative Analysis of the Migration and Integration of Indian and Chinese Immigrants in the United States
INTERACT RR2014/32 © 2014EUI, RSCAS 15
0.2 percent of examinees were accepted by one of the country’s top five universities (The Economist 2012).
II. Chinese nationals in temporary worker programs
After India, China is the second largest beneficiary of temporary work visas in the United States. In FY 2013, Chinese nationals received 8 percent of all H-1B visas (some 13,000), and 6 percent of all L-1 visas issued (some 4,000) that year (US Department of State, Bureau of Consular Affairs n.d.: “FY2013 NIV Detail Table”). A significant number of Chinese nationals were also issued temporary work visas as dependents, with approximately 3,000 H-4 and 4,000 L-2 visas issued in FY 2013 (4 percent and 5 percent of their respective totals). As of January 2012, approximately 30,000 Chinese citizens were residing in the United States on temporary worker visas (20,000 H visas and 10,000 L visas) (Baker 2014). These highly skilled workers make a significant contribution to the US workforce, particularly in STEM (science, technology, engineering and mathematics) subjects. In 2013, 90 percent of all H-1B applications were for jobs in STEM occupations, which US employers often struggle to fill with domestic candidates (Brookings Institution analysis of 2011 Conference Board job openings data cited in Rothwell and Ruiz 2013).
III. Chinese nationals granted asylum
The United States grants asylum to more Chinese nationals than any other national-origin group. In FY 2013, the United States granted 8,600 asylum petitions from Chinese-born people – some 34 percent of the total number granted that year.24 (In comparison, the United States approved fewer than 400 asylum petitions from Indian nationals that year.) People who have been approved for asylum by the United States are eligible to apply for LPR status after one year and may file a petition to bring their spouse or their children to the United States. Though a significant portion of US asylum petitions are awarded to Chinese nationals, few enter as refugees: only around 100 Chinese refugees, or 0.1 percent of the total number of refugees, were admitted to the United States in fiscal year 2013.25 Nevertheless, asylees and refugees are usually eligible for the same social services and integration programs, like those offered by the US Office of Refugee Resettlement.
IV. Chinese immigrants in legal permanent resident (LPR) status
In FY 2013, more Chinese nationals became US LPRs (74,000) than any other nationality, comprising 7 percent of all LPR approvals that year. Like India, Chinese nationals are less likely to gain LPR status through family-based preferences than the overall foreign-born population (52 percent, compared with the average of 66 percent). As Figure 5 shows, just over a quarter (28 percent) of Chinese nationals obtain LPR status through employment-based channels (compared with 52 percent of Indian nationals). Just under a fifth (19 percent) of Chinese nationals obtain LPR status as refugees or asylees – a significantly higher number than the overall foreign-born population (at 12 percent) and the Indian-born population (1 percent).
24 The United States granted 4,500 Chinese nationals asylum defensively, meaning that the individuals had
applied for asylum as a defense against removal from the United States; and approved 4,000 Chinese nationals asylum affirmatively, which indicates that the petitioner was already physically present in the country and was not facing removal procedures.
25 Asylum seekers must be present in the United States to apply for asylum, whereas refugee status is secured
V. Chinese immigrants’ access to US citizenship
As of 2012, just over half (54 percent) of Chinese immigrants were US citizens, a higher proportion than the US foreign-born population overall (44 percent). In FY 2013, China was the fourth-largest national origins group in the United States; and was the fifth-largest national origins group granted citizenship that year.26 Given that a disproportionately large share of legal permanent residents in the United States are Chinese born, and LPR status is a stepping stone towards US naturalization, the trend of a high US naturalization rate among the Chinese-born population is likely to continue into the future.27 China, like India, does not recognize dual citizenship.
4. Integration Trends of Indian and Chinese Migrants in the United States
During their first years in the United States, immigrants often face barriers to full social, economic, and civic participation. However, as time passes and immigrants and their children learn English and interact with members of their host communities, the gaps that exist between them and the rest of US society narrow.28 Generation after generation of immigrants to the United States has demonstrated remarkable aptitude at integrating, and US society has by and large adjusted to newcomers. Progress among the United States’ different immigrant groups is uneven, but overall recent immigrants are integrating well across five indicators: English language proficiency, socioeconomic attainment, political participation, ethnic diversity of their place of residence, and social interaction with the host community. Full integration in the United States generally takes multiple generations, with the children of immigrants most often outperforming their parents in terms of educational attainment, occupational status, wealth, home ownership, and English proficiency. Further, residential segregation decreases across generations and rates of inter-ethnic and inter-racial marriage rise (Jiménez 2011). Indian and Chinese immigrants perform well across these different indicators – often outperforming the US-born population – suggesting a high degree of socioeconomic integration.
4.1 Integration Outcomes for Indian Immigrants in the United States29
First-generation Indians are, generally speaking, extremely well integrated into the United States. They outperform the US general public, as well as other foreign-born populations, across a number of different socioeconomic indicators. Compared with US national averages, an Indian immigrant is more likely to hold a tertiary degree, have a job, earn a significantly higher wage, and actively participate in their local communities. Indian immigrants hold advanced degrees at four times the rate of the US general public – reflecting the vast majority who enter on temporary work visas for specialty occupations, or as tertiary-level students – and they are also more likely to be in the labor force or to be employed.
English is one of the most commonly spoken official languages in India, which puts Indian immigrants at a significant advantage compared with other large immigrant groups that often struggle to gain full English proficiency. In 2011, 72 percent of Indian immigrants in the United States reported either only speaking English (9 percent) or speaking English “very well” (63 percent), compared with 49 percent of all immigrants (Whatley and Batalova 2013b). Full proficiency in the host country
26 In FY 2013, 38,000 people from China became US citizens, making up 5 percent of all US naturalizations that
occurred that year.
27 Estimate is based on MPI analysis of the US Census Bureau’s 2010-2012 ACS. 28 See Jiménez 2011, for example.
29 See Annex II for a comparative table of Chinese and Indian immigrants’ socio-economic performance across
A Comparative Analysis of the Migration and Integration of Indian and Chinese Immigrants in the United States
INTERACT RR2014/32 © 2014EUI, RSCAS 17
language is a vital part of ensuring the successful integration of immigrants and their descendants with poor language ability linked to lower labor market outcomes.30
Unlike many other immigrant populations in the United States, whose education levels lag behind those of the US general public (Haskins 2009: 62), Indian immigrants’ high levels of academic achievement set them far above US national averages. Only 6 percent of this population age 25 and older in the United States had less than a high school diploma, compared to 16 percent of the comparative Chinese immigrant population and 13 percent of the general US public. Seventy-nine percent had earned at least a bachelor’s degree, compared to 31 percent of the US population overall. Forty-five percent of Indian immigrants age 25 and older in the United States had earned a master’s degree, advanced professional degree, or PhD, percent, versus 11 percent of the US general public.
Indian immigrants also outperform the US general public in the labor market: Indian immigrants aged 16 or older are more likely to participate in the labor force (71 versus 64 percent), and when in the labor force are more likely to be employed (94 versus 91 percent). This is consistent with the group’s high educational attainment. Thirty-five percent of Indian immigrants, 16 years and over were in professional or managerial occupations, compared to 20 percent of the US general public.31
As a result, Indian immigrants also earn more than the US general public. Households headed by Indian immigrants in the United States had a median annual income approximately $40,000 higher than US national median ($90,000 versus $50,000), and they were also far more likely to be high income. More than half (53 percent) of all Indian immigrant households had annual incomes in the top 25 percent of the US income distribution (above $90,000 per year), and more than a quarter (28 percent) had annual incomes in the top 10 percent (above $140,000 per year).This helps explain the considerable scale of remittances sent to India from the United States: in 2012, almost $12 billion in remittances were transferred to India from the United States, comprising about 18 percent of total remittances to India that year.32 These remittance flows have been aided by changes in India – such as commercial bank policies to facilitate sending remittances – the successful profile of recent emigrants, and the strength of the Indian economy (Chishti 2007).
Indian immigrants are much less likely to live in poverty than other immigrant groups, or the general US population, with only 7 percent having family incomes below the federal poverty threshold (compared with the US average of 15 percent). The United States uses the poverty threshold to determine eligibility for several means-tested government aid programs – though many of these are restricted to immigrants with LPR status or US citizenship (Fix 2009).
In general, Asian Americans tend to live in racially mixed neighborhoods – particularly when compared with other US racial groups – though levels of residential integration for this group have remained steady since 1980 (Pew Research Center 2013: 14, 35). Indian immigrants are more dispersed across the United States than Chinese immigrants, though many new arrivals still choose to settle in California, New Jersey, or Texas. This dispersion is attributed to skilled professionals being less dependent on the help of their ethnic community, and being more scattered throughout the country than manual laborers, for example (Portes and Rumbaut 2006: 41). Yet despite living in mixed neighborhoods, the Indian community is bound by strong cultural bonds. Indian immigrants and their children are less supportive of interracial and intergroup marriage than many other immigrant groups, including Chinese immigrants. A recent study found only 14 percent of newlyweds of Indian ancestry (marrying between 2008 and 2010) had married someone outside their ethnic group; and nearly 40
30
See, for example, Bonfanti, Xenogiani 2014: 268-272; Batalova and Fix, with Creticos, 2008; McHugh and Challinor 2011.
31 This rate is calculated based on the share of all individuals reporting an occupation for their primary job at the
time the CPS was administered, or for their most recent primary job.
32
percent of Indian Americans stated they would be uncomfortable with their child marrying outside their race or origin group (Pew Research Center 2013: 13, 107).
Indian immigrants are politically active in their local communities, rapidly naturalizing as US citizens (when eligible to do so), which enables them to vote and participate in US politics, and displaying high levels of civic involvement. Despite being a relatively new immigrant population – just over half arrived during or after 2000 – Indian immigrants possess similar naturalization rates to the overall US foreign-born population (42 versus 44 percent). This suggests that many Indian immigrants apply for citizenship shortly after they become eligible.
4.2 Integration Outcomes for Chinese Immigrants in the United States33
Chinese immigrants in the United States are another notably successful immigrant population, outperforming the US general public in terms of educational achievement, employment rates, and household income. However, language serves as an important barrier to integration for this community. In 2010, approximately 63 percent of Chinese immigrants reported having limited English proficiency (LEP); of which, 66 percent of immigrants from mainland China were LEP, compared with 42 percent of immigrants from Hong Kong.34 In comparison, only 28 percent of Indian immigrants reported being LEP. Limited ability in the language of the host country can have serious consequences on immigrants’ integration outcomes. LEP immigrants have lower employment rates than other immigrant groups whose native language is English, and are twice as likely to work in unskilled occupations compared with their English proficient counterparts (Batalova and Fix, with Creticos 2008: 21). Limited host-language ability can also lead to social isolation from mainstream society (Hernandez and Charney 1998: 55). Yet in spite of this disadvantage, Chinese immigrants still perform well across an array of socioeconomic indicators.
Like Indian immigrants, Chinese immigrants predominantly enter the United States as highly skilled workers, or as students pursuing a tertiary-level degree, which is reflected in their higher levels of education, employment, and household income compared with the US-born population. Close to half (48 percent) of the Chinese-born population age 25 and older held at least a bachelor’s degree, compared with the US national average of 31 percent. Chinese immigrants were also more than twice as likely to hold an advanced degree (master’s, advanced professional degree or PhD) than the US general public (27 percent versus 11 percent). The share of the Chinese immigrant population with less than a high school degree was nearly equivalent to the general US population (16 versus 13 percent).
While the labor force participation rate is slightly lower for this population than the overall US population (62 versus 64 percent), employment rates are higher (95 versus 91 percent). Chinese-born people are also less likely to work in professional or managerial populations than the general public. Roughly a quarter (27 percent) of Chinese immigrants worked in professional or managerial occupations, which include STEM fields and administrative and managerial jobs, compared to 31 percent of the US general public and 35 percent of the Indian immigrant population.
US households headed by a Chinese-born immigrant had a higher annual median income than the US national population and were also more likely to be high income. Thirty-five percent of households headed by a Chinese immigrant had annual incomes above $90,000, placing them in the top quartile of the US income distribution. Similarly, 18 percent of all households headed by a Chinese immigrant had annual incomes above $140,000, placing them in the top decile of the US income distribution.35
33
See Annex II for a comparative table of Chinese and Indian immigrants’ socio-economic performance across an array of indicators, compared with the general US-born population.
34 MPI calculations from 2010 ACS data; McCabe 2012.
35 MPI analysis found a notable discrepancy here between immigrants from mainland China, whose median
A Comparative Analysis of the Migration and Integration of Indian and Chinese Immigrants in the United States
INTERACT RR2014/32 © 2014EUI, RSCAS 19
However, nearly equivalent shares of Chinese immigrants and the US general public had family incomes below the federal poverty threshold (16 versus 15 percent), while 8 percent had family incomes between 100 and 150 percent of the poverty threshold, compared to the US national average of 10 percent.
Over half of Chinese immigrants live in the traditional immigrant gateway states of California or New York; and many large US cities like New York City, San Francisco, and Los Angeles have historic “Chinatown” districts. However, these settlement patterns have altered in recent years, with more Chinese immigrants either choosing to settle outside of these inner-city enclaves in suburbs; or eschewing traditional gateway cities like New York altogether in favor of non-gateway destinations elsewhere. One study of low-skilled Chinese immigrants in the United States found many were now opting to move to non-gateway destinations – including rural areas – in pursuit of work in the Chinese restaurant business (Liang and Li 2012: 7-9).
Some Chinese immigrants experience difficulties integrating into their local communities, exacerbated by their poor English language skills. One survey found that over half (55 percent) of Chinese immigrants claimed all or most of their friends were Chinese American; this fell to just 14 percent among second-generation Chinese (Pew Research Center 2013: 98-99). However, rates of intermarriage among Chinese immigrants and their descendants are relatively high: 35 percent of Chinese American marriages between 2008 and 2010 were to non-Chinese (Ibidem: 106), compared to 14 percent of Indian Americans, only 9 percent of whites, 17 percent of blacks, and 26 percent of Hispanics (Wang 2012).
5. Institutional Framework for Integration in the United States
Integration policy in the United States is very decentralized, enabling a number of state, local, and civil society actors to play a role in providing services to new arrivals. Many traditional receiving states and destination cities have their own integration offices to coordinate integration services like naturalization assistance, English language tuition, and social services at the local level. In many cases, states and cities will fund civil society actors like nonprofits to provide services in the community. This enables many diaspora-based organizations to be actively involved in integrating new arrivals to their community. Therefore, while the Indian and Chinese governments are not heavily involved with integration of their nationals at arrival in the destination country, they try to build and maintain close ties with their overseas population through dedicated diaspora offices and outreach efforts, which might affect integration trajectories.
5.1 India and China’s Emigration and Diaspora Policies and Institutional Frameworks
In general, China and India’s emigration and diaspora policies do not have much overlap with US integration policy; though organizations run by their diaspora play an important role in helping to successfully integrate Chinese and Indian immigrants and their descendants. Both China and India court their skilled overseas nationals and their descendants to encourage them to contribute to their country of heritage – whether through their temporary or permanent return, remittance flows, investments, or sharing their skills, knowledge and networks. These programs encourage immigrants
(Contd.)
headed Hong Kong immigrants were more likely to earn over $90,000 (42 percent, compared to 34 percent), and over $140,000 (25 percent, compared to 17 percent). However, significantly more of the Hong Kong population was working age (18-64) compared with the mainland China population: 89 percent, compared with 75 percent. (Of the mainland Chinese immigrants, 8 percent was under 18, and 17 percent was over the age of 65.) Additionally, the Hong Kong population had, on average, been living in the United States for longer (with more time to build up their US earning power): 80 percent of immigrants from Hong Kong arrived before 2000, compared with 57 percent of immigrants from mainland China.
to maintain close political and economic ties with their country of origin while overseas, viewing their success overseas as a way to facilitate development at home.
I. India
India first established a dedicated ministry for its diaspora in 1977, which now operates as the Ministry of Overseas Indian Affairs (MOIA). MOIA tries to build links with India’s diaspora; though its efforts often center on encouraging diaspora members to invest in and contribute to the homeland, rather than promoting integration at destination. However, MOIA recently set up an Overseas Indian Centre (OIC) in India’s embassy in Washington DC – partly to attract diaspora investment in India, and partly to work with Indian diaspora organizations to gather information on the US Indian diaspora and work towards providing integration services. Though the consulate already provides legal and medical assistance where necessary, the goal of the initiative is to set up an Overseas Workers Resource Centre (OWRC) and an Indian Community Welfare Fund for Indian nationals in the United States.36
MOIA also runs an array of cultural activities geared towards its overseas nationals, like celebrating Pravasi Bharatiya Divas (PBD) each January to honor the diaspora’s contributions to India.37 These celebrations are held in India and overseas, with awards given to notable overseas nationals.38 MOIA also offers scholarship and temporary visit programs to India for Indian diaspora members born overseas.
India – like China – does not recognize dual citizenship; and overseas nationals cannot vote, run for elected office, or take up government employment in India. Despite this lack of formal participation in Indian politics, diaspora members have set up “overseas branches” of Indian political parties like the Indian National Overseas Congress of America and the Friends of Bharatiya Janata Party (Migration Policy Institute 2014). The INOC lobbies on behalf of nonresident Indians (NRIs) in India, promoting “secular, democratic” values, and conceptualizes its role as “goodwill ambassadors” between the United States and India.39
II. China
Shifts in China’s policy towards emigration have made it much easier for Chinese nationals to migrate, and to maintain ties with their country of origin after migrating. Up until 1978, emigration was by-and–large prohibited – particularly to western countries like the United States. Though the decision to open up the Chinese economy in 1978 led to greater freedom of movement, with China founding the Overseas Chinese Affairs Office (SCOCAO) that year, many still frowned upon emigration. Incremental reforms since the 1990s mean that (wealthy) Chinese nationals can now easily emigrate overseas for work or study, without facing criticism from the state and with many options available for temporary or permanent return to China (Zweig 2006: 187-194). The Chinese diaspora is a significant source of foreign direct investment (FDI) for China: they were first to take advantage of China’s open-door policy, and provided more than half of the total FDI in China during the 1990s (Coe 2007: 8-9). In 2001, the Chinese government shifted from a policy that called on overseas Chinese to “return and serve the nation” (hui guo fuwu) towards a call for them to “serve the nation” (wei guo fuwu) through temporary return, intermediary services overseas, holding concurrent positions in China and overseas, or setting up enterprises in China (Zweig, Fung, and Han 2008: 10-11).
36
See: http://moia.gov.in/services.aspx?ID1=329&id=m1&idp=290&mainid=221 [Accessed 25 September 2014].
37 See: http://moia.gov.in/services.aspx?id1=25&id=m1&idp=25&mainid=23 [Accessed 23 October 2014]. 38 See: http://moia.gov.in/services.aspx?ID1=446&id=m1&idp=25&mainid=23 [Accessed 23 October 2014]. 39
A Comparative Analysis of the Migration and Integration of Indian and Chinese Immigrants in the United States
INTERACT RR2014/32 © 2014EUI, RSCAS 21
China now has a number of national- and regional-level programs and initiatives to build relations with its diaspora. The Chinese government has set up a number of organizations overseas, designed to maintain close ties with its nationals studying or working overseas. For example, it authorized officials in embassies and consulates of 38 major destination countries for Chinese students to set up more than 2,000 overseas students associations and 300 professional associations by 2006 (Zweig 2006). There are chapters of the Chinese Students and Scholars Association in colleges across the United States.40 These provide newly-arrived Chinese nationals with ties to home and opportunities to network with other Chinese nationals, while simultaneously building overseas networks for China and enabling Chinese cities and/or companies to recruit overseas Chinese talent for jobs, temporary placements, or business opportunities back home.
Chinese nationals cannot hold dual citizenship, and children born to Chinese nationals overseas who have “settled” in another country (permanent residence or naturalization) do not qualify as Chinese nationals. Chinese nationals can only vote or stand for (below county-level) election if they physically return to China (Liu and Du 2014). However, Chinese Americans remain politically involved in their country of heritage, and have set up political advocacy organizations in the United States that promote improved relations with China. The US government’s decision to grant China most favored nation status in the mid-1990s followed some 250,000 actions taken by 28 US-based Chinese associations to try and promote US-Chinese relations (Wang 1999: 305 cited in Barabantseva 2005: 24).
5.2 US Integration Policy Framework
The United States is home to more international migrants than any other country in the world, and the vast majority of people in the United States have immigrant roots. Despite being a self-described “nation of immigrants,” the country lacks a comprehensive immigrant integration policy at the federal level, with the exception of its refugee and asylee program which the federal government funds and coordinates before it is then implemented by state, local, or civil society actors. This means that in practice (a) many of the integration services that immigrants benefit from are mainstream programs that are open to the general public as well as to immigrants, and (b) integration services are provided by a wide array of state- and non-state actors, often in partnership with each other.
The US federal government provides funding for English language learning – English for Speakers of Other Languages (ESOL), for adults, and English Language for Learners (ELL) for children in schools, as part of the public education system. However, these services are underfunded, particularly in destination cities like New York and Los Angeles that struggle to meet demand for English language tuition (McHugh, Gelatt, and Fix 2007: 16). Social welfare policies introduced in 1996 limit the access of legal immigrants to safety net benefits related to health, nutrition, and cash support, which may undermine integration efforts. Some states – like California and New York – subsequently reinstated access to these benefits for legal immigrants, using state funding; others – like Florida – have not (Fix 2007: 17). Currently, 40 US states (plus the District of Columbia) supplement federal programs either by (a) using state funds to expand coverage, or (b) introducing state-only funded programs (Pew Charitable Trusts 2014). The latter option may include welfare for families (like New York’s Safety Net Assistance program), seniors and people with disabilities (like California’s Cash Assistance Program for Immigrants); health coverage (like Illinois’ reduced-cost health insurance coverage for all children from low-income families); and food stamps (like California’s CalFresh Food Assistance Program) (Ibidem).
State and local government generally take the lead in immigrant integration efforts – albeit often with federal funds – along with civil society organizations. These include Indian and Chinese diaspora organizations, which play an important role in helping new arrivals integrate into local communities,
40