UNIVERSITA’ DEGLI STUDI “ROMA TRE”
SCUOLA DOTTORALE IN GEOLOGIA DELL’AMBIENTE E DELLE RISORSE
(SDIGAR)
SEZIONE GEOLOGIA DELLE RISORSE NATURALI
- XXVIII CICLO-
N
EW INTEGRATED APPROACH TO ASSESS THERMAL
MATURITY OF SEDIMENTARY SUCCESSIONS BY MEANS
OF ORGANIC AND INORGANIC INDICATORS
PhD Candidate
Andrea Schito
Advisor: Prof. Sveva Corrado
Co-advisors : Prof. Claudia Romano
Dr. Aldega Luca
Dr. Domenico Grigo
Head of the Doctoral School:
Prof. Claudio Faccenna
i
TABLE OF CONTENT
ABSTRACT 1
CHAPTER 1 - Introduction 4
1.1 Aims and methodologies 4
1.2 Evolution of this study 5
1.3 Outline of the thesis 7
CHAPTER 2 - Methodologies 9
2.1. Kerogen characterization 9
2.1.1 Pyrolysis Rock Eval and TOC 11
2.1.2 Organic Petrography 13
2.1.2.1 Samples preparation 14
2.1.2.2 Analysis in reflected light and reflectance measurements 15
2.1.2.2.1 Vitrinite reflectance 16
2.1.2.2.2 Paleozoic organoclast 17
2.1.2.2.3 Graptolites 19
2.1.2.3 OM analysis in transmitted light 23
2.1.3 Infrared (IR) spectroscopy 24
2.1.3.1 Theory 24
2.1.3.2 Fourier transform infrared spectroscopy (FT-IR) analysis for dispersed organic matter 24
2.1.4 Raman spectroscopy analysis 27
2.1.4.1 Theory 27
2.1.4.2 The Raman Spectrometer 28
2.1.4.3 Band assignment for Raman spectra in dispersed organic matter 29
2.2 Inorganic fraction of sediments 33
2.2.1 X-Ray Diffraction of clay minerals 33
2.2.1.1 Samples preparation 33
2.2.1.2 Thermal maturity interpretation 36
2.2.2 Low temperature thermochronology 38
2.2.2.1 Theory 38
2.2.1.2 Samples preparation and Apatite (U-Th)/He dating 40
ii
CHAPTER 3 -
Overcoming pitfalls in the assessment of thermal maturity in fan-delta
systems: the case history of the Lower Congo Basin
443.1 Introduction 44
3.2 Geological setting 45
3.2.1 Western Africa offshore: from rifting to passive margin evolution 45
3.2.2 Stratigraphic evolution of the Lower Congo Basin 46
3.3 Materials 48
3.4 Results 48
3.4.1 Organic matter optical analyses 48
3.4.2 Mineralogical data 49
3.4.2.1 Whole rock and clay mineral content 49
3.4.2.2 Stacking order and illite content in mixed layers illite-smectite 52
3.4. 3 Thermal modelling 52
3.4.3.1 Pressure and temperature data 52
3.4.3.2 Patterns of organic matter maturation and smectite illitization 54
3.5 Discussion 56
3.6 Conclusion 60
CHAPTER 4 - Thermal evolution of Mesozoic-Cenozoic successions of the Carpathian orogenic system (central sector - Ukraine) 62
4.1 Introduction 62
4.2 Geological setting 62
4.2.1 Carpathians Orogenic system and Ukraine Outer Carpathians 62
4.3 Sampling and Materials 64
4.4 Results 66
4.4.1 Pyrolysis Rock Eval 66
4.4.2 Organic petrography and vitrinite reflectance 67
4.4.3 Thermal modelling 68
4.5 Discussions 71
4.5.1 Implication in HC generation 71
4.5.2 Implication in Carpathians thermal history 75
4.6 Conclusions 76
CHAPTER 5 - Modelling thermal maturity evolution of Paleozoic successions in the Holy Cross Mts (Poland) by means of new and old datasets of indicators of temperature exposure 78
iii
5.2 Geological setting 80
5.2.1 Stratigraphy 80
5.2.2 Tectonic setting 83
5.2.3 Previous thermal maturity data collection and interpolation 84
5.2.3.1 Cambrian –Ordovician 84
5.2.3.2 Silurian 85
5.2.3.3 Devonian 85
5.3 Materials 87
5.4 Results 89
5.4.1 TOC and Pyrolysis Rock-Eval 89
5.4.2 Clay mineralogy data 91
5.4.3 Analysis on the Organic matter: Raman spectroscopy and Graptolites and vitrinite Reflectance data 93
5.4.4 Burial and thermal modeling 97
5.5 Discussion 99
5.5.1 Source rocks evaluation by Pyrolysis Rock Eval 101
5.5.2 Thermal maturity assessment 101
5.5.3 Paleographic implication 103
5.6 Conclusion 103
CHAPTER 6 - Burial and exhumation of the western border of the Ukrainian Shield 105
6.1 Introduction 105
6.2 Geological Setting 106
6.3 Materials 107
6.4 Results 108
6.4.1 Clay mineralogy 108
6.4.2 Organic matter reflectance data 110
6.4.3 Thermochronology 110
6.4.4 Burial modelling 112
6.5 Discussion 115
6.5.1 Maximum Burial estimate 115
6.5.2 The Late Triassic-Early Jurassic exhumation 116
6.6 Conclusions 118
CHAPTER 7 - Characterization of dispersed organic matter in Oligocene to Upper Miocene drilled successions in the Lower Congo Basin (offshore Angola) 120
iv
7.2. Results 120
7.2.1 KBr-FTIR analyses on bulk kerogen LIRA 120
7.3 Discussions 124
7.4 Conclusions 127
CHAPTER 8- Raman spectrosopy characterization of dispersed organic matter at low diagenetic stages 129
8.1. Introduction 129
8.2. Material and methods 131
8.2.1 Source rocks and kerogen 131
8.2.2 Curve fitting 132
8.2.3 Raman thermal maturity parameters 133
8.3 Raman analyses results for differents materials and case histories 134
8.3.1 Raman analyses on powder of bulk kerogen 134
8.3.1.1 Malembo Formation – Lower Congo Basin (age: Tertiary) (LIRA) 134
8.3.1.2 Carpathians fold and thrust belt (Age: Mesozoic and Cenozoic)(PL) 143
8.3.1.3 Holy Cross Mts.(HCM) and Podolia region (PO) (age: Paleozoic) 146
8.3.2 Micro-Raman on polished sections on different kinds of macerals 150
8.3.2.1Micro-Raman on vitrinite in Carpathians fold and thrust belt (Age: Mesozoic and Cenozoic) 150
8.3.2.2 Micro-Raman analyses on polished sections on Paleozoic graptolites from Holy Cross Mountains (age: Paleozoic) 153
8.3.3 Final correlation against Raman parameters and Ro% or Ro% equivalent 157
8.4 Discussions on Raman parameters variations 160
8.4.1 Distance between D and G bands 161
8.4.2 Full Width at Half Maximum of the G band 162
5.4.3 Area and width ratio parameters (D/G area, RA2, D/G width) 164
8.5 Conclusion 166
CHAPTER 9 Conclusion 170
v
“O Tempo pergunta ao tempo quanto tempo o tempo tem, o Tempo responde ao tempo que o tempo tem tanto tempo quanto tempo o tempo tem. Mas o tempo não para, eu ja dei volta ao mundo, toquei berimbau
e o tempo não para... ”
vi
Acknowledgements
First of all, I would like to express my gratitude to my supervisor, Prof. Sveva Corrado, whose every day enthusiasm, inspiration and constant support, allows me to develop this research project. I thank her, for her teaching, precious advices and for solving my problems with patience and always with a smile.
I’m extremely indebted to Dott. Luca Aldega, without his help, support and precious advices this work would not have been possible. He help me all the times and teach me with patience and great competence how to use in basin analysis clay mineralogical tools.
Prof. Claudia Romano and Dott. Domenico Grigo are greatly acknowledged for their help. Prof. Romano for introduce me to lab work in Raman analyses and Dott. Grigo to Petroleum System Modelling.
I am greatly indebted with the Italian Society of Hydrocarbons Exploration and Production, ENI, for
providing me great part of the materials studied in this Thesis, with special regard to cuttings of a well drilled in the Lower Congo Basin and for financing the field trips that allowed us to sample in Ukraine and Poland. Furthermore I wish to thank ENI also for the past and future permission to publish most of the results achieved by my work in collaboration with ENI personnel.
Lea di Paolo, Chiara Caricchi, Roberta Maffucci, Danilo Di Genova and Alessandro Vona have been a great working team that supported me during each phase of my work. Thanks to all.
I am thankful to the Istitute of Earth Sciences of the University of Porto, to Dr. Alexandra Guedes and Dr. Bruno Valentim for the facilities given for conducting the research on organic matter by means of Raman and organic petrography analyses during my period of study in Portugal. Further thanks are due to Dr. Alexandra Guedes for the stimulating review she made of my Thesis.
Thanks also to the further two reviewers of my work, Prof. Stefano Mazzoli and Dr. William Sassi for their helpful and positively critical reviews.
Thanks are also due to Prof. Massimiliano Zattin, Dr. Benedetta Andreucci and Dr. Ada Castelluccio for proving me with thermochronological data produced in Padua Laboratories, for the discussions on the burial and exhumation history on the Podolia region and for their help during the field trip in the Holy Cross Mountains.
Special thanks are also due to Rafal Szaniawski and Leszek Jankowski for their help and hospitality during the fieldwork in Ukraine and Poland..
vii
I’m thankful to Aida Conte and Laura Medeghin from CNR for the help given in performing FT-IR analyses on the organic matter c/o IGAG-CNR laboratories.
Donato Barbieri and Javier Cuadros are kindly acknowledged for stimulating discussions on organic matter and smectite-illitization thermal evolution.
In these years I worked rounded by people that gave me always the good mood. Gabriele, Riccardo and Martina, first of all. Don’t worry my friends, everything will be alright.
Special thanks to “my generation crew”, Mario, Giulia, Ines, Giorgia, Andrea, Antonio, Chiara, the new entry Ileana and also to Gabriele, Marco, Francesco, Stefano, Matteo, Silvia, Gaia and all PhD students. All good people, I’ve been lucky to study and spend my time with you all.
My friends in Rome, my classmates Giuseppe, Federica, Stefania, Michele, Mirko, Giansandro, Arianna and my cousins Ilaria, Sara, Roberta and Marta have been my first support since I live here in Roma. And then Marco, Valentina, Paola, Memè, Enrico,Maria, Mariassunta, Eddy gave me the best company during these years.
Great thanks to my best friends, that are far but always with me, Marco, Alessandro, Francesco, Ferran and all the Spanish, the Portuguese and Leccesi.
My parents, you are the first to thank. You supported me during this time, you’ll support me always. My grandmother, thank you for thinking to me all the time and to remember me what is really important in life.
Marco and Diletta, my little brothers, thank you for staying with me.
And finally, thanks to you, my “pekeña educadora especial” for sustain me every day and share your life with me.
4
CHAPTER 1
Introduction
1.1 Aim and Methodologies
Sedimentary basins are defined as ‘regions of prolonged subsidence on the Earth surface’ (Bally and Snelson, 1980). They are classified in terms of the type of lithospheric substratum, their position with respect to the plate boundaries and the type of motion nearest to the basin (Miall, 2013).
The driving mechanism of subsidence are intimately related to the motion of the slab within the lithosphere and to the convection flow of the underlying mantle. Furthermore variation in the nature and amount of sediment supply is also strongly connected with the processes acting on the surface (e.g. sea level and climate and environmental change changes).
Therefore investigate the evolution of sedimentary basins is a key argument in many field of geological investigation such as sedimentary and structural geology, geodynamics and geomorphology.
Evaluating the subsidence is crucial also for the exploration of fossil resource, whose occurrence approximately corresponds to the location of sedimentary accumulation greater than about 1 km thick (Allen and Allen, 2013).
One of the main ways for evaluation of basin subsidence is the assessment of the thermal maturity of the sedimentary successions. During subsidence, in fact, sediments are gradually subjected to higher temperatures and pressures that can be recorded by a series of thermal indices obtained from the analyses on either the dispersed organic matter (OM) or minerals (e.g., fission tracks He dating or clay mineralogy). In hydrocarbon (HC) exploration, the reliable assessment of thermal maturity of sedimentary successions is a key topic for the quantitative evaluation of hydrocarbons generation/expulsion and more in general for basin analyses studies. In particular, uncertainties in thermal maturity assessment, linked to input data to calibrate thermal modelling, can negatively influence decisions on the development of HC prospects.
Vitrinite reflectance is by far the better calibrating indicator of thermal maximum exposure and was adopted since the ’50 as a measure of thermal maturity for organic matter dispersed in sediments. Nevertheless several problems linked to its application on dispersed organic matter still exist, especially when exploring targets that are devoid of vitrinite and/or are poor in organic matter, such those in Lower Paleozoic successions. Moreover, other several pitfalls exist (see Cardott, 2013 for a review), related to organic matter complexity (Petersen et al., 2009), such as identification of indigenous vitrinite in dispersed organic matter (DOM), or related to high hyrdrogen content in the whole organic matter (Petersen and Rosenberg, 1998), or due to the effect of overpressure (Carr, 1999; McTavish, 1978).
In order to overcome these problems in vitrinite reflectance application, in this thesis we tested a multi-method approach to assess thermal maturity in sedimentary basins based on thermal indicators carried out from a series of analyses on both the organic and the inorganic fraction of sediments and their modelling.
5
The inorganic fraction has been analysed by means of: 1) X-Ray Diffractions of fine grained fraction of sediments and 2) low-temperature thermochronology. Organic matter dispersed in sediments have been analysed by means of: 1) organic petrography; 2) pyrolysis Rock Eval; and 3) spectroscopy (FT-IR and Raman). Raman spectroscopy, in particular, is a novel technique to study the composition and thermal evolution of the organic matter in a range of temperature typical of the metamorphism (200–700°C). But its application to lower temperatures, typical of hydrocarbons generation/expulsion windows, has not been yet explored with the production of robust datesets of parameters and satisfactory correlations with other thermal indicators (first of all vitrinite reflectance).
We present four case histories: two pertain to Mesozoic and Cenozoic successions and two to Paleozoic successions.
In detail, analyses and their interpretation through modelling were performed on:
1) 33 cuttings from an Oligocene to Upper Miocene succession drilled in the Lower Congo Basin in the offshore of Angola (chapter 3);
2) 19 samples from Lower Cretaceous-Miocene sections, collected in the Outer Carpathians fold and thrust belt (Ukraine) (chapter 4);
3) 30 samples form the Cambrian to Devonian succession outcropping in the Holy Cross Mountains (Poland) (chapter 5);
4) 18 samples from the Ordovician to Devonian succession collected in the Carpathians foreland (Podolia region, Ukraine) (chapter 6).
Each of these case histories shows some of the before mentioned limitations related to vitrinite reflectance: in particular, the absence of vitrinite in the dispersed organic fraction of sediments in Lower Paleozoic rocks, the scarce reliability of measured vitrinite reflectance values in highly complex organic facies or overpressured sections and even the almost totally absence of organic matter dispersed in sediments.
Thus reliable thermal maturity was assessed though the critical application of other methods and their possible correlations and use for calibrating thermal models.
Results allowed to define new scenarios for the burial and thermal history of sedimentary successions representative of each case history, for HC generation/expulsion and tectonic evolution of the studied areas. Finally a new promising geothermometer in diagenesis based on Raman spectroscopy on organic matter has been proposed on the base of a robust dataset of highly variable organic matter content.
1.2 Evolution of this study
The first months of the first year were spent reviewing the existing literature on the different techniques for thermal maturity assessment. In particular a careful bibliography research was dedicate to the application of Raman spectroscopy in the characterization of organic matter in sedimentary rocks and coals. At the same time the preparation of samples for laboratory analyses started: this consisted in preparation of plugs for optical analyses, samples for XRD analyses on bulk rocks and <2 µm grain size fraction and kerogen concentration for FT-IR and Raman spectroscopy.
6
Analyses started from the samples of the Carpathian fold and thrust belt (PL) and of the Podolia region (PO) that were collected in a field trip a few months before the beginning of the PhD period. In addition Pyrolysis Rock Eval data (produced in ENI’s laboratories) were also collected for these two dataset. Before the end of the first year, analyses on these sets of samples were fully perfomed and preliminary interpreted. In the Podolia area, pyrolysis data were discarded because of the scarcity of organic matter. Whereas optical and mineralogical data obtained were used to perform a burial/thermal model, in collaboration with Dr. Benedetta Andreucci and Prof. Massimiano Zattin from the University of Padua that provided thermochronological data (apatite fission tracks and He dating on apatites) on the same dataset we adopted. For the Carpathian fold-and-thrust belt, analyses on the organic matter of samples PL revealed a very complex macerals composition and in particular FT-IR analyses on bulk kerogen of this samples were discarded.
Because of the scarcity of the organic matter found in Paleozoic samples from Podolia, a new area in which Paleozoic sedimentary successions crops out in northern Europe was identified in the Holy Cross Mountains (Poland) and a field trip was organized at the end of June 2012 (HCM samples).
In the first months of the second year, HCM samples have been prepared and analysed by means of optical and mineralogical analyses and thermal models were performed.
Subsequently FT-IR and Raman spectroscopy and mineralogical analyses were perfomed on the whole set of samples coming from the offshore Angolan well. FT-IR data provided good insight on the OM composition and mineralogical results were used to calibrate a thermal model using the kinetic equation of smectite illitization provided by Cuadros et al., (2006). The comparison of this model to optical analyses that had been previously performed by ENI laboratories led to unravel correctly the thermal evolution of the succession drilled in the Angolan well. The calculated thermal maturities for each depth were then correlated to parameters obtained by Raman spectroscopic analyses.
The last four months of the second year were spent at the IES laboratory at the Department of Sciences of the University of Porto (Portugal), as a visiting scholar. Here samples collected in the Carpathians and in the Holy Cross Mountains were analysed by means of optical observation and Raman spectroscopy in collaboration with Dr Alexandra Guedes and Dr Bruno Valentim.
The third year was spent comparing thermal maturity data collected with those carried out from Raman spectroscopy and studying the existing literature on the band assignment of carbon materials (e.g. graphite, coal, disordered graphite, anthracite, graphene, fullurene, carbon nanotubes) in order to explain the correlations found between thermal evolution and changes in the Raman spectra of kerogen. In addition also a thermal models of the sector of the Carpthians fold and thrust belt was developed.
Throughout the duration of this study, poster presentations were given at national and international conferences:
1) Riunione annuale Gruppo Informale Geologia Strutturale, October 2013, Milan 2) Petroleum Geoscience Research Collaboration Showcase, November 2014, London 3) AAPG Europe Region Conference, May 2015, Lisbon.
7
1.3 Outline of the thesis
Chapter 1 presents a general introduction with main aims of the work,the methodologies used and evolution of this research (Fig. 1.1).
It briefly describes the importance of thermal maturity studies and their implication in geological studies and hydrocarbon exploration. In addition describes some of the main problems that can be encountered with the best known calibrating indicator of thermal maximum exposure in sedimentary rocks (e.g. vitrinite reflectance).
Chapter 2 introduces theoretical aspects and analytical procedures of the applied methodologies.
Chapter 3 describes the approach to the assessment of the thermal maturity profile in the Angolan well in the Lower Congo Basin. It outlined the pitfalls found in vitrinite reflectance profile and how to overcome them with the use of indicators from clay mineralogy analyses.
Chapter 4 focusses on the thermal evolution and characterization of source rocks in a sector of the Charpatian fold and thrust belt assessed by means of optical analyses and pyrolysis Rock Eval.
Chapter 5 deals with the thermal evolution of the Holy Cross Mountains. In this chapter we describe the quality of the Paleozoic source rocks in the area and unravel the thermal evolution of the two tectonic blocks in which the Holy Cross Mts are geologically organised by means of optical analyses on Paleozoic organoclasts and clay mineralogy and their modelling. In addition we constrain the maturity of Cambrian organic matter using Raman spectroscopy.
Chapter 6 presents the thermal evolution of the Podolia area constrained by mineralogical indixes and thermos-chronological data.
In Chapter 7 we analysed the organic matter of the each depth interval of the Angolan well using FT-IR spectroscopy thermal parameters. These analyses were performed to understand whether the maturation of the OM followed the maturation patter outlined by clay mineralogy assessed in Chapter 3.
Chapter 8 we present the correlation between thermal maturity (expressed as vitrinite reflectance) and parameters obtained from Raman investigation. In the last part of this chapter we provide an articulated discussion on the observed variations in the Raman spectra according to the existing literature that deal with Raman analyses on kerogen or more in general with carbon materials.
In Chapter 9 we draw the general conclusions of this work on the base of the main results obtained in the four case histories with the proposed multi-method approach.
8
9
Chapter 2
Methodologies
In this Chapter the methodologies used in this work to study the thermal evolution of the sampled sedimentary successions.are described
In detail the Chapter begins with a general introduction on kerogen and its classification, followed by a description of the main methods adopted in this work, the sample preparation and the characteristics of the instruments.
2.1 Kerogen characterization
Most organic matter (OM) in rocks represents the solid, usually dark coloured, remains of plants or animals which lived at the time of deposition (Taylor et al., 1998). Many rocks contain only a little amount of OM, while others, such as coals, are made up almost totally of organic matter.
At the time of deposition the organic matter dispersed in sediment is composed of a mixture of organic compounds of various origin and composition. In particular, aquatic organisms contribute mainly proteins, lipids and carbohydrates while higher plants contribute resins, waxes, lignins and carbohydrates in the form of cellulose (Barnes et al., 1990). These basic chemical constituent or their hydrolysis product (amino acids, long-chain fatty acids and sugar) are mostly microbially degraded in the water column and in the upper part of the sedimentary column. The principal processes involving the degradation of OM are aerobic respiration , bacterial sulphate reduction and methanogenesis as well as the reduction of manganes oxides, nitrates and iron oxides (Henrichs, 1993). An exception to this rules is lignin, a complex, partly aromatic macromolecule, concentrated in the inner cells walls of vascular plants, that can be hardly degraded by microorganisms with the exception of some aerobic fungi acting in the soil (Taylor et al., 1998).
OM that is not degraded in these processes is incorporated in sediments and the insoluble part of these materials is called kerogen (Durand, 1980). Starting from this point, further degradation will be primarily associated with temperature changes. In particular, it is usual to distinguish three zones that with increase in temperatures are called: diagenesis, catagenesis and metagensis. In these zones, kerogen progressively converts into hydrocarbons (primary oil in catagenesis and gas in metagenesis) leading to the formation of new constituent such as bitumen, pyrobitumen, exsudatinite or micrinite (Taylor et al., 1998).
A first kerogen classification can be made by the use of bulk parameters, such as the H/C and O/C atomic ratios, obtained from elemental analyses (Fig. 2.1). On the basis of these ratios, four types of kerogen have been defined which follow distinct diagenetic pathways.
Type I kerogen has high initial H/C and low O/C ratios. The source material is mainly algal, or a
combination of algal lipids and waxes from higher plants (Fig. 2.2). It forms part of the liptinite macerals in coal.
10
Type II kerogen has intermediate initial H/C and O/C ratios, and larger contributions by aromatic and carboxylic acid groups than type I kerogen. Ester bonds are abundant, as are medium-length aliphatic hydrocarbon chains and naphthenic rings. Both algal and higher plant sources appear to contribute to type II kerogens (liptinite macerals).
Figure 2.1 Van Krevelen diagram showing maturation pathways for Types I to IV kerogen as traced by changes in atomic H/C and O/C ratios. The progressively darker shaded areas approximately represent diagenesis, catagenesis, and metagenesis stages, respectively (from http://www.falw.vu/~rondeel/grondstof/oil/oil-total-web.html#_Toc531067567)
Type III kerogen has an initial H/C ratio less than 1, an initial O/C ratio of 0.2 to 0.3, and is derived dominantly from terrestrial plants. It consists mainly of aromatic groups formed from lignins and humic compounds, and represents the huminite/vitrinite fractions of coal petrography. Oxygen is present as carboxylic acids, ketones and ethers rather than in ester bonds.
Type IV kerogen has the H/C ratio less than 0.5 and contains mostly decomposed organic matter and highly oxidized material of various origins and represents the inertinite group (Fig.2.2).
A palynological classification on the base of transmitted light analysis for a rapid assessment of hydrocarbon potential can be performed according to Tyson (2012). This classification is primarily designed for routine
11
source rock 'kerogen typing' with the aim to identify the relative proportions of inert, gas-prone, oil-prone and very oil prone material within the total kerogen assemblage (Tyson, 2012).
In general, more detailed characterizations are needed, which can be performed by means of optical and chemical indicators related to the changes in kerogen composition. With increasing maturity, kerogen looses
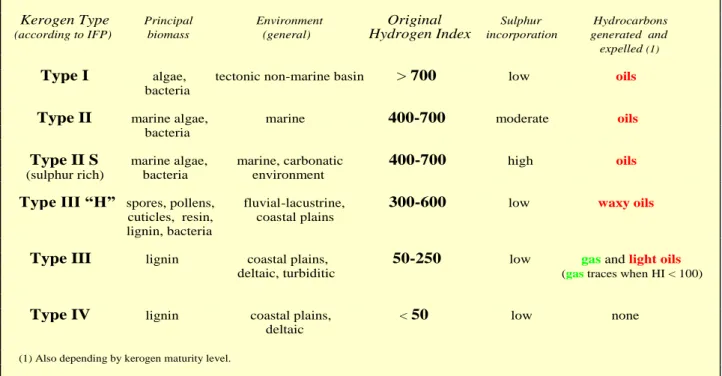
Figure 2.2 The main kerogen types, origin and pyrolysis indexes,from Scotti 2003
first preferentially O to produce CO2 and H2O, then H to produce hydrocarbons. Changes in the molecular
structure have effect in the:
1) maximum temperature of the S2 band registered by Pyrolysis Rock Eval (Tmax);
2) petrographic detection of the constituents that can be observed in reflected and transmitted light; 3) molecular changes reflected mainly in the decrease aliphatic chains with respect to aromatic rings
and changes in the spatial distribution of the aromatic rings. All these variations can be measured through Fourier Transform Infrared Spectroscopy (FT-IR) and Raman spectroscopy.
These are the thermal maturity indicators used in this work whose principles and applications will be discussed in the text below.
2.1.1 Pyrolysis Rock Eval and TOC
Pyrolysis Rock Eval and TOC measurements were perfumed at ENI laboratory (Milan-Italy) using: Rock Eval 6 equipment.
Total organic carbon (TOC) refers to the weight percent (wt %) of the organic carbon present in 100g of rock (Langford and Blanc-Valleron, 1990).
Kerogen Type Principal Environment Original Sulphur Hydrocarbons (according to IFP) biomass (general) Hydrogen Index incorporation generated and
expelled (1)
Type I algae, tectonic non-marine basin > 700 low oils
bacteria
Type II marine algae, marine 400-700 moderate oils
bacteria
Type II S marine algae, marine, carbonatic 400-700 high oils (sulphur rich) bacteria environment
Type III “H” spores, pollens, fluvial-lacustrine, 300-600 low waxy oils cuticles, resin, coastal plains
lignin, bacteria
Type III lignin coastal plains, 50-250 low gas and light oils deltaic, turbiditic (gas traces when HI < 100)
Type IV lignin coastal plains, < 50 low none deltaic
12
Total organic carbon is measured from 1g samples of pulverized rock that are combusted and converted to CO or CO2. According to Hunt et al. (2002) value of approximately 0.5% total organic carbon by weight
percent is considered the minimum for an effective source rock.
Pyrolysis is a widely used degradation technique that allows breaking a complex substance into fragments, by heating it under an inert gas atmosphere (Vandenbroucke, 2003).In this technique, a sample is firstly heated at 300°C and the free hydrocarbons are volatilized and measured as the S1 peak. In general a S1>1 mg/g may be indicative of oil.
Then the temperature is increased from 300° to 550°C (at 25°C/min) and leads to the volatilization of the very heavy hydrocarbons compounds as well as the cracking of no volatile organic matter. The
hydrocarbons released from this thermal cracking are measured as the S2 peak that, thus, is an indication of the quantity of hydrocarbons that the rock has the potential of producing, should burial and maturation continue.
The temperature at which S2 reaches its maximum, depends on the nature and maturity of the kerogen and is called Tmax. Tmax is directly related to the stage of maturation of the organic matter.
The CO2 issued from kerogen cracking is trapped in the 300°-390°C range. The trap is heated, and CO2 is
released and detected on a TCD during the cooling of the pyrolysis oven (S3peak) (Fig.2.3). This peak is an indication of the amount of oxygen in the kerogen and is used to calculate the oxygen index.
Figure 2.3 S1 and S2 peaks after Pyrolysis heating for samples with different starting thermal maturity
The type and maturity of organic matter in petroleum source rocks can be characterized from Rock Eval pyrolysis data using the following parameters:
HI = hydrogen index (HI = [100xS2]/TOC). HI is a parameter used to characterize the origin of organic matter. Marine organisms and algae, in general, are composed of lipid- and protein-rich organic matter,
13
where the ratio of H to C is higher than in the carbohydrate-rich constituents of land plants. HI typically ranges from ~100 to 600 in geological samples.
OI = oxygen index (OI = [100xS3]/TOC). OI is a parameter that correlates with the ratio of O to C, which is high for polysacharide-rich remains of land plants and inert organic material (residual organic matter) encountered as background in marine sediments. OI values range from near 0 to ~150.
PI = production index (PI = S1/[S1+ S2]). PI is used to characterize the evolution level of the organic matter.
2.1.2 Organic Petrography
OM in coals or dispersed in sedimentary rocks is usually highly heterogeneous firstly because it has various origins (from plant, plant organs and less commonly animals), and also because its components suffered modifications of various degree and in different ways before and after deposition (Taylor et al., 1998). The best way to describe the OM heterogeneity is using a light or, even more, an electron microscope. Through these techniques to classify qualitatively and quantitatively the component of the OM on the basis on their origin, nature and properties gets possible.
The base of this classification is the “maceral concept” that, according to Taylor et al. (1998), defines macerals as the microscopically (through the use of light, especially reflected light, microscopy) recognized individual constituents of OM. The word ‘maceral’ referred to the selective oxidative treatment of OM used in paleobotany and are derived from the latin verb ‘macerare’ which means ‘to soften’.
Macerals represent , at least partly, the remains of plants whose form and/or structure have been preserved in coal and other rocks, while other macerals are degradation products which are so altered that their plant origin cannot be determined.
All macerals have the suffix ‘-inite’, and are classified into three main groups:
1) vitrinites: are coalification products of humic substances, which essentially originate from the lignin and cellulose of plants cell walls. They are characterized by high oxygen and aromatic fraction content;
2) liptinites: derive from relatively hydrogen-rich plant remains such as sporopollenin, resins, waxes and fats. It differs from vitrinite for a higher aliphatic (paraffin) fraction and a correspondingly higher hydrogen content;
3) inertinites: are characterized by relatively high carbon content, low hydrogen content and a much increased level of aromatization. Most inertinite have the same origin of vitrinite and liptinite but they experienced a different primary transformation due to various processes (e.g. charring, oxidation or fungal attack).
Vitrinite is the standard reference material for reflectance measurements for determining the level of organic maturation. This technique is well known and widely used as it provides consistent and reliable thermal maturity assessment with high resolution degree.
In the same sample, the three group can coexist but showing different reflectance values, as shown in the histograms in Figure 2.4.
14
Figure 2.4 – Microphotographs of different macerals at the same thermal maturity level. On the right, Reflectance random histograms, grey bins indicate the reflectance for the corresponding macerals on the left. Photos are taken from microscope with 50X magnification under oil immersion
To avoid as possible ambiguity among different macerals, the International Committee for Coal and Organic Petrology (ICCP) has established standard rules for petrographic microscopy which provide that the
description of macerals should be in terms of their appearance in reflected light using oil immersion objectives with 25-50X magnification.
Fluorescence microscopy can be seen as a complementary method of examination that can help to reveal details, not otherwise visible, of the internal make-up of macerals and some of their chemical and physical properties.
2.1.2.1 Samples preparation
Sample preparation was performed at the Academic Laboratory of Basin Analysis (ALBA) of “Roma Tre” University (Italy).
Analyses were performed on concentrated kerogen using acid attack and, on dispersed OM fragment in the bulk rocks and on organoclasts (e.g., graptolites) that protruded from the rocks. When analyses were performed on the bulk rock, samples were grounded in a mortar and were hand-picked under an optical microscope (Leica zoom 2000).
15
For optical analyses both bulk kerogen, bulk rock or graptolites were mounted on epoxy resin block (Serefiex resin +hardening with a 1:20 ratio – Fig. 2.5).
Samples were polished using an automated polishing system (Struers Labopol 5), 250, 500, 1000 carborundum papers and isopropanol lubricant. After washing samples in order to remove debris, three polishing laps were used with alumina powders of decreasing grain size (1.00, 0.30, 0.01 µm) and samples polished for a few minutes (Fig. 2.6).
Extraction of kerogen was performed at the Academic Laboratory of Basin Analysis (ALBA) of “Roma Tre” University (Italy) and in the laboratory of the Institute of Earth Sciences (IES) of Science Faculty of the
University of Porto (Portugal).
In this thesis kerogen was extracted using wet-chemical acid demineralization according to Robl and Davis (1993) and Schimmelmann et al. (1999). Samples were crushed using the mixer ball mill. Removal of carbonates was done adding HCl on the dried samples. The HCl was added in small increments to prevent excessive foaming. The acid digestion process was done at 50-60°C in a water bath to facilitate removal of carbonates.
The acid was removed with pipette and disposed in plastic containers with neutralizing limestone gravel under a fume hood. Digestion of inorganic matter was done by hydrofluoric acid (HF). For 5 g of powder sample a mixture of 50% distilled water and 50% HF was added (45 ml). Samples were placed on a shaker table for 2 hours at regular intervals. The samples were finally washed 5-6 times with distilled water.
2.1.2.2 Analysis in reflected light and reflectance measurements
Optical analyses were performed at the Academic Laboratory of Basin Analysis (ALBA) of “Roma Tre” University (Italy) for analyses of chapter 5 and 6, in the laboratory of the Institute of Earth Sciences (IES) of Science Faculty of the University of Porto (Portugal) for analyses of chapter 4 and at ENI’s laboratory (Milan- Italy) in the capther 3.
Figure 2.5 Extracted kerogen particles (on the left) and Kerogen embedded in epoxy resin block (on the right)
16
At ALBA laboratory we used a Zeiss Axioskop 40 A, equipped with a tungsten-halogen lamp (12V, 100w), an Epiplan-Neofluar 50x/1.0 oil objective, in incident filtered (λ = 546 nm) non-polarized light under oil immersion (n = 1.518) at about 23°C (Figure 2.7). The microscope is equipped with the MPS 200 detection system by J & M Analytik AG (web site: http://www.j-m.de).
Figure 2.7 Zeiss Axioskop 40 A microscope equipped with MPS detection system
On each sample measurements were performed on unaltered fragments. Mean reflectance values (Ro%) were calculated from the arithmetic mean of these measurements with a standard deviation, identifying the indigenous population.
Microphotographs of specimens fragments were taken using a microscope-mounted Canon Power Shot G6. In the IES laboratory measures were conducted on a reflected light Leitz microscope coupled to a Diskus-Fossil System, and oil immersion objectives. The reflectance measurements were made using a combined magnification of objective and oculars of 20 and 50×.
At ENI’s laboratory mean random vitrinite reflectance (Ro%) was measured on concentrated OM prepared using the traditional HF–HCl method (Robl and Davis, 1993). Samples were first mounted in epoxy resin and polished. Vitrinite reflectance analyses were then performed on randomly oriented grains using a Zeiss Axioplan MPM400 microscope equipped with J&M Analytik Tidas S 800 spectrometers CCD UV/NIR 2098. We used conventional microphotometric methods, under oil immersion (ʋ = 1.518) in reflected monochromatic non-polarized light (λ = 546 nm). Reflectance standards (Spinel Ro%=0.427 and 0.905) were used for calibration. In most cases a population of a few tens of readings per sample was collected on fragments only slightly fractured and/or altered (Borrego et al., 2006).
2.1.2.2.1 Vitrinite reflectance
Mean vitrinite reflectance (VRo%) is measured as the percentage of the incident light intensity which is reflected from the polished surface of vitrinite macerals fragments relative to a standard substance (e.g.,
17
glass, sapphire, etc.). This measurement uses immersion oil and is related to the refractive index and absorptive index of immersion oil and standards which follows the Fresnel-Beer equation:
Ro = (μ - μo) 2 + μ2k2/(μ + μo) 2 + μ2ko 2
where: μ, μo = refractive index of vitrinite and immersion oil, respectively; k, ko = absorption index of
vitrinite and immersion oil, respectively.
These indexes are wavelength dependent, thus a green monochromatic non-polarised light (λ = 546 nm) is chosen for Ro% measurements.
In diagenesis and in the first stages of catagenesis (Ro% <1.5), vitrinite is optically isotropic and the aromatic
clusters present in the organic structure have no preferred orientations. In metagenesis instead, vitrinite behaves like an anisotropic material because of the orientation of aromatic clusters (Oberlin et al., 1980). When tectonic stress affects the thermal maturity of sediments, vitrinite macerals can turn out to be biaxial (Levine and Davis, 1989) (Fig. 2.8).
Figure 2.8 - Increase of vitrinite reflectance (% Rmax, Rm and Rmin) with depth in the Münsterland I borehole (Germany) showing the increase of anisotropy (difference between Rmax and Rmin) with increasing depth and rank stage (from M. Teichmüller, 1982)
2.1.2.2.2 Paleozoic organoclast
Vitrinite is absent in Lower Palaeozoic rocks until the advent of significant terrestrial floras in Silurian times. However, marine organoclasts may abound in sequences that are devoid of vitrinite macerals. Thermal
18
maturation in these sequences can be acquired measuring reflectance on such organoclasts (e.g., scolecodonts, chitinozoans and graptolites) or on bitumen.
Furthermore alteration color semi-quantitative assessment in transmitted light on spores, conodonts and acritarchs may be coupled with reflectance analyses to provide a reliable evaluation of thermal maturity. Comparison between these two techniques underlines that quantitative reflected light analyses are generally more reliable than semi-quantitative ones in transmitted light (Tricker et al., 1992).
Reflectance analyses on marine organoclasts have been successfully used in regional maturation studies in lower Paleozoic successions (Bertrand, 1990a, b, 1991; Bertrand and Malo, 2001; Bertrand and Malo, 2012; Clausen and Teichmüller, 1982; Goodarzi, 1982; Goodarzi, 1984, 1985a, b; Goodarzi and Norford, 1985; Kurylowicz et al., 1976; Roy, 2004; Wilson et al., 2004).
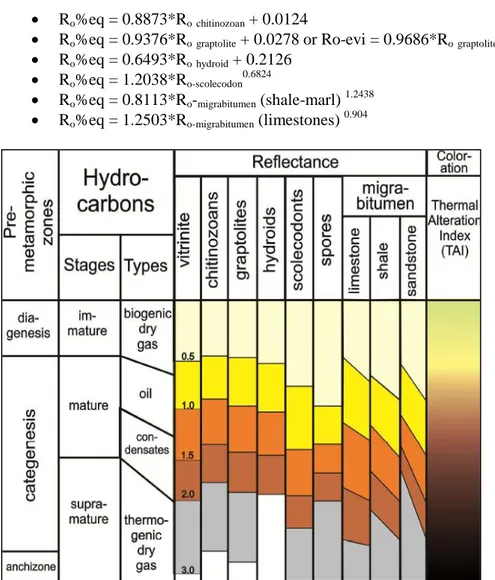
Reflectance values of organoclasts and bitumen can be converted into equivalent reflectance values of standard vitrinite using following equations, derived by Bertrand (1990, 1993), Bertrand and Malo (2001) and Tricker al. (1992) (Fig.2.9):
Ro%eq = 0.8873*Rochitinozoan + 0.0124
Ro%eq = 0.9376*Rograptolite + 0.0278 or Ro-evi = 0.9686*Rograptolite 0.9819
Ro%eq = 0.6493*Rohydroid + 0.2126
Ro%eq = 1.2038*Ro-scolecodon 0.6824
Ro%eq = 0.8113*Ro-migrabitumen (shale-marl) 1.2438
Ro%eq = 1.2503*Ro-migrabitumen (limestones) 0.904
Figure 2.9 Correlation reflectance scale among different kinds of organoclasts: vitrinite (collotelinite), chitinozoans, graptolites, hydroids and scolecodonts, spores and migrabitumen (as a function of lithology). Thermal Alteration Index scale is also reported. From Bertand and Malo, (2012)
19
In Chapters 5 and 6 we measured reflectance of all types of dispersed marine organoclasts and correlate measured reflectance values to the equivalent reflectance of the standard vitrinite using Bertrand and Malo’s equations (2012).
The analysed samples from pre-Devonian successions in our sets of samples generally contain vitrinite-like and graptolite fragments. In particular our analyses were focused on the latter groups because show a greater abundance and is more easily recognizable. The main features of the last cited group are briefly reviewed in the following paragraph on the base of the most recent literature.
2.1.2.2.3 Graptolites
Graptolites represent planktonic to epi-planktonic colonial animals that occur in Lower Paleozoic (Ordovician–Lower Devonian) marine sediments (Goodarzi, 1984, 1985b). The graptolite skeleton (periderm) is composed of a chitinous substance (Duran, 1980), or a collagen-like protein (Crowther and Rickards, 1977; Towe and Urbanek, 1972). During the increase in maturity, graptolites undergo similar molecular structural changes than vitrinite-huminite group macerals, for example an increase in aromaticity and ordering of aromatic carbon with increased thermal maturity (Cole, 1994; Goodarzi, 1984).
Graptolites generally exhibit optical properties in reflected light similar to that of vitrinite macerals (Goodarzi and Norford, 1987; Hoffknecht, 1991). For this reason measurements of the optical properties of graptolites may provide a valid alternative method for assessing the level of OM maturation of pre-Devonian sediments that are devoid of vitrinite (Bustin et al., 1989; Goodarzi, 1982).
The colours of graptolites, microscopically observed on polished surfaces, range from medium grey to light grey (Fig. 2.10). Distinct morphological features of graptolite fragments have been described in detail in a series of earlier studies (Hoffknecht, 1991; Link et al., 1990; Suchý et al., 2002; Teichmüller, 1978).
Suchy et al., (2002) analysed the Barrandian shales, cut perpendicular to bedding, observing that the most common features include graptolite cortical tissues, common canals, and/or layered walls of the periderms. If cortical tissues are thick enough, graptolites can be recognized by their finely laminated structure (Fig. 2.11).
Figure 2.10 Incident light photomicrographs on graptolites (from Cole, 1994)
20
Figure 2.11 Silurian shales. Sections perpendicular to bedding. A–D: Graptolite fragments [A—fragment of graptolite showing the periderm wall (P), common canal (CC), and an apartural spine (As). A section of the branching from the upper part of the common canal. B- Non-granular graptolite fragments of a colony of ‘‘rooted dendroids’’. C—Graptolite fragment displaying cortical laminated tissue. D—Transverse section of a graptolite stipe showing fusellar tissue which has the form of complete tubes. Some tubes were filled with brightly reflecting sulfide minerals. From Suchy et al., 2002
Graptolites show two types of textures under reflected light; a) non-granular fragments which appear hard, brittle and often show fine structural details, for example laminations, b) granular which is fine granular to reticular. The non-granular fragments show higher anisotropy than the granular fragments (Goodarzi 1984). Goodarzi and Norford (1985) described the morphology of a range of Canadian graptolites found in sedimentary rock: shales, marls, limestones, cherty lithotypes, also in weathered and heat affected rocks. They observed that graptolites in carbonates were granular (Fig. 2.12a) but those in shale were often non-granular (Fig. 2.12b).
Figure 2 a) Fragment with granular surface, lower Silurian argillaceous limestone, Cape Phillips Fm., Canadian Arctic. Plane polarized scale bar is 50 μm, b) Non-granular fragments, middle Ordovician shale, Glenogle Shales. British Columbia. Partially crossed polars. From Goodarzi and Norford (1985)
21
In a few cases, however, where optical properties of both graptolite types were measured in identical samples, the reflectance of the non-granular type was found to be systematically higher than those of the granular type (Goodarzi, 1984; Suchy et al., 2002) (Fig. 2.13).
Figure 2.3 Plot of non-granular versus granular graptolite reflectance. Note the almost perfect linear correlation between the two variables. From Goodarzi and Norford (1985)
Goodarzi (1984) and Goodarzi and Norford (1985), Goodarzi et al. (1985b) have compared the morphology of fragmentary graptolites to those of arcritarchs, bitumen, chitinozoans and sclecodonts. Graptolite fragments showed higher anisotropy than other dispersed organic material in the same sediments.
Optical properties of graptolites have been studied by Kurylowicz et al. (1976), Teichmüller (1978), Clausen and Teichmüller (1982), Goodarzi (1982, 1984, 1985b), Goodarzi and Norford (1985). Kurylowicz et al.(1976), Teichmüller (1978) and Clausen and Teichmüller (1982) have determined the reflectance and bi-reflectance of a range of graptolite. Kurylowicz et al. (1976) have examined graptolites found in some central Australian sediments (Ordovician- Devonian). The maximum range of reflectance in oil was 0.80-2.37% with bi-reflectance of 0.35-1.05. Teichmüller (1978) determined the reflectance of graptolite cortex found in the Ordovician of a borehole in NW-Germany (5.1-10.0% Rmax) as well as from graptolites found in boulders from the Baltic Sea (0.8% Rmax), from Brittany (1.7% Rmax), from Thuringia (8.2% Rmax) and from Spain (9.2% Rmax). Clausen and Teichmüller (1982) found that the maximum oil reflectance of graptolites from the borehole in NW Germany increases with depth. They also report reflectance values of a range of graptolites from Sweden. The Swedish graptolites had reflectances of 0.36-0.72% Rm, whereas the reflectances for graptolites from the borehole Soest-Erwitte 1/la ranged from 6.0- 0.5% Rmax. Goodarzi (1982, 1984) determined the reflectance and bireflectance of Turkish graptolites (Ordovician-Silurian) and found that the reflectance of graptolites increased with depth and also that graptolites had higher reflectance than natural bitumen or chitinozoans (Goodarzi 1984, 1985b). Furthermore, Goodarzi (1984) determined the dispersion of maximum and minimum oil reflectances of graptolites from Turkey parallel and perpendicular to bedding to determine the optical character of graptolites (Figure 2.14 and 2.15). Goodarzi (1985b) found
22
that the dispersion of oil reflectance of both granular and non-granular graptolite epiderm for sections both parallel and perpendicular to bedding increased with increasing wavelength, similar to anthracite. The granular graptolites appear to be softer, lower reflecting and show weaker anisotropy, whereas the non-granular graptolite fragments are hard and brittle, high reflecting and exhibit strong optical anisotropy. However, both the maximum reflectances and bi-reflectances of non-granular graptolites were higher than those of granular graptolites.
The relation between the granular and non-granular fragments is complex and different opinions exist (see Goodarzi and Norford, 1985; Link et al., 1990 for a review). Non-granular fragments may represent the remains of the graptolite exoskeleton, whereas the granular fragments may form parts of the soft body of the graptolite that once occupied the common canal (Goodarzi, 1984; Riediger et al., 1989). They may also represent the cortical tissue composing the outer layer of the periderm (Link et al., 1990).
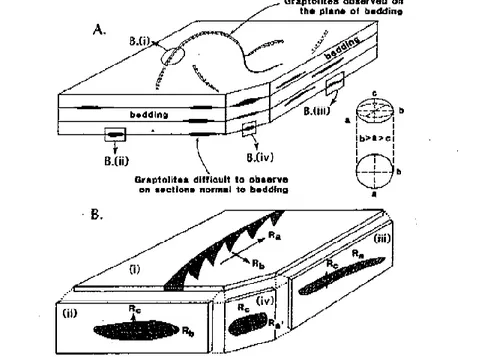
Figure 2.15 Principal reflectance axis of vitrinite A) graptolites are invariably observed on bedding planes because of their shape; B) Principal reflectance axis of biaxial indicating surface of graptolite shown in section cut parallel and perpendicular to the bedding. Ra= Ro max Rb= Ro intermediate Rc=Ro minimum (Bustin et al., 1999).
Figure 2.4 Dispersion curve of maximum and minimum oil reflectance for nongranular (NG) and granular (G) graptolite fragments. Redrawn after Goodarzi, 1984
23
Graptolites settled on the sea bottom with their largest dimension horizontal and, therefore, the largest surface areas for the determination of optical properties are often present in sections parallel to bedding. In this orientation graptolites show true maximum reflectance, while the true minimum reflectance and the strongest bi-reflectance are observed on sections perpendicular to bedding (Goodarzi and Norford, 1989; Hoffknecht,1991; Suchy et al., 2002).
2.1.2.3 OM analysis in transmitted light
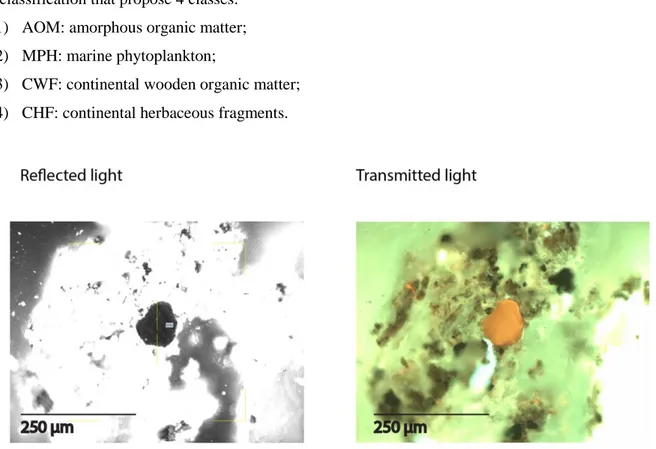
Another approach to the study of OM in sedimentary rocks is the use of microscope in transmitted light using kerogen concentrate (Teichmüller, 1986) whose advantage is a better identification of palynomorphs with respect to the incident light techniques. In particular the use of fluorescence-light techniques allows liptinite occurrences to be distinguished from the less fluorescent component of kerogen, and the individual liptinite macerals to be differentiated one from another (Fig. 2.16). Applied to hydrocarbon exploration transmitted light analysis has the advantage to estimate directly all factors which are decisive for oil and gas proneness like type, abundance distribution and substance.
This analysis has been used in Chapter 3 to quantitatively assess the kerogen composition according to the ENI classification that propose 4 classes:
1) AOM: amorphous organic matter; 2) MPH: marine phytoplankton;
3) CWF: continental wooden organic matter; 4) CHF: continental herbaceous fragments.
Figure 2.6 Two microphotographs showing the same liptinite fragment observed under: a) reflected light and b) transmitted light
24 2.1.3 Infrared (IR) spectroscopy
2.1.3.1 Theory
Infrared refers to that part of the electromagnetic spectrum between the visible and microwave regions. In IR spectroscopy, an organic molecule is exposed to infrared radiation. When the radiant energy matches the energy of a specific molecular vibration, absorption occurs.
The bond of a molecule experiences various types of vibrations and rotations. This causes the atom not to be stationary and to fluctuate continuously. Vibrational motions are defined by stretching and bending modes. These movements are easily defined for diatomic or triatomic molecules. This is not the case for large molecules due to several vibrational motions and interactions that will be experienced. When there is a continuous change in the interatomic distance along the axis of the bond between two atoms, this process is known as a stretching vibration. A change in the angle occurring between two bonds is known as a bending vibration. Four bending vibrations exist namely, wagging, twisting, rocking and scissoring (Fig.2.17).
For a molecule to show infrared absorptions, it must possess a specific feature, i.e. an electric dipole moment of the molecule must change during the vibration. This is the selection rule for infrared spectroscopy. The dipole moment is determined by the magnitude of the charge difference and the distance between the two centers of charge. As the molecule vibrates, there is a fluctuation in its dipole moment; this causes a field that interacts with the electric field associated with radiation. If there is a match in frequency of the radiation and the natural vibration of the molecule, absorption occurs and this alters the amplitude of the molecular vibration.
IR spectroscopy is a great method for identification of compounds, especially for identification of functional groups. Therefore, we can use group frequencies for structural analysis. Group frequencies are vibrations that are associated with certain functional groups. It is possible to identify a functional group of a molecule by comparing its vibrational frequency on an IR spectrum to an IR stored data bank.
Figure 2.17 Vibrational motions for a triatomic molecule
2.1.3.2 Fourier transform infrared spectroscopy (FT-IR) analysis for dispersed organic matter
Infrared (IR) spectroscopy records changes in dipole moment resulting from bond vibration upon absorption of IR radiation, thus allowing the identification of functional groups in organic samples (Mastalerz and
25
Bustin, 1996). Fourier Transfomr Infrared (FT-IR) measurements of IR absorbance simultaneously over the entire infrared spectrum. As a result, many spectra can be collected and summed, which reduces random noise and enhances absorbance peaks.
FT-IR has been widely used to provide insight into the chemical composition and structure of coal (Guo and Bustin, 1998; Ibarra et al., 1996; Iglesias et al., 1995; Mastalerz and Bustin, 1993; Painter et al., 1981; Sobkowiak and Painter, 1992) and kerogen (Ganz and Kalkreuth, 1987; Kister et al., 1990; Lin and Ritz, 1993). FT-IR studies assigned specific bands to chemical structures in complex kerogen molecules (Baruah, 1986; Painter et al., 1981; Painter et al., 1983) and proved the diagnostic value for maturity and kerogen type (Chen et al., 1998; Chen et al., 2012; Christy et al., 1989; Ganz et al., 1990; Kister et al., 1990; Lin and Ritz, 1993; Lis et al., 2005) (Fig. 2.18).
FT-IR experiments were carried out FT-IR at NR–IGG– UOS Roma, laboratory at the Department of Earth Sciences, Sapienza University of Rome on a Bruker Equinox 55 FT-IR spectrometer.
FT-IRband assignment
Absorption band (cm-1) Band assignment 3000-3100 Aromatic C-H stretching
2960 Aliphatic C-H stretching vibrations-methyl (CH3)
2920 Aliphatic C-H stretching vibrations-methylene (CH2)
2880 Aliphatic C-H stretching vibrations-methyl (CH3)
2850 Aliphatic C-H stretching vibrations-methylene (CH2)
1710 C=O stretching vibrations-carbonyl groups
1650 C=O stretching vibrations conjugated with aromatic rings 1600 C=C aromatic ring
1445 Asymmetric aliphatic C-H deformation of methylene and methoxyl 1370 Symmetric aliphatic C-H bending of methyl groups
880 Aromatic out-of-plane-aryl ring with isolated C-H groups 815 Aromatic out-of-plane-rings with 2 neighboring C-H groups 750 Aromatic out-of-plane-4 neighboring C-H groups
Table 2.1 Band assignment in the infrared spectra of kerogen Figure 2.18 Classification of kerogen-types and maturation according to FT-IR ratio of the intensities of
aliphatic/aromatic bands (A-Factor) and FT-IR ratio of the intensities of carboxyl and carbonyl/aromatic bands (C- Factor) and the vitrinite reflectance equivalent grid from Ganz et al. (1990)
26
Figure 2.19 FT-IR spectrum of a concentrated kerogen. Measured band areas and peaks
The spectra were obtained covering the 4,000–400 cm−1 range and recorded with a spectral resolution of 2 cm−1 and a signal/noise ratio of 42,000:1. About 200 scans were added before Fourier transform. Two hundred scans per sample were recorded in absorption mode from 4000 to 500 cm−1 with a 4 cm−1 resolution.
Ground kerogen was mixed with potassium bromide in the proportion of 1 mg/ 100 mg and was analysed as KBr pellets. Two hundred scans per sample were recorded in absorption mode from 4,000 to 500 cm-1 with a 4 cm-1 resolution. Bands were identified by comparison with published spectra (Chen et al., 2012; Lis et al., 2005; Painter et al., 1981; Sobkowiak and Painter, 1992; Wang and Griffiths, 1985) and their assignments were performed according to Drobniak and Mastalerz (2006) (Table 2.1).
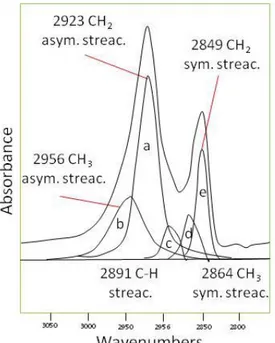
Integrated band areas were measured using Omnic spectral analysis software. In particular they are: aromatic C-H stretching region (3,000-3,100 cm-1), aliphatic C-H stretching region (2,800-3,000 cm-1), oxygenated groups and aromatic/olefinic region (1,550-1,750 cm-1), CH2 and CH3
bending modes (complex peak at 1,450 cm-1), CH3 absorption band (peak at 1,375 cm -1
), and aromatic out-of-plane C-H deformation region (700-900 cm-1) (Fig. 2.19). The aliphatic C-H stretching region (2,800-3,000cm-1) was resolved using Fourier deconvolution (Lin and Ritz, 1993) into five spectral bands at 2,955 (asymmetrical CH3 stretching), 2,925 (asymmetrical CH2 stretching), 2,890 (CH stretching), 2,865
(symmetrical CH3 stretching), and 2,850 cm -1
(symmetrical CH2 stretching) as shown in Figure 2.20.
The CH2/CH3 ratio was calculated using asymmetrical stretching of these bands (2,925/2,955 cm -1
) according to(Lin and Ritz, 1993). Bands in the 1,550-1,750 cm-1 region were resolved into two peaks representing carbonyl/carboxyl absorption at 1,700 cm-1 and an olefinic/aromatic region at 1,600cm-1.
Figure 2.20 Deconvolution of the C–H aliphatic stretching region into five individual bands. After Lin and Ritz (1993)
27 2.1.4 Raman spectroscopy analysis
2.1.4.1 Theory
When radiation passes through a transparent medium, the species present scatters a fraction of the beam in all directions. Nevertheless, in 1928 it was found by the Indian physicist, C. Raman, that a small fraction of the radiation scattered by certain molecules differs from that of the incident beam and the shifts in wavelength depend on the chemical structure of the molecules responsible for scattering.
Raman spectra are obtained by irradiating a sample with a powerful laser source of monochromatic radiation. During irradiation, the spectrum of the scattered radiation is measured. The scattered radiation is of three types, namely Stokes, anti-Stokes and Rayleigh (Fig. 2.21). The wavelength of Rayleigh radiation is the same of the incident radiation, while a shift toward higher and lower wavenumbers is observed respectively for the anti-Stokes and anti-Stokes radiation.
Figure 2.21 Jablonski energy-level diagram representing the virtual vibrational states involved in Raman inelastic diffusion and the real electronic excited states involved in fluorescence (modified from Schwartz, 2011)
The Raman effect can be described in terms of transitions between vibrational energy levels (Fig.2.21). When an energetic photon strikes a molecule in its ground state, it may raise the molecule to a higher virtual state. As this is not a stable energy state for the molecule, two things can occur. The molecule will probably return to its ground vibrational state and emit a photon with the same energy and frequency as the exciting photon (i.e. Rayleigh scattering). However, some of the excited molecules will not return to the ground state, but to some excited vibrational state. Such a molecule emits a photon, which has a lower energy than the exciting photon, the energy difference being equal to the difference between the initial and final vibrational states.
28
If a molecule, which is in the first excited vibrational state, absorbs the photon then the molecule is again raised to some high, non-stable energy state. This molecule will probably then return to the ground state, and doing so, emits a photon, which has a higher energy than the exciting photon. The difference in energy between the exciting photon and the emitted photon is equal to the energy difference between the two excited vibrational states of the molecule. This is anti-Stokes-type Raman scattering.
The relative populations of the two energy states are such that Stokes Raman is much favoured over anti-Stokes. The quantum theory of Raman scattering shows that the phenomenon results from the same type of vibrational changes that are associated with infrared (IR) absorption. Thus, the difference in wavelength between the incident and scattered radiation corresponds to wavelengths in the mid-IR region.
There are, however, notable differences between the kinds of groups that are IR active and those that are Raman active. The IR absorption requires that a vibrational mode of the molecule have a change in dipole or charge distribution associated with it. Only then can radiation of the same frequency interact with the molecule and promote it to an excited vibrational state. In contrast, scattering involves a momentary distortion of the electron distribution around a bond in a molecule, followed by re-emission of the radiation as the bond returns to it ground state. In its distorted form, the molecule is temporarily polarized, i.e. develops momentarily an induced dipole, which disappears upon relaxation and re-emission.
Each band in a Raman spectrum represents the interaction of the incident light with certain atomic vibrations. Atomic vibrations, in turn, are controlled by the sizes, valences and masses of the atomic species of which the sample is composed, the bond forces between these atoms, and the symmetry of their arrangement in the crystal structure. These factors affect not only the frequencies of atomic vibrations and the observed Raman shifts, but also the number of observed Raman bands, their relative intensities, their widths and their polarization. Therefore, Raman spectra are highly specific for a certain type of sample and can be used for the identification and structural characterization of unknowns.
2.1.4.2 The Raman Spectrometer
Micro-Raman spectroscopic analyses, were performed at the Laboratory of Experimental Volcanology and Petrology (EVPLab) of “Roma Tre” University (Italy) and in the laboratory of the Institute of Earth Sciences (IES) of Science Faculty of the University of Porto (Portugal).
At EVPLab laboratory we used a Jobin Yvon micro-Raman LabRam system in a backscattering geometry, in the range of 700-2300 cm−1 (first order Raman spectrum) using a 600 grooves/mm spectrometer gratings and CCD detector under a maximum of 50X optical power.
A laser source Neodimium-Yag at 532 nm (green laser) was used as the light source and optical filters adjusted the power of the laser (<6mW). The Raman backscattering was recorded after an integration time of 20s for 6 repetitions for each measurement. This, together with the use of green laser and optical filters, allowed to reduce the fluorescence background to optimal values. Between ten to fifteen measurements were performed for each samples to ensure reproducibility of the measurements.
29
Figure 2.22 Jobin Yvon micro-Raman LabRam system from EVPLab laboratory (Roma Tre)
In Chapter 4 and partially 6, analyses were performed at the Institute of Earth Sciences (IES) of the University of Porto, using a Horiba Jobin-Yvon LabRam Microscope XploRATM system in a backscattering geometry, in the range of 700-2300 cm−1 (first order Raman spectrum) using a 600 grooves/mm spectrometer gratings and CCD detector. The instrument is equipped with 50X and 100X objective lens, and an excitation wavelength of 532 nm from a Ar+ laser at a power of 25 mW. Optical filters adjusted the power of the laser were used to reduce of more than 10% the output power.
2.1.4.3 Band assignment for Raman spectra in dispersed organic matter
Raman spectral signal of kerogen is concentrated in a “first order” region between 1,000 and 2,000 cm-1 and “second order ” region between 2,000 and 3,500 cm-1
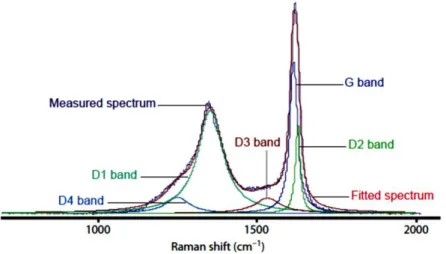
. Bands in the second order region are visible only in higher thermal maturity samples (Beyssac et al., 2003) and they were never observed in our set of samples. The first order Raman spectra for carbon materials consist of two main bands known as D and G band (Friedel and Carlson, 1972; Tuinstra and Koenig, 1970) and in other less defined bands that can vary depending on the kind of material and rank degree (Li, 2007; Potgieter-Vermaak et al., 2011).
D and G bands correspond respectively to breathing and stretching mode in sp2 bonded carbon clusters (Ferrari and Robertson, 2000). In graphite, the G band is related to E2g vibration mode of a crystal with symmetry, i.e. to in-plane vibration of aromatic carbons at 1580-1600 cm-1. The D band was originally observed at 1355 cm-1 with a 488 Ar-ion laser and was related to the in-plane A1g mode that is active only in
the presence of lattice defect of polycrystalline graphite (Pócsik et al., 1998). It’s worth to note that D mode is dispersive and vary with photon excitation energy, while G peak is not dispersive (Castiglioni et al., 2004; Ferrari and Robertson, 2000; Ferrari and Robertson, 2004; Nestler et al., 2003; Pócsik et al., 1998).
Dealing with very disordered materials, the contribution of other features at 1,100-1,200 and 1,400-1,500 cm-1 cannot be neglected and even the assignment of the G and D bands to specific vibrational modes is questioned. Unfortunately, very few works exist that attempt to explain the origin of these bands and the