RESEARCH ARTICLE
1389-5575/16 $58.00+.00 © 2016 Bentham Science Publishers
Overview on Radiolabel-Free in vitro Assays for GPCRs
Michela Buccioni, Claudia Santinelli, Piero Angeli, Diego Dal Ben, Catia Lambertucci,
Ajiroghene Thomas, Rosaria Volpini and Gabriella Marucci
*School of Pharmacy, Medicinal Chemistry Unit, University of Camerino, Via S. Agostino 1, I-62032 Camerino (MC), Italy A R T I C L E H I S T O R Y Received: November 12, 2015 Revised: April 29, 2016 Accepted: July 31, 2016 DOI: 10.2174/13895575166661608081202 07
Abstract: G-protein coupled receptors (GPCRs) represent important targets for drug
discovery because they participate in a wide range of cellular signalling pathways that play a role in a variety of pathological conditions. The characterization of the patho-physiological profile and functional roles of new receptors is highly dependent on the availability of potent and selective ligands and new screening assays. The study of the pharmacological profile of new chemical entities is very important in order to predict the activity of drugs and their clinical adverse effect in humans. In the last decade, a large number of new in vitro radiolabel-free assays were developed and relevant information on diseases was upgraded. In particular, radiolabel-free assays led significant easy to handle and safer tools for operators.
The aim of this review is to analyze these assays in terms of new drug activity and toxicology prediction and translation of non-clinical findings to humans in order to provide a powerful tool to aid drug development.
Keywords: AlphaScreen, β-arrestin, FRET, GPCRs, HTRF, Immunoassays, In vitro assays, SPR. 1. INTRODUCTION
From many years, G-protein coupled receptors (GPCRs) were used as targets for drug discovery and the presence of new drugs commercially available that interact with them was very important. In the last years, only few new drugs were available, but now the possibility to use high-throughput approaches for GPCRs and the molecular modeling studies coupled with medicinal chemistry are giving new input to the search in this field. In fact, the availability of new technologies and approaches to screen GPCRs in combination with a genomically complete GPCRs target palette has allowed identifying targeted drugs with a specific therapeutic effect. Nevertheless, the major reasons that induce the failure of a drug development from the preclinical to clinical phases are the absence or the decrease of effect, the bioavailability and the toxicity of these drugs. Therefore, one of the most important steps in developing a new drug is the target identification and validation [1]. Drug development in the early stages was based on a series of in
vitro screening planned to support the determination of
effect, uptake, metabolism, and excretion of a drug, as well
*Address correspondence to this author at the School of Pharmacy, Medicinal Chemistry Unit, University of Camerino, Via S. Agostino 1, I-62032 Camerino (MC), Italy; Tel/Fax: ++39-0737-637345,
E-mail: [email protected]
as the detection of potential undesired effects. At the same time, the animal experimentation, driven by public opinion and by scientific and technological developments in toxicology, should be decreased. For these reasons, it is very important to search new in vitro technologies in order to know the effects of chemical entities minimizing the use of laboratory animals. The government agencies for the drug marketing, such as the National Institute of Environmental Health Sciences (NIEHS/NTP) or the Food and Drug Administration (FDA), are carefully considering the in vitro assays for xenobiotic toxicity to better assess human risks. It is very important to underline that some particular in vitro tests, that allow the understanding of drug human-specific toxicant activities, are based on the use of human cells and tissues [2]. Efforts in this direction have been made by the researchers in order to reduce the use of laboratory animals and, at the same time, to reduce risks to human health, since the results of in vivo experiments are often not sufficiently reliable in the view of the fact that there are differences between animals and humans. In vitro toxicity testing assays can be cheaper and quicker, as well as more useful than the traditional in vivo ones. Nevertheless, it is of great importance to pay scrupulous attention to the adaptations from in vitro to in vivo and this represents one of the major problems in this research field. Due to regulatory limitations and ethical considerations, the request of alternatives to
animal testing has gained a new impetus [3]. In vitro assays detect early indicators of what may ultimately lead to a good or an adverse health effects. They provide information about the “mechanism of action” by which a potential drug may revolutionize the pathology or physiology. These changes cannot be easily detected or measured using traditional tests, which are more focused on determining whether a particular drug dose produces an observable change in the health or normal functioning of the whole animal.
The in vitro tests are divided in two types of assays: acellular and cellular. More in detail in a cellular assay using the whole cell or a cell populations, the drug, at a particular dose, is positioned in contact to the cell culture and then the effect of the drug is evaluated. In this way, it is possible to estimate both a particular biological effect and the toxicity of a drug. Many methods allow this evaluation in particular in the last decade.
2. ACELLULAR ASSAYS
Assays that utilize cells component instead of intact cell are called acellular assays. Moreover, often in these assays could be used often molecules extracted from cells, such as enzymes or DNA, correlated to the activation of one GPCR. This type of assay was mainly used to study the binding between the molecule and the GPCR using electrochemical or fluorescence methods. These kind of assays are called "mix-and-measure" assays because they do not require separation of bound ligands [4].
Ligand binding assays provide a measure of the interactions that occur between two molecules, such as protein-bindings, and are used to study human body’s endogenous receptors, hormones, and other neurotransmitters in order to create drugs that are selective versus a particular target and that can antagonize or mimic the endogenous molecules [5]. Such progresses provide researchers the ability to detect the ligand and ligand-receptors, and to acquire important pharmacological information useful in drug development and treatment strategies [6].
In the past, researchers used mainly radioactive assays but today, also to protect the human health and the environment, they have turned to non-radioactive assays and in this review it will report some of them. The non-radioactive methods include, but are not limited to, time-resolved fluorescence (TRF), fluorescence polarization (FP), fluorescence resonance energy transfer (FRET), and surface plasmon resonance (SPR) [7].
2.1. Time-resolved Fluorescence Assay
Until now, guanosine triphosphate (GTP) binding assays are performed using the radioactive, non-hydrolysable GTP analogue, [35S]GTPγS [8]. Recently, a novel TRF method, which exploits the unique fluorescence properties of lanthanide chelates and provides a powerful alternative to assays using radioisotopes, has been developed [9]. This new assay allows examining GPCR activation by monitoring the binding of a non-hydrolysable europium-labeled GTP, GTP-Eu [10]. This GTP-GTP-Eu is incubated with cell membranes. When an agonist binds to a GPCR, the GTP-Eu binds to the
Gα-subunit. After incubation, the unbound GTP-Eu is washed away and the signal from the GTP-Eu bound to GPCRs is measured using a TRF reader (Fig. 1). In particular, GTP-Eu labeled is able to emit a fluorescence signal at 615 nm after excitation at 340 nm. This fluorescence signal, measured by florescence detector, can be used to construct specific dose-response curves of each agonist tested because the increase of agonist concentration produces an increase of fluorescence signal. On the other hand, the study of antagonists is possible too, in fact, in presence of them there is a shift of the dose-response curves of agonists. This assay is then a valid and powerful alternative to traditional radioactive assay and it is a very sensitive tool since it is possible to work using small quantity of membranes and reagents. Nevertheless, the set-up of this assay is an elaborated operation since it requires the standardization of the membrane quantity for each receptor, the different buffer components, and the incubation time.
2.2. Fluorescence Polarization Assay
This homogeneous method allows rapid and quantitative analysis of diverse molecular interactions and enzyme activities. This system measures the change in the rotational speed of a fluorescent-labeled ligand once it is bound to the receptor [11]. The principle of fluorescence polarization is described in Fig. (2). When a fluorophore, which is covalently attached to a small molecule, is excited by polarized light, the emanated light is largely depolarized. This event is made possible to reorientation of the fluorophore during its excited state caused by rapid Brownian molecular rotation of the labeled species [12]. Depolarization of the emitted light is influenced by the size of the ligand, when a small ligand is used, usually with molecular weight <1500 Da, there is a great depolarization, originated from light rotational speed [11]. Instead, when the ligand utilized is of a larger size, the resulting depolarization decreases. Once the labeled ligand is bound to a protein with high molecular weight, usually >10 kDa, the fluorophore reorients to a much smaller degree, due to the significantly reduced rotational speed. This assay is currently being used for measuring ligand-binding receptors. Furthermore, it is possible to know the affinity of an antagonist by measuring the decrease in FP signal produced when it is added in the medium containing labeled ligand and receptor [13]. There are not market available preconstituted kits to study GPCR ligand activity through this technique since each receptor system needs specific ligands labeled with a fluorophore. One of the first approaches to study new ligands using FP is attributed to Banks and coworkers who classified FP as a suitable detection method for high throughput drug screening with respect to speed of analysis, displaceable signal and precision [14-15]. This technique has been widely utilized in clinical and biomedical settings, including the diagnosis of certain diseases and the monitoring of therapeutic drug levels in body fluids. Recently FP assay has been denominated a powerful high-throughput screening (HTS) to discover small molecule drug for an increasing range of target classes [16]. Despite its wide applications, this technique has several limitations. The most important limit is the level of fluorescence. In fact, fluorescence value increases with
Fig. (1). Principle GTP-EU assay.
Fig. (2). Scheme depicting the basic principle of fluorescence polarization.
molecular weight, but reaches a plateau level dependent on the fluorophore; moreover, if in a library there are fluorescent compounds, this can cause artifacts. In addition, the signal measured with this technology is a weighted value of free and bound ligand. Therefore, saturation curves are accessible only after calculation of the corresponding concentrations of free and bound ligand [17].
2.3. Fluorescence Resonance Energy Transfer Assay
Fluorescence resonance energy transfer (FRET), also called Förster resonance energy transfer [18], involves a molecular donor fluorophore, that, after absorbing photons of a certain wavelength exhibits fluorescence in an excited electronic state, which transfers its energy to a close molecular acceptor chromophore, through non-radioactive
dipole–dipole coupling, which will emit a quantum energy depending on its characteristic wavelength. FRET is very sensitive to small distance changes because the distance between the two dipoles and the efficiency of the energy transfer is inversely proportional to the sixth power. Therefore, the rate of FRET depends on the degree of spectral overlay between the donor and the acceptor, the quantum yield of the donor, the relative orientation of the donor-acceptor transition dipole moments and the distance between the donor-acceptor chromophore (Fig. 3).
Fig. (3). Spectra of donor-acceptor pair. The colored region
represents the overlap between the fluorescence spectrum of donor and absorption spectrum of acceptor.
In the case of FRET, the excitation of the donor fluorophore results not only in donor emission, but in part in emission characteristic for the acceptor fluorophore too. It is possible to detect and quantify FRET in several ways. Another alternative method is to measure the fluorescence lifetime of the donor fluorophore in the presence and absence of the acceptor chromophore. FRET will cause a decrease in excited lifetime of the donor fluorophore. FRET is widely applied for a variety of techniques. In particular, it is used as a tool for guaranteeing high sensitivity and this technology can be combined with microscopy, chromatographic assays, flow cytometry and electrophoresis. FRET can be used also for improving spectral characteristics of fluorescent dye-labeled protein. It is used in combination with monoclonal antibodies leading to structural analysis of proteins and also in solutions and in biological membranes. In addition, the sensitivity of FRET gives the basis for a quick set up, robust, and accurate immunoassays and enzyme assays [19]. Moreover, FRET could be used to study GPCRs and their ligands. Some authors have demonstrated that it is possible to determine if ligands are able to activate the receptor as full, partial, or inverse agonists [20]. In fact, full and partial agonists cause a FRET decreasing of different magnitudes, while inverse agonists cause the increasing of FRET. Moreover, when an agonist interacts with the receptor there is a change in protein conformation. To monitor this change it is worthwhile to use site-specific donor and acceptor fluorophores introduced by two orthogonal labeling
chemistries [21]. In addition, depending on the position of the labels, it is possible to monitor the activation and the signalling of GPCRs both in the purified reconstituted state and in intact cells [22]. Some authors have demonstrated the presence of dimer and/or oligomer receptors in native tissue by FRET [23-25]. Further, specific FRET signals were detected with different receptors expressed in cell lines, compatible with their oligomeric or dimeric structure in these transfected cells using series of fluorescent agonists and antagonists. The major advantage of applying FRET for structural studies is that, owing to the specific labeling, the complexity and the heterogeneity of the system are not important because the object under investigation can be detected in situ and/or in vivo with little or no interference. FRET can be measured on populations of suspended or adhered cells and, when this technique is coupled with microscopic imaging, using both wide field and confocal microscopes, it allows studying subcellular compartments, and makes it possible to limit the data acquisition [25]. Likewise, it is very important the use of imaging technologies with FRET because the analysis of these studies can show both the protein functions, including processes ranging from gene expression to second-messenger cascades, and intercellular signalling. However, one of the most severe limits in protein chemistry has been the difficulty in inserting site-specific fluorescent labels [27].
Fig. (4). Schematic mechanism of energy transfer between two
molecules.
2.4. Surface Plasmon Resonance
The Surface Plasmon Resonance (SPR) is based on optical measurements conducted in real time with a time resolution from milliseconds to seconds. The SPR effect was known for many years, but was interpreted as light-stimulated, collective oscillations of valence electrons (surface plasmons) in thin solid layers, only few years ago [7]. Usually, in the practical applications, thin gold layers on the surface of a glass support are used. Habitually, a glass/gold interface is illuminated through the glass with a convergent beam of light that is totally reflected from the interface (Fig. 5). Plasmons are stimulated under a specific incidence angle (θresonance), and the stimulation is detected as an equivalent minimum of light intensity at a specific reflection angle, which is quantified with a diode array detector. Experiments are conducted with monochromatic p-polarized infrared light generated by a light emitting diode. An important requisite for the sensor surface is its ability to immobilize one of the interacting partners without interfering with its action. This involves that immobilization should be adequately strong so that microfluidic flows do not result in loss of material and this should be reproducible in order to
conduct experiments under a multiplicity of conditions. Another important step is that this binding is reversible, allowing to reuse the same sensor chip.
Fig. (5). Schematic presentation of the optical system to detect SPR
phenomena.
SPR represents the best way to study biomolecular interactions at interfaces because the detection takes place in real-time and forgoes labeling of any of the molecules. It is possible to apply this technique to study GPCRs, but researchers due to the high hydrophobicity of membrane proteins and the great diversity of receptor-stimulating ligands have encountered many difficulties. After many efforts by researchers, now it is possible to apply this technology to study mechanistic aspects of GPCR activation by detecting the turnover of G protein caused by an agonist [28, 29]. The weak point of SPR is the lack of sensitivity when monitoring low molecular weight adsorbates and rate limiting factor of mass transport-affecting kinetic analysis.
3. CELLULAR ASSAYS
There are sensitive and specific methods that allow quantitative comparisons of pharmacologic properties of GPCRs in physiological or pathological settings [30]. Conventionally these assays rely on detecting the activation of downstream cellular pathways through the subsequent production of intracellular second messengers such as calcium, cyclic AMP, and inositol phosphate (IP) or extracellular-signal-regulated kinase (ERK) phosphorylation and β-arrestin recruitment using various signal detection techniques. Each of these assay classes will be thoroughly discussed in this review.
3.1. Assays based on Second Messenger Quantification
Measurement of intracellular calcium provides valuable information on the activation status of GPCRs and ion channels. Several kits commercially available allow monitoring the intracellular calcium accumulation and most of them uses a fluorescent dye able to cross the cell membrane. Once inside the cell, the lipophilic blocking groups of the dye are cleaved by an esterase, resulting in a negatively charged fluorescent dye that stays inside the cell. Its fluorescence is greatly enhanced upon binding to calcium (Ca2+). When cells
are stimulated with agonists, the receptor signals the release of intracellular Ca2+, which significantly increases the
fluorescence of the dye (Fig. 6).
The latest generation of kits utilize an extracellular masking technology to block the background fluorescence and increase the assay's signal window making them indicators of choice for characterizing GPCRs pharmacology and function. This technology maximizes the fluorescence signal from a wide range of cell types by reducing cell wash artefacts.
Fig. (6). Schematic diagram of the fluorescent dye assay employed
to measure intracellular calcium accumulation.
There are calcium assay kits, commercially available, that utilize the chromogenic complex (λ = 575 nm) formed between calcium ions and o-cresolphthalein to provide a simple assay in the physiologically important range of Ca2+ concentration 0.4-100 mg/dL (0.1-25 mM). The procedure is based on Ca2+ ions reacting with o-cresolphthalein complexone in an alkaline solution to form an intense violet coloured complex, which maximally absorbs at 577 nm. Recent kits are supplied with 8-hydroxyquinoline which is added to remove interference by magnesium and iron. In this method the absorbance of the Ca-o-cresolphthalein complex is measured bichromatically at 570/660 nm. The resulting increase in absorbance of the reaction mixture is directly proportional to the calcium concentration in the sample. The procedure is simple and quick, the assay is convenient, sensitive, stable and adaptable to high-throughput. Even if calcium assays are robust and easily conformable to HTS, there are some significant limitations: fluorescent compounds can interfere with assay responses; the assay sensitivity sometime is not enough to study GPCRs activity in primary cells; calcium flux is fast and momentary, and does not allow detection of constitutive activity (or inverse agonism).
Another possible method is to measure inositol-3-phosphate (IP3) production directly or indirectly. In the last decade have been developed numerous kits based on
different technologies to measure IP3 accumulation, as an alternative to the traditional radioactive assays that were complex to use and not amenable to HTS. Most important technologies used are Amplified Luminescent Proximity Homogeneous Assay Screen (AlphaScreen), Homogeneous Time Resolved Fluorescence (HTRF), and FP [31, 32]. The AlphaScreen is a bead-based non-radioactive and homogeneous detection technology in which the beads, which function as “donor” and “acceptor”, are coated with a layer of hydrogel providing functional groups for bioconjugation. When acceptor and donor beads are brought into proximity by a molecular interaction occurring between the binding partners captured on the beads a cascade of chemical reactions is initiated to produce a greatly amplified signal. The assay is very flexible and sensitive; it allows measuring a broad range of affinities, from low-affinity to high-affinity interactions (picomolar to millimolar range) that are difficult to detect using traditional assays.
Since an innovative method to measure IP3 production in cultured cells is to directly quantify myo-inositol-1-phosphate (IP1), which derives from IP3 after a series of enzymatic reactions, there are in the market some kits based on competitive immunoassays which are able to detect this enzymatic reaction product. Receptor activation promotes IP1 production in the cells that competes with an IP1 analog coupled to a fluorophore (acceptor) for binding to an anti-IP1 monoclonal antibody labelled with Eu Cryptate (donor). The resulting signal is inversely proportional to the concentration of IP1 in the sample. Recently these kits contemplate the use of lithium chloride (LiCl) and these have the advantage that LiCl inhibits the degradation of IP1, the final step in the inositol phosphate cascade, allowing it to accumulate in the cell, where it can be measured as a substitute for IP3 through HTRF [33,34]. This technique permits to quantify IP1 both in adherent and in suspension cells allowing studying the biological profile of agonists, antagonists and inverse agonists.
As previously mentioned, accumulation of IP3 can be monitored also by FP. Usually, after stimulation with an agonist that increase IP3 production, cells are lysed by HClO4, and subsequently fluorescent IP3 tracer and the
binding protein are added. The IP3 deriving from cell lysates competes for binding to the IP3 binding protein. Bound IP3 tracer will "tumble" more slowly in solution, creating a polarized signal (high mP). The polarized signal is inversely proportional to the amount of IP3 in the cell lysates. The importance of this method is based on the facile adoption of
FP in HTS, a technique that in the last decade gradually almost replaced radioligand binding assays for discovery of novel antagonist and agonists of GPCRs and determination of their binding affinities, leading to a reduction in assay cost and health hazards [35, 36].
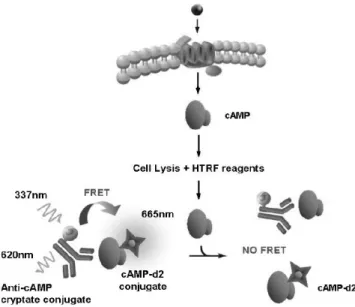
Another very accurate method to monitor the GPCRs activity is to determine the concentration of one of the most important intracellular mediators, cAMP. Its concentration in cells can be increased upon binding of many ligands to their receptors. The most studied pathway consists in the release of G protein α subunit following ligand-receptor interaction, which in turn activates or inhibits the ATP/cAMP conversion function of adenylate cyclase. The cellular cAMP level depends on the activity of two groups of enzymes, the adenylyl cyclases (AC) that produce cAMP and the phosphodiesterases (PDE) that hydrolyze cAMP [37, 38]. Increased cAMP levels activate a number of different effector proteins, including protein kinase A (PKA) [39], hyperpolarization-activated (Ih) channels [40], the guanine– nucleotide exchange factor Epac [41], and cyclic nucleotide-gated (CNG) channels [42]. Given this large involvement in cell regulation, cAMP quantification has been of considerable interest in the exploration of cell physiology and dysfunction. There exist assays designed to directly determine the cAMP concentration and others that utilize enzymes involved in the signalling cascade that leads to the production of this second messenger. Most of the assays employed that determine the cAMP production are based on immuno-technology or on luciferin-luciferase principle. The great part of the immunoassays is competitive assays using a cryptate-labeled anti-cAMP antibody and labelled cAMP. cAMP produced by cells competes with the labeled cAMP for binding to the antibody; therefore the signal that rises after interaction between the labeled cAMP and the antibody even if it is read both in HTRF and in Luminescence or Absorbance is inversely proportional to the level of cellular cAMP produced (Fig. 8).
Luciferin-luciferase based technology uses flexible luciferase-based biosensors for real-time detection of signalling events in live cells. This type of assay uses a modified form of firefly luciferase mutated joining the wild-type N- and C-termini with a polypeptide or protein domain; this creates engineered termini elsewhere within the structure [43, 44]. cAMP or cGMP binding or protease cleavage leads to a conformational change in the biosensor, which promotes large increases in luminescence activity. The intensity of the luminescence increase is directly proportional to the amount
of cAMP/cGMP or protease activity (Fig. 9). The assay, easy to perform, allows a real-time recognition of signalling events in live cells with sensitivity, linearity and specificity. The biosensor is sensitive enough to monitor inverse agonist activity or Gi-coupled receptor activation in the absence of
added forskolin, but at the same time possesses a large enough dynamic range to monitor very large increases in intracellular cAMP concentration.
Fig. (9). Intracellular biosensors for cAMP, cGMP, and protease
detection.
The most used assays that indirectly determine the cAMP concentration involve the quantification of PKA. Most of them are based on the principle that cAMP stimulates PKA holoenzyme activity, decreasing available ATP and leading to reduced light production in a coupled luciferase reaction [45, 46]. PKA is composed of two regulatory and two catalytic subunits. Each catalytic subunit is a serine/ threonine protein kinase, which combines, in the absence of cAMP, with each regulatory subunit to form the inactive PKA holoenzyme. When the cAMP concentration increases, cAMP binds to two sites on the regulatory subunits, leading to a conformational change that induce a catalytic subunits release. The free catalytic subunits becoming active are able
to catalyse the transfer of the terminal phosphate of ATP to a PKA substrate. The decrease in ATP concentration can be observed as light output using luciferase in a reaction that requires ATP to produce light; therefore, there is a reciprocal relationship between cAMP concentration and the light output observed, that allows to quantify the activity of the ligands under study at the GPCR of interest (Fig. 10).
Fig. (10). Schematic diagram of cAMP production and principle of
a luminescence assay using the PKA holoenzyme activity to quantify the cAMP concentration.
3.2. Assays based on Involvement of Pathways Downstream in the Signal Transduction Cascade
Technologies above mentioned had success in many cases but they have limitations. They are limited in the capacity to screen orphan receptors and for some of these technologies responses for many GPCRs such as Gi coupled
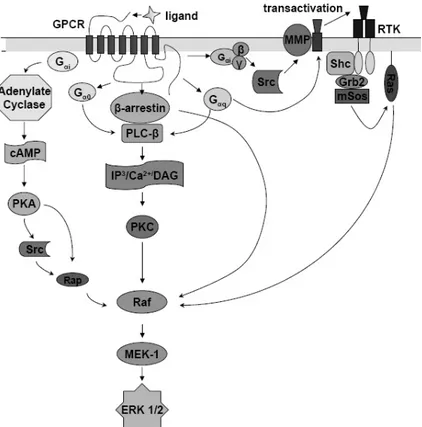
GPCRs are not easy to measure in current assay formats. A suitable alternative could be an assay able to detect the activation of ERK phosphorylation cascade pathway, which results in the phosphorylation of both cytoplasmic and nuclear proteins regulating gene transcription. Evidences demonstrate that the ERK 1/2 cascade can be activated by different GPCRs, and the complex set of signalling pathways that are generated by GPCR stimulation converges at ERK 1/2 (Fig. 11). Hence, this type of assay has the capability to measure cellular changes produced by activation of Gs, Gi
and Gq coupled receptors giving the possibility to use a
single assay format for screening [47, 48].
Recent high-throughput assays for detection of intracellular ERK 1/2 phosphorylation include electrochemiluminesence-based and infrared electrochemiluminesence-based detection systems. Two alternative techniques, able to measure activation of ERK 1/2 in
high-Fig. (8). Schematic representation of the immuno-competitive assay
throughput format and that can be fully automated with standard robotics, could be the immuno-sandwich luminescence or immuno-sandwich ELISA assays. In the first case Donor beads are coated with streptavidin to capture a biotinylated antibody. Acceptor beads are coated with Protein A to capture the second antibody. In the presence of phosphorylated protein, the two antibodies bring the Donor and Acceptor beads close together, generating signal. The amount of phosphoprotein present in the sample will be directly proportional to the quantity of light emission. In the case of immuno-sandwich ELISA assay acceptor beads is instead coated with a proprietary agent that immobilizes the second assay antibody, labeled with a tag (Fig. 12). This eliminates potential interference from spiked antibodies and results in better sensitivity and larger dynamic range.
Fig. (12). Immuno-sandwich assay principle.
Two relatively new alternative techniques to examine the activity of cell surface receptors are based on impedance-based assay and optical biosensor technologies. Impedance-based assay technology for cell-Impedance-based assays measures
changes in electrical impedance relative to a voltage applied to a cell monolayer that occur in each well upon stimulation of cell surface receptors. The system is a major breakthrough for accurate monitoring of Gαi- and Gαs-coupled GPCRs, as it
overcomes many of the challenges and limitations found with the traditionally available assay formats. When a GPCR is activated by a ligand begins a signal transduction pathway mechanism that causes the production of intracellular second messengers and cellular morphological changes. In fact, production of intracellular effectors results in changes in the cellular cytoskeleton, which are reflected as changes in the flow of current across and between the cells in the monolayer (Fig. 13). This change in the flow of current around and through cells is represented in a single well by an overall change in the impedance within that well [49, 50]. This qualitative data can be used to identify the pathway through which receptors transduce their signals, and enables interpretation of the action mechanism of lead compounds unlike traditional technologies, which measure only discrete intracellular events, such as Ca2+ flux or cAMP accumulation.
In addition this technology, based on impedance measurement, eliminates the need of labels, such as tags, dyes, or specialized reagents.
Fig. (13). Activation of GPCRs leads to cytoskeletal changes
measured through electrical impedance changes.
Fig. (11). GPCR signalling pathways via ERK 1/2 can be activated by GPCRs, which couple to different G protein subclasses and transduce
The cellular morphological changes produced by the ligand binding to the cell surface receptors can be detected by an optical biosensor technology too [51]. Usually a resonant wave-guide grating biosensor is incorporated into the microplate well bottom, which is excited by a fluorescent or luminescent light source. The ligand binding induces dynamic mass redistribution (DMR) within the bottom region of the cell monolayer producing changes in local index of refraction that are detected by a spectrometer within the label-free technology module. The assay plates are measured before (the baseline reading) and after (the final reading) compound addition [52, 53]. The results are represented as shift between final and baseline readings and responses are indicated as DMR (Fig. 14).
Optical Biosensor-based cell assays offer several advantages over conventional methods including the measurement of multiple classes of GPCRs simultaneously from a single assay, high-throughput screening, real-time analysis, and a non invasive methodology to study GPCR activation and signalling. In particular, the applications of these new label-free tools include cell-based receptor-ligand interactions particularly useful for orphan receptors. However, significant limitations are present, in fact, labels or cell engineering can, in some cases, interfere with the detection, the molecular interaction, or the cell biology of target receptors, thus resulting in false positives [54].
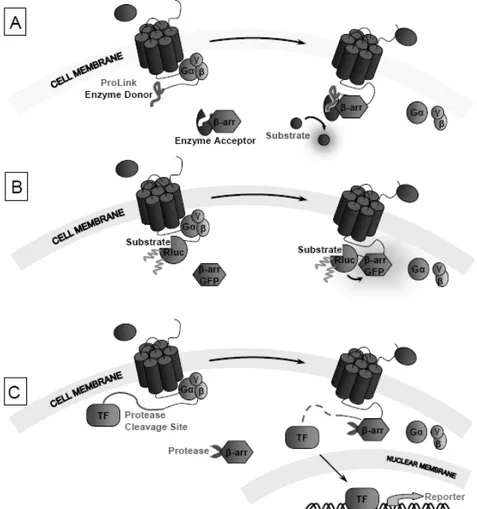
There are also functional assays that directly measure GPCR activity by detecting the interaction of β-arrestin, a protein involved in signal regulation and receptor internalization, with the activated GPCRs. The best advantage of this technique is based on the principle that β-arrestin recruitment occurs independently of G-protein coupling, hence similar assays offer a powerful and universal platform for measuring receptor activation. There are many kits available in the market based on luminescence, Bioluminescence Energy Transfer (BRET), and Fluorescence Resonance Energy Transfer (FRET). The most common kits based on luminescence use enzyme fragment complementation of β-galactosidase to measure receptor-β-arrestin proximity by chemiluminescence. β-arrestin is fused to a deletion mutant of β-galactosidase that is catalytically inactive, while
GPCR is tagged with a fragment derived from the deleted sequence of the enzyme. The activation of GPCR stimulates the interaction between the fragment bound to the receptor and the remaining part of the enzyme fused to β-arrestin [55, 56]. The complementation of the two enzyme fragments results in the formation of an active β-galactosidase enzyme and generation of a chemiluminescent signal (Fig. 15A). Kits based on BRET usually possess the GPCR tagged with a Renilla Luciferase (RLuc), and the β-arrestin tagged with a fluorescent protein tag like green-fluorescent protein (GFP) or yellow-fluorescent protein (YFP) [57], or vice versa. Receptor stimulation activates β-arrestin that gets close to the receptor and the light emitted from the RLuc reaction excites the GFP, which then emits a detectable signal at a higher wavelength (Fig. 15B). Most of the kits using FRET technology use an arrestin tagged with a protease while the GPCR is fused in C-terminus with a protease cleavage site followed by a transcription factor (TF). When the receptor is activated by a ligand, the arrestin is recruited and cleaves the protease site fused to the C-terminus of the receptor, generating a non-native TF. The TF, without additional signalling intermediates, enters the nucleus immediately, where it can regulate directly the transcription of a β-lactamase reporter construct, which is measured after the addition of a substrate composed by live cells. The receptor modulation by an agonist or an antagonist is directly related to the ratio obtained from the blue to green fluorescence [58, 59]. The activation of the receptor gene by the TF allows a quantitative measurement of the degree of interaction between the specific receptor and the protease tagged β-arrestin partner (Fig. 15C).
CONCLUSION
The in vitro assays that are used for bringing new drugs from the discovery to the market are undergoing a significant and rapid change. In particular, in the field of a highly validated and novel family of GPCRs, the in vitro assays enable the study of potential new drugs and allow obtaining relevant information on activity and toxicity. The attention for new assays has moved from radiolabeled to florescence or chemiluminescence-based assays together with the use of
homogenous microliter-plate-based platforms. Studies based on these techniques are conducted in live cells and enable the study of a multiplicity of signalling systems, and can be carried out in biological condition in a quantitative manner. All the above mentioned assays have advantages and disadvantages and still there is not an assay that completely can replace in vivo studies also if an accurate in vitro study can improve the chances of successful clinical development and, at the same time, allows moving towards more rapid and efficient processes decreasing the drug development cost. The future will probably depend on achieving the proper equilibrium between the quantity of drug candidates brought into development and their ability to interact with a specific target. Early use of computational approaches to select the most promising drugs, followed by high throughput experimental determinations, allows determining the best drug candidates on the base of their high potency, selectivity and low toxicity.
CONFLICT OF INTEREST
The author(s) confirm that this article content has no conflict of interest.
ACKNOWLEDGEMENTS
This work was supported by Fondo di Ricerca di Ateneo (University of Camerino) and by grants from the Italian Ministry for University and Research (PRIN2008).
REFERENCES
[1] Hughes, J.P.; Rees, S.; Kalindjian, S.B.; Philpott, K.L. Principles of early drug discovery. Br J Pharmacol, 2011, 162(6), 1239-1249. [2] Eisenbranda, G.; Pool-Zobelb, B. ; Bakerc, V. ; Ballsd, M.;
Blaauboere, B.J.; Boobisf, A.; Carereg, A.; Kevekordesh, S.; Lhuguenoti, J.C.; Pieterse, R.; Kleinerj, J. Methods of in vitro toxicology. Food and Chemical Toxicology, 2002, 40, 193-236. [3] Doke, S.K.; Dhawale, S.C Alternatives to animal testing: A review.
Saudi Pharm J, 2015, 23(3), 223-229.
Fig. (15). Non-imaging-based β-arrestin recruitment assays. (A) β-arrestin is fused to an inactive deletion mutant of β-galactosidase,
moreover a fragment derived from the deleted sequence of the enzyme is linked with GPCR. After the interaction between GPCR and β-arrestin, the two parts of β-galactosidase come into close proximity. The result is the cleavage of the substrate and the generation of a chemiluminescent signal. (B) GPCR and β-arrestin are tagged with RLuc and GFP. After the β-arrestin recruitment by the GPCR, the two tags are brought into close proximity. Upon the reaction of RLuc there is an emission of light exciting the GFP, which in turn emits an appreciable signal at a higher wavelength. (C) β-arrestin and protease are fused each other, conversely GPCR is drawn out at its C-terminus with a protease cleavage site linked to a transcription factor (TF). When the β-arrestin is recruited, the TF linked to GPCR is cleaved and passes the nuclear membrane and it goes to regulate the reporter gene transcription.
[4] De Jong, L.A.A.; Uges, D.R.A.; Franke, J.P.; Bischoff, R. Receptor-ligand binding assays: Technologies and Applications. J Chromatogr B Analyt Technol Biomed Life Sci, 2005, 829(2), 1-25.
[5] Davenport, A.P.; Russel, F.D. Radioligand Binding Assays: Theory and Practice. In: Current Directions in Radiopharmaceutical Research and Development; Mather, S.J., Ed. Springer, Netherlands, 1996; Vol. 30, pp. 169-179.
[6] Hulme, E.C.; Trevethick, M.A. Ligand binding assays at equilibrium: validation and interpretation. Br J Pharmacol, 2010, 161(6), 1219-1237.
[7] Locatelli-Hoops, S.; Yeliseev, A.A.; Gawrisch, K.; Gorshkova, I. Surface plasmon resonance applied to G protein-coupled receptors. Biomed Spectrosc Imaging, 2013, 2(3), 155-181.
[8] Strange, P.G. Use of the GTPγS ([35S]GTPγS and Eu-GTPγS) binding assay for analysis of ligand potency and efficacy at G protein-coupled receptors. Br J Pharmacol, 2010, 161(6), 1238-1249.
[9] Frang, H.; Mukkala, V.M.; Syystö, R.; Ollikka, P.; Hurskainen, P.; Scheinin, M.; Hemmilä, I. Nonradioactive GTP binding assay to monitor activation of g protein-coupled receptors. Assay Drug Dev Technol, 2003, 1(2), 275-280.
[10] Volpini, R.; Marucci, G.; Buccioni, M.; Dal Ben, D.; Lambertucci, C.; Lammi, C.; Mishra, R.C.; Thomas, A.; Cristalli, G. Evidence for the existence of a specific g protein-coupled receptor activated by guanosine. ChemMedChem, 2011, 6(6), 1074-1080.
[11] Lea, W.A.; Simeonov, A. Fluorescence polarization assays in small molecule screening. Expert Opin Drug Discov, 2011, 6(1), 17-32. [12] Jameson, D.M.; Ross, J.A. Fluorescence Polarization/Anisotropy in
Diagnostics and Imaging. Chem Rev, 2010, 110(5), 2685-2708. [13] Do, E.U.; Kim, S.; Shin, J. Homogeneous fluorescence polarization
assay for high throughput screening, Pub. No.: US 2005/0130197 A1, 2005.
[14] Banks, P.; Gosselin, M. Homogeneous high throughput screening of G protein coupled receptors using fluorescence polarization. American biotechnology laboratory, 2000, 18(5), 28-30.
[15] Banks, P.; Gosselin, M.; Prystay, L. Fluorescence polarization assay for high throughput screening of G protein coupled receptors. J Biomol Screen, 2000, 5(3), 159-167.
[16] Moerke, N.J. Fluorescence Polarization (FP) Assays for Monitoring Peptide-Protein or Nucleic Acid-Protein Binding. Curr Protoc Chem Biol, 2009, 1(1), 1-15.
[17] Nosjean O.; Souchaud S.; Deniau C.; Geneste O.; Cauquil N.; Boutin J.A. A simple theoretical model for fluorescence polarization binding assay development. J. Biomol. Screen., 2006, 11(8):949-958.
[18] Didenko, V.V. DNA Probes Using Fluorescence Resonance Energy Transfer (FRET): Designs and Applications. Biotechniques, 2001, 31(5), 1106-1121.
[19] Szöllosi, J.; Damjanovich, S.; Mátyus, L. Application of fluorescence resonance energy transfer in the clinical laboratory: routine and research. Cytometry, 1998, 34(4), 159-179.
[20] Granier, S.; Kim, S.; Fung, J.J.; Bokoch, M.P.; Parnot, C. FRET-based measurement of GPCR conformational changes. Methods Mol Biol, 2009, 552, 253-268.
[21] Vilardaga, J.P. Studying ligand efficacy at G protein-coupled receptors using FRET. Methods Mol Biol, 2011, 756, 133-148. [22] Lohse, M.J.; Nuber, S.; Hoffmann, C.
Fluorescence/bioluminescence resonance energy transfer techniques to study G-protein-coupled receptor activation and signalling. Pharmacol Rev, 2012, 64(2), 299-336
[23] Albizu, L.; Cottet, M.; Kralikova, M.; Stoev, S.; Seyer, R.; Brabet, I.; Roux, T.; Bazin, H.; Bourrier, E.; Lamarque, L.; Breton, C.; Rives, M.L.; Newman, A.; Javitch, J.; Trinquet, E.; Manning, M.; Pin, J.P.; Mouillac, B.; Durroux, T. Time-resolved FRET between GPCR ligands reveals oligomers in native tissues. Nat Chem Biol, 2010, 6(8), 587-594.
[24] Harris, D.C. Quantitative Chemical Analysis, 8th ed., W. H. Freeman and Co.: New York, 2010.
[25] Ni, Q.; Zhang, J. Dynamic visualization of cellular signalling, Adv Biochem Eng Biotechnol, 2010, 119, 79-97.
[26] Szidonya, L.; Cserzo, M.; Hunyady, L. Dimerization and oligomerization of G-protein-coupled receptors: debated structures with established and emerging functions. J Endocrinol, 2008, 196(3), 435-453.
[27] Bader, J.E.; Beck-Sickinger, A.G. Fluorescence resonance energy transfer to study receptor dimerization in living cells. Methods Mol Biol, 2004, 259, 335-352.
[28] Martínez-Muñoz L.; Barroso R.; Paredes A.G.; Mellado M.; Rodríguez-Frade J.M. Methods to immobilize GPCR on the surface of SPR sensors. Methods Mol. Biol. 2015, 1272, 173-188. [29] Christopher J.A.; Brown J.; Doré A.S.; Errey J.C.; Koglin M.;
Marshall F.H.; Myszka D.G.; Rich R.L.; Tate C.G.; Tehan B.; Warne T.; and Congreve M. Biophysical Fragment Screening of the β1-Adrenergic Receptor: Identification of High Affinity Arylpiperazine Leads Using Structure-Based Drug Design. J. Med. Chem., 2013, 56 (9), 3446-3455.
[30] von Degenfeld, G.; Wehrman, T.S.; Hammer, M.M.; Blau, H.M. A universal technology for monitoring G-protein-coupled receptor activation in vitro and noninvasively in live animals. FASEB J, 2007, 21(14), 3819-3826.
[31] Inglese, J.; Johnson, R.L.; Simenov, A.; Xia, M.; Zheng, W.; Auld, D.S. High-throughput screening assays for the identification of chemical probes. Nature Chemical Biology, 2007, 3(8), 466-479. [32] McLoughlin, D.J.; Bertelli, F.; Williams, C. The A, B, Cs of
G-protein-coupled receptor pharmacology in assay development for HTS. Expert Opinion on Drug Discovery, 2007, 2(5), 603-619. [33] TrinquetE.; Fink M.; Bazin H.; Grillet F.; MaurinF.; Bourrier E.;
Ansanay H.; Leroy C.; Michaud A.; Durroux T.; Maurel D. ; Malhaire F.; Goudet C.; Pin J.P. ; Naval M. ; Hernout O.; Chrétien F.; Chapleur Y.; Mathis G. d-myo-Inositol 1-phosphate as a surrogate of d-myo-inositol 1,4,5-tris phosphate to monitor G protein-coupled receptor activation. Anal. Biochem., 2006, 358 (1), 126-135.
[34] Zhang R. and Xie X.. Tools for GPCR drug discovery. Acta. Pharmacol. Sin., 2012, 33(3), 372-384
[35] Banks, P.; Gosselin, M.; Prystay, L. Impact of a red-shifted dye label for high throughput fluorescence polarization assays of G protein-coupled receptors. J Biomol Screen, 2000, 5(5), 329-334. [36] Jones, J.W.; Greene, T.A.; Grygon, C.A.; Doranz, B.J.; Brown,
M.P. Cell-free assay of G-protein-coupled receptors using fluorescence polarization. J Biomol Screen, 2008, 13(5), 424-429. [37] Beavo, J.A. Cyclic nucleotide phosphodiesterases: functional
implications of multiple iso-forms. Physiol. Rev, 1995, 75, 725-748.
[38] Sunahara, R.K.; Dessauer, C.W.; Gilman, A.G. Complexity and diversity of mammalian adenylyl cyclases. Annu Rev Pharmacol Toxicol, 1996, 36, 461-480.
[39] Francis, S.H.; Corbin, J.D. Cyclic nucleotide-dependent protein kinases: intracellular receptors for cAMP and cGMP action. Crit Rev Clin Lab Sci, 1999, 36, 275-328
[40] Di Francesco, D. Pacemaker mechanisms in cardiac tissue. Annu Rev Physiol, 1993, 55, 455-472.
[41] de Rooij, J.; Zwartkruis, F.J.; Verheijen, M.H.; Cool, R.H.; Nijman, S.M.; Wittinghofer, A.; Bos, J.L. Epac is a Rap1 guanine-nucleotide-exchange factor directly activated by cyclic AMP. Nature, 1998, 396, 474-477.
[42] Finn, J.T.; Grunwald, M.E.; Yau, K.W. Cyclic nucleotide-gated ion channels: an extended family with diverse functions. Annu Rev Physiol, 1996, 58, 395-426.
[43] Wigdal, S.S.; Anderson, J.L.; Vidugiris, G.J.; Shultz, J.; Wood, K.V.; Fan, F. A novel bioluminescent protease assay using engineered firefly luciferase. Curr Chem Genomics, 2008, 2, 16-28. [44] Buccioni, M.; Marucci, G.; Dal Ben, D.; Giacobbe, D.; Lambertucci, C.; Soverchia, L.; Thomas, A.; Volpini, R.; Cristalli, G. Innovative functional cAMP assay for studying G protein-coupled receptors: application to the pharmacological characterization of GPR17, PUSI, 2011, 7(4), 463-468.
[45] Fan, F.; Wood, K.V. Bioluminescent assays for high-throughput screening, Assay Drug Dev. Technol., 2007, 5, 127-136.
[46] Kumar, M.; Hsiao, K.; Vidugiriene, J.; Goueli, S.A.;A bioluminescent-based, HTS-compatible assay to monitor G-protein-coupled receptor modulation of cellular cyclic AMP. Assay Drug Dev. Technol., 2007, 5, 237-245.
[47] Luttrell, L.M. G protein coupled receptor signalling in neuroendocrine systems. “Location, location, location”: activation and targeting of MAP kinases by G protein-coupled receptors. J. Mol. Endocrinol., 2003, 30, 117-126.
[48] Osmond, R.I.; Sheehan, A.; Borowicz, R.; Barnett, E.; Harvey, G.; Turner, C.; Brown, A.; Crouch, M.F.; Dyer, A.R. GPCR screening
via ERK 1/2: a novel platform for screening G protein-coupled receptors. J. Biomol. Screen., 2005, 10(7), 730-737.
[49] Peters, M.F.; Knappenberger, K.S.; Wilkins, D.; Sygowski, L.A.; Lazor, L.A.; Liu, J.; Scott, C.W. Evaluation of cellular dielectric spectroscopy, a whole-cell, label-free technology for drug discovery on Gi-coupled GPCRs. J Biomol Screen, 2007, 12(3), 312-319.
[50] McGuinness, R. Impedance-based cellular assay technologies: recent advances, future promise. Curr Opin Pharmacol, 2007, 7(5), 535-540.
[51] Fang Y. Label-Free Biosensors for Cell Biology. International Journal of Electrochemistry 2011 Volume 2011, Article ID 460850, http://dx.doi.org/10.4061/2011/460850)
[52] Fang, Y.; Ferrie, A.M.; Fontaine, N.H.; Mauro, J.; Balakrishnan, J. Resonant waveguide grating biosensor for living cell sensing. Biophys J, 2006, 91(5), 1925-1940.
[53] Li, G.; Ferrie, A.M.; Fang, Y. Label-Free Profiling of Ligands for Endogenous GPCRs Using a Cell-Based High-Throughput Screening Technology. J Lab Autom, 2006, 11, 181-187.
[54] Cooper, M. A. Optical biosensors: where next and how soon. Drug Discov. Today 2006, 11, 1061-1067
[55] Yin, H.; Chu, A.; Li, W.; Wang, B.; Shelton, F.; Otero, F.; Nguyen, D.G.; Caldwell, J.S.; Chen, Y.A. Lipid G protein-coupled receptor
ligand identification using beta-arrestin PathHunter assay. J Biol Chem, 2009, 284(18), 12328-12338.
[56] Southern, C.; Cook, J.M.; Neetoo-Isseljee, Z.; Taylor, D.L.; Kettleborough, C.A.; Merritt, A.; Bassoni, D.L.; Raab, W.J.; Quinn, E.; Wehrman, T.S.; Davenport, A.P.; Brown, A.J.; Green, A.; Wigglesworth, M.J.; Rees, S. Screening β-arrestin recruitment for the identification of natural ligands for orphan G-protein-coupled receptors. J Biomol Screen, 2013, 18(5), 599-609. [57] Kamal, M.; Marquez, M.; Vauthier, V.; Leloire, A.; Froguel, P.;
Jockers, R.; Couturier, C. Improved donor/acceptor BRET couples for monitoring beta-arrestin recruitment to G protein-coupled receptors. Biotechnol J, 2009, 4(9), 1337-1344.
[58] Doucette, C.; Vedvik, K.; Koepnick, E.; Bergsma, A.; Thomson, B.; Turek-Etienne, T.C. Kappa opioid receptor screen with the Tango beta-arrestin recruitment technology and characterization of hits with second-messenger assays. J Biomol Screen, 2009, 14(4), 381-394.
[59] Hanson, B.J.; Wetter, J.; Bercher, M.R.; Kopp, L.; Fuerstenau-Sharp, M.; Vedvik, K.L.; Zielinski, T.; Doucette, C.; Whitney, P.J.; Revankar, C. A homogeneous fluorescent live-cell assay for measuring 7-transmembrane receptor activity and agonist functional selectivity through beta-arrestin recruitment. J Biomol Screen, 2009, 14(7), 798-810.
DISCLAIMER: The above article has been published in Epub (ahead of print) on the basis of the materials provided by the author. The Editorial Department reserves the right to make minor modifications for further improvement of the manuscript.