Classe di Scienze
PhD Thesis in
Biophysical Sciences
Two-photon imaging
with fluorescent biosensors
to study neuronal activity in vivo in
physiological and pathological conditions
Candidate: Olga Cozzolino
Supervisor: Prof. Gian Michele Ratto
Pàthei màthos Eschilo
A
BSTRACT
The development of tools to allow in vivo measurement in intact neural circuitry represents a dramatic improvement in our understanding of brain activity. Understanding brain function is not only a challenging scientific quest aiming to disentangle the functional relationship among the electro-chemical dynamics in the brain with the cognitive and behavioral outputs, but it’s also a clinically crucial endeavor toward the study, diagnostics, treatment, and intervention of neurological diseases. Since the advent of laser scanning microscope has allowed for biological structures to be imaged at the theoretical limits of resolution predicted by Abbe, in vivo imaging poses significant and unique optical challenges beyond simply providing an enlarged view of a specimen. Two-photon laser scanning fluorescent microscopy has become the imaging standard for in vivo imaging due to its ability to obtain high signal-to-noise dynamic images while inducing minimal damage to the sample of interest. At the same time the development of fluorescent protein-based biosensors has been crucial for life science research. The information obtained through brain imaging facilitate both functional interpretation and medical advancements toward addressing neurological diseases. While this method provides unique merits in studying brain activities, it also accompanies certain pitfalls that prevent the technique to dominate. Complementary to optical neuroimaging is electrophysiology, through which electric signals in the brain can be detected and related to neuronal and cortical functions. Different approaches often requires appropriatedata analysis to reveal the complexity of the mechanisms we are dealing with.
Here I present the development of two techniques that allow to explore different aspects of neuronal computation.
In Chapter 1, “Does High GABA always mean High Inhibition?” I present a tool for in vivo measurement of intracellular chloride concentration as a proxy for the understanding of inhibitory capability of the neural circuits during development and during day cycles in mice.
In Chapter 2, “Statistically-based approach: a new way to study epilepsy in Zebrafish” I introduce a novel approach to exploit the complementarity of calcium imaging and electrophysiology to better understand conditions associated to hyperexcitability such as epilepsy.
T
ABLE OF
C
ONTENTS
1.1 Does high GABA always mean high inhibition?...7
1.1.1 Chloride Homeostasis………..………8
1.1.2 . Development of GABAergic system………..9
1.1.3 Diurnal Variation of GABAergic system ... 10
1.1.4 Measuring Chloride ... 11
1.1.4.1 ClopHensor ... 13
1.2. Results……….………..………17
1.2.1 Developmental Decrease of the Intraneuronal Chloride Concentration. ... .17
1.2.2 Diurnal Oscillation Of Intraneuronal Chloride ... 21
1.3 Concluding remarks……….………..24
1.4 Materials and Methods………..………28
1.5 References ……….………....39
2.1 A new method to study epilepsy in Zebrafish: a statistically-based approach ……….…49
2.1.1 Zebrafish as a model for human disorders ... 50
2.1.2 Epilepsy ... 51
2.1.2.1 General aspects and epidemiology ... 51
2.1.2.2 Zebrafish as a model to study epileptic seizures and epilepsy syndromes . 52 2.1.2.3 PTZ model ... 53
2.1.2.4 EAST Syndrome model ... 53
2.1.3 Detection of epileptic activity in zebrafish: status of the art ………54
2.2. Results……….………..………57
2.2.1 Statistical analysis of LFPs. ... 57
2.2.2 Combined LFP recording and calcium imaging. ... 61
2.2.3 Spatio-temporal evolution of calcium activity ... 62
2.2.4 Can we localize the sources of the LFP? ... 72
2.2.5 Valproate treatment attenuates seizures in morphant kcnj10a ... 76
2.3 Concluding remarks……….………..78
2.4 Materials and Methods………..………..……….81
7 | D o e s H i g h G A B A a l w a y s m e a n H i g h I n h i b i t i o n ?
1.1 I
NTRODUCTION
DO E S HI G H G A B A A L W A Y S M E A N
HI G H IN H I B I T I O N?
Intracellular chloride ([Cl−]
i) and pH (pHi) are fundamental regulators of
neuronal excitability. They exert wide-ranging effects on synaptic signaling and plasticity and on development and disorders of the brain. The ideal technique to elucidate the underlying ionic mechanisms is quantitative and combined two-photon imaging of [Cl−]
i and pHi, but this has never been
performed at the cellular level in vivo. Here we use a genetically encoded fluorescent sensor that includes a spectroscopic reference (an element insensitive to Cl− and pH) together with a correction strategy for the
distortion of the fluorescent signal due to the optical properties of the brain. We investigate in mouse models, two different biological processes in which chloride could exert a regulatory role on the neuronal activity. Firstly, parallel measurements of [Cl−]
i and pHi at the single-cell level in the mouse
cortex showed the in vivo presence of the widely discussed developmental fall in [Cl−]
i and the role of the Na/K-Cl cotransporter NKCC1 in the
maintenance of high [Cl−]
i in immature neurons. pHi does not show an
involvement in development process. Then, our tool allows to study the trend of [Cl−]
i along the daytime detecting the presence of an oscillation of
chloride levels indicating the necessity to reevaluate the mechanisms of modulation of brain processing.
8 | D o e s H i g h G A B A a l w a y s m e a n H i g h I n h i b i t i o n ?
1.1.1 C
HLORIDE
H
OMEOSTASIS
Intracellular ion concentrations are controlled by plasmalemmal transporters and channels, which generate and dissipate ionic electrochemical gradients, respectively 1. In recent years, regulation of the
intracellular Cl- concentration ([Cl-]
i) in neurons has attracted lots of
attention, because it is the main ion that carries current across GABAA (and
also, glycine) receptors and it has become increasingly clear that the resulting effects on the postsynaptic cell can be either inhibitory or excitatory 2. Activation of GABA
A receptors leads to opening of channels
that are permeable to HCO3- and Cl-. Under physiological conditions, the
corresponding currents have a reversal potential (EGABA) close to the
neuronal resting potential (Fig.1.1.1).
Fig.1.1.1 GABAergic Action in relationship with [Cl-]
i.
The red curve shows the Nernst potential for chloride as a function of [Cl-]
i. The gray rectangle shows the
threshold values of membrane potential for the opening of the voltage-dependent sodium channels. The black rectangle shows the chloride values in which overlap with the threshold potential for the activation of voltage-dependent sodium channels.
9 | D o e s H i g h G A B A a l w a y s m e a n H i g h I n h i b i t i o n ?
Changes in [Cl-]
i exert an immediate effect on the reversal potential of
GABAergic currents (EGABA) and, thereby, on the properties of GABAA
receptor-mediated transmission 3–5. The “ionic plasticity” of GABAergic
signaling involves not only the passive flux of Cl- ions through membrane
channels but also, a number of ion transporters that regulate [Cl-] i.
Furthermore, this mechanism is under the control of intracellular signaling cascades that regulate the expression patterns as well as functional properties of ion transporters and channels 6,7.
1.1.2 D
EVELOPMENT OF
GABA
ERGIC SYSTEM
With regard to long-term ionic modulation of GABAergic transmission, a case in point is the decrease in [Cl−]
i that is generally thought to take place
during maturation of most central neurons. According to this widely accepted scenario, the Na-K-2Cl cotransporter NKCC1 accumulates Cl− in
immature neurons, thereby promoting depolarizing GABA responses 4,8,9
during embryonic and early postnatal life. The perinatal period is followed by developmental up-regulation of the neuron-specific K-Cl cotransporter KCC2 that is required for the generation of classical hyperpolarizing inhibitory postsynaptic potentials (IPSPs) 10.
A wealth of electrophysiological evidence dating back to the work in vivo by Eccles and coworkers 11 has provided evidence for active regulation of
[Cl−]
i in mammalian central neurons and its crucial effect on the driving
force of Cl− in inhibitory synapses 1. However, thus far, there are no direct
data on neuronal [Cl−]
i measured in vivo at the single-cell level in the living
10 | D o e s H i g h G A B A a l w a y s m e a n H i g h I n h i b i t i o n ?
[Cl−]
i described above has been intensely debated 12 because of the lack of
such measurements. Moreover, it has been postulated that, in some diseases, such as autism and Down syndrome, the ion-regulatory mechanisms underlying GABAA signaling do not properly mature 12–16, and EGABA can
revert from hyperpolarizing to depolarizing in mature neurons as has been reported for epilepsy and stroke 4,17,18. Thus, a technique for monitoring
[Cl−]
i in vivo would substantially add to our understanding of Cl−-regulatory
mechanisms and their roles in brain development, plasticity, and disease. The need for an imaging-based method has long been recognized, and several fluorescent sensors have been designed for this purpose 19; however,
no reliable data have been obtained so far.
1.1.3
D
IURNAL
V
ARIATION OF
GABA
ERGIC SYSTEM
Mammals manifest circadian behavior timed by an endogenous clock 20.
Considerable progress has been made in identifying the molecular basis of the circadian clock 21,22, but the mechanisms by which it is translated into
cyclic firing activity, high during the day and low at night in diurnal animals, and the other way around in nocturnal animals, are still poorly understood. The SNC is known as the central circadian pacemaker 23 and
there are evidences indicating that GABA plays a role in circadian time-keeping acting in suprachiasmatic nuclei (SCN) even if the in vitro conditions of the experiments complicate the interpretation of the underlying mechanism 24–26. Actually there is no clear convergence in
literature about the degree of the involvement of GABAergic system in the modulation of SCN activity 27 and there is no evidence about a diurnal
11 | D o e s H i g h G A B A a l w a y s m e a n H i g h I n h i b i t i o n ?
1.1.4
M
EASURING
C
HLORIDE
Several studies 28–31 produced important insights in the field of chloride
modulation in neurons by measuring the reversal potential of the GABAA
current, rather than by directly measuring the concentration. Although measuring reversal potential has long been the only viable method to evaluate the Chloride currents, its interpretation is controversial. Indeed we must consider that measurements of the reversal potential provide an imperfect estimate of intracellular chloride because the GABAergic current contains a bicarbonate component, which represents about 20% of the current flowing through GABAA conductance 32; [Cl-]i can be affected by
the pipette content unless recording is performed in the perforated patch configuration which is characterized by an inherently larger and more variable access resistance; measurements of the reversal potential of the GABAergic current in vivo is extremely challenging and labor-intensive. Chloride imaging in the brain allows the temporally and spatially resolved measurement of ionic concentration that is not deductible in any way from electrophysiological data. The earliest indicators for chloride imaging were synthetic dyes 33 capable of sensing chloride variation with the mechanism
of dynamic quenching of the sensor fluorescence due to the collision of the molecular dye with the chloride ion. Their fluorescence intensity does not depend only on the chloride concentration but also on the dye concentration and on the optical thickness of the location. For some of this dyes 34, if the
concentration of chloride is high enough that the mean interval between collisions is shorter than the mean lifetime of fluorescence, the observed lifetime of the dye is shortened with increasing concentration of chloride. The consequence of this is that the measurement of the fluorescence
12 | D o e s H i g h G A B A a l w a y s m e a n H i g h I n h i b i t i o n ?
lifetime, in this conditions provides an absolute measure of chloride concentration that is free from the influence of sensor concentration. Subsequently GFP-based chloride probes 35,36, as with all genetically
encoded sensors, show key advantages over chemical probes since they can be targeted conditionally to specific cell types and to specific sub cellular compartments, they are retained within cells allowing chronic repeated measurements in vivo and the thermodynamic and kinetic parameters for chloride binding to GFP-based probes are concentration independent leading to more robust estimates of the calibration parameters.
The first ratiometric YFP-based chloride biosensor was Clomeleon 37 and it
is based on the mechanism of fluorescence resonance energy transfer (FRET) between two fluorescence proteins. Clomeleon is unfortunately characterized by a few but significant limitations. Its chloride affinity is far from physiological [Cl-]i and its signal displays substantial and complicated
pH-dependence. An uncontrolled influence of pH on the fluorescent properties of the sensor is particularly unwanted for chloride detection since GABAA receptors are permeable also to bicarbonate 32 leading to an
intracellular pH modulation coupled with chloride fluxes. These sensor underwent to additional modifications that enhanced the affinity for chloride 38 and enhance stability and brightness of both fluorescent protein 39. Unfortunately they remain highly dependent on pH changes constituting
a problem in the measure especially when shifts in intracellular pH are expected such as during intense synaptic activity or epileptiform activity 40.
13 | D o e s H i g h G A B A a l w a y s m e a n H i g h I n h i b i t i o n ?
1.1.4.1
C
LOPH
ENSORIn this study, we exploit a probe, LSSmClopHensor (Fig. 1.1.2), formed by the fusion of a Cl-- and pH-sensitive GFP mutant (E2GFP) with an
ion-insensitive red fluorescent protein, LSSmKate2 41. This sensor shows pH
dependency of the chloride measurement like the other Cl- biosensors but
we exploit it as an opportunity that allows the simultaneous measurement of both ions in the intracellular environment. The fact that LSSmClopHensor reports quantitative changes in both [Cl-]
i and
intracellular pH (pHi) is highly advantageous, because regulation of Cl- and
H+/HCO
3- is tightly linked via common transport 42,43 and channel4
mechanisms. Furthermore, pHi is also a powerful ionic modulator of
neuronal excitability 40,42,44,45.
Fig. 1.1.2 Schematic structure and mechanism of the Sensor
Genetic (a) and proteic (b) structure of LSSmClopHensor. The green fluorescent protein E2GFP and the red fluorescent
protein, LSSmKate2 are fused by a flexible 20-amino-acid linker. H+ binding makes Cl
-binding site available and the subsequent anion binding to E2GFP induces static
quenching of its green fluorescence. The red fluorescence is used as a reference.
14 | D o e s H i g h G A B A a l w a y s m e a n H i g h I n h i b i t i o n ?
EGFP-T203Y, also known as E2GFP, is a highly accurate ratiometric pH
biosensor with a pKa = 6.81 ±0.05 at 37°C and Cl- dissociation constant of
the fully protonated form of the sensor 𝐾 = 13.1 ± 0.5 mM46 (Fig. 1.1.3).
The chloride 𝐾 dependence on pH was thoroughly examined 47 revealing
cooperative binding of chloride and protons that can be mathematically expressed as follows:
𝐾 = 𝐾 1 + 10 10
where 𝐾 is the chloride 𝐾 the proton-ligated form of E2GFP, and pK a is
Fig. 1.1.3 Cl- Comparison of dissociation constant as a function of pH for the indicated chloride biosensors.
Shaded areas indicate the different range of values of the dissociation constant for chloride at physiological pH. Based on Bregestovski and Arosio, 201148.
the logarithm of the association constant of proton to chloride-free E2GFP.
The two-photon spectroscopic properties of LSSmClopHensor are determined as a function of pH and [Cl-]. The sensor calibration is one of
15 | D o e s H i g h G A B A a l w a y s m e a n H i g h I n h i b i t i o n ?
the most critical aspects for measuring absolute changes in [Cl-] i. The
16 | D o e s H i g h G A B A a l w a y s m e a n H i g h I n h i b i t i o n ?
Fig. 1.1.4 Differential field illumination
Image sequence of a homogeneous solution of Rhodamine6G obtained with the two-photon microscope at the indicated wavelengths in the two channels (ChG=green channel, ChR=red channel) using two different optical zoom (Z1, Z2) using 20x objective, 1.00 N.A., Olympus
17 | D o e s H i g h G A B A a l w a y s m e a n H i g h I n h i b i t i o n ?
1.2
R
ESULTS
1.2.1
D
EVELOPMENTAL
D
ECREASE OF THE
I
NTRANEURONAL
C
HLORIDE
C
ONCENTRATION
.
(Reference: “Simultaneous two-photon imaging of intracellular chloride concentration and pH in mouse pyramidal neurons in vivo.” Sulis Sato S*, Artoni P*, Landi S*, Cozzolino O*, Parra R, Pracucci E, Trovato F, Szczurkowska J, Luin S, Arosio D, Beltram F, Cancedda L, Kaila K, Ratto GM. Proc Natl Acad Sci U S A. 2017 Oct 10;114(41):E8770-E8779. doi: 10.1073/pnas.1702861114. Epub 2017 Sep 26)
With the following experiments we address the question whether a developmental decrease in [Cl−]
i, akin to that shown in numerous studies
based on in vitro measuring of reversal potential (see 1.1.4 MEASURING CHLORIDE), also takes place during the maturation of cortical neurons in vivo. We, at first, studied mice at two stages of development [P4–P5 (n=9 mice, 182 neurons) and P18–P51 (n=5 mice, 226 neurons)] under light urethane anesthesia. From the excitation spectra for E2GFP and LSSmKate2, we obtained the Cl− and pH maps, as shown in Fig. 1.2.1c and
d.
This analysis was limited to the cell bodies, because most of the corresponding in vitro data are based on somatic measurements and also because the cell body provides a better signal-to-noise ratio for ion imaging than the dendrites. While no large age-dependent change in neuronal pHi
19 | D o e s H i g h G A B A a l w a y s m e a n H i g h I n h i b i t i o n ?
The high [Cl−]
i in immature neurons is generally thought to be maintained
by Cl− uptake via NKCC1 (see Introduction and Fig 1.2.2a). The pups in
this age group are large enough to enable implanting them with a perforated optical window that could be micro-perfused with bumetanide. Consistent with data obtained in vitro, superfusion of the cortex of P4–P5 mice with saline containing the NKCC1 inhibitor bumetanide (55 μM) resulted in a pronounced decrease of median [Cl−]
i to 21 mM (IQR 22 mM; five mice,
n=381 neurons) (Fig. 1.2.2c). Application of the vehicle only had no discernible effect on [Cl−]
i (53 mM; IQR 38 mM; four mice, n=126
neurons).
Next, we studied mice at the intermediate stage of development P8–P10 (n=8 mice, 512 neurons) under the same condition. The median level of [Cl−]
i of 40 (IQR45) mM stands in the middle of the two previous
distributions. Interestingly the Fig. 1.2.3a shows that the P8–P10 group (gray curve) has a large variability, which might be because of the presence of both immature and more mature neurons, leading to a mosaicism with regard to neurons with low and high [Cl−]
20 | D o e s H i g h G A B A a l w a y s m e a n H i g h I n h i b i t i o n ?
In four mice at P8–P10 (n=166 neurons), we imaged the same neurons before and after bumetanide to establish whether a high initial value of [Cl−]
i (reflecting cellular immaturity) would be predictive of a larger effect
of the NKCC1 blocker. Fig. 1.2.3b-d show that the treatment caused a shift of[Cl−]
i toward lower values in each individual neuron and that, indeed, the
amplitude of the shift correlated with the initial chloride level.
Fig. 1.2.2 A high intracellular chloride concentration is maintained by the NKCC1 cotransporter in immature neurons. a Schematic representation of the inhibitor action of bumetanide in immature neuron Effect of local application of the NKCC1 inhibitor bumetanide on [Cl−]
i should cause a reduction of intracellular chloride, indicating that the high [Cl−]i in new born
mice is maintained by the operation of NKCC1. b The experiment was performed with the perfusion of visual cortex in electroporated P5 mice c Superimposed distributions of [Cl−]i at P4–P5 under control conditions (area under magenta curve; vehicle, four mice) and after treatment with bumetanide (area under green curve; seven mice, Kolmogorov–Smirnov test, P<0.001).
21 | D o e s H i g h G A B A a l w a y s m e a n H i g h I n h i b i t i o n ?
1.2.2
D
IURNAL
O
SCILLATION OF
I
NTRANEURONAL
C
HLORIDE
We performed experiments on mice, kept in condition of 12:12 h light:dark, measuring the [Cl-]i in the visual cortex in different time of the day.
The experiment shows the different scenarios of [Cl-]
i distribution
characterizing the visual cortex of P20-P30 mice (Fig. 1.2.4) in four different time of the day [at ZT2 (n=5 mice, 159 neurons), at ZT5 (n=6
Fig. 1.2.3 A high intracellular chloride concentration is maintained by the NKCC1 cotransporter in immature neurons. a Distributions of values of [Cl−]
i in eight mice at P8–P10
(gray curve) in comparison with distribution of P4–P5 and P18–P51 mice (magenta and blue curve respectively). Note the large variability of chloride values assumed in the intermediate age groups. b Paired imaging before and 40 min after superfusion with bumetanide in a P9 mouse. The same cells were imaged before and after the administration of bumetanide through a tiny perforation of the imaging chamber. All cells in thefield displayed a decrease in [Cl−]
i. (Vertical scalebar: 25 μm.)
c Scatterplot showing the concentration of all cells recorded before and after bumetanide (Bume) treatment. Different symbols refer to four different mice. The majority of cells fall under the line, which has a slope of one, indicating that the treatment caused a decrement of [Cl−]
i. d The size of
the drop of [Cl−]
22 | D o e s H i g h G A B A a l w a y s m e a n H i g h I n h i b i t i o n ?
mice, 374 neurons), at ZT12 (n=7 mice, 390 neurons) and at ZT16 (n=5 mice, 285 neurons)]. Time in hours is denoted by ZT because light acts as a zeitgeber. ZT0 refers to the beginning of daylight and ZT12 is the beginning of night.
Values of [Cl−]
i at ZT5 (median [Cl−]i = 9.3 mM) and at ZT16 (median [Cl−]i = 19.4 mM) show the largest difference (Mann-Whitney test, P=0.03). On
the other hand at ZT2 (median [Cl−]
i = 17.5 mM) and at ZT12 (median [Cl−]i = 8.5 mM) the neuronal population within the cortex shows a larger
variability that could reflect a period of transition between two different states.
Fig. 1.2.4 Intracellular chloride concentration is a function of the circadian rhythm. a Images of three different visual cortices acquired in three different time of the day b Distributions of values of [Cl−]
i in twenty three mice at P20-30 divided in four groups according to the time of the
day cycle (ZT2, ZT5,ZT12, ZT16). The large difference of [Cl−]
i occurs between the two groups at
ZT5 and at ZT16 respectively (Mann-Whitney test, P=0.03). c Distribution of the pHi in the same mice of panel b. Time in hours is denoted by ZT because light acts as a zeitgeber. ZT0 refers to the beginning of daylight and ZT12 is the beginning of night.
23 | D o e s H i g h G A B A a l w a y s m e a n H i g h I n h i b i t i o n ?
No large time-dependent change in neuronal pHi was detected as shown by
the median and IQR (pHi IQR 7.22–0.05 at ZT2, 7.23-0.02 at ZT5,
7.27-0.07 at ZT2 and 7.28-0.08 at ZT16).
Prompted by these results we tested the hypothesis that the responsible for the diurnal variation of[Cl−]
iis the differential activity of the main regulator
of chloride homeostasis, the two cotransporters NKCC1 and KCC2. We compare the paired measurement before and after the treatment with the NKCC1 blocker, bumetanide. Interestingly the effect of the drug, that is really small at the ZT5 (36 neurons), turned out to reduce [Cl−]
i at ZT16 (69
neurons) when physiological chloride values are higher (Fig. 1.2.5) indicating a differential influence of NKCC1 activity in the determination of intracellular chloride level.
Fig. 1.2.5 NKCC1 activity involved in the circadian regulation of Cl− homeostasis in adult mice
a Paired imaging before and 40 min after superfusion with bumetanide in a P24 mouse at 22.30 b Boxplots showing the drop of [Cl−]
i after superfusion with bumetanide in P22-24 mice in two different
time of the day (12.00, 22.30). The effect of bumetanide is consistent at 22.30 while shows small effect at 12.00 (Mann-Whitney test, P=10-7). Time in hours is denoted by ZT because light acts as
24 | D o e s H i g h G A B A a l w a y s m e a n H i g h I n h i b i t i o n ?
1.3
C
ONCLUDING REMARKS
The main inhibitory synaptic receptors, gated by GABA, are Cl-conducting
channels. Consequently, GABAergic signaling is extremely sensitive to changes in the chloride electrochemical gradient. GABAergic activity dictates the neuronal firing range and timing, which in turn influences the rhythms of the brain, synaptic plasticity, and the flow of information in neurons 50–53. Intracellular Cl- is, therefore, ideally placed to be a regulator
of neuronal activity. Despite the extensive electrophysiological data obtained in vitro, which are supported by a wide range of molecular biological studies on the expression patterns and properties of NKCC1 and KCC2 4,5, the presence of the ontogenetic decrease in [Cl-]
i, and the
consequent shift in EGABA, have been and are still being debated 12. A key
element in this debate is the absence so far of direct in vivo demonstration of the Cl-shift. In this study we provide direct evidence for this developmental phenomenon. Our imaging data, based on a total of ∼900 individual pyramidal neurons in three age groups, show a robust fall in somatic [Cl-]
i from P4-P5 to P8-P10, with a further decrease to mature
levels at P18-P51. The validity of our data is further corroborated by the large decrease in [Cl-]
i caused by bumetanide, a potent blocker of the
Cl-uptake transporter NKCC1. The effect of bumetanide was clearly seen both at the population level and in individual neurons. Regarding the latter, bumetanide had a more pronounced effect on [Cl-]
25 | D o e s H i g h G A B A a l w a y s m e a n H i g h I n h i b i t i o n ?
neurons with a high steady-state chloride level, which indicates a higher basal activity of NKCC1. These data are in agreement with a recent in vivo study on intraneuronal Ca2+ imaging, which reports the presence of
bumetanide-sensitive depolarizing actions of GABA in occipital cortical neurons in P3-P4 mice 9. The median estimate of the mature somatic [Cl-]
i
corresponds to an ECl of -55 mV in the P18-P51 age group, which is
somewhat more positive than one would expect on the basis of currently available electrophysiological data on EGABA 4. Here, we would like to note
that the electrophysiological measurements have been typically done in quiescent tissue in vitro (i.e., in the absence of a significant activity-dependent Cl-load that must be present even under physiologically normal in vivo conditions). Another factor worth recalling is that, because of neuronal pHi regulation, the intracellular concentration of bicarbonate leads
cfety-26 | D o e s H i g h G A B A a l w a y s m e a n H i g h I n h i b i t i o n ?
What has been missing, though, is a detailed, real-time monitoring of [Cl-] i
dynamics, across populations of neurons in normal physiological brain states. Our biotechnological tool allowed to highlight a substantial [Cl-]
i
heterogeneity within neocortical populations, superimposed on a coordinated diurnal rhythm. The data reveal an oscillation of neuronal profile that is characterized by high levels of intracellular chloride during the dark phase when mice, as nocturnal creatures, are mostly active. [Cl-]
i
reaches its minimum in the middle of the light phase suggesting a higher inhibitory effect of GABA within the circuitry during the resting state of the mouse. Interestingly this could be an explanation for the changes in cortical excitability during daytime 58. Although [Cl-]
i is a function of the fluxes
through a large number of proteins we formerly focused on the activity of the main chloride intruder NKCC1. The differential effect of the drug on [Cl-]
i in function of the diurnal cycle allow us to deduce the importance of
the co-transporter in the observed physiological oscillation in adult mice through a different activity rate respect with the main opposing activity of the KCC2 co-transporter. Because of the time scale of the phenomenon it is likely that this regulation is based on transcriptional and/or post-translational processes that modify the activity of at least one of the two main co-transporters 6,59. The presence of a chloride pattern across the
network determines another variable that define different cortical brain states. These dynamism in chloride regulation is predicted to have a huge impact throughout neuroscience, including a change in the understanding of brain activity patterns and information processing and the clinical management of functional neurological conditions 60–62. Indeed, cortical
excitability increases have been associated with chronic insomnia 63 and
27 | D o e s H i g h G A B A a l w a y s m e a n H i g h I n h i b i t i o n ?
consciousness 66. Combinations of increases and decreases have been
reported in neurodegeneration 67, depression 68,69, possibly depending of the
type and the stage of the disorder, as well as on time of day. Whether these abnormalities are sustained over the entire 24 h sleep-wake cycle or are only transient is unclear even if there are some interesting association as a time-of-day-variation in the occurrence of seizures well established in certain forms of epilepsy 70.
28 | D o e s H i g h G A B A a l w a y s m e a n H i g h I n h i b i t i o n ?
1.4
M
ATERIALS AND
M
ETHODS
Animals and Procedures for in Vivo Imaging.
LSSmClopHensor was transduced by in utero electroporation in CD-1 mice at embryonic day 15.5 to transfect neuronal progenitors of layer 2/3 pyramidal neurons of the visual cortex 71 Before imaging, mice were
anesthetized with an i.p. injection of urethane (1-1.5 g/kg). Craniotomy (2- to 3-mm diameter) was performed and the dura mater was removed to reduce light scattering 72. A custom made steel head post with a central
imaging chamber was glued to the skull. Animals were housed in cages with light controlled by a timer. The control day-length condition was defined by the equinox light–dark ratio (12:12 h light:dark). Time in hours is denoted by ZT because light acts as a zeitgeber. ZT0 refers to the beginning of daylight and ZT12 is the beginning of night. This study was performed in strict accordance with the recommendations of the Italian Ministry of Health (Dlg. 26/14) and according to protocol 277/2015-R approved by the Ministry of Health on April 23, 2015.
In Utero Electroporation
Tripolar in utero electroporation targeting pyramidal neurons of the visual cortex was performed as previously described 71,73. Timed pregnant CD1
mice (strain code 022; Charles River) were anesthetized at E15.5 with isoflurane (induction, 4%; surgery, 2%), and the uterine horns were exposed by laparotomy. Expression vectors (1–3 μg/μL in water) and Fast Green dye (0.3 μg/μL; Sigma-Aldrich) were injected (5–6 μL) through the uterine wall into one of the embryo’s lateral ventricles by a 30-gauge needle. While the
29 | D o e s H i g h G A B A a l w a y s m e a n H i g h I n h i b i t i o n ?
embryo’s head was carefully held between standard forceps-type circular electrodes (5-mm diameter; negative poles; Nepa Gene), a third electrode (5 × 3 mm; positive pole) was positioned on the back of the head. Six electrical pulses (amplitude, 30 V; duration, 50 ms; intervals, 1 s) were delivered with a square-wave generator (CUY21EDIT; Nepa Gene or BTX ECM 830; Harvard Bioscience). The uterine horns were returned into the abdominal cavity, and embryos continued their normal development until delivery.
Solutions.
The composition of the sterile saline solution was 126 mM NaCl, 3 mMKCl, 1.2 mM KH2PO4, 1.3 mM MgSO4, 26 mM NaHCO3, 2.4 mM CaCl2, 15
mM glucose, and 10 mM Hepes, pH 7.4. A 4-μL aliquot of bumetanide stock solution (50 mg/mL in DMSO) was sonicated in 10 mL of saline, and a bolus of a few microliters was applied on the cortex before sealing of the imaging chamber.
Bleed-Through Correction for LSSmClopHensor.
Fig. 1.4.1 shows the two-photon excitation spectra of purified LSSmClopHensor obtained by providing the same number of photons at each wavelength. As expected, the spectra measured in the green channel strongly depend on pH. The pH dependency was also observed in the red channel as a result of bleed through of the E2GFP emission.
30 | D o e s H i g h G A B A a l w a y s m e a n H i g h I n h i b i t i o n ?
The magnitude of bleed through was determined by purifying separately the proteins composing the sensor (E2GFP and LSSmKate2) and by measuring
their fluorescence in both emission channels (Fig. 1.4.1b). These data provided the coefficients α(λ) and β(λ) that describe the cross-talk between the emission channels (Fig. 1.4.1c). The fluorescence of E2GFP and
LSSmKate2 corrected for bleed through is given by the following system of linear equations:
[1]
Fig.1.4.1 Raw excitation spectra of LSSmClopHensor and fluorescence bleed through between the acquisition channels. a Spectra have been obtained from purified protein in aqueous solution imaged under the two-photon microscope. Data have been normalized at the value of the red fluorescence at 910 nm. The red fluorescence showed an apparent dependency on pH. The symbols indicate the wavelengths at which the spectra have been sampled, and they have been omitted in most traces for clarity. The non-labeled spectra of LSSmClopHensor have been obtained at pH values of 6.4, 6.8, 6.9, 7.0, 7.1, 7.2, 7.4, and 7.6. b Emission spectra of E2GFP and
LSSmKate2 depend on the wavelength of two-photon excitation. The green and red rectangles show the bandwidth of the emission filters of our imaging setup (G: 525/70 nm; R: 607/45 nm). E2GFP
shows only a modest change of the emission spectrum, which falls mostly inside the G detection channel. For clarity, only the extremes of the spectra (excitation 800 and 1,000 nm) are shown. In contrast, LSSmKate2 shows a drastic increase of fluorescence emitted in the G detection channel for wavelength shorter than 850 nm. c The bleed-through coefficients α and β have been derived by measuring the fluorescence of each protein in the green and red channels. As expected from the emission spectra, β is quite constant, while α has a strong dependency on excitation below 850 nm.
31 | D o e s H i g h G A B A a l w a y s m e a n H i g h I n h i b i t i o n ?
where Graw and Rraw label the fluorescence measured in the green and red
channels (after background subtraction and flat correction), and G*and R* indicate the fluorescence that originates from E2GFP and LSSmKate2,
respectively. LSSmClopHensor is characterized by the absence of intra-molecular FRET, since LSSmKate2 has a very large Stokes shift: its peak of absorption (460 nm) is much bluer than the emission peak of E2GFP
(530 nm). To compare the sensor spectra obtained at different pH values, we had to consider that different samples had slightly different protein concentrations. Since the optical properties of LSSmKate2 are not influenced by pH, we normalized each spectrum at the peak of R*, and this normalization is used through the study. Measurement of pH and Calibration of LSSmClopHensor. The excitation spectrum of LSSmClopHensor at a given pH, G*pH(λ), can be described as the linear
combination of the protonated (G*6.0) and deprotonated (G*8.0) spectra
according to the equation:
[2] This is a set of n equations, where n is the number of wavelengths at which spectra are sampled. If n=2, the system can be solved analytically according to the standard ratiometric analysis. A larger set of excitation wavelengths provides a result that is less sensitive to errors, and δ and ε can be determined by minimizing the sum of the residues R defined as
[3]
The size of the residue is an indicator of the quality of the fit. We applied this procedure to the dataset of Fig. 1.4.2a: for each spectrum, we
32 | D o e s H i g h G A B A a l w a y s m e a n H i g h I n h i b i t i o n ?
determined δ and ε. Fig. 1.4.2b shows the decomposition of the E2GFP
spectrum. A calibration curve can be obtained by the relationship between the polar angle θ=atan(ε /δ) (Fig. 1.4.2c) and the pH of the fitted spectra.
The calibration is fitted with the following sigmoidal function:
[4] where pKa is the affinity for H+. Table 1.4.1 shows the values of the fit
parameters (θR, θL, pKa, and a) at three different temperatures (24 °C, 31 °C
and 36 °C).
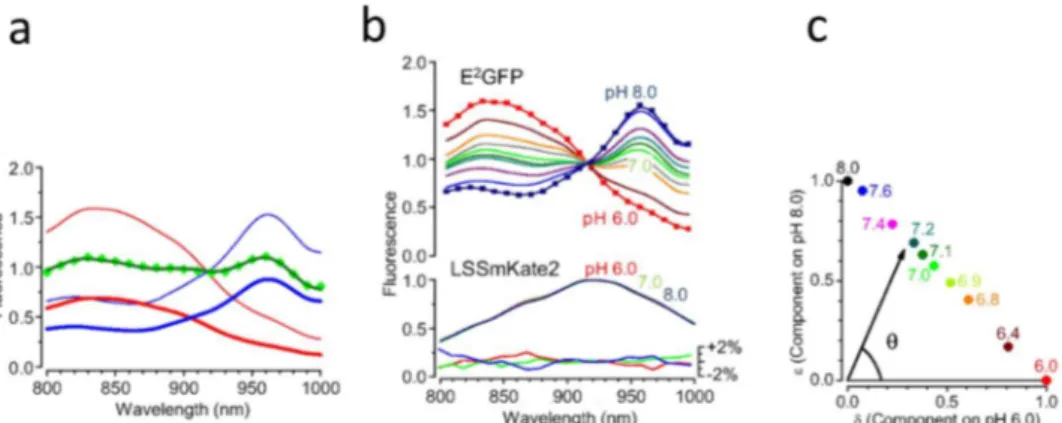
Fig 1.4.2 Two-photon spectra of LSSmClopHensor in aqueous solution. a Excitation spectra of the E2GFP and LSSmKate2 components of LSSmClopHensor at different levels of pH at 24 °C.
Data have been corrected for bleed through and normalized using the peak of the LSSmKate2 emission. The non labeled spectra of E2GFP have been obtained at pH 6.4, 6.8, 6.9, 7.1, 7.2, 7.4,
and 7.6. The excitation spectrum of LSSmKate2 is pH-insensitive: Lower shows the normalized difference (percentage) between the spectra obtained at pH values of 6, 7, and 8, with the mean spectrum averaged for all pH levels. b Linear decomposition of the spectrum obtained at pH 7.0 (green symbols) on the spectra obtained at pH 6.0 and 8.0 (thin red and blue lines, respectively). The two components are represented by the thick red and blue curves, respectively, and their sum is the line running through the experimental points. c The color-coded circles represent the corresponding coefficients in the linear decomposition of the spectra of the set of calibration solutions shown in a. The ratio between the components provides the angle θ, which is specific for each value of pH. The error bars are contained within the symbol size.
33 | D o e s H i g h G A B A a l w a y s m e a n H i g h I n h i b i t i o n ?
The corresponding functions are reported in Fig. 1.4.3. The calibrations were repeated periodically, and they showed only minimal changes. Computation of the Intracellular Chloride Concentration.
Since Cl- binds solely to the protonated form of E2GFP, only a fraction of
the sensor fluorescence depends on [Cl-]i, and this fraction in turn depends
on pH. This is summarized by the following equation 47
[5] where 13.1 mM is the Cl-affinity for fully protonated E2GFP 74, and the
term on the right is the inverse of the fraction of non-protonated sensor (i.e., the fraction that is Cl-insensitive). Finally, [Cl-]
i is given by
[6]
Table 1.4.1. Values of the parameters describing LSSmClopHensor dependency on pH and chloride concentration at three different temperatures (n = 3 at each temperature).
34 | D o e s H i g h G A B A a l w a y s m e a n H i g h I n h i b i t i o n ?
where r(0) is the ratio between the fluorescence of E2GFP and LSSmKate2
measured at the isosbestic point when [Cl-]
i =0 (Table 1.4.1). The term r(Cl)
is the same ratio measured at a given [Cl-]i.
In Vivo Two-Photon Imaging.
In vivo two-photon imaging was performed on a Prairie Ultima Multiphoton microscope equipped with two mode-locked Ti:Sapphire lasers (Coherent Chameleon Ultra II and Coherent Verdi-Mira). For each field, a set of images was acquired at different excitation wavelengths (ranging in number from 5 to 11). Acquisitions were performed with the water immersion lens (20×, 1.00 N.A.; Olympus) at a resolution of 512×512 pixels and at zoom 2, leading to a field of 300×300μm and a linear resolution of 0.2 μm per
Fig. 1.4.3 Dependency of LSSmClopHensor calibration on temperature. a Excitation spectra at pH 6.0 and 8.0 (peaks at about 840 and 960 nm, respectively) for three different temperatures as indicated in the labels. Notably, the temperature dependency is different for the protonated and deprotonated spectra. The LSSmKate2 spectra experience a slight fluorescence decrease with increasing temperature. b Calibration curves for pH at three different temperatures. The parameter θ is computed by the spectral decomposition shown in Fig. 1.4.2. c Dependency of pKa and R0 on
temperature. The filled and empty black symbols report the pKameasured at two- and one-photon
35 | D o e s H i g h G A B A a l w a y s m e a n H i g h I n h i b i t i o n ?
pixel. Before each imaging session, we measured the power of the excitation laser at the optic bench and at the output of the objective lens for each wavelength used. This conversion function is required to infer the power at the sample (which is not accessible after the mouse is placed under the objective) from the power measured on the optic bench. The data were analyzed by custom ImageJ macros.
Effects of Brain Tissue on Sensor Spectroscopy
Fig. 1.4.3a shows the ratio of the fluorescence emitted by YFP when excited at 960 and 910 nm (F960 and F910, respectively) normalized to the ratio
observed in a monolayer culture of HEK293T cells. The color-coded transverse section shows that, as the imaging depth increased, F910
decreased compared with F960, thus indicating a progressive loss of
two-photon excitation at the focal plane with decreasing wavelength (Fig. 1.4.3b). This observation implies that also the emitted fluorescence must undergo some extinction while propagating from the imaging plane to the brain surface, with the green fluorescence experiencing more loss than the red one. We obtained a quantitative assessment of this effect in the YFP mice. When measuring the fluorescence of YFP expressed in cultures, the emission spectrum was not altered by extinction, and the fluorescence of YFP was distributed in the green and red channels with a ratio R/G = 0.116 (SD = 0.006, n = 10 cells). Next, we recorded the fluorescence in YFP mice in the red and green channels and computed the R/G ratio at various focal depths. As expected, the ratio R/G changed with depth, as shown in Fig. 1.4.3c, which reports qualitatively the R/G ratio normalized to the R/G value observed in culture. Fig. 1.4.3d shows a quantification of the red shift of detected fluorescence with increasing depth.
36 | D o e s H i g h G A B A a l w a y s m e a n H i g h I n h i b i t i o n ?
Next, we examined whether, for a given focal plane, we could establish a relationship between excitation scattering/absorption and emission extinction. Fig. 1.4.3e shows the correlation between these two effects as
Fig. 1.4.3 The recorded excitation and emission spectra of intracellular fluorescence are altered by the depth of imaging. a Imaging of cortical neurons in a YFP-expressing mouse shows the wavelength-dependent loss of excitation in vivo. The reconstructed transverse section depicts the ratio of the fluorescence emitted in response to excitation at 960 and 910 nm. The ratio has been normalized to the value measured at zero absorption/scattering (brain surface), and as the imaging depth increases, excitation at 960 nm is less attenuated. (Scale bar: 50 µm.) b Excitation spectra of YFP imaged at different depths in the cortex of one adult YFP-expressing mouse. As a zero distortion reference, the spectrum of YFP recorded in HEK cells is also shown. Spectra have been normalized to the fluorescence measured at 1,000 nm to allow for an easier comparison. This normalization shows that, at increasing imaging depth, shorter wavelengths are transmitted more poorly with a consequent decrement of fluorescence. Similar results on neurons in vivo were obtained in five additional mice. c Effects of imaging depth on the color of recorded fluorescence. The image is a reconstructed transverse section of neurons from a YFP-expressing mouse showing the ratio of the fluorescence recorded in the G and R channels. In HEK cells, the emitted fluorescence is distributed between the R and G channels with a ratio of 0.116 (SD = 0.116, n = 10). With increasing depth, the green fluorescence undergoes more extinction than the red, and the ratio decreases to 1/0.38. (Scale bar: 50 µm.) d Quantification of the progressive red shift of detected fluorescence γ with imaging depth. Data collected from neurons (n = 290) of six YFP-expressing adult mice. (E) Correlation between differential excitation scattering (parameterized by Δ) and fluorescence red shift γ (R2 = 0.73).
37 | D o e s H i g h G A B A a l w a y s m e a n H i g h I n h i b i t i o n ?
quantified by the measured Δ–γ pairs at different depths. Δ(z) yields the relative loss of fluorescence excited at 960 and 910 nm as defined by
Δ(z) =
YFP
960(z)
YFP
910(z)
∙YFP
910(0)
YFP
960(0)
where the subscripts indicate the excitation wavelength, and z indicates the imaging depth. Depth 0 corresponds to tissue surface where no scattering occurs, and Δ = 1 implies that there is no wavelength-dependent loss of excitation power. γ(z) is defined by
𝛾
(z) =
𝑅
(z)
𝐺
(z)
∙𝐺
(0)
𝑅
(0)
where z is the imaging depth. The value of γ(z) is equal to 1 in the absence of differential extinction of the fluorescence detected in the R and G channels. Fig. 1.4.3e shows that there is a linear relationship between the extinction of emission and the loss of excitation and that this relationship is similar in cortical neurons of different mice. Based on this finding, if Δ(z) is known, the parameter for differential emission extinction, γ, can be readily estimated using the empirical relationship:
𝛾 = 1 + 𝜇(Δ(z) − 1)
with μ = 0.40 ± 0.016 (n = 66 cells from six mice) (Fig. 1.4.3e). Criteria for Data Rejection and Statistical Procedures.
For each cell, we computed the error on the final chloride estimate by propagating the residue of the fit (Eq.3). Since a reliable pHi estimate is
necessary for a proper final determination of [Cl-]
38 | D o e s H i g h G A B A a l w a y s m e a n H i g h I n h i b i t i o n ?
was determined, and cells that presented an error larger than twice the mean error were excluded from following analysis. When [Cl-]
i is in the few
millimolar range, the ratio r(Cl) of the E2GFP and LSSmKate2 fluorescence
is close to r(0), and therefore, because of experimental error on the fluorescence estimate, Eq.6 can occasionally yield negative values for the Cl-measurements. This is an unavoidable consequence of the propagation of experimental errors, and we decided not to exclude these data from the population. Statistics were computed with Origin 8. Nonparametric distributions were compared with the paired Wilcoxon rank test or with the Kolmogorov–Smirnov test as indicated in the figures.
39 | D o e s H i g h G A B A a l w a y s m e a n H i g h I n h i b i t i o n ?
1.5
R
EFERENCES
1. Kaila, K. Ionic basis of GABAA receptor channel function in the nervous system. Prog. Neurobiol. 42, 489–537 (1994).
2. Ben-Ari, Y. The GABA excitatory/inhibitory developmental sequence: A personal journey. Neuroscience 279, 187–219 (2014).
3. Raimondo, J. V., Markram, H. & Akerman, C. J. Short-term ionic plasticity at GABAergic synapses. Front. Synaptic Neurosci. 4, 5 (2012).
4. Kaila, K., Price, T. J., Payne, J. A., Puskarjov, M. & Voipio, J. Cation-chloride cotransporters in neuronal development, plasticity and disease. Nat. Rev. Neurosci. 15, 637–654 (2014).
5. Doyon, N., Vinay, L., Prescott, S. A. & De Koninck, Y. Chloride Regulation: A Dynamic Equilibrium Crucial for Synaptic Inhibition. Neuron 89, 1157–1172 (2016).
6. Kahle, K. T. et al. Modulation of neuronal activity by phosphorylation of the K–Cl cotransporter KCC2. Trends Neurosci. 36, 726–737 (2013).
7. Kaila, K., Ruusuvuori, E., Seja, P., Voipio, J. & Puskarjov, M. GABA actions and ionic plasticity in epilepsy. Curr. Opin. Neurobiol. 26, 34–41 (2014).
8. Luhmann, H. J. et al. Spontaneous Neuronal Activity in Developing Neocortical Networks: From Single Cells to Large-Scale Interactions. Front. Neural Circuits 10, 40 (2016).
40 | D o e s H i g h G A B A a l w a y s m e a n H i g h I n h i b i t i o n ?
9. Kirmse, K. et al. GABA depolarizes immature neurons and inhibits network activity in the neonatal neocortex in vivo. Nat. Commun. 6, 7750 (2015).
10. Rivera, C. et al. The K+/Cl− co-transporter KCC2 renders GABA hyperpolarizing during neuronal maturation. Nature 397, 251–255 (1999).
11. Coombs, J. S., Eccles, J. C. & Fatt, P. The specific ionic conductances and the ionic movements across the motoneuronal membrane that produce the inhibitory post-synaptic potential. J. Physiol. 130, 326–373 (1955).
12. Ben-Ari, Y. et al. Refuting the challenges of the developmental shift of polarity of GABA actions: GABA more exciting than ever! Front. Cell. Neurosci. 6, 35 (2012). 13. Deidda, G., Bozarth, I. F. & Cancedda, L. Modulation of GABAergic transmission in
development and neurodevelopmental disorders: investigating physiology and pathology to gain therapeutic perspectives. Front. Cell. Neurosci. 8, 119 (2014). 14. Deidda, G. et al. Reversing excitatory GABAAR signaling restores synaptic
plasticity and memory in a mouse model of Down syndrome. Nat. Med. 21, 318– 326 (2015).
15. Cellot, G. & Cherubini, E. GABAergic Signaling as Therapeutic Target for Autism Spectrum Disorders. Front. Pediatr. 2, 70 (2014).
16. Banerjee, A. et al. Jointly reduced inhibition and excitation underlies circuit-wide changes in cortical processing in Rett syndrome. Proc. Natl. Acad. Sci. 113, E7287– E7296 (2016).
17. Cohen, I., Navarro, V., Clemenceau, S., Baulac, M. & Miles, R. On the origin of interictal activity in human temporal lobe epilepsy in vitro. Science 298, 1418–21 (2002).
18. Löscher, W., Puskarjov, M. & Kaila, K. Cation-chloride cotransporters NKCC1 and KCC2 as potential targets for novel antiepileptic and antiepileptogenic treatments. Neuropharmacology 69, 62–74 (2013).
41 | D o e s H i g h G A B A a l w a y s m e a n H i g h I n h i b i t i o n ?
19. Arosio, D. & Ratto, G. M. Twenty years of fluorescence imaging of intracellular chloride. Front. Cell. Neurosci. 8, 258 (2014).
20. Klein, D. C., Moore, R. Y. & Reppert, S. M. Suprachiasmatic Nucleus: The Mind’s Clock. (Oxford University Press, New York, 1991).
21. Page, T. L. Time is the essence: Molecular analysis of the biological clock. Science (1994). doi:10.1126/science.8128243
22. Myers, M. P., Wager-Smith, K., Wesley, C. S., Young, M. W. & Sehgal, A. Positional cloning and sequence analysis of the Drosophila clock gene, timeless. Science (80-. )(80-. (1995)(80-. doi:10(80-.1126/science(80-.270(80-.5237(80-.805
23. Lehman, M. N. et al. Circadian rhythmicity restored by neural transplant. Immunocytochemical characterization of the graft and its integration with the host brain. J. Neurosci. 7, 1626–38 (1987).
24. Wagner, S., Castel, M., Gainer, H. & Yarom, Y. GABA in the mammalian suprachiasmatic nucleus and its role in diurnal rhythmicity. Nature 387, 598–603 (1997).
25. Welsh, D. K., Logothetis, D. E., Meister, M. & Reppert, S. M. Individual neurons dissociated from rat suprachiasmatic nucleus express independently phased circadian firing rhythms. Neuron 14, 697–706 (1995).
26. Shirakawa, T., Honma, S., Katsuno, Y., Oguchi, H. & Honma, K. Synchronization of circadian firing rhythms in cultured rat suprachiasmatic neurons. Eur. J. Neurosci. 12, 2833–2838 (2000).
27. Gribkoff, V. K., Pieschl, R. L. & Dudek, F. E. GABA Receptor-Mediated Inhibition of Neuronal Activity in Rat SCN In Vitro: Pharmacology and Influence of Circadian Phase. J. Neurophysiol. (2006). doi:10.1152/jn.01082.2002
28. Ben-Ari, Y., Cherubini, E., Corradetti, R. & Gaiarsa, J. L. Giant synaptic potentials in immature rat CA3 hippocampal neurones. J. Physiol. 416, 303–25 (1989).
42 | D o e s H i g h G A B A a l w a y s m e a n H i g h I n h i b i t i o n ?
29. Cherubini, E., Rovira, C., Gaiarsa, J. L., Corradetti, R. & Ari, Y. B. GABA mediated excitation in immature rat CA3 hippocampal neurons. Int. J. Dev. Neurosci. 8, 481– 490 (1990).
30. Wu, W. L., Ziskind-Conhaim, L. & Sweet, M. A. Early development of glycine- and GABA-mediated synapses in rat spinal cord. J. Neurosci. 12, 3935–45 (1992). 31. Ehrlich, I., Lohrke, S. & Friauf, E. Shift from depolarizing to hyperpolarizing glycine
action in rat auditory neurones is due to age-dependent Cl- regulation. J. Physiol. 520 Pt 1, 121–37 (1999).
32. Kaila, K., Voipio, J., Paalasmaa, P., Pasternack, M. & Deisz, R. A. The role of bicarbonate in GABAA receptor-mediated IPSPs of rat neocortical neurones. J. Physiol. 464, 273–289 (1993).
33. Verkman, A. S. Development and biological applications of chloride-sensitive fluorescent indicators. Am. J. Physiol. Physiol. 259, C375–C388 (1990).
34. Kaneko, H., Putzier, I., Frings, S. & Gensch, T. Determination of intracellular chloride concentration in dorsal root ganglion neurons by fluorescence lifetime imaging. Curr. Top. Membr. 53, 167–189 (2002).
35. Galietta, L. J., Haggie, P. M. & Verkman, A. S. Green fluorescent protein-based halide indicators with improved chloride and iodide affinities. FEBS Lett. 499, 220– 4 (2001).
36. Nagai, T. et al. A variant of yellow fluorescent protein with fast and efficient maturation for cell-biological applications. Nat. Biotechnol. 20, 87–90 (2002). 37. Kuner, T. & Augustine, G. J. A genetically encoded ratiometric indicator for
chloride: capturing chloride transients in cultured hippocampal neurons. Neuron 27, 447–59 (2000).
38. Markova, O., Mukhtarov, M., Real, E., Jacob, Y. & Bregestovski, P. Genetically encoded chloride indicator with improved sensitivity. J. Neurosci. Methods 170,
43 | D o e s H i g h G A B A a l w a y s m e a n H i g h I n h i b i t i o n ?
67–76 (2008).
39. Grimley, J. S. et al. Visualization of Synaptic Inhibition with an Optogenetic Sensor Developed by Cell-Free Protein Engineering Automation. J. Neurosci. 33, 16297– 16309 (2013).
40. Raimondo, J. V., Irkle, A., Wefelmeyer, W., Newey, S. E. & Akerman, C. J. Genetically encoded proton sensors reveal activity-dependent pH changes in neurons. Front. Mol. Neurosci. 5, 68 (2012).
41. Paredes, J. M. et al. Synchronous Bioimaging of Intracellular pH and Chloride Based on LSS Fluorescent Protein. doi:10.1021/acschembio.6b00103
42. CHESLER, M. Regulation and Modulation of pH in the Brain. Physiol. Rev. 83, 1183–1221 (2003).
43. Ruffin, V. A., Salameh, A. I., Boron, W. F. & Parker, M. D. Intracellular pH regulation by acid-base transporters in mammalian neurons. Front. Physiol. 5, (2014). 44. Ruusuvuori, E. & Kaila, K. in Sub-cellular biochemistry 75, 271–290 (2014). 45. Pavlov, I., Kaila, K., Kullmann, D. M. & Miles, R. Cortical inhibition, pH and cell
excitability in epilepsy: what are optimal targets for antiepileptic interventions? J. Physiol. 591, 765–774 (2013).
46. Bizzarri, R. et al. Development of a Novel GFP-based Ratiometric Excitation and Emission pH Indicator for Intracellular Studies. doi:10.1529/biophysj.105.074708 47. Arosio, D. et al. Spectroscopic and structural study of proton and halide ion
cooperative binding to gfp. Biophys. J. 93, 232–44 (2007).
48. Bregestovski, P. & Arosio, D. in 99–124 (2011). doi:10.1007/4243_2011_27 49. Khirug, S. et al. Distinct properties of functional KCC2 expression in immature
mouse hippocampal neurons in culture and in acute slices. Eur. J. Neurosci. 21, 899–904 (2005).
44 | D o e s H i g h G A B A a l w a y s m e a n H i g h I n h i b i t i o n ?
50. Atallah, B. V., Bruns, W., Carandini, M. & Scanziani, M. Parvalbumin-Expressing Interneurons Linearly Transform Cortical Responses to Visual Stimuli. Neuron 73, 159–170 (2012).
51. Melzer, S. et al. Long-Range-Projecting GABAergic Neurons Modulate Inhibition in Hippocampus and Entorhinal Cortex. Science (80-. ). 335, 1506–1510 (2012). 52. Cobb, S. R., Buhl, E. H., Halasy, K., Paulsen, O. & Somogyi, P. Synchronization of
neuronal activity in hippocampus by individual GABAergic interneurons. Nature 378, 75–78 (1995).
53. Buzsáki, G. & Wang, X.-J. Mechanisms of gamma oscillations. Annu. Rev. Neurosci. 35, 203–25 (2012).
54. Sulis Sato, S. et al. Simultaneous two-photon imaging of intracellular chloride concentration and pH in mouse pyramidal neurons in vivo. Proc. Natl. Acad. Sci. 201702861 (2017). doi:10.1073/pnas.1702861114
55. Boffi, J. C., Knabbe, J., Kaiser, M. & Kuner, T. KCC2-dependent Steady-state Intracellular Chloride Concentration and pH in Cortical Layer 2/3 Neurons of Anesthetized and Awake Mice. Front. Cell. Neurosci. 12, 7 (2018).
56. Thompson, S. M. & Gahwiler, B. H. Activity-dependent disinhibition. I. Repetitive stimulation reduces IPSP driving force and conductance in the hippocampus in vitro. J. Neurophysiol. 61, 501–511 (1989).
57. Huberfeld, G. et al. Perturbed Chloride Homeostasis and GABAergic Signaling in Human Temporal Lobe Epilepsy. J. Neurosci. 27, 9866–9873 (2007).
58. Ly, J. Q. M. et al. Circadian regulation of human cortical excitability. Nat. Commun. 7, 11828 (2016).
59. O’Neill, J. S. & Reddy, A. B. Circadian clocks in human red blood cells. Nature 469, 498–503 (2011).
45 | D o e s H i g h G A B A a l w a y s m e a n H i g h I n h i b i t i o n ?
(2018).
61. Li, P. et al. Loss of CLOCK Results in Dysfunction of Brain Circuits Underlying Focal Epilepsy. Neuron 96, 387–401.e6 (2017).
62. Pisella, L. I. et al. Impaired KCC2 phosphorylation leads to neuronal network dysfunction and neurodevelopmental pathogenesis. bioRxiv 606566 (2019). doi:10.1101/606566
63. van der Werf, Y. D. et al. Is Disturbed Intracortical Excitability a Stable Trait of Chronic Insomnia? A Study Using Transcranial Magnetic Stimulation Before and After Multimodal Sleep Therapy. Biol. Psychiatry 68, 950–955 (2010).
64. Kimiskidis, V. K. et al. Transcranial Magnetic Stimulation Combined with EEG Reveals Covert States of Elevated Excitability in the Human Epileptic Brain. Int. J. Neural Snst.
46 | D o e s H i g h G A B A a l w a y s m e a n H i g h I n h i b i t i o n ?
Bipolar Disord. 16, 809–819 (2014).
70. Mirzoev, A. et al. Circadian profiles of focal epileptic seizures: A need for reappraisal. Seizure 21, 412–416 (2012).
71. Szczurkowska, J. et al. Targeted in vivo genetic manipulation of the mouse or rat brain by in utero electroporation with a triple-electrode probe. Nat. Protoc. 11, 399–412 (2016).
72. Hewitt, S. A., Wamsteeker, J. I., Kurz, E. U. & Bains, J. S. Altered chloride homeostasis removes synaptic inhibitory constraint of the stress axis. Nat. Neurosci. 12, 438–443 (2009).
73. dal Maschio, M. et al. High-performance and site-directed in utero electroporation by a triple-electrode probe. Nat. Commun. 3, 960 (2012). 74. Arosio, D. et al. Simultaneous intracellular chloride and pH measurements using
49 | A n e w m e t h o d t o s t u d y e p i l e p s y i n Z e b r a f i s h
2.1
I
NTRODUCTION
A N E W M E T H O D T O S T U D Y E P I L E P S Y I N Z E B R A F I S H:
A S T A T I S T I C A L L Y-B A S E D A P P R O A C H.
Zebrafish (Danio rerio) is emerging as an important model to understand the cellular basis of epilepsy and for treatment screening. The study of sources and spatiotemporal evolution of ictal bursts is critical for the mechanistic understanding of epilepsy and for the validation of anti-epileptic drugs. Zebrafish (Danio rerio) is a powerful vertebrate model representing an excellent compromise between system complexity and experimental accessibility. Here, we developed an unbiased method to extract and quantify electrophysiological transients coupled with Ca2+
events, exploiting the statistical properties of the signals in order to reduce the impact of operator choices. We performed the quantitative evaluation of the spatial recruitment of neuronal populations during physiological and pathological activity by combining local field potential recordings (LFP) with simultaneous 2-photon Ca2+ imaging in models of
epilepsy. Furthermore, we computed topological maps showing brain regions where Ca2+ fluctuations were maximally correlated with the LFP.
Our data point to the cerebellum as the main anatomical region involved in the generation of epileptiform signal. Finally, we applied these tools to assess the efficacy of the anti-epileptic drug valproate.
50 | A n e w m e t h o d t o s t u d y e p i l e p s y i n Z e b r a f i s h
2.1.1
Z
EBRAFISH AS
M
ODEL FOR
H
UMAN
D
ISORDERS
The zebrafish is a freshwater teleost fish used as a model organism in biology from the 1980s when Streisinger et al. were able to generate clones of homozygous fish from individual homozygotes 1. Because its
genome is 70% homologous to humans 2, it has a high rate of
reproduction, low cost for maintenance, its embryos are transparent and it is easy to genetically manipulate, this small aquatic vertebrate has become popular in biomedical research. Although the mammalian and the teleost central nervous system (CNS) display considerable neuroanatomical differences, several fundamental principles of brain development and function are evolutionary well conserved and reproduced in the simple zebrafish model 3–6. Zebrafish larvae possess a compact nervous system
containing ~105 neurons in less than half a cubic millimeter, nevertheless
these fishes are capable of several behaviours and it represents an excellent compromise between system complexity and experimental accessibility, features that simplify the identification of potential therapeutic targets 7,8.
Indeed, zebrafish models reproduce several aspects of neurological disorders that can be exploited to explore the underpinnings of molecular and genetic mechanisms of disease 9.
Transparency and external development of embryos and larvae allow non-invasive imaging by using fluorescent probes and reporter genes 10. The
increase of molecular tools available for high-resolution live-imaging has recently been expanded to include genetically encoded fluorescent calcium indicator GCaMP proteins, which can reveal the spatio-temporal activities of excitable cells such as neurons, in intact, living zebrafish 10–12. In