U NIV
ERSITY OF SALERNO
DOTTORATO DI RICERCA IN INGEGNERIA CIVILE PER L’AMBIENTE ED IL TERRITORIO
XVI Ciclo - Nuova Serie (2014-2017)
DIPARTIMENTO DI INGEGNERIA CIVILE,UNIVERSITÀ DEGLI STUDI DI SALERNO
THE EFFECTS OF ROOTS ON THE
HYDRO-MECHANICAL BEHAVIOR OF
UNSATURATED PYROCLASTIC SOILS
GLI EFFETTI DELLE RADICI SUL COMPORTAMENTO IDRO-MECCANICO DEI TERRENI PIROCLASTICI
PARZIALMENTE SATURI
ING.VITTORIA CAPOBIANCO
Relatore:
PROF. ING.LEONARDO CASCINI
Correlatori:
PROF. ING.SABATINO CUOMO
ING.VITO FORESTA
Coordinatore
In copertina: sezione del terreno piroclastico permeato da radici
THE EFFECTS OF ROOTS ON THE HYDRO-MECHANICAL BEHAVIOR OF UNSATURATED PYROCLASTIC SOILS
_________________________________________________________________ Copyright © 2005 Università degli Studi di Salerno – via Ponte don Melillo, 1 – 84084 Fisciano (SA), Italy – web: www.unisa.it
Proprietà letteraria, tutti i diritti riservati. La struttura ed il contenuto del presente volume non possono essere riprodotti, neppure parzialmente, salvo espressa autorizzazione. Non ne è altresì consentita la memorizzazione su qualsiasi supporto (magnetico, magnetico-ottico, ottico, cartaceo, etc.).
Benché l’autore abbia curato con la massima attenzione la preparazione del presente volume, Egli declina ogni responsabilità per possibili errori ed omissioni, nonché per eventuali danni dall’uso delle informazione ivi contenute.
INDEX
INDEX ... i FIGURE INDEX ... v TABLE INDEX... xv NOTATIONS ... xvi ABSTRACT ... xix RINGRAZIAMENTI ... xxiABOUT THE AUTHOR ... xxiii
1 INTRODUCTION ... 25
2 PYROCLASTIC SOILS ... 27
2.1 GENERAL FEATURES ... 27
2.1.1 Origin ... 27
2.1.2 Geographic distribution and land use ... 31
2.2 PYROCLASTIC SOILS IN CAMPANIA REGION ... 33
2.2.1 Origin and diffusion ... 33
2.2.2 Geological and Stratigraphical settings ... 35
2.2.3 Physical properties... 41
2.2.4 Chemical composition ... 42
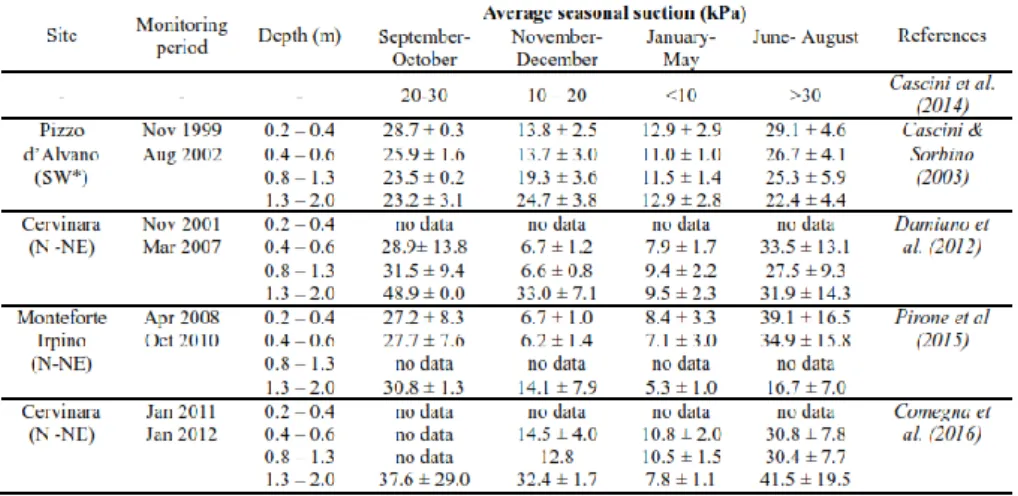
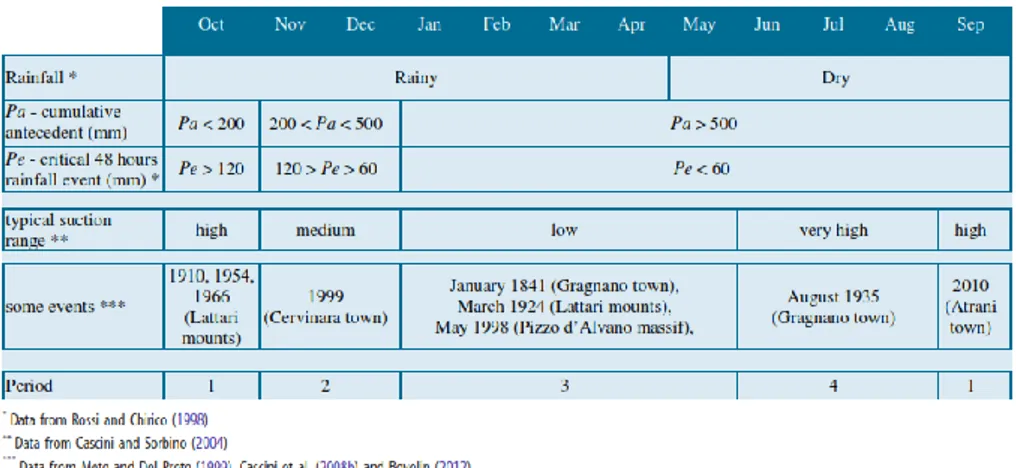
2.3 SUCTION AND MECHANICAL PROPERTIES OF VESUVIAN SOILS 43 2.3.1 Soil suction regime ... 43
2.3.2 Hydraulic properties ... 48
2.3.3 Collapsibility ... 50
2.3.4 Shear strength ... 52
3 SLOPE INSTABILITY IN CAMPANIA REGION AND RISK MITIGATION MEASURES OVER THE CENTURIES ... 53
3.1 FLOW-LIKE LANDSLIDES ... 53
3.1.1 General classification systems ... 53
3.1.2 Debris flows ... 54
3.1.3 Hyperconcentrated flows ... 55
3.2 SEASONAL EFFECTS OF RAINFALL ON SLOPE INSTABILITIES IN CAMPANIA REGION ... 57
3.3 FAILURE AND POST-FAILURE STAGES ... 59
3.3.1 Triggering mechanisms ... 59
3.4 RISK MITIGATION MEASURES ... 65
3.4.1 Ancient hydrogeological mitigation measures ... 65
3.4.2 Recent landslide risk mitigation measures ... 68
3.5 CONCLUDING REMARKS ... 69
4 BIO-ENGINEERING TECHNOLOGY ... 71
4.1 GENERAL FEATURES ... 71
4.1.1 Bio-engineering practices ... 71
4.1.2 Vegetation types and plant traits ... 74
4.2 ROOTS GROWTH IN NUTRIENT RICH PATH AND EFFECTS ON SOIL HYDRAULIC RESPONSE: THE HONG KONG CASE STUDY ... 78
4.2.1 Nutrient availability in soil on plant traits ... 78
4.2.2 Test set-up and instrumentation ... 79
4.2.3 Soil type and preparation method ... 82
4.2.4 Vegetation species and nutrient type ... 83
4.2.5 Test procedures ... 83
4.2.6 Effect of nutrients on plant traits ... 86
4.2.7 Effect on Soil Water Retention Ability (SWRC) ... 90
4.2.8 Effect on plant induced soil suction ... 92
4.2.9 Nutrient supply effect on correlation between plant traits and plant induced soil suction ... 93
4.3 CONCLUDING REMARKS ... 94
5 EXPERIMENTAL INVESTIGATION ON LONG ROOT GRASS TECHNOLOGY ... 97
5.1 PRATI ARMATI TECHNOLOGY ... 97
5.1.1 General features ... 97
5.1.2 Examples of main applications ... 102
5.2 SET UP DESCRIPTION ... 105
5.2.1 Test set-up and instrumentation ... 105
5.2.2 Soil type and preparation method ... 109
5.3 VEGETATION SPECIES AND ROOT GROWING ... 114
5.3.1 Selected species and growth conditions ... 114
5.3.2 Observed root characteristics ... 119
5.4 CONCLUDING REMARKS ... 122
6 HYDROMECHANICAL behavior of rooted soils ... 125
6.1 INTRODUCTION ... 125
6.2 LITERATURE REVIEW ... 126
6.2.1 Effect of vegetation on infiltration rate ... 127
6.2.2 Effect of vegetation on induced soil suction ... 133
6.3.1 Test plan and procedures ... 135
6.3.2 Climatic conditions monitoring data ... 138
6.3.3 Soil suction and VWC monitoring data ... 142
6.4 HYDRO-MECHANICAL RESPONSE DURING EVAPOTRANSPIRATION ... 146
6.4.1 Drying test results in wet season ... 146
6.4.2 Drying test results in dry season ... 150
6.4.3 Prediction of induced suction by vegetation in pyroclastic soils 153 6.4.4 The effects of roots on soil water retention ability ... 155
6.5 HYDRO-MECHANICAL RESPONSE DURING INFILTRATION ... 157
6.5.1 Infiltration test procedure ... 157
6.5.2 Wetting test results ... 158
6.5.3 Discussion ... 160
6.6 CONCLUDING REMARKS ... 161
7 THE COLLAPSIBILITY BEHAVIOR OF ROOTED SOILS . 163 7.1 INTRODUCTION ... 163
7.2 LITERATURE REVIEW ... 164
7.2.1 Suction controlled and standard oedometer tests on undisturbed samples ... 164
7.3 MATERIAL AND METHODS ... 167
7.3.1 Oedometric apparatus and test program ... 167
7.3.2 Bare soil investigated... 167
7.3.3 Test set up for vegetated soil ... 168
7.3.4 Soil sampling for vegetated soil ... 169
7.4 EXPERIMENTAL TEST RESULTS ... 170
7.4.1 Bare soil ... 170
7.4.2 Vegetated soil ... 172
7.5 CONCLUDING REMARKS ... 176
8 THE CONTRIBUTION OF ROOT GRASSES ON SOIL SHEAR STRENGTH ... 179
8.1 INTRODUCTION ... 179
8.2 THE EFFECTS OF ROOTS ON SOIL SHEAR RESISTANCE ... 181
8.2.1 Failure mechanisms and root cohesion ... 181
8.2.2 Root tensile strength and root characteristics ... 184
8.3 MATERIAL AND METHODS ... 188
8.3.1 Soil type and sampling procedure ... 188
8.3.2 Triaxial apparatus and test programme ... 188
8.4.1 Measurements of root parameters ... 191
8.4.2 Test results... 195
8.4.3 Consolidated drained test results ... 198
8.4.4 Consolidated undrained test results ... 200
8.4.5 Mechanical parameters and root parameters ... 202
8.5 W&W MODELING OF ROOT COHESION ... 203
8.5.1 Root cohesion evaluation ... 203
8.5.2 Comparison between model results and experimental results 204 8.5.3 Discussion ... 206 8.6 CONCLUDING REMARKS ... 206 9 CONCLUSIONS ... 209 REFERENCES ... 213 10 APPENDIX A ... 245
10.1 INSTRUMENTATION: CALIBRATION AND INSTALLATION ... 245
10.1.1 Soil Suction measurements: Mini-tensiometers T5 (UMS) 245 10.1.2 Volumetric Water Content measurements: SM100 sensors (Waterscout) ... 247
FIGURE INDEX
Figure 2.1 Relative explosiveness and Resulting height of eruption for different eruption types (US Geological Survey) ... 28 Figure 2.2 Schematic of ash clouds with mean particle size of ashes
decreasing from the source of eruption (Johnston, 1997, modified) ... 29 Figure 2.3 Isopach lines of the Chaitén distal ash deposit and thickness.
a) Ashfall mass loading against thickness. b) plume dispersal over Argentina during the first week of eruption (Watt et al., 2009). ... 30 Figure 2.4 Size of eruption pyroclastic ejecta: a) bombs and blocks, b)
scoria, c) pumice, d) ash. ... 31 Figure 2.5 Worldwide distribution of volcanic ash soils (Andisols)
according to World Soil Resources Staff, 1999 (Dahlgren et al., 2004). ... 32 Figure 2.6 Vesuvius cone and Mt. Somma caldera (courtesy of Lab.
Grafica e Immagini, INGV-Roma; Cioni et al., 2008 modified). . 34 Figure 2.7 Geological map and dispersion of pyroclastic deposits
produced by the main Somma-Vesuvius eruptions. Isopachs of the pyroclastic products from the main eruptions (Cascini et al., 2008a, modified) ... 36 Figure 2.8 a) Isopach lines map of the Recent Pyroclastic Complex
(Rolandi et al., 2000) (isopachous lines of the eruptions. The red rectangle represents the Mount Albino massif; b) Pyroclastic deposits thickness map of Mount Albino massif (Ferlisi et al., 2015). ... 37 Figure 2.9 Typical stratigraphical section of Cervinara test site
(Lampitiello 2004, modified) ... 38 Figure 2.10 Typical stratigraphical profile of Monteforte Irpino test site
(Nicotera et al., 2008) ... 39 Figure 2.11 Typical stratigraphic sections of the investigation sites
(Cascini & Sorbino, 2003) ... 40 Figure 2.12 Ashy soils collected on Pizzo d’Alvano: range of the grain
Figure 2.13 Typical Soil Water Characteristic Curve for silty soil (Fredlund & Xing 1994, modified). ... 48 Figure 2.14 Soil Water Characteristic Curve for pyroclastic soils of Pizzo
d’Alvano (Bilotta et al., 2005). ... 50 Figure 3.1 Schematic of the typical source areas for the May 1998 flow-like mass movements (Cascini et al., 2008). ... 60 Figure 3.2 Distribution of typical source areas for the 1998 flow-like
mass movements (Cascini et al., 2008). ... 61 Figure 3.3 Reference schemes adopted for the shallow landslides induced
by rainfall directly infiltrating the slope surface and spring from the bedrock (Cascini et al. 2010). ... 63 Figure 3.4 Typical landscape measures carried out from the Middle Age
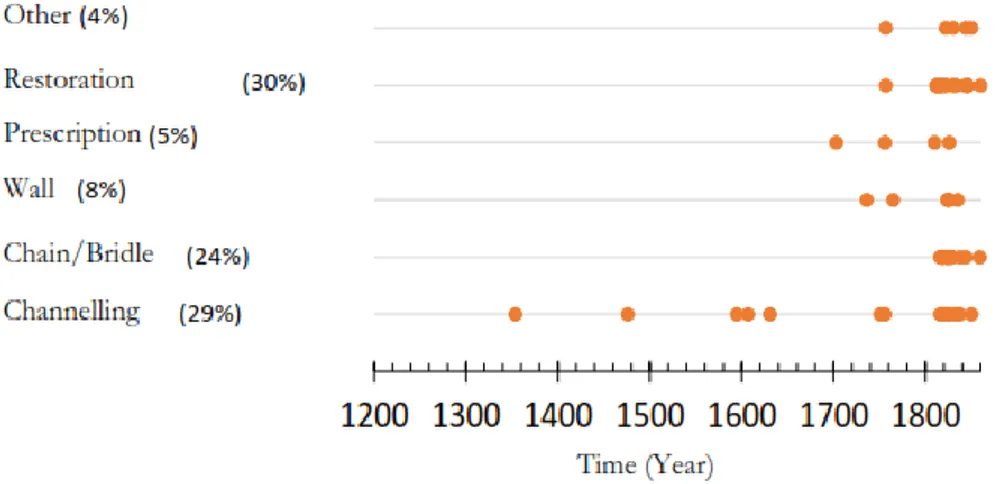
to the Italian State national Unity (Sacco, 2015). ... 66 Figure 3.5 Examples of a) artificial reverbed channel and b) brindle with
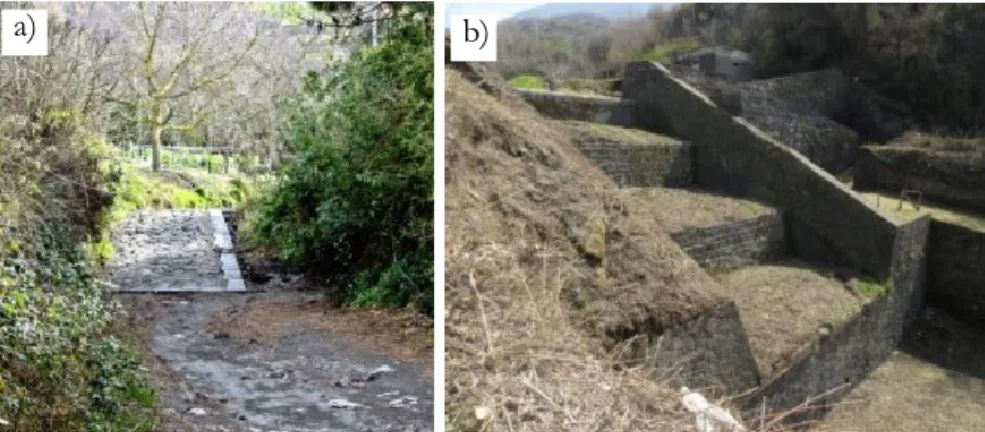
4 steps realized during the XIX century (Cibelli, 2014). ... 67 Figure 3.6 a) view from top of the dissipation basin at piedmont of Pizzo
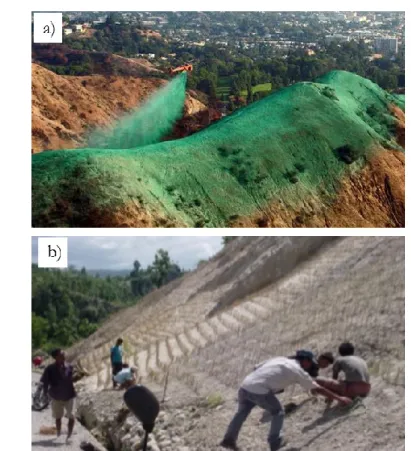
d’Alvano (where the May 1998 debris flows occurred) and particular of the b) dissipation basin and c) brindle. ... 69 Figure 4.1 Examples of planting techniques: a) Aerial Hydroseeding
(http://www.ericksonaircrane.com/hydroseeding.php), b) pit planting of grasses in Nepal. ... 73 Figure 4.2 Schwandrübi scree slope (left) in 1978 before the application
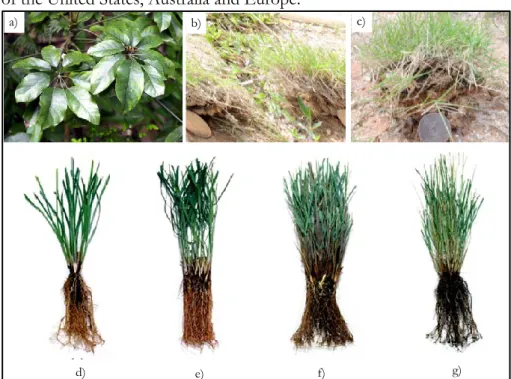
of gabions and hydroseeding, and (right) after the heavy rainstorm in August 2005 (source: left Forestry Service of Nidwalden; right WSL). ... 74 Figure 4.3 Main vegetation types studied for bio-engineering. Tree
species: a) Schefflera Heptaphylla (GEO, 2011); Grass species: b) Cynodon dactylon and c) Zoysia Matrella (Zhu & Zhang, 2016), d) Vetiver, e) Pangrass, f) Eragrass and g) Elygrass (Cazzuffi et al., 2006). ... 75 Figure 4.4 a) Schematization of Leaf Area Index image calculation (Gadi
et al., 2016, modified); b) Root structure sampled for RAI analysis (Leung et al., 2015, modified). ... 76 Figure 4.5 A herringbone root system with one main axis on which are
borne first order lateral roots (left) and a dichotomous root system with two external root tips borne on every lateral. 2nd and 3rd order lateral (right). (Stokes et al. 2009, modified). ... 78
Figure 4.6 Typical schematic setup and instrumentation of a tree-vegetated column in (a) Cross section view A–A’ and (b) Plan view (Ng et al., 2018 in press). ... 80 Figure 4.7 a) Environment controlled room placed inside the
Geotechnical laboratory of HKUST and b) vegetated columns. . 81 Figure 4.8Typical shoot growth of Schefflera heptaphylla in nutrient
poor soil (C series) a) after transplantationand b) after 6 months of growth. ... 87 Figure 4.9 Typical shoot growth of Schefflera heptaphylla in nutrient rich
soil (N series) a) after transplantationand b) after 6 months of growth. ... 87 Figure 4.10 Measured changes in Leaf Area Index (LAI) of plants before
transplantation and during 6 months of growth in nutrient poor soil and nutrient supplied soil (“C” represents the controlled test without nutrient supply and “N” represents the test with nutrient supply (Ng et al., 2018 in press). ... 88 Figure 4.11 Root growth of plants after 6 months in a) nutrient poor and
b) nutrient supplied soil (the sheet of paper in the background contains 5 mm× 5 mm squares) (Ng et al., 2018 in press). ... 89 Figure 4.12 Measured changes in Root Area Index (RAI) of plants after 6
months of growth in nutrient poor and nutrient supplied soil (“C” represents the controlled test without nutrient supply and “N” represents the test with nutrient supply) (Ng et al., 2018 in press).90 Figure 4.13 Measured SWRCs of bare and vegetated soil along the drying
path in nutrient poor soil and nutrient supplied soil (“C1, C2 and C3” represent the controlled test of 3 replicates without nutrient supply and “N1, N2 and N3” represent the test of 3 replicates with nutrient supply (Ng et al., 2018 in press). ... 91 Figure 4.14 Measured suction profiles of bare and nutrient poor and
nutrient supplied vegetated soils before and after 3 days drying after 6th month of plant growth (“6” represents the drying test conducted at 6th month of plants growth; I and 3d represent the initial suction in soil before drying and suction after 3 days of drying) (Ng et al., 2018 in press). ... 92 Figure 4.15 Relationship of root-shoot biomass ratio with matric suction
(kPa) after 3 days of drying in nutrient poor and nutrient supplied vegetated soil after 6 months of plants growth (“C” represents the controlled test without nutrient supply and “N” represents the
test with nutrient supply; Boldrin et al. (2017) used 10 different woody plant species in sandy loam soil) (Ng et al., 2018 in press). 94 Figure 5.1 a) Example of hypogeum part (roots) and aboveground part
(leaves) of traditional plant species and Prati Armati species; Qualitative behavior of b) Microthermal species and c) Macro thermal species in terms of rate of growth during the first vegetative year for traditional plant species and Prati Armati species. ... 99 Figure 5.2 Simplified model for the definition of the root area index
Ar/As (Cecconi et al., 2012). ... 100 Figure 5.3 Fasciculate deep roots of Eragrass species: numerical results
showing the RAR profile (Cecconi et al., 2013). In figure is also plotted the analytical function proposed by Preti et al (2010), which results in poor agreement with that proposed by Cecconi et al., (2013). ... 102 Figure 5.4 Examples of Prati Armati technology on a) road embankment,
b) streambank, c) dam and d) calcareous cave applied in Italy (www.pratiarmati.it). ... 104 Figure 5.5 Examples of combined Prati Armati technology and active
control works such as a) gabions, b) erosion control mat, c) woody fences and d) reinforced soil applied in Italy (www.pratiarmati.it). ... 104 Figure 5.6 Schematization of experimental set-up and instrumentation of
vegetated column: frontal view. All dimensions are in mm. ... 106 Figure 5.7 a) Data acquisition system: b) PC400 support software on
persona computer for data process; c) data logger for data collection. ... 107 Figure 5.8 Experimental set-up: a) global view of the rainout shelter and
two plexiglas columns covered by alluminium panels; b) frontal view of the no-vegetated column (NV) and vegetated column (V). ... 109 Figure 5.9 Overview of the main flow-like mass movements in May
1998; the red triangle points the site where material was collected, in Tuostolo basin, close to the source area of the Tuostolo debris flow (on the left side of the triangle). (Cascini et al., 2008 modified). ... 110 Figure 5.10 The material collected in Tuostolo Basin: a) excavation; b)
pots for the transporting the material collected and c) observed stratigraphic setting of the excavation. ... 111
Figure 5.11 Grain size distributions of the investigated soil and boundaries of main pyroclastic classes introduced by Bilotta et al. (2005). ... 111 Figure 5.12 Schematization of the main steps followed for filling the
column: a) pluviation of soil in the blocks(50 cm height), b) compaction with piston and c) reaching of 5 cm of thickness of the layer; d) example of on-going compaction in the second block; d) final configuration of the column. ... 113 Figure 5.13 Vegetation of the column: a) transplant of sprout in the
column, b) spreading of seeds along the soil surface and c) first irrigation. ... 115 Figure 5.14 T 1030 D, Gardena Water Timer electronic used for
watering the vegetated column. ... 115 Figure 5.15 Graduated scales placed on the four sides of the vegetated
column: the yellow dashed lines are referred to the monthly maximum root depth observed for each side. The average of the four maximum length of the four sides is the root depth. ... 116 Figure 5.16 Monthly average of a) height foliage and b) root depth
during first 12 months of plant growth. ... 117 Figure 5.17 Relationship of Height of foliage with Root depth recorded
during the first vegetative year. ... 118 Figure 5.18 a) schematization of the vegetated soil column and the z
where soil was cut; pictures of: b) soil column placed in horizontal plane for the cutting, c) cutting phase of modulus A, d) particular of the soil interface between modulus A and B. ... 120 Figure 5.19 RAR measurements of graminae species used in this study
(white circles) and its analytical function (black line), compared with RAR measurements of Eragrass (red triangles) and its analytical function (red line) proposed by Cecconi et al. (2013), and analytical funcion proposed by Preti et al. (2010). ... 121 Figure 5.20 Number of roots for each diameter class. ... 122 Figure 6.1 Example of in situ infiltration test: a) Experimental Setup for
rainfall simulation on vegetated slope and b) plan view of slope with layout of instruments for pore water pressure measures (Rahardjo et al., 2005). ... 128 Figure 6.2 Percent infiltration as a function of rainfall amount (Rahardjo
Figure 6.3 A schematic diagram showing test setup and instrumentation for vegetated soil in double ring infiltration test (Leung et al., 2015c). ... 130 Figure 6.4 a) Comparisons of upper and lower bounds of infiltration
rates for grass-covered soil (Cynodon Dactylon grass species), plant-covered soil (Schefflera heptaphylla species), and bare soil series; b) Comparisons of suction responses at 0.1-, 0.3- and 0.5-m depths between bare, grass-covered and tree-covered soil during ponding (Leung et al., 2015c). ... 131 Figure 6.5 A Schematic diagram showing test setup and rainfall simulator
for simulating constant rainfall intensity for 1D infiltration test on grass-covered soil square box: the infiltration rate was obtained from water balance equation shown in the figure (Ng et al., 2013). ... 132 Figure 6.6 a) Measured variations of infiltration rate with time for bare
and vegetated silty sand; b) Comparisons of variations of induced suction at 30 mm depth with time for bare and vegetated silty sand (Ng et al., 2013). ... 132 Figure 6.7 a) Side view of 33° slope with two different vegetation species
(i.e. Cynodon dactylon (Grass) and Schefflera heptaphylla (Plant) and bare soil;b) Typical layout of instrumentation on the grass vegetated slope (Garg et al., 2015). ... 134 Figure 6.8 Relationships of mean peak of suction (Δs) and mean peak
RAI at a depth of 80 mm before and after ponding and b) Relationships between mean LAI and peak of suction (Δs) during drying (Ng et al., 2016). ... 135 Figure 6.9 The map of University of Salerno Campus with the position
of the experimental set –up and meteorological station for monitoring climate data during the programme. ... 138 Figure 6.10 Climatic monitoring data: Daily and monthly average of
external air Temperature (Te) and Relative Humidity (RH)
measured at the meteorological station; daily soil Temperature measured in the soil columns (Ts). ... 141
Figure 6.11 a) Soil suction and b) VWC monitoring data at 4 depths of the vegetated soil column (V): row A (blue line) at 0.3 m depth, row B (red line) at 0.6 m depth, row C (dark blue line) at 1.2 m depth and row D (green line) at 1.8 m depth.. ... 145 Figure 6.12 15 days drying test results for wet season during April. Daily
c) V_D_A2 tests. Daily Volumetric Water content (VWC) with time for d) NV_D_A2 test, e) V_D_A1 and f) V_D_A2 tests (modified by Capobianco et al., 2017). ... 147 Figure 6.13 Soil suction values in NV column recorded in NV_D_A2
tets vs Soil suction values in V column recorded in V_D_A2 test. ... 149 Figure 6.14 Hydraulic Head profiles for a) NV_D_A2 test, b) V_D_A1
test and c) V_D_A2 test (modified by Capobianco et al., 2017). ... 149 Figure 6.15 15 days drying test results for wet season during July. Daily
soil suction (s) with time for: a) NV_D_Jul2 test, b) V_D_Jul1 and c) V_D_Jul2 tests. Daily Volumetric Water content (VWC) with time for d) NV_D_Jul2 test, e) V_D_Jul1 and f) V_D_Jul2 tests. ... 151 Figure 6.16 Soil suction values in NV column recorded in NV_D_Jul2
test vs Soil suction values in V column recorded in V_D_Jul2 test. ... 152 Figure 6.17 Hydraulic Head profiles for a) NV_D_Jul2 test, b) V_D_Jul1
test and c) V_D_Jul2 test. ... 153 Figure 6.18 Soil suction in V column after 5 days of drying vs soil
suction in NV column. ... 154 Figure 6.19 Soil suction in V column after 10 days of drying vs soil
suction in NV column. ... 154 Figure 6.20 Measured SWRCs of NV and V soil along the drying path of
April 2017 at 0.3 m and 0.6 m depth. ... 155 Figure 6.21 Measured SWRCs of NV and V soil along the drying path of
July 2017 at 0.3 m and 0.6 m depth. ... 156 Figure 6.22 Soil suction reduction Δs versus initial suction s0 in V and
NV colum at row A (z =0,3 m) and row B (z=0,6 m) for rainfall intensity 1-4 mm/h (Capobianco et al., 2017). ... 159 Figure 7.1 Results of suction controlled oedometer tests on undisturbed
soils of class ‘B’ and comparison with results of two oedometer tests on saturated samples (red curves) (Lancellotta et al., 2012). ... 165 Figure 7.2 Results of standard oedometer test on unsaturated sample
with constant natural water content (violet curve) and on saturated sample (blue curve). Dashed lines are referred to the void ratio of samples after 45 minutes (Lancellotta et al., 2012). ... 166
Figure 7.3 Root-soil sampling procedure adopted: a) extrusion process from the sampler with rigid oedometer ring, b) sample with roots and c) sample with smooth surface after cutting of extra-roots. ... 169 Figure 7.4 Results of standard oedometer test on unsaturated sample
with constant gravimetric water content (continues curves) and on saturated sample (dashed curves). ... 170 Figure 7.5 Results of double oedometer procedure. ... 171 Figure 7.6 Void ratio before and after collapse for 13 kPa of vertical net
stress; magnitude of collapse for each oedometer test... 172 Figure 7.7 porosity at three stages of root growth. ... 173 Figure 7.8 Root dry biomass (RM) along depth for each cylinder. ... 174 Figure 7.9 Root Mass Density (RMD) along depth for each cylinder. .. 175 Figure 7.10 Void ratio before and after collapse for 13 kPa of vertical net
stress and magnitude of collapse for vegetated samples, compared with bare samples. ... 176 Figure 8.1 Schematic diagram of perpendicular root-fiber reinforcement
model (Gray and Ohashi, 1983). ... 182 Figure 8.2 Experimental results of tensile strength tests on different
plant species: tree roots, Mediterranean and grass species ... 187 Figure 8.3 RM with depth of root-soil samples (small black squares) and
RM average for those at the same depth (big black squares). The dashed black lines correspond to the interfaces between two different column zones. ... 193 Figure 8.4 RMD with depth of root-soil samples (small blue squares) and
RMD average for those at the same depth (big blue squares). ... 194 Figure 8.5 RVD with depth of root-soil samples (small green squares)
and RVD average for those at the same depth (big green squares). ... 194 Figure 8.6 a) (q-p’) points at critical state and envelopes (dashed lines) of
consolidated triaxial tests undrained and drained for bare (B_U, B_D) samples and vegetated samples taken from zone A (VA_U,VA_D), zone B (VB_U, VB_D), zone C (VC_U, VC_D) and zone D (VD_U, VD_D); b) (e-p’) points and critical state line of triaxial tests ... 196 Figure 8.7 qfrooted/qfbare ratio vs mean effective stress p' for vegetated
Figure 8.8 a) Stress-path, b) constitutive behavior and c) deformations on bare soil (orange) and vegetated soils at 30 kPa of confining pressure. ... 199 Figure 8.9 a) Stress-path, b) constitutive behavior and c) Pore Water
Pressure of undrained triaxial tests on bare soil (orange) and vegetated soils at 30 kPa of confining pressure. ... 201 Figure 8.10 Cohesion C (bl
squares) of pyroclastic soils at different RVD (%). ... 202 Figure 8.11 Shear strength variation with RVD of root-soil composite at
confining pressures of 10, 30 and 50 kPa. ... 203 Figure 8.12 Root cohesion along depth computed with W&W model for
three root diameter classes, and experimental values obtained by triaxial tests. ... 205 Figure 10.1 Schematization of mini-tensiometer T5 (UMS) (Official T5
manual). ... 245 Figure 10.2 Phases of the installation process of mini-tensiometers T5: a)
saturation of tensiometer; b) picture of drilling a designed hole along plexiglass column; c) T5 installed in hole. ... 246 Figure 10.3 Schematization of SM100 sensor (Waterscout). ... 248 Figure 10.4 Calibration points for sensor a) SM100_1 and b) SM100_2,
SM100_3, SM100_4 where is the output electrical signal with a its lower boundary and w upper boundary, VWC is the fixed volumetric water content. ... 250 Figure 10.5 Measured points and fitting curves for a) sensor SM100_1
TABLE INDEX
Table 2.1 Range of main physical properties (Bilotta et al., 2005). ... 41 Table 2.2 Typical time trends of soil suction in pyroclastic covers on
carbonatic bedrock in Campania region (Cascini et al. 2014). ... 46 Table 2.3 Average seasonal suction measured in pyroclastic covers of
Campania region (*slope exposure: N-S-W-E). (Capobianco et al. 2017, modified). ... 47 Table 3.1 Main slope instabilities in Campania Region (Cascini et al.,
2014, modified) ... 57 Table 3.2 Interpretation of slope instability types based on rainfall,
suction and historical data (Cascini et al., 2014). ... 58 Table 4.1 Atomic and mass concentration (%) of major nutrient
elements (N, P, K) in CDG soil. ... 82 Table 4.2 Test series and ID of the columns in the experimental study
conducted at HKUST. ... 84 Table 4.3 Normalized root biomass and root volume of the vegetated
soil columns (Ng et al., 2018 in press). ... 86 Table 5.1 ID of the columns in the experimental study. ... 108 Table 6.1 Summary of the test programme followed for the investigation
of the hydraulic response of rooted-soil. ... 137 Table 7.1 Details of double oedometer tests on reconsituted bare
samples. ... 168 Table 7.2 Details of the soil characteristics in plexiglas cylinders. ... 168 Table 7.3Details of -soil samples for oedometer test. ... 174 Table 8.1 Root parameters for each root-soil sample of triaxial tests. .. 192 Table 8.2 Soil cohesion (Cs), integrated cohesion (C) and internal friction
angle of bare and vegetated soils obtained from isotropic consolidated triaxial tests drained and undrained. Root cohesion (Cr) obtained as difference between C and Cs. ... 198 Table 8.3 Test condition of drained triaxial tests at 30 kPa. ... 199 Table 8.4 Test condition of undrained triaxial tests at 30 kPa. ... 200 Table 8.5 Root diameter class selected and their relative tensile strength. ... 205 Table 10.1 Calibration parameters for polynomial fitting equation. ... 251
NOTATIONS
AEV Air Entry value
a Intercept of (q-p’) enveloping equation ar,i Cross section of single root
Ar Rooted area
As Soil cross section
B Bare soil
C Control series
c Empirical parameter for RAR fitting equation C Integrated cohesion Cr Root cohesion Cs Soil cohesion C/N Carbon/Nitrogen ratio D Drying test D Duration of W test di Root diameter e Void ratio
e0 Initial void ratio
eini Initial void ratio at 3rd stage of growth
ET Evapotranspiration
f Empirical parameter for RAR fitting equation FBM Fiber Bundle Model
Fi (x) Maximum pull out force allowed in the root belonging to i class diameter
FS Factor of Safety
Ftot Total force in the bundle Gs Specific Gravity
i Index for diameter class
j Index of the weakest root still unbroken in FBM k Soil hydraulic conductivity
(k-s) Soil conductivity curve
k’ Parameter depending on and ' LAI Leaf Area Index
Ms Dry mass of the root-permeated soil sample N Nutrient series
N Diameter classes
n Porosity
n0 Initial porosity
ni Number of roots belonging to i-class diameter nini Initial porosity at 3rd stage of growth
nmax Maximum number of roots nmin Minimum number of roots
NPK Nitrogen, Phosphorous, Potassium
NV No-vegetated
n(z,di) Number of roots with diameter di p’ Mean effective stress
Pf Probability of failure PWP Pore Water Pressure q Deviatoric stress
(q-p’) Enveloping equation at critical state
qfbare Deviatoric stress at critical state for bare soil qfrooted Deviatoric stress at critical state for rooted soil
R Reconstituted
RAI Root Area Index RAR Root Area Ratio RARmax Maximum RAR
RARn RAR of the root class diameter RBM Root Bundle Model
RH Daily Relative Humidity RM Root dry biomass RMD Root Mass density RVD Root Volume Density s Matric soil suction s0 Initial soil suction Sr Saturation degree
SWCC Soil Water Characteristic Curve Te Daily external temperature
Tn Normal component of root tensile strength Tr Root single tensile strength
Tr,n Tensile strength of root class Ts Daily soil temperature
Tt Tangential component of root tensile strength TX Triaxial test
U Undisturbed
v Specific volume
vcons Specific volume after consolidation process
V Vegetated
V Total volume of root-soil sample VA Vegetated block A
VB Vegetated block B VC Vegetated block C VD Vegetated block D
Vr Total volume occupied by roots VWC Volumetric Water Content
W Wetting Test
w Gravimetric water content z Depth of rooted soil zmax Maximum root depth
Empirical constant for Tr law Empirical constant for Tr law d Bulk density
dcons Bulk density after consolidation process
r Root density
x Displacement of the bundle
s<0 Soil suction reduction during W test s>0 Daily suction increment during D test coll Volumetric collapse
Volumetric water content
s Saturated volumetric water content (-s) Soil water characteristic curve
Angle between the deformed root and initial vertical root Vertical stress
f Final shear strength Integrated friction angle ' Internal friction angle
ABSTRACT
Pyroclastic soils are widely diffused all over the world and they are characterized by high porosity and an open metastable internal structure. In situ they usually cover the shallowest layers of slopes in unsaturated conditions. As consequence, they are often involved in rainfall induced flow-like landslides triggered, during the rainy season, by water infiltration in unsaturated pyroclastic soils on steep slopes. The rain water infiltration leads to the volumetric collapse of the metastable structure in unsaturated conditions, and to liquefaction in fully saturated conditions. Once triggered, the propagating mass can reach great distances and cause many damages when it impacts with structures or infrastructures. These damages can be count as loss of life and economic damages.
As risk mitigation measures for these rainfall induced flow-like landslides, structural and passive control works such as dissipative basins and/or brindles have been usually adopted over the centuries.
An alternative sustainable risk mitigation measure can be represented by bio-engineering techniques, since they use natural elements such as woods or vegetation for stabilizing slopes prone to failure.
The effectiveness of bio-engineering practices depends firstly on the soil properties. This aspect was investigated by carring out an experimental study on the effect of soil nutrients on the plant growth and how this is reflected on the soil hydraulic response. It was found that nutrient availability in soil enhance the plant growth, particularly the root number, and this increases the effectiveness of the vegetation on induced soil suction during evapotranspiration.
After this preliminary study, the hydro-mechanical behavior of pyroclastic soils (widely known as rich in nutrients) permeated by roots of perennial graminae, typically used for controlling surface erosion, was investigated.
From drying (Evapotranspiration) and wetting (Infiltration) test results it can be claimed that the presence of roots influences mostly the shallowest layers of the soil (up to 1.2 m). In particular, during drying the effect of roots on induced soil suction is highlighted in dry season, when
air temperatures are high and the vegetation is florid. On the other hand, during wetting, the presence of roots tends to delay the water infiltration, even if the magnitude of suction reduction depends on the initial condition.
Oedometer tests provided original insigths on the role of roots on the internal structure of these collapsible soils. In particular, it was found that during root growth, the soil structure tends to reduce its porosity and this is reflected into a reduction of the collapsibility of the root permeated soil during wetting in unsaturated condition.
Shear strength of rooted soil, performed trough consolidated drained and undrained triaxial tests, show that the presence of roots increases both total cohesion and the internal friction angle, proportionally with the root biomass in the soil. Moreover, consolidate triaxial test results in undrained conditions showed that during post-failure stage the presence of roots reduces drastically the increment of pore water pressures avoiding the probability of static liquefaction of the material.
All those insights allow having a basic framework to design further experimental investigations in order to consider this technique a sustainable risk mitigation measure in unsaturated pyroclastic soils of the Campania region.
RINGRAZIAMENTI
Vorrei esprimere un sincero grazie alle persone che ho avuto vicino in questi tre anni di dottorato e senza le quali non sarei qui oggi.
Al mio tutor Prof. Leonardo Cascini, che sin dal primo giorno mi ha trasmesso il suo amore per la geotecnica e ha accettato la mia sfida con grande entusiasmo e passione. Senza la sua fiducia non avrei avuto il coraggio di “buttare il cuore oltre l’ostacolo” e appassionarmi alla ricerca, raggiungendo importanti traguardi e tante soddisfazioni. Al Prof. Sabatino Cuomo, pronto a chiarire i miei dubbi geotecnici e ad aiutarmi a migliorare. Senza le sue battute e la sua pungente ironia non avrei affrontato le difficoltà con la giusta leggerezza.
Al mio maestro della sperimentazione l’Ing. Vito Foresta, persona leale e sincera con cui ho condiviso gioe e dolori di questo dottorato. Senza la sua preparazione, disponibilità, e talvolta il suo sforzo fisico, sarei certamente annegata negli abissi del laboratorio.
Agli strutturati del laboratorio di Geotecnica, i prof. Settimio Ferlisi, Dario Peduto, Michele Calvello, presenze costanti e punti di riferimento per qualsiasi necessità. Un pensiero va a Mauro Forte e alla sua simpatica solarità, senza la quale i giorni passati al laboratorio non sarebbero stati gli stessi.
Agli assegnisti di ricerca e ai dottorandi, a tutti e ad ognuno di loro va il mio più sentito grazie per i piacevoli giorni passati insieme. Con affetto ricorderò le chiacchierate davanti a un “buon” caffè, i discorsi filosofici, i dubbi e le preoccupazioni che abbiamo condiviso durante questi tre anni.
Ringrazio di cuore il prof. Ng e tutto il suo gruppo per avermi accolto in un ambiente positivo e stimolante in cui ho avuto modo di imparare tanto durante il mio periodo di ricerca a Hong Kong. Grazie a Rafa, collega e amica, e a tutti gli amici che hanno allietato i miei mesi lontano da casa.
Grazie a Ilaria, con la quale ho condiviso la maggior parte dei traguardi accademici. Ricorderò con affetto e con un velo di nostalgia come eravamo e come, con sacrificio, impegno e tanta determinazione, siamo cresciute e maturate insieme durante questi anni. Gioisco due volte oggi per il nostro traguardo, con la speranza di poterne condividere ancora tanti insieme.
Un grazie a quello che è de “Il classico dell’amicizia”, il gruppo degli amici di una vita e per la vita. Grazie ad Annalisa e Ilaria, una la mia ala, l’altra il mio grillo parlante. E grazie a Sofia e Chiara, semplicemente le mie sorelle.
A ki da sempre ha creduto in me, spesso più di me. Con cuore e ragione mi ha sostenuto nei momenti negativi, rendendo unici quelli positivi.
Alla mia famiglia, nonna Sofia, Michele e i miei genitori. I pilastri della mia vita. Grazie per avermi supportato nelle scelte, anche quando non condivise, dimostrando sempre sincero amore e grande fiducia. Spero di avervi resi fieri di me.
ABOUT THE AUTHOR
Vittoria Capobianco graduated in July 2014 in Environmental
Engineering at University of Salerno with 110/110 cum laude. As part of the PhD activities, she performed soil suction and volumetric water content monitoring of soil permeated by roots in 1D physical model directly constructed at University of Salerno for the PhD purposes. Within the PhD research, she perfomed conventional laboratory tests, on bare soils and rooted soils to investigate the effect of roots on collapsibility and the soil shear strength.
Part of the research was conducted at Hong Kong University of Science and Technology, where she improved her knowledge on bio-engineering investigation and conducted an experimental study on the effect of nutrients in soil on plant growth and the induced soil hydraulic response. During the period abroad, she attended the “Unsaturated Soil Mechanics and Engineering” course and passed the final written examination.
Vittoria Capobianco consegue nel Luglio 2014 la laurea specialistica in
Ingegneria per l’Ambiente e il Territorio persso l’Università di Salerno con votazione 110/110 e lode. Nell’ambito del Corso di Dottorato realizza un modello fisico 1D in vera grandezza presso l’Università di Salerno per il monitoraggio dei valori di suzione e contenuto d’acqua dei terreni permeati da radici.
Nel corso della sperimentazione, conduce test di laboratorio convenzionali su provini di terreno con radici e senza radici per investigare l’effetto delle radici sulla collassabilità e sulla resistenza al taglio.
Parte dell’attività di ricerca è stata svolta presso l’Hong Kong University of Science and Technology, dove ha condotto uno studio sperimentale sull’effetto della presenza di nutrienti nel suolo sulla crescita delle piante e di conseguenza sulla risposta idraulica dei terreni radicati. Durante il periodo all’estero, ha seguito il corso di “Meccanica dei terreni parzialmente saturi” passando l’esame scritto finale.
1 INTRODUCTION
Some unsaturated soils having high porosity are known as “metastable” soils, because they can show irreversible volumetric collapse due to wetting under a constant mean effective stress.
Among them, pyroclastic soils produced by volcanic eruptions, are worldwide diffused and form shallow deposits of thickness up to few meters along the slopes rounding the volcanic areas.
As examples, pyroclastic soils covering mountainous basins of around 3000 km2 in Southern Italy (Campania region), due to the volcanic
activities of Somma-Vesuvius, are typically in unsaturated conditions and show a very open structure, which induces to volumetric collapse when suction is reduced due to rainfall infiltration.
Rainfall induced flow-like landslides systematically occur in these soils, as confirmed by the catastrophic events recorded in the last decades. These are caused by the most likely triggering mechanisms during the rainy season, such as the volumetric collapse due to wetting in unsaturated conditions and the consequent static liquefaction in saturated conditions.
Since the Middle Age landslide risk mitigation measures adopted in Campania region are mostly characterized by passive control works, which allow to the triggering of the unstable mass and reduce the risk by intercepting the flow during its propagation (brindle, channeling) or in the deposition zone (dissipative basins). However, these mitigation measures are expensive, environmental impactful and require frequent maintenance.
On the other hand, among the active control works (aimed to avoid the triggering of the unstable mass) bio-engineering techniques can represent an alternative and sustainable choice for unsaturated pyroclastic covers. Among them, the use of living plant materials, established by conventional seeding or live planting, is widely diffused to treat sites where surface stability and erosion problems arise.
The aim of this PhD thesis is to provide a contribution on the study of the effectiveness of using indigenous grasses (graminae species), which develop roots up to 2 m of depth, in unsaturated pyroclastic soils as
natural-based solution for slopes affected by rainfall induced flow-like landslides.
In particular, in Chapter 2 general features and geotechnical characteristics of pyroclastic soils, with a focus on those of Campania region, are discussed. The monitoring data of soil suction regimes in four test sites are collected from literature contributions and compared with seasonal trends of suction proposed by Cascini et al. (2014).
Chapter 3 introduces flow-like landslides and how they are classified in literature, highlighting the characteristics of debris flows and hyperconcentrated flows which seasonally occur in Campania region. The triggering stage, failure and postfailure stage are described to better understand the typical mechanisms in which pyroclastic soils are involved due to rainfall. Then, a brief description of the ancient and recent risk mitigation measures and their limitations are discussed. In Chapter 4 the bio-engineering practices for reinforcing the hydro-mechanical behavior of unsaturated soils are introduced and the experimental study conducted at Hong Kong University of Science and Technology on the effect of a rich nutrient soil on the effectiveness of vegetation on inducing soil suction is explained. The contents of this Chapter have been published as technical note contribution (Ng et al., 2018 in press).
Chapter 5 introduces the experimental study conducted at University of Salerno with the description of the physical model used for the investigation on the effect of vegetation, specifically roots, on the hydro-mechanical behavior of unsaturated pyroclastic soils.
Chapter 6 explaines the results obtained during the experimental investigation on the hydro-mechanical response of vegetated pyroclastic soils to atmospheric stresses (evapotranspiration and rainfall infiltration). Some of the contents of this Chapter have been published in a note within the IARG 2017 conference (Capobianco et al., 2017).
Chapter 7 deals with the effects of the presence of roots on the collapsibility of unsaturated pyroclastic soils through standard oedometer tests conducted on both rooted soils and bare soils.
Finally, in Chapter 8 the contribution of roots on increasing the soil shear strength is investigated with standard isotripically consolidated drained and undrained triaxial tests. The experimental mechanical parameters are compared with those computed by the W&W model for predicting the root cohesion in soil during shear. Then, conclusions of research are outlined and further developments are proposed.
Why do people live close to volcanoes?
Volcanos are widespread all over the world and it is well known the devastating potential of lava flows, pyroclastic flows and heavy falls of ash, which are produced during volcanic eruption, over lands, structures and infrastructures developed around the volcano.
Nevertheless, many volcanic regions are highly populated since volcanic ash soils are widely recognized as rich in nutrients which makes lands fertile, encouraging the agricultural activities.
In the middle of 20th century volcanic ash soils received global
recognition among soil scientists and in 1960 they were also identified for the first time in an international system of soil classification.
In the last decades the attention of scientific literature was focused on pyroclastic soils, whose physical and mechanical features are hereafter discussed mainly with reference to pyroclastic soils originated by Campi Flegrei and Somma-Vesusius eruptions in Campania region (southern Italy).
2.1 G
ENERAL FEATURES 2.1.1 OriginPyroclastic soils are produced by volcanic eruptions and they are distributed exclusively in areas where active or at least recently extinct volcanoes are located.
During an explosive eruption the magma rises from the mantle through the vent until the crust of the earth, with a subsequent explosion where magma is expelled either as lava or ash.
Ashes consist on fragments of rocks, minerals and volcanic glass which are ejected by the eruption column. The height of the eruption column provides the explosiveness of the event (Fig. 2.1), in particular the higher the eruption column height, the larger the explosiveness. In relation to this factor, starting from the lower explosiveness, the Hawaiian, Strombolian, Vulcanian, and Plilian eruption types are defined in literature (Schmincke, 2004).
Figure 2.1 Relative explosiveness and Resulting height of eruption for different eruption types (US Geological Survey)
The ash clouds formed by the eruption column can extend around volcanic areas depending on several factors: grain size of fragments, wind speed and direction, and eruption type. The grain size of fragments typically decreases with distances (Fig. 2.2). Larger and heavier rock fragments fall down in the area close to the volcano, and progressively smaller and lighter fragments are transported farther from the volcano by wind (Johnston, 1997).
Eruption column
Ash cloud
A specific volume of the soil is conveyed laterally
Distance from the vent
Figure 2.2 Schematic of ash clouds with mean particle size of ashes decreasing from the source of eruption (Johnston, 1997, modified)
Wind speed and direction during eruption strongly affect the dispersal pattern of volcanic ashes in the atmosphere and the dispersion of air fall deposits on the ground: significant change in wind directions within the same eruption event produces a complex dispersal pattern of pyroclastic deposits around the volcanic area. High wind speed can carry small volcanic ashes particles along great distance, as happened during the 2008 eruption of Chaitén in Chile: the ash cloud ejected by eruption column blew 1000 kilometers (620 miles) across Patagonia to Argentina, reaching both the Atlantic and Pacific coasts (Watt et al., 2009).
In the volcanic area, distribution and thickness of pyroclastic deposits of each eruption are quantified through the isopach lines, which are usually in form of ellipses and with elongation in the downwind direction. The dispersal axis of deposits is defined by the direction of elongation away from the vent. Figure 2.3 shows the isopach lines map of the 2008 eruption of Chaitén (Chile) and the dispersion of the ash clouds until the Argentina coast during the first week of eruption.
Figure 2.3 Isopach lines of the Chaitén distal ash deposit and thickness. a) Ashfall mass loading against thickness. b) plume dispersal over Argentina during the first week of eruption (Watt et al., 2009).
Among the pyroclastic products, bombs and blocks are fragments greater than 64 mm, while small debris such as scoria, pumice and ashes can be distingished depending on their grain size, composition and weigth.
Bombs and blocks are ejected respectively as incandescent lava fragments with aerodinamic shape and solid fragments with angular shape. Scoria and pumice are both ejected as highly porous fragments because of vescicles and holes formed by the gas dissolved in magma during eruption with different specific gravity (pumice is ligther than scoria and is not able to sink in water). The fragments smaller than 2 mm are usually named ashes (Fig. 2.4).
Figure 2.4 Size of eruption pyroclastic ejecta: a) bombs and blocks, b) scoria, c) pumice, d) ash.
2.1.2 Geographic distribution and land use
Volcanic ash soils, also called Andisols in US Soil Taxonomy (Soil Survey Staff, 1999) cover 124 million hectares, which means that they represent the 0.84% of the world’s land surface (Leamy, 1984). They are widespread all over the world, covering the volcanic regions where active and recently extinct volcanoes are located.
Ashy soils derived by active volcanoes is distributed along the main borders of tectonic plates such as the Philippine Islands, Indonesia, Pacific Island in Asia, the Rift valley trough Yemen, Ethiopia, Rwanda and Burundi, or Cameroon and Kenya in Africa, the Circum-Pacific Ring of fire in western American coast. Some other regions where pyroclastic soils cover the hillsides around volcanoes are located in Southern Italy in Europe, New Zeland, and Japan, western provinces of China, Arizona, southern portion of British Columbia and Alberta of Canada (Fig. 2.5). Considering the worldwide distribution of active volcanoes, the majority of pyroclastic soils cover tropical regions (Takahashi & Shoji, 2002). Despite the active volcanos eruption’s hazard, human population living in volcanic regions is extremely dense because pyroclastic soils are widely
recognized as important resource for agricultural activities, especially for upland crop production. Many agricultural regions of the world are located near active or dormant volcanos (Shoji et al., 1993a) since, during each eruption, an intermittent addition of volcanic ash rich in nutrients is generated providing a renew of the soil fertility status. The 27% of the total agricultural land use in Japan consists on cultivated volcanic ash soils (Takahashi & Shoji, 2002), in Indonesia the most densely populated areas are found near volcanoes, in Italy the mount Etna region represents around the 7% of the whole land of Sicily but contains more than 20% of the population of the island, because of the Etna-related factors of fertile soils and a reliable freshwater supply (Duncan et al., 1981). In Campania region of Italy, more than 600,000 people live exposed to the Vesuvius eruption risk, and cultivate the volcanic lands with grapes, vegetables, orange and lemon trees, herbs, flowers and tomato.
Figure 2.5 Worldwide distribution of volcanic ash soils (Andisols) according to World Soil Resources Staff, 1999 (Dahlgren et al., 2004).
The volcanic areas represent high natural hazard zones for two main reasons: the volcanic eruption hazard is related to volcano activity, and the shallow landslides hazard is usually greatly enhanced by the geomorphological features of hillsides and the hydro-mechanical
properties of pyroclastic deposits involved in landslides, as discussed in depth in the following sections for the case of pyroclastic soils in Campania region (Italy).
2.2 P
YROCLASTIC SOILS INC
AMPANIA REGION 2.2.1 Origin and diffusionMany areas of Campania region (southern Italy) are covered by pyroclastic soils produced by the past volcanos eruptions (Rolandi et al., 1998). In particular two main volcanic districts are distinguished in the so called “Campania Volcanic Zone” (CVZ): the Somma-Vesuvius district and the subordinated Campi Flegrei district with Ischia, Procida and Roccamonfina.
The Campi Flegrei depression volcanic zone is the older district of the area and is the result of two main episodes of subsidence: the older Campanian Ignimbrite caldera and the younger Neapolitan Yellow Tuff caldera formation. Inside the caldera more then seventy active eruptive centers were located (Budetta et al., 1993; Orsi et al., 1996; Rolandi et al., 2003) and intense fumarolic and hot spring activities are still frequent. The Campi Flegrei activities were studied by many authors in the past (Dellino et al., 2001, 2004; Fedi et al., 1991, 2004; Piochi 2005; Signorelli 2001). The pyroclastic soils produced by Campi Flegrei during the IV cycles of activities cover the Neapolitan area in either dissolved and litihified conditions. The products of the I cycle (> 35,000 years from now) are widespread all over the area; the Ignibrite campana (known as Tufo Grigio Campano), produced by the pyroclastic flow during the II cycle of eruptions (35,000-30,000 years from now), cover the Piana Campania site with thicknesses between 50-60 m; the Tufo stratified and Tufo Giallo Napoletano, the latter produced as pumices and lithic fragments, were the results of the III cycle of erutpions (18,000 – 10,000 years from now); the IV cycle of eruptions (10,000 years from now – 1538) produced pyroclastic loose products consisting of pumice, lapilli and ash (pozzolana).
The inactive volcanic apparatus of Roccamonfina had its last eruption more then 500.000 years from now. The diameter of the cone extends for 25 km and is located in the northern part of Campania region. Many
remarks of its past activities are reported in literature (Giordano 1998, Cole 1992, 1993; Vacca et al., 2003), while seismic movements and fresh water springs are still frequent.
Somma-Vesuvius is a moderate size (1281 m a.s.l.) volcano as the result of the older caldera Mt. Somma and the formation of the recent Vesuvius cone (Rolandi et al., 1998) that grew within the caldera after the AD 79 Pompei eruption (Fig. 2.6).
Vesuvius cone Mt Somma caldera
Figure 2.6 Vesuvius cone and Mt. Somma caldera (courtesy of Lab. Grafica e Immagini, INGV-Roma; Cioni et al., 2008 modified).
Vesuvius volcano is famous all over the world for the eruption of AD 79, which destructed the ancient Romanic city of Pompei. An accurate and suggestive description of this catastrophic event was reported by the Latin author Plinius in two letters to his friend, the historian Publius Cornelius Tacitus. The activities of the volcano started with the most ancient Plinian eruption (18,300 years BP) known as “Basal Pumice” eruption that caused the caldera formation, followed by three high-magnitude plinian eruptions called respectively Mercato (8000 years BP.; Rolandi et al., 1993a; Cioni et al., 1999b), Avellino (3800 years BP.; ; Lirer et al., 1973; Rolandi et al., 1993b; Cioni et al., 2000) and Pompei (AD 79) Pumice eruption (Lirer et al., 1973; Sigurdsson et al., 1985; Cioni et al., 1995).
Two subordinate eruptions occurred respectively in the 472 (Pollena) and 1631 (Principe et al., 2004), after that the activities became explosive with low intensity until the last eruption occurred in the 1944 (Cioni et al., 1999b; Arrighi et al., 2001).
Currently the Somma-Vesuvius is the only active volcano of the European mainland, and is one of the dangerous volcanos in the world because of the extremely dense population living around the volcanic cone. In order to enhance the emergency planning and the risk reduction, recently hazard assessment of new possible eruption scenarios were carried out (Todesco et al., 2002; Cioni et al., 2008; Gurioli et al., 2013).
2.2.2 Geological and Stratigraphical settings
The soil produced in Campania region from Somma-Vesuvius and Campi Flegrei eruption activities are distributed around the interested area either in dissolved and lithified conditions.
The area around Naples consists of lithified and dissolved pyroclastic soils originated by Campi Flegrei past activities, which appear very different in degree and type of alteration, even if they have similar composition, grain size, age and pre-eruptive environment.
On the other hand, the area covered by the pyroclastic deposits, originated from the Vesuvius past activities, is here presented with a brief summary about some features of the soils and their stratigraphical settings.
The pyroclastic deposits produced by Somma-Vesuvius were heterogeneously distributed in Campania region (southern Italy) according to the axes of dispersion reported in Fig. 2.7 in relation with the main plinian eruptions occurred (Cascini et al., 2008a). They covered three main geoenvironmental contexts: carbonate bedrock (A1, A2 in Fig. 2.7) around Sarno mountains, Monti Lattari and Monti Picentini, tuff and lava deposits (B in Fig. 2.7) located around the volcano and Caserta, and flysh and terrigenous bedrock (C in Fig. 2.7) in north east side (Calcaterra et al., 2004; Cascini et al., 2005). Pyroclastic soils covering carbonatic bedrock of Campania region are those which were mostly studied because in the years have been widely recognized as prone to landslide triggering induced by rainfall, as is discussed in depth in Chapter 3.
Isopachs of the pyroclastic products from the main eruptions Carbonate bedrock (A1, A2)
Tuff and lava deposits (B)
Flysch and terrigenous bedrock (C)
Figure 2.7 Geological map and dispersion of pyroclastic deposits produced by the main Somma-Vesuvius eruptions. Isopachs of the pyroclastic products from the main eruptions (Cascini et al., 2008a, modified)
Many authors investigated the recent thickness and distribution of pyroclastic deposits at different scales. At regional scale the isopach lines (Fig. 2.8) show the geographic distribution and the thickness range of deposits varying between 4 and 7 meters around the Sarno mountains, in east direction and 2 meters around Lattari Mountains, in south-east direction (Rolandi et al., 2000).
a)
b)
Figure 2.8 a) Isopach lines map of the Recent Pyroclastic Complex (Rolandi et al., 2000) (isopachous lines of the eruptions. The red rectangle represents the Mount Albino massif; b) Pyroclastic deposits thickness map of Mount Albino massif (Ferlisi et al., 2015).
Recently, an advanced thickness map at basin scale of pyroclastic deposits on Mount Albino massif (Fig. 2.9), located at the south-east side of the volcanic area, was carried out through an integrated analysis of data achieved via in-situ investigations and results of laboratory tests (De Chiara 2014; Ferlisi et al., 2015). This map showed thickness varying between 0.5 m in the flat zones through 4.0 m of deposits collected inside the concavities (zero order basins) until 9.0 m of deposits in the colluvial zones at the toe of the slope.
Stratigraphic successions of pyroclastic deposits were investigated from many authors in different test sites of the Somma-Vesuvius district, in particular Cervinara site (Olivares et al., 2002, 2004; Damiano, 2004; Damiano et al., 2012), Monteforte Irpino site (Di Crescenzo et al., 2007; Nicotera et al., 2008; Pirone et al., 2015) and Pizzo d’Alvano site (Bilotta et al., 2005).
Cervinara mountain basin (41°01'13.5"N, 14°36'52.0"E) was widely investigated from some authors after the debris avalanche occurred on December 1999 (Fiorillo et al., 2001). Pyroclastic covers in Cervinara
site, observed from a typical stratigraphical section constructed by Lampitello (2004) as result of several vertical investigations (Fig. 2.9), consist on ash layers alternating with pumiceous soil layers, sometimes mixed with weathered soil derived from the carbonatic bedrock. The soil layer directly in contact with the carbonatic bedrock is weathered fine-graded ashy soil.
Top soil & ashy soil Coarse pumiceous soil
Ashy soil
Fine pumiceous soil Fine weathered ashy soil
Carbonatic bedrock
Figure 2.9 Typical stratigraphical section of Cervinara test site (Lampitiello 2004, modified)
From field investigation of pyroclastic deposits in Monteforte Irpino test site (40°53'26.7"N, 14°42'52.4"E), it can be concluded that the stratigraphical succession is represented by a series of soil layers quite parallel to the ground surface. This sequence of soil layers is due to the different eruption occurred in the past as described in depth in section 2.2.1. Starting from the ground surface the sequence consists of 1) topsoil, 2) weathered and humified ashy soil, 3) pumices originated from the Avellino eruption; 4) palaeosoil consisting of weathered volcanic ashes; 5) pumices originated from the Ottaviano eruption; 6) palaeosoil consisting of weathered volcanic ashes; 7) volcanic sand; 8) highly weathered fine-grained ashy soil (Fig. 2.10).
Papa (2008) investigated the grain size distributions of the above mentioned soil layers, demonstrating a limited scatter and thus a uniformity of soil deposits.
First two shallow layers (soil 1 and 2) have a similar grain size distribution although the layer 1 is quite finer; the soil layer 4 is well graded
Figure 2.10 Typical stratigraphical profile of Monteforte Irpino test site (Nicotera et al., 2008)
ranging from sand to silt with a small clay fraction; finally layer 3, 5 and 7 are made of pumiceous and sand deposits and they are described as quite uniform coarse-grained materials, in particular soil 3 is a gravel, soil 5 a coarse sand, while soil 7 is silty sand.
Investigations on the typical stratigraphic sections of Pizzo d’Alvano Massif (Fig. 2.8a) were carried out after the rainfall-induced flow-like landslides occurred on May 1998, where many damages and loss of life were recorded in the urbanized areas located at the toe of the slope. Several flow-like landslides reached four villages located at four sides of the massif, respectively Bracigliano at East, Quindici at North, Sarno at South and Siano at South-East. Figure 2.11 shows the typical stratigraphic sections of the sites involved during the events of May 1998 (Cascini & Sorbino, 2003).
In Bracigliano site (Fig.2.11a) the stratigraphy is quite homogeneous due to the presence of a thick layer of ashy soil without any sequence of pumiceous layers originated by different eruptions. On the other hand, stratigraphic profiles of the other investigation sites show pomiceous soil layers at different depths among the main ashy layers (Fig. 2.11b,c,d), with a stratigraphic configuration similar to those observed for Cervinara and Monteforte Irpino sites.
Figure 2.11 Typical stratigraphic sections of the investigation sites (Cascini & Sorbino, 2003)
2.2.3 Physical properties
As previously mentioned, in this study the attention is focused on pyroclastic soils produced by Somma-Vesuvio eruptions and distributed on carbonatic bedrock (A1 in Figure 2.7) around the mountains of Campania region.
To this aim, the principal physical properties of these soils investigated in the recent years, are collected and discussed below.
Ashy soils are extremely porous and thus they are considered loose soils. The grain size distribution mostly depends on the eruption they belong and the consequent deposition process. Nevertheless in many cases two main litotypes can be distinguished. Bilotta et al. (2005) classified the ashy soils, on the basis of detailed analysis of grain-size distribution (Fig. 2.12) and statistical distribution of physical and mechanical properties of samples collected on Pizzo d’Alvano, in two main classes called ‘A’ and ‘B’ .
Figure 2.12 Ashy soils collected on Pizzo d’Alvano: range of the grain size distribution (Bilotta et al., 2005).
Mean values of the main soil physical properties of the ashy soils are reported in Table 2.1.
In general, class ‘A’ includes ashy soils with a finer grain size distribution, higher porosity values and lower specific gravity values than class ‘B’. On the basis of stratigraphical settings of most of the pyroclastic soil covers along slopes (Revellino et al., 2004; Bilotta et al., 2005; Cascini et al., 2008; Ferlisi et al., 2016), it was observed that generally coarser ashy soils of class ‘B’ form the superficial layers (1 – 2 m) and overlay those of class ‘A’, with presence of some interbedded pumice layers.
2.2.4 Chemical composition
Volcanic soils, and in general Andisoils, are widely recognized as rich in minerals. The primary minerals are volcanic glass, phenocrystal, feldspar, silica minerals and all the iron and magnesium-rich minerals together with minor content of allophone-like materials, imogolite, zeolite, non-crystalline silicate clays. Their aluminium-rich elemental composition, the highly reactive nature of their colloidal fractions and their high surface area result in unique chemical properties. Chemical and mineralogical characteristics are reflected in their physical properties and biological activities and affect positively the utilization of these soils for agricultural purposes. The striking accumulation of organic C and N in these soils is indicated by comparing the organic C (Carbon) and N (Nitrogen) contents between Andisols and other mineral soils.
C/N ratio (Carbon/Nitrogen) is the parameter commonly used to describe the cultivability of soils and that of cultivated Andisols (C/N =14) is higher than other mineral soils (C/N=11) (Nanzyo et al., 1993). Generally such soils exhibit pH ranging from 5 to 7 (weak acid range). These features change during the soil formation process and also due to eventual weathering phenomena. In particular, formation of non-crystalline materials and accumulation of organic matter are the dominant pedogenic processes occurring in most soils formed in volcanic materials (Shoji et al., 1993; Ugolini & Dahlgren, 2002). Time and climate combine to determine the relative degree of weathering and pedogenetic development. Moreover, in some cases, intermitted additions of volcanic ash restart the soil developmental processes, maintaining such soils in relatively stable chemical conditions.
In conclusion, Campania region is widely known as “Campania Felix” because of these fertile soils, which have been used for agricultural purposes since the V century B.C. thank to their chemical characteristics favorable for planting such as nuts, chestnuts, vineyards (Unger, 1953).