UNIVERSITÀ DEGLI
STUDI
DI ROMA
"TOR VERGATA"
FACOLTA' DI SCIENZE MATEMATICHE FISICHE E NATURALI DOTTORATO DI RICERCA IN
BIOLOGIA CELLULARE E MOLECOLARE XX Ciclo
The interaction network of phosphotyrosine recognition domains Michele Tinti
A.A. 2008/2009
Docente Guida/Tutor: Prof. Cesareni Coordinatore: Prof. Cesareni
Index
Index... 2
Abstract ... 3
Introduction ... 4
Phosphotyrosine network... 4
The Src homology 2 domain (SH2) in human proteome ... 5
The SH2 structure ... 8
Peptide Microarray... 10
Aim of the work ... 12
Results ... 13
Phosphopeptide chip ... 13
Antibody specificity... 14
SH2 domains specificity ... 15
Coverage of interaction described in literature ... 25
SH2 network ... 28 Discussion ... 32 Antibody specificity... 32 Specificity of SH2 domains ... 33 Methods... 37 Peptide selection ... 37 Antibody specificity... 37 SH2 domain specificity... 38
Spot signal evaluation ... 38
Two Sample Logo visualization ... 39
WebLogo visualization ... 39
Literature interactions ... 39
Artificial neural network training ... 41
Contextual evidence for interaction ... 41
Bayesian inference ... 42
Immunoprecipitation... 43
GST – Pull down assay ... 44
Abstract
Residues cycling between a phosphorylated and a non-phosphorylated form play a key role in the modulation of signal transduction. Over the past few years we have designed and implemented a strategy to describe the network of interactions linking phosphorylated peptides to their binding domains. Here we report the substrate specificity characterization of SH2 domain family. We have cloned and expressed all the 120 human SH2 domains; for 73 of them we have been able to identify their recognition specificity by incubating the proteins with a glass chip containing approximately 6000 phospho-peptides covering most of the human phosphotyrosine-proteome. The sequences of peptides selectievely bound by SH2 domains were used to infer the interaction network mediated by this phosphotyrosine recognition module. The coverage of interactions previously described in the literature and the results of our pull-down experiments have demonstrated that our approach provides a significant and trustworthy shortcut for the detection of molecular interactions involved in tyrosine phosphorylation networks.
Introduction
Phosphotyrosine network
Over the past two decades it has become clear that tyrosine phosphorylation plays a pivotal role in a variety of important signaling pathways in multicellular organisms including those of cell growth and tissue differentiation, inter-cellular communication as well as immune response (Pawson and Scott, 2005). Tyrosine phosphorylation is reversible and dynamic in vivo; phosphorylation states are governed by opposing activities of protein tyrosine kinases (PTKs) which catalyse tyrosine phosphorylation, and protein tyrosine phosphatases (PTPs) which are responsible for dephosphorylation. The consequences of this post-translation modification can be divided in two broad classes (Fig. 1). In the first class
Figure 1. Protein regulation through tyrosine phosphorylation. A) Through the phosphorylated tyrosine, the GAB1 adaptor may generate an interacting platform for proteins with SH2 domain as GRB2. The assemblage of this protein complex is a key event for the signal transduction of several growth factors. B) The tyrosine phosphatase SHP2 is regulated by an intramolecular interaction between the N-terminal SH2 domain and the phosphorylated C-terminal tail (close conformation). The protein dephosphorylation of SHP2 N-terminal tail promotes the activation of the
the phosphorylation event acts as a molecular switch to activate or deactivate a protein. In addition, the phosphorylated tyrosine can mediate the formation of multi-protein signal complexes thanks to the action of phosphotyrosine recognition domains such as the SH2 or PTB module. Perturbations of the tyrosine phosphorylation cycle at any level are involved in the development of human diseases such as autoimmunity, diabetes and cancer. Accordingly, there is a considerable interest in proteomic efforts to profile and identify tyrosine-phosphorylated proteins under various physiological conditions (Rush et al., 2005). In particular, research in tyrosine phosphorylation has greatly benefited the advance in current mass spectrometry-based approaches, which in principle make it possible, to characterize the complete phosphoproteome of a cell (Olsen et al., 2006). The typical vertebrate cell phosphotyrosine content represents only a tiny fraction of the total protein phosphorylation content. Anyway, mass spectrometry sensitivity in synergy with the sample enrichment step, dramatically increments the fraction of detected tyrosine phosphorylated sites. As a consequence, the Phosphosite (Hornbeck et al., 2004) and PhopshoElm (Diella et al., 2008; Hornbeck et al., 2004) database collecting protein phosphorylated sites are expanding exponentially their information content. However the phosphotyrosine network remains largely unexplained due to the many phosphorylated sites yet to be associated to the interplaying proteins (PTKs, PTPs, SH2 and PTP domains). To accelerate the research in this field, we have developed an approach that combines a novel peptide chip technology based on high-density phosphorylated peptide spotted on glass slides, to characterize the specificity of phosphotyrosine binding domain. We have started to apply and test this technique on the SH2 domains.
The Src homology 2 domain (SH2) in human proteome
SH2 domains represent the largest class of known pTyr-recognition domains (Pawson et al., 2001). A recent bioinformatics approach made it possible to identify a total of 120 SH2 domains contained in 110 distinct proteins, among those 10 have dual SH2 domains (Liu et al., 2006). In addition to SH2 domains, the PTB domains also bind specific pTyr-containing motifs on activated receptor tyrosine kinases (RTKs) (Yaffe, 2002). However, only about one quarter of the 79 human PTB domains have apparently acquired the capacity for pTyr-dependent recognition, while the
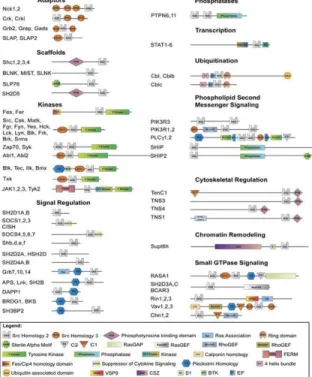
majority of PTB domains recognize non-phosphorylated peptide ligands, or phosphoinositides (Henry et al., 2003; Uhlik et al., 2005). SH2 domains therefore appear to be totally dedicated to pTyr recognition and thus represent primary targeting and specificity elements in tyrosine kinase signaling (Pawson and Scott, 1997). SH2 domains are incorporated into proteins with a range of biochemical properties. The SH2-containing proteins can be classified into 11 functional categories, based on their modular domain composition (Fig. 2).
Taken together, this information delimits the physiological SH2-containing targets available for pTyr signaling in human cells. Since the functional output from any given PTK likely depends on the subset of SH2 signaling proteins which it recruits either directly or through phosphorylated scaffold proteins, these data define the predominant pathways through which
Figure 2. Modular Domain Organization of SH2-Containing Proteins Classification and domain composition of the 110 non-redundant human SH2 domain-containing proteins identified in human by Pfam (http://pfam.sanger.ac.uk/) and SMART (http://smart.embl-heidelberg.de/).
PTKs modify cellular behaviour. The groups of SH2 proteins indicate that pTyr-dependent interactions channel PTK signals into defined, albeit diverse, areas of cellular regulation. These include tyrosine phosphorylation itself (through cytoplasmic PTKs and tyrosine phosphatases), the control of phospholipid metabolism (by phosphatidylinositol 3′-kinase, PLCγ and inositol phosphatases), the regulation of small GTPases (including Ras, Rho, Rap, and Rab family members) by guanine nucleotide exchange factors (GEFs) and GTPase-activating proteins (GAPs), gene expression directed by STAT transcription factors, ubiquitylation mediated by Cbl E3 protein-ubiquitin ligases, and finally cytoskeletal organization by tensin proteins. A group of SH2/SH3 proteins act as adaptors (i.e., Grb2, Crk, and Nck), each of which appears to target a set of SH3 binding proteins with related functions (Pawson, 2004). Nck recruits cytoskeletal regulators such as N-Wasp and Pak serine/threonine kinases (Buday et al., 2002; Rivera et al., 2004); Grb2 binds Sos and Gab1 (Neel et al., 2003; Rozakis-Adcock et al., 1993; Takenawa et al., 1998) involved in MAPK/PI3K signaling; and Crk targets GEFs for Rap and Rac GTPases that control adhesion (Feller, 2001).
In addition, a significant number of SH2 proteins regulate the duration and location of PTK signaling. For example, SOCS proteins are transcriptionally induced by JAK-STAT signals and provide an inhibitory feedback both by blocking JAK tyrosine kinase activity and by promoting ubiquitylation (Ilangumaran et al., 2004). Cbl proteins induce pTyr-dependent receptor multiubiquitylation and thus create binding sites for endocytic proteins with ubiquitin interaction motifs, involved in receptor trafficking (Haglund and Dikic, 2005). SH2 proteins can also directly interact with active sites of RTKs, exemplified by the SH2 domain of the APS protein. This domain simultaneously homodimerizes and binds the phosphorylated activation loop of the insulin receptor (INSR), potentially stabilizing the active state of the receptor (Hu et al., 2003). Conversely, the SH2 domain of the related Grb14 protein is proposed to bind the phosphorylated INSR activation loop but has a 45 residue sequence (BPS region) located between the SH2 and PH domains that antagonizes receptor activity by acting as a pseudo-substrate (Depetris et al., 2005). Thus, SH2 proteins, in addition to acting as “on” or “off” regulators of intracellular biochemical pathways, can modify the kinetics, activity, and substrate specificity of tyrosine kinase signals. Given the large repertoire of distinct interaction and catalytic domains in the human proteome, it is evident that SH2 domains are associated with a focused subset of modules, most notably SH3, PTB, PH, kinase, phosphatase, GEF, and GAP domains (Fig. 2). This
may reflect the requirement that SH2 proteins initially act near the plasma membrane to engage specific signaling networks that promote cell growth, differentiation, morphology, and metabolism, although proteins such as STAT transcription factors subsequently move to other sub-cellular compartments.
The SH2 structure
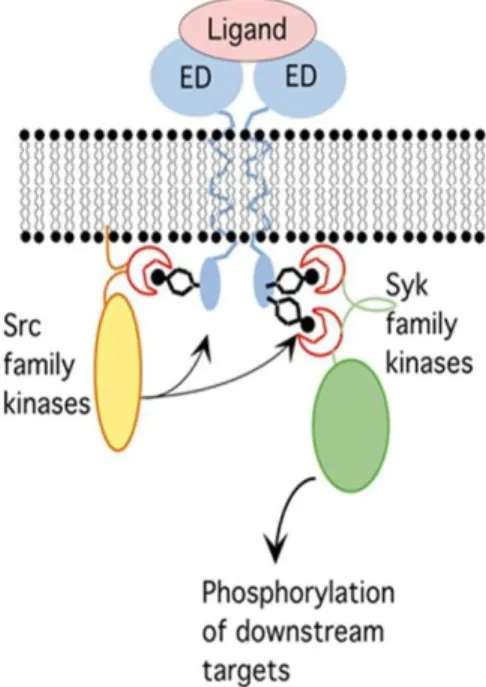
An example of signal transduction mediated by SH2 domains is shown in Figure 3. In this model, a receptor is activated by the binding of an extracellular ligand. This binding event induces activation of kinase
Figure 3. Schematic model for receptor activation and tyrosine
phosphorylation in immune signal transduction pathways. Binding of ligand to the extracellular domain (ED) of an immune receptor results in activation of Src family kinases, which causes phosphorylation of ITAM sequences (indicated as dpITAM) on tyrosine residues. These serve as docking sites for the tandem SH2 domains of Syk family kinases, resulting in Syk activation and phosphorylation of downstream targets.
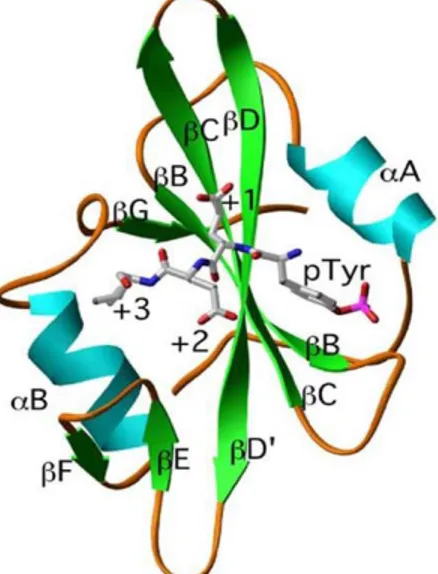
activities on the other side of the membrane, resulting in specific phosphorylation on tyrosine residues located in the intracellular domains of the receptor. This process constitutes the fundamental event of signal transduction through a membrane, in which a signal in the extracellular compartment is "sensed" by a receptor and is converted inside the intracellular compartment to a different chemical form, i.e. that of a phosphorylated tyrosine. Tyrosine phosphorylation leads to activation of a cascade of protein-protein interactions whereby SH2 domain-containing proteins are recruited to tyrosine-phosphorylated sites. This process initiates a series of events which eventually result in altered patterns of gene expression or other cellular responses. Recognition of tyrosine-phosphorylated sites by SH2 domains must be strictly specific. Misreading of phosphorylated sites by SH2 domains would lead to recruitment of inappropriate SH2 domain-containing proteins to the receptor and hence to undesirable activation of pathways. It was established several years ago that specificity is conferred by the sequence context of the phosphotyrosine within the tyrosine-phosphorylated site (Fantl et al., 1992; Kashishian et al., 1992). As shown in Figure 4, the SH2 domain structure consists of a large b-sheet flanked by two a-helices (Kuriyan and Cowburn, 1997; Waksman et al., 1993). The phosphotyrosine in the phosphopeptide inserts itself into a positively-charged pocket in the SH2 domain located on the N-terminal side of the central b-sheet. An arginine residue, Arg bB5, lines the bottom of the pocket and forms an essential bidentate ion-pair with two of the phosphate oxygen in the phosphotyrosine. This architecture of the phosphotyrosine-binding pocket explains the strict requirement of SH2 domains for phosphorylation on tyrosine residues (Waksman et al., 1992). Recognition of the sequences C-terminal of the phosphotyrosine is mostly determined by residues in the SH2 domains located on the C-terminal side of the large central b-sheet. In the SH2 domain of the Src kinase, these residues form a deep hydrophobic pocket into which the third residue in the phosphopeptide is inserted (Eck et al., 1993). Crystallographic studies of the SH2 domain of the SHP2 phosphatase also showed a more open binding site (Lee et al., 1994). Here, the +3 binding pocket still exists but opens up on the side of helix aB, allowing the +5 position of the peptide to bind. Finally, another binding mode was identified in the structure of a complex of the SH2 domain of Grb2 bound to a high-affinity tyrosil phosphopeptide (sequence pYVNV; Grb2-SH2 binds phosphotyrosyl peptides with the consensus pYXNX in which the specificity determining residue is N+2 i.e. the second residue C-terminal to the pTyr is a Asn) (Rahuel et al., 1996). In this
complex structure, a Trp residue in the SH2 domain closes the +3 binding pocket and prevents the phosphopeptide ligand from assuming the expected
extended conformation seen in other SH2 domain-peptide complexes. Although SH2 domains have been studied extensively over the past two decades, most investigations have focused on one or just few molecules of interest. Thus, while traditional methods have yielded abundant information about individual domains, they have been less successful at providing an integrated understanding of the biological systems that they regulate.
Peptide Microarray
Over the past decade, microarray technology has revolutionized the Figure 4. Schematic ribbon diagram of an SH2 domain. The structure
shown is the Src SH2 domain combined with hmT phosphopeptide. The β-helix, α-sheets, and loops of the domains are represented as ribbons, arrows, and single lines, respectively. The notation used to label the secondary structure elements is that in Waksman et al, 1993. The Phosphotyrosine(pTyr), glutamate (+1) glutamate (+2) and isoleucine (+3) of the hmT peptide are also shown and labeled with black solid bounds.
study of gene expression. Arrays of nucleic acids, comprising either single-stranded oligonucleotides or double-single-stranded PCR products, have been used to measure the abundance of thousands of transcripts in cell or tissue samples. The technology is well suited to large-scale, system-wide investigations for two reasons: (1) it enables many different samples to be interrogated simultaneously in a rapid and economical fashion; and (2) it
enables such experiments to be performed hundreds or even thousands of times, with different cells under different conditions. These two features of the technology apply equally well to the system-wide study of protein function (Fig. 5). In fact the clear advantage of the array format could then be fully exploited to study protein interaction in those cases where one of the partners participates in complex formation by docking a relatively short peptide into a receptor protein. Our partner Jerini has developed and reported methods to fabricate microarrays of purified peptides at high spatial density on chemically-derivatized glass microscope slides. In order to perform functional assays, we have developed surfaces that permit covalent attachment of peptide and exhibit low non-specific binding properties. The microarrays of peptides can be probed with the protein of interest to identify stable interactions, so providing a robust approach to study protein function in a rapid, economical, and system-wide fashion.
Figure 5. Peptide chip technology. Protein-peptide interactions (A) or
protein-protein interactions (B) can be revealed with an antibody conjugated to a fluorophore. Otherwise it is possible to conjugated directly the fluorophore to the protein of interest.
Aim of the work
We are now applying chip technology to study the specific and to infer the interaction partners for the human family of SH2 domains. These projects involve probing microarrays of 6200 phosphorylated peptides with a gst-fusion chimera of the domain of interest. These types of interactions include a large fraction of those involved in signal transduction and cell cycle control. We envisage that this systematic approach, combined with appropriate informatic analysis, is likely to bridge some gaps in our understanding of the cross talk between well-studied biological pathways.
Results
Phosphopeptide chip
We decided to create a glass chip representing the tyrosine phosphorylated sequence of the human proteome. To this aim we downloaded the dataset of PhosphoELM to compile a list of 13 mer peptide
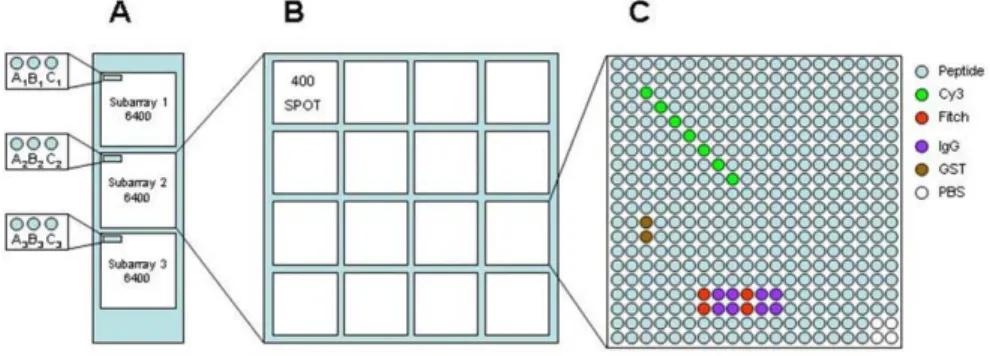
with the phosphorylated tyrosine in the middle. We used this peptide list to train a neural network and predict over the human proteome other phosphorylated sites. We ended up with a list of 6200 phosphorylated peptides that were synthesized and then printed at high density on glass slides. As exemplified in Figure 6A, a sub-array of 6400 positions is printed three times in each slide. In this way a peptide sequence has three binding value once probed with the domain of interest. During spot printing, the sub-array is further divided into 16 regions of 400 spots (Fig. 6B). These regions illustrated in Figure 6C contain the phosphorylated peptides plus several control spots to facilitate the grid orientation (Cy3 and Fitch dyes), to check
Figure 6. The structure of the phosphorylated peptide chips used to
profile the substrate specificity of human SH2 domain. A) three identical subarrays are printed on the chip surface. B) Each sub-array is composed of a 4x4 grid of 400 spots. C) Each small grid unit contains the peptides and the control spots reported in legend.
for secondary antibody binding (IgM and IgG) or as negative control (GST and PBS).
Antibody specificity
We first developed and tuned the protocol by probing the chips with three commonly used anti-phosphotyrosine antibodies (4G10, PTYR100, PY20). The interaction of the anti-phosphotyrosine antibodies with the phosphopeptides was revealed with a secondary antibody conjugated to a
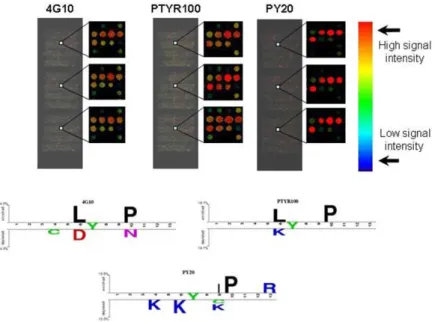
Figure 7. Phosphopeptide chip technology and antibody profile. The
image outputs of the laser scanner are reported for the profiled antibodies (4G10, PTYR100 and PY20). The same sub-array chip region (approximately 1 mm x 1 mm) of each experiment is enlarged to show the high reproducibility of the signals. The color of each spot is related to the fluorescence intensity as represented by the rainbow bar. Warm colors indicate high fluorescence intensity, cold colors indicate low fluorescence intensity and black represents no fluorescence signal. The aminoacid composition of the peptides with the higher signal intensity (positive data set) is visualized with the logo representation for the probed antibodies.
fluorescent group. One chip was probed directly with the secondary antibody to exclude the presence of non-specific binding (data not shown). As illustrated in Figure 7, the intra-chip reproducibility is high. After measuring the spot intensity of the three slides, we computed for each peptide the median of the three replicated spots. We applied the median instead of mean for spot signal evaluation to minimize the effect of out- layer peptides. Subsequently, we defined as “binders” (positive set) the spots with a median greater than the median intensity of every peptide considered plus two standard deviation (positive threshold). The described analysis process allowed us to identify a collection of peptides that did not light up in either of the three experiments. We decided to flag these flawed spots as 'BAD' (approximately 900) as such they were not taken into account in further data processing steps. We suppose that the bad spots reflect degraded or problematic peptides that failed to synthesize correctly. With the aim of highlighting significant differences in amino acid composition between the recognized peptides, we applied the Two Sample Logo software (Vacic et al., 2006). This program displays in the upper and lower part of the Logo the residues that are enriched in the positive and negative sets respectively reported in Figure 7 the 4G10 and PTY100 seem to share a similar pattern of enriched aminoacids with a proline in position +3 and a leucine in position -1. Meanwhile the -1 position. Moreover the -1 position differentiates the binding specificities of these two antibodies, since 4G10 does not allow negatively charged aminoacids while PTYR100 avoids positively charged aminoacids. By contrast the PY20 appears to enrich for isoleucine and proline in position +2 and +3, respectively. Moreover this last antibody seems to dislike positive charged aminoacids in several positions.
SH2 domains specificity
In order to clarify the substrate specificity of the Human SH2 domains the chips were probed with SH2 domain expressed as GST fusion proteins. We tried to express the 120 human SH2 domains but we did not succeed in purifying 46 recombinant proteins, most of these belonging to SOCS, RIN, STAT family. The interaction between the remaining 74 SH2 domains with a phosphopeptide was revealed with a secondary anti-GST antibody conjugated to a fluorescent group. As control, one chip was probed with the GST protein alone and the signal was revealed with the secondary antibody
to exclude the presence of non-specific binding (data not shown). A visual inspection of chip images before signal evaluation detected good signal to noise ratio data for 73 of the 74 probed SH2 domains and convinced us to
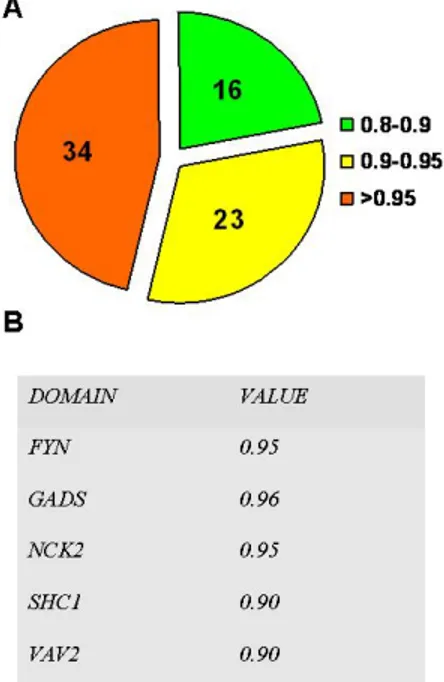
exclude from the analysis the SOCS5 experiment due to high background problems. For each probed domain we computed the correlation coefficient of the three replicated sub array as an estimate of the intra-chip experimental reproducibility (Fig. 8A). More than half of the probed SH2 domains showed a intra-chip correlation coefficient above the 90%, demonstrating the high reproducibility of this system. The VAV2, SHC1, FYN , GADS and NCK2 domains were probed twice to evaluate also the inter chip reproducibility (Fig. 8B). A first appraisal of peptides selected in the GRB10, BTK, APS,
Figure 8. Valuation of experimental reproducibility. A) Each chip is composed of three replicated subarrays. We computed and plotted the Pearson correlation coefficient for the probed slides. 34 slides showed an intra chip reproducibility above 0.95. 23 slides showed an intra chip reproducibility between 0.9 and 0.95. 16 slides showed an intra chip reproducibility between 0.9 and 0.8. B) The reported SH2 domain (DOMAIN) were probed twice to evaluate the Pearson correlation coefficient (VALUE) between independent experiments.
SHD, TENC1, TXK, VAV1, SLP76 and TNS3 SH2 experiments revealed a strange enrichment for cysteine containing sequences. We hypothesized the presence of peptides which probably bridge the interacting proteins with a disulfide bond, determining a non-specific binding pattern. Therefore we decided to exclude 230 cysteine containing sequences from the analysis. After removing this peptide batch, we applied the same analytic process used with the phosphotyrosine antibodies. In this case the binding profile of each probed domain, the number of interacting peptide and the total information content value were analyzed with a modified Web Logo Algorithm and reported in Fig. 9. We used the total information content as a specificity benchmark, summarising the aminoacid enrichment score for each peptide position. As shown in Figure 9 only the BCAR SH2 domains shows a total information content below 8.0. On the other hand the SH2 domains that seem to be more restrictive for binding peptides are the FES, VAV1 and VAV2 proteins with a total information content of 12.2, 11.3 and 11.5 respectively. In those domains, it is clearly evident that the more important positions in determining the SH2 specificity are the +1,+2, and +3 sites in respect to the phosphorylated tyrosine; meanwhile aminoacidic positions beyond the +3 seem to be important only for the BRDG1 and BKS protein. The aminoacidic preferences represented in Logo images cannot immediately divide the SH2 domains into discrete specificity classes. To this end we analyzed the position specific scoring matrix generated during Logo analysis with the EPCLUST algorithm. Our modified WebLogo algorithm stores for the probed SH2 domain a 20 X 12 matrix; unless the invariant phosphotyrosine, this matrix reports the observed frequency of each aminoacid (20) for every peptide position (12). As evidenced in Figure 10, we propose to divide the SH2 specificity into seventeen major families, taking account of the selected aminoacid preferences at the considered position. As also clearly represented in the Logo picture (Fig. 9), the III class encompassing the BRDG1 and BKS SH2 domains is characterized by a leucine selection in position +4. Moreover the proline in position +5 outlines the BKS domains as the SH2 module which extends the specificity in a peptide region so far away from the phosphorylated tyrosine. Another peculiar specificity is represented by the SLP76 and MIST SH2 domains belonging to XIV class. These are the only SH2 domains that recognize an aspartic acid in position +1 associated with a strong selectivity for non-charged aminoacids in position +3. The distinctive feature of IV class, comprising the SHIP1, SH2D1A, SH2D1B and CSK proteins is defined by a strong preference for valine and non-charged aminoacids in position +3. The
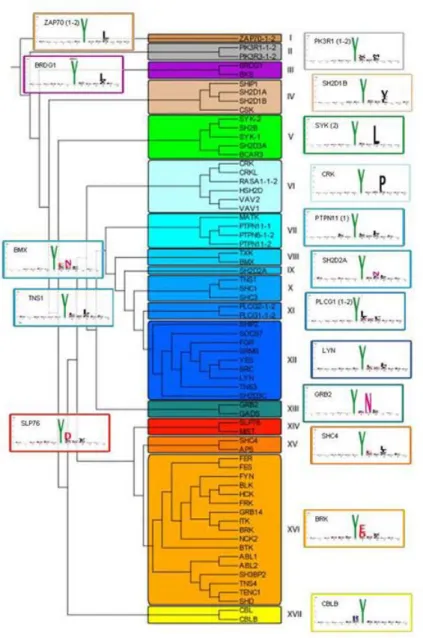
CSK protein is also unique for selecting an alanine, serine and threonine in position +1 that perfectly match the well-described consensus sequence surrounding the regulatory tyrosine of SRC related kinases, the common target of this peculiar SH2 domain (Songyang et al., 1994b). The leucine in position +3 characterizes the ZAP70 domain (class I) and the domains belonging to class V where the importance of leucine in +3 is more evident (SYK, SH2B, SH2D3A and BCAR). The VI class is the last one marked by a strong selectivity in the +3 position that outlines a proline. By contrast the asparagine in +2 position delineates the specificity of class XIII, and to a lesser extent classes VIII and IX. XII and XVI are the largest classes identified and the main difference between these two clusters resides in +1 position, where class XVI shows a tendency to accommodate charged aminoacid while class XII favours non charged aminoacids. In both classes also the +2 position shows high enrichment for non-charged aminoacids. Hydrophobic aminoacids in +1 and +3 positions also delineate the specificity of classes VII, X, XI and XV and the last two classes also being able to accommodate charged aminoacids in position +1. Finally, the atypical SH2 modules inside the CBL and CBLB proteins appear to be the only domains that can accommodate an arginine in the -1 site in respect the phosphorylated tyrosine. When the specificity classes were imposed on the sequence homology tree of human SH2 domains we noticed that the proximity in the homology tree does not always reflect the same substrate specificity. In fact, as shown in Figure 11, the sequence homology clusters the SH2 domains into 4 main tree branches and all these branches contain domains with different specificities. This observation is also supported by the scatter plot analysis in Figure 12, where we correlate three different values: the distance score retrieved with the epclust algorithm (specificity), the homology distance retrieved with the clustalw analysis (homology) and the percentage of shared peptides between the considered domain couples (shared peptide). In the case of perfect correlation, the resulting dot plots should be distributed along a straight line from the left bottom corner to the right corner, upper in the rear. The image shows that the domain homology does not necessarily correlate with the capacity to recognize the same peptides. Anyway, the domain couples with a homology value greater than the 40% seem to be able to recognize similar peptides. Otherwise, domain couples that share a sequence homology lower than 40% are distributed equally in the lower part of the plot, reflecting the impossibility to infer the binding profile of SH2 domains with a sequence only based approach.
Figure 9. Substrate specificity of SH2 domains. The aminoacid
composition of the positive data set selected by each probed domain was analyzed by a WebLogo adapted algorithm. The images, listed in alphabetical order, report the total information content and the number of peptides comprising the positive data set.
Figure 10. SH2 domain specificity clusters. The specificity distance was computed with the Epclust program (www.bioinf.ebc.ee/ EP/EP/EPCLUST/) and plotted with the FigTree application (http://tree.bio.ed.ac.uk/software/figtree/). After selecting an arbitrary distance, we determined 17 specificity classes highlighted with different colors. The figure reports near the defined specificity class the Logo of one representative SH2 domain.
Figure 11. Homology tree of SH2 domains. The annotated peptide sequences of SH2 domains were retrieved from SWISS-PROT database and aligned with clustalW2 algorithm. The homology tree was plotted with the FigTree program and the specificity classes (represented in Fig 10) were evidenced with a colored box for the analyzed SH2 domains
Coverage of interaction described in literature
The described approach inferred a number of protein interactions variable from 359 (SH2D1B) to 41 (N-terminal SH2 domain of protein SYK), with a mean of 193 selected peptides for SH2 domain (Fig. 9). In order to verify the reliability of this large amount of data we decided to set up a strategy to establish how many SH2 mediated protein interactions described in literature, are covered with our approach. For this purpose we assembled a golden standard list encompassing all the literature-reported protein interactions undoubtedly mediated by SH2 domain recognizing tyrosine phosphorylated substrates. To this end we have developed a simple
Figure 12. 3D correlation plot. The graph reports in the x axes
(specificity) the specificity distance computed with the epclust program for each SH2 domain couples. The y axes (homology) report the homology distance computed with the clustalw program for each SH2 domain couples. The z axes (homology) report the fraction of recognized peptide in common between the positive dataset of each SH2 domain couple.
text mining approach to recover to screen the literature. The PubMed database (http://www.ncbi.nlm.nih.gov/pubmed/) was firstly queried in Mesch Terms, title and abstract with a list of keywords related to the SH2 domain (SH2, SH-2, Src-homology 2…). To increase the coverage of articles regarding SH2 mediated protein interaction we queried PUBMED also for the names of proteins containing the SH2 module. The resulting medline queries were combined and the abstract of experimental articles were parsed with a Python script to extract sequentially: 1) the name of any SH2 containing protein 2) the presence of words describing an SH2 domain 3) the description of a tyrosine phosphorylated site 4) the presence of keywords related to protein-protein interaction. Evidences for any considered fields were highlighted in the title and abstract meanwhile the articles selected from the PepCyber database were skipped during the parsing. We did not automatically identify the relation between the SH2 containing protein and substrates because we decided to extract manually the relevant information in the identified articles. When this work was in the process, we learned of a similar effort by (Gong et al., 2008). The data curated by this group, including 489 SH2 related articles, is available in a public database. 141 of the articles in our curation effort were not present in the PepCyber database while 124 were in common. Among the entries in this latter collection we found 20 discrepancies in the information extracted by the curators. These entries were re-examined and the discrepancies fixed. Finally the PepCyber database contained 365 articles that were not yet curated in our effort. We analyzed these 365 articles and for 135 of them we couldn’t find any experimental evidence supporting an interaction between an SH2 domain and a specific phosphorylated peptide. The remaining 230 articles were re-curated according to the PSI-MI standards and controlled vocabularies. The golden standard interactions were used to evaluate the overlap between the literature-reported interactions and the interactions identified by the peptide microarray technique. As reported in Table 1, only eight domains had no correspondence in the golden standard interactions, while the other SH2 domains showed a coverage of golden standard interaction variable from the 16% for SHC1 domain (19 literature interaction of which 3 are identified with peptide microarray) to the 100% of the YES, GADS, CBLB, VAV2, FGR and SH3BP2 domains.
Table 1. Golden standard coverage. The table reports the probed
SH2 domains (PROBE) for which we identified at least one interaction described in the literature. The column GD_FOUND refers to the number of golden standard interactions that we found with our experimental approach; GD_IN_CHIP refers to the number of golden standard proteins whose interacting peptide(s) is/are spotted in our chip. The percent fraction of GD_FOUND/ GD_IN_CHIP is reported in the last column.
SH2 network
In order to identify new physiological interactions in the SH2 network defined with our approach, we decided to develop a combined experimental and computational approach to correctly place the human SH2 module in the context of a functional human interactome. Our strategy for discovering potential substrates of a specific SH2 containing protein involves several steps. The raw experimental data of the chip probed with the SH2 domains were fed into a software whose purpose is to train an artificial neural network that learns from the data an abstract model able to capture the rules determining the SH2 specificity. This computational step aims the two-fold aim of cleaning the data from random noise or experimental artefacts and predicting over the amino acid sequences not spotted on the chip. In fact many advances in mass spectrometry technique allowed to determine several tyrosine phosphorylated site, unknown in 2001 when we compiled the sequences to spot on our chip. Then, the “polished” chip data were combined with different types of information into a single Bayesian framework to build up an integrated confidence score for each potential interaction (Fig. 13).
Figure 13. Inference strategy. The raw data produced with our chip technology was integrated in a Bayesian framework to infer new SH2 mediated interaction. A) For any considered interaction we evaluated the neural network score, the tissue co-expression of the protein pairs, the conservation of substrate peptide sequence over different species, the proximity in the human interaction network, the solvent exposure of substrate peptide and the organelle co-localization of protein pairs. B-C) The evidences combined in the Bayesian framework generated a ranked list of interacting peptides that can be visualized with a weighted protein network.
These types of data are orthogonal with respect to the binding information obtained from the chip and include localization within the cell, co-expression in diverse tissues, proximity in the protein interaction network, the structural properties and the degree of evolutionary conservation of the binding site. The outcome of this integration step was a list of candidate substrates, each accompanied by a score (0-1) reflecting how likely the protein is to actually bind a phosphorylated protein in the context of the cell. The network linking SH2 containing protein to their targets with a Bayesian score greater than 0.5 is represented in Fig. 14 by a weighted graph, where each edge has a weight proportional to the confidence of the interaction. In order to lend some functional support to the SH2 binding data obtained by our Bayesian framework we selected an interaction to verify by using an independent approach. We decided to focus our attention on the SHP2 ( PTPN11) protein, a molecule implicated in EGF signaling and actively studied in our laboratory. As shown in the in Fig. 14, the SH2 domains of PTPN11 are predicted to bind the tyrosine 204 of ERK protein.
Figure 14. SH2 interaction network. The interaction network of SH2 domain (red nodes) linked to the interacting peptide(green nodes) is represented for protein pairs with a Bayesian score greater than 0.5. The interaction between the n-term SH2 of SHP2 (PTPN11) and the tyr204 (TGFLTEYVATRWY) of ERK proteins is highlighted (Bayesian score: 0.6).
This interaction captured our attention, since the phosphorylation of tyrosine 204 of ERK protein is classically associated with the activation of this kinase even though this residue’s docking function has yet to be explored.
Figure 15. In-vivo interaction between the SHP2 and ERK proteins.
HEK 293 cells were starved (0) and stimulated with 100 ng/ml EGF for 5, 10, and 30 minutes. A) The cell lysate was revealed with anti- phospho-Tyr204 ERK1/2 and with total ERK1/2. The ERK protein shows an activation peak after 5 minutes of EGF induction. B-C) The SHP2 or ERK proteins were immunoprecipitated at different time points and the co-immunoprecipitated protein complex was revealed with the anti phospho-ERK or anti SHP2 antibodies, respectively. The protein complex appears after 5 minutes of EGF induction and the interaction decrease after 30 minutes. D) The SH2 N-terminal domain of SHP2 fused to GST was incubated with cell lysate and the protein complexes were affinity purified on glutathione conjugated beads. HEK 293 cells were induced for 5 minutes with EGF and incubated also with GST protein alone, as negative control. The SH2 driven interaction follows the phosphorylation profile of ERK proteins.
profile with the maximum phosphorylation content after 5 minutes of EGF induction, as revealed with an antibody directed against the tyrosine 204 of ERK proteins. Upon activation, the phosphorylated ERK1 and ERK2 physiologically associate with SHP2 protein as show in Fig. 15A and B. In addition, the ERK/SHP2 association decrease after 30 minutes of EGF induction as expected in a posphorylation dependent interaction. The role of the N-terminal SH2 module of SHP2 in recognizing the phospho-tyrosine 204 of ERK proteins is demonstrated in the pull down assay performed with the purified SH2 domain fused to GST (Fig. 15D).
Discussion
In this work we have developed a high throughput approach to characterize the specificity of phosphotyrosine binding domains. To date this is the first effort in representing the whole human phosphotyrosine proteome on high density array and the proposed approach can be used to determine the specificity of any phosphotyrosine recognition domain. We have first validated the approach by profiling the recognition specificity of anti-phosphotyrosine antibodies commonly used as detection tools; next we have used the technology to profile the family of human SH2 domains.
Antibody specificity
The detection, identification and quantification of phosphoproteins and the mapping of their phosphorylated sites are the fundamental goals of phosphoproteomic. The different approaches can be assessed by comparing their efficiency in identifying phosphoproteins, especially low-abundance ones, from complex samples such as whole-cell protein extracts. Compared with phosphoserine and phosphothreonine, phosphotyrosine signaling is more tightly regulated, but often more challenging to characterize, due to significantly lower levels of tyrosine phosphorylation (Ding et al., 2007). Two main strategies have been developed to enrich the phosphotyrosine content of a sample. The first makes use of metal affinity chromatography, where ferric ions column chelate the phosphoproteins in a crude cell extract (Blacken et al., 2006). The second enriching strategy is based on the immunoprecipitation of the phosphoprotein content of a cell extract by specific antibodies (Kim et al., 2007; Rush et al., 2005; Schumacher et al., 2007). The composition of the sample enriched in phosphorylated proteins is determined by mass spectrometry approaches. It is assumed that the anti-phosphotyrosine antibodies used for affinity purification have little if any specificity for the different phosphotyrosine context and that, as a consequence, the affinity purified sample is a fair representation of the original mixture in the cell extract. Our approach using high density arrays
of phosphorylated peptides representing most of the human phosphoproteome has allowed us to address this issue directly by determining the context preference of three different antibodies commonly used for affinity purification of phosphorylated proteins. Our work provides evidence for some substrate specificity of anti-phosphotyrosine antibodies. This may assist in selecting the best reagent to affinity purify phosphorylated proteins with hardly any context preference or to detect a specific phosphorylated protein if the amino acid composition flanking the phosphorylated tyrosine is known. The 4G10 and PTYR100 antibodies have the most similar recognition pattern. Thus it is unlikely that the combined use of these antibodies will increase substantially the spectrum of proteins that can be affinity-purified. On the other hand an antibody mixture containing PY20 combined with either 4G10 or PTYR100 antibody may decrease the unbalanced enrichment of specific proteins.
Specificity of SH2 domains
The protein interactions mediated by tyrosine phosphorylation are key regulators of the intracellular signal pathways and the SH2 module represent the larger class of known phosphorylated tyrosine recognition domain (Liu et al., 2006). Consequently, in recent years several authors have tried to clarify the recognition specificity of SH2 module (Rodriguez et al., 2004; Songyang et al., 1994a; Songyang et al., 1993) but usually the identified motifs generally covered three aminoacid positions at the C-terminus of the phosphorylated tyrosine. Although most SH2 domains primarily recognized the +1, +2 and +3 position after the phosphorylated tyrosine, residues beyond this region can play a role in modifying the SH2 affinity.
Our work represents the largest screening of human SH2 domain with a library composed by natural peptides predicted or experimentally verified to be phosphorylated. The peptide chip screening reported herein was highly reproducible due to optimization of spotting process and the ability to print several copies of pre-made slide. The uniformity of chip used in the screens also ensured that data generated for different SH2 domains were comparable. The validity of the peptide chip approach was established by re-examining the known substrate for the probed domain. For the majority of SH2 domains we demonstrate a high coverage of the golden standard interactions reported in literature.
Recently members of Li’s laboratory reported a largest screening of human SH2 domain specificity based on OPAL strategy (Huang et al., 2007) that extends the SH2 specificity from the position -2 to the position +4 with respect to the phosphorylated tyrosine. Huang produced a mixture of random peptides containing the degenerated sequence KGxxpYxxxxGD where x identified a random mixture of aminoacids. Then a series of spot matrix that alternatively fixed the random position with one of the 20 natural aminoacid were used to profile the SH2 domain specificity. It should be taken into account that this OPAL screening is evidently biased for two kind of reasons. First the charged KG and DG aminoacids used to increase the water solubility of synthesized peptide can influence the binding result at and beyond –2 and +4. This is particularly evident in the BKS SH2 domain for which we identified a strong aminoacid enrichment in position +5 for hydrophobic residues. Another factor that can prejudice the specificity profile is the random peptide mixture produced during synthesis. In fact this mixture may presents a disproportion versus sequences that are favoured by the reaction process itself.
By contrast our approach allows a precise affinity profile because the domain is challenged against a matrix where each spot is composed of a high copy number of the same peptide. Moreover our peptide library covers seven aminoacid at the C and the N-terminus of the phosphorylated tyrosine. In this way the binding signal reflects all the fine tuning due to the contributions of every residue in the contact surface between the SH2 and the peptide. Indeed our approach can provide unambiguous evidence to characterize the relative importance of the aminoacids composing a peptide substrate sequence. For example the CRK SH2 domain was shown previously to recognize the pY(DKN)(HFR)(PVL) motif (Songyang et al., 1993) and the pY(MDKNS)(TMS)(PLV)(RMAS) motif (Huang et al., 2008). Our approach emphasizes the role of proline in position +3 which is probably the main residue accountable for the binding specificity of CRK. Two similar consensus sequences, pY(TAS)(KRQN)(MIVR) and pY(AST)N(VP) are also described for the CSK SH2 domain (Huang et al., 2008; Songyang et al., 1994b). Our phosphopeptide profile overlaps with previous studies and also highlights the importance of positively charged aminoacids in position +5. Also in the specificity profile of FER and FES SH2 domains it is possible to highlight the importance of glutamic acid in position +1. The OPAL profile of the FER and FES domains also attribute a strong preference in position +2 for Aspartic acid (Huang et al., 2008). Our work, by contrast, demonstrates a similar importance for aminoacid selection
in position +2 and +3. This further proves that a specificity profile based on degenerated sequence may be biased for non-natural selections and suggests that peptide chip technology is more sensitive and reliable in defining the SH2 specificity.
Comparing sequence-specificity of human family SH2 domains revealed that, whereas similar domains tend to recognize similar substrate or ligands, the correlation between domain sequence and specificity is far from perfect. Even if very closely related domains typically recognize similar sequence motifs (CRK/CRKL, ABL1/ABL2 FGR/FES and other domains evidenced in Fig. 12), the reverse is not true since even distinct domain families which diverged in sequence, may have similar sequence specificities. In other words the data suggest that SH2 domains are either highly redundant or that their specificity must be determined by the context in which the protein is presented to a potential substrate. Recently it was shown that network context is essential for accurate system-wide modelling of phosphorylation-mediated signaling (Linding et al., 2007). Therefore we decided to combine the chip-binding assay in a Bayesian framework with a combinations of individual protein features known to be indicative of interaction. The high quality predictions of Bayesian prediction was demonstrated for the ERK-SHP2 interaction. The predicted protein complex between the SH2 domain of SHP2 and the tyrosine 204 of ERK protein opens intriguing prospects. The phosphorylated tyrosine 204 is classically associated with the activation of ERK kinase that migrates into the nucleolus, so promoting the cell cycle progress. Our data suggest that ERK proteins can either recruit and activate the SHP2 phosphatase or can promote the SHP2 translocation into the nucleus. These hypotheses are sustained by several lines of evidence. In fact the SHP2 protein is negatively regulated by the N-terminal SH2 domain forming a phospho-independent intra-molecular bond with the phosphatase domain (Hof et al., 1998). When the N-terminal SH2 engages a phosphorylation dependent interaction, the phosphatase shifts from an inactive-close conformation to an active-open conformation. The tyrosine 204 of ERK protein can act as a molecular switch for the activation of SHP2 proteins. This observation is also sustained by many studies reporting that an active SHP2 is required to maintain the MAPK pathway, induced by a variety of growth factors (Cunnick et al., 2000; Meng et al., 2005; Nishida and Hirano, 2003; Uehara et al., 2007). This interaction can also maintain the MAPK pathway by protecting the phosphorylation state of ERK proteins in tyrosine 204 . In fact this residue, once recognized by the
SH2 domain, is probably inaccessible to the action of other phosphatase. Another similar interaction was also observed between SHP2 and the Stat5 transcription factor. In this case over-expression studies indicate that the carboxyl-terminal SH2 domain of SHP-2 is required to maintain the tyrosine phosphorylation of Stat5 and its interaction with SHP-2 (Chughtai et al., 2002). Furthermore, this interaction leads to the nuclear translocation of SHP-2 as a complex with Stat5a (Chughtai et al., 2002). In this cellular compartment SHP2 can dephosphorylate protein targets, regulate the export of other proteins or regulate transcription as both SHP-2 and Stat5a form a complex that binds to DNA (Chughtai et al., 2002; Jakob et al., 2008). Also the association with ERKs may promote the nuclear translocation of SHP2. It is interesting to note that the nuclear translocation of SHP-1, the mammalian homologue of SHP-2 was described upon GH induction (Ram and Waxman, 1997). In this case the nuclear translocation of SHP-1 may be due to an intrinsic activity of the phosphatase because a half-bipartite KRK nuclear localization sequence within the carboxyl-terminal distal region of SHP-1 was described (Yang et al., 2002). However, no such sequence was identified on SHP-2 (Yang et al., 2002) suggesting that Stat5 as ERK may act as "carriers" for SHP-2 to the nucleus by providing their own nuclear translocation machinery.
In summary, our results validate peptide chip technology as a powerful tool for determining the substrate specificity of proteins and domains that bind to phosphopeptide targets. Similarly to other high throughput technologies, our approach may be affected by a high percentage of false positive and false negative results. Nevertheless we have shown that, combined with other genome wide information, our approach provides a significant and trustworthy shortcut for the detection of molecular interactions involved in tyrosine phosphorylation networks.
Methods
Peptide selection
Chip slides (JPT Peptide Technologies GmbH) consisted of 6,057 pY-containing peptides of 13 aminoacids. Among them, 1,604 were chosen since they were found to be phosphorylated in high or low throughput experiments aimed at the characterization of the human phosphoproteome (Diella et al., 2004). The remaining 4,453 peptides were considered since they received a high score according to the NetPhos Neural Network predictive algorithm (Bloom et al., 1999). Each chip included three identically replicated subarrays, which contained phosphorylated peptides and control spots arranged in a grid of 6,400 dots (Suppl. Fig. 2). Control spots included phosphate-buffered saline (PBS, used as negative control), IgG or IgM antibodies (to check for secondary antibody binding), glutathione S-transferase protein (used as positive control for the primary antibody) and triple FLAG-epitope peptide (used as negative control). Finally, Tetramethyl-5-Carboxyrhodamine (TAMRA) and Cyanine 3 (Cy3) dyes were spotted to facilitate grid orientation. To verify within-array reproducibility, 60 peptides were spotted in triplicate.
Antibody specificity
Chip slides were provided by Jerini AG. Chips were blocked for 1 hour at room temperature in 5 ml of blocking solution (PBS, 5% BSA). The 4G10 antibody (1:2000; Upstate), the TYR100 antibody (1:2000; Cell Signaling) and PY20 antibody (1:2000; Zymed) were incubated 1 hour at room temperature in 5 ml of blocking solution with gentile agitation. After several washes in PBS, chips were incubated with 5 ml of Molecular Probes secondary anti mouse Alexa Fluor 555 antibody (1/1000) for 1 hour at room temperature, avoiding light exposure. The chips were extensively washed in PBS and fluorescence intensity was revealed with ScanArray Gx Plus (PerkinElmer).
SH2 domain specificity
The 120 pGEX-4TK vectors encoding the human SH2 domain were provided by Pawson’s laboratory. For each clone Escherichia coli BL21 Rosetta were transformed, and a single colony was grown in 25 ml of LB with ampicillin and chloramphenicol at 37 °C until an OD of 0.5 was reached. Protein production was performed at 30 °C for 4 hours after the addition of IPTG at a final concentration of 250 µM. The bacteria were pelleted and resuspended in lysis buffer (50 mM Tris, pH 8.0, 5 mM EDTA, 0.1% Triton X-100, 150 mM NaCl) plus a proteinase inhibitor mixture (Roche Applied Science) and lysed by a treatment with lysozyme (200 µg/ml final) for 1 hour on ice followed by three rounds of sonication. The lysate supernatant was incubated for more than 2 hours with 100 µl of a 50% solution of glutathione-Sepharose beads (Amersham Biosciences) at 4 °C. Finally, beads were extensively washed in PBST (PBS, 0.1% Triton X-100), and the PTPs were eluted in 50 mM Tris, pH 8.0, with 10 mM glutathione. Glycerol was added to a final concentration of 20%; the amount of proteins produced was determined with a Bio-Rad protein assay, and aliquots were stocked at –80 °C until use. Every domains were analyzed on a SDS-PAGE to exclude the presence of protein degradation. After 1 hour of blocking at room temperature (RT) in PBS BSA 5%, 1 μg/ml the GST fusion protein was added to the chip (5 ml total) for 1 hour at RT. Chip was washed three times with 5 ml of PBS and incubated in 5 ml of Amersham-Pharmacia anti-GST Cy-5 antibody (1/1000) for 1 hour at RT avoiding light exposure. The chip was extensively washed in PBS and the fluorescence intensity was revealed with ScanArray Gx Plus (Perkin Elmer).
Spot signal evaluation
The signal intensity of each spots was automatically computed with the ScanArray software. The grid used to evaluate the SH2 and anti-phosphotyrosine experiments was composed of three replicated sub-array of 6400 positions. The grid was manually centred for the spots that were not
identified correctly. The mean intensity of the pixel inside the evaluation area (foreground) minus the mean intensity of pixel outside the evaluation area (background) was used to compute the value of every spots. The median value of the three replicated data point for each spots was used to create an artificial array of 6400 values for each experiments. This artificial array was used for the Two Sample Logo and WebLogo visualization as well as for the Neural Network analysis.
Two Sample Logo visualization
Positive and negative data sets for the antibody substrate specificity analysis were visualised by Two Sample Logo (Vacic et al., 2006). In brief, the font size at each position represents in the one letter code, the enriched (upper side of Logo) or depleted (lower side of Logo) amino acids in the positive with respect to the negative data set. The font colour reflects the chemical property of the different amino acid side chains. Binomial test and p-value < 0.05 were applied.
WebLogo visualization
Positive data sets for the antibody substrate specificity analysis were visualized by WebLogo (Crooks et al., 2004). In brief, the font size at each position represents in the one letter code, the amino acid frequency in the positive data set. The font colour reflects the chemical property of the different amino acid side chains. For SH2 domain analysis the WebLogo algorithm was downloaded and modified to automatically visualize the total information content value and to generate the aminoacid frequency table at each position.
Literature interactions
strings and with the names of SH2 containing protein retrieved from PIR (Barker et al., 2001), ProThesaurus (Fundel and Zimmer, 2006) and GENIA (Kim et al., 2003) resources. The results were combined and downloaded in XML format to use. Python script was compiled to automatically parse the title and abstract fields of XML formatted pubmed entry. The scrip was organize in 5 independent modules.
Protein names recognition: A dictionary file contained the names associated to the UniProt entry of each SH2 containing protein was compiled. The protein name extractor tags proteins finding the words that were used for the PubMed queries. Capitalized characters, hyphens, parentheses were ignored in the string matching step.
Tyrosine phosphorylation: Regular expression patterns were compiled to search for the strings tyrosine, pY, tyr, followed by a number. Capitalized characters, hyphens, parentheses were ignored in the string matching step.
SH2 domain: the strings sh2, Sarc homology 2, phosphotyrosine binding domain. Capitalized characters, hyphens, parentheses were ignored in the string matching step.
Interaction terms: These words (verbs or nouns describing an interaction), are largely based on the list from (Temkin and Gilder, 2003) Some keywords were removed from the original set as they were not suitable for our own definition of an interaction (e.g., ‘cleaves’, ‘expressed’, ‘severed’).
Interaction methods: The terms related to methods commonly used to identify protein interaction was compiled from the PSI-MI Vocabularies. Additional tags (e.g., ‘co-precipitation’, ‘X-ray’) were added during the human review process upon observation of interaction phrases.
Each matched evidence was organized in a tab delimited file with a score reflecting the number of positive hits in each parsing module. The pmid entries with no hits were discarded and the pmid entry with at list one positive hits were manually reviewed to discard the false positive match. The articles containing SH2 mediated interaction were manually curated to annotate the PMID reference, the swissprot number of SH2 containing protein, the tyrosine position recognized by the SH2 domain and the swissprot number of substrate protein that was not subject to automatic detection.
Artificial neural network training
The ANN used in this work was a standard three-layer feed forward type that has been described previously (Blom et al., 1999). A back-propagation procedure was used to update the weights in the network. N-fold cross-validation was used to estimate the accuracy of a machine learning scheme. In n-fold cross-validation the pooled data set was partitioned into a number of subsets, including one test set and a number of training sets. Using this strategy the ANN training was performed by shifting the test set stepwise so all data was used for training and testing when completed. However, in this procedure the test set is used to decide when to terminate training. In order to obtain a truly train and test independent performance measure, we extended the n-fold cross-validation procedure by introducing an evaluation set (“cross-evaluation”). In this approach the pooled data set was divided into 4 subsets by random partitioning. For each subset traditional 3-fold cross-validation was performed, but instead of using the test set performance we calculated the performance based on the remaining evaluation set. This was done in a round robin fashion to utilize all data for training and evaluation. For each test set a number of ANN parameters (hidden neurons: 0 2 4 6 10 15 20 30)) were optimized according to the Pearson correlation coefficient.
Contextual evidence for interaction
For each set of possible interactors (SH2 domain containing protein and peptide containing protein), we retrieved information that could help determine whether that particular interaction is likely to take place under physiological conditions. The tissue-specific expression data was taken from Su laboratory (Su et al., 2004), and the sub-cellular localisation was extracted partly from a dedicated database (manuscript in preparation) and partly from GO annotations. Both these sets of data were scored by counting the number of co-occurrences and dividing by the highest number of occurrences for either the SH2 domain containing protein or the peptide containing protein, thus obtaining a score between 0 an 1. Disordered structure was determined by using IUPred by running the prediction method on the full sequences and then cutting out the relevant part (Dosztanyi et al.,
2005). A score between 0 and 1 was obtained by taking the average score of all the residues constituting the peptide. The degree of conservation of the binding site in related species was evaluated by inspecting it in multiple alignments of orthologs and paralogs from ENSEMBL (http://www.ensembl.org). The relevant peptides were cut out of the related sequences and evaluated for binding by the neural networks. The score contribution for each orthologous sequence with the particular domain was calculated by multiplying the neural network score with the overall sequence distance from the original sequence obtained from a neighbour-joining tree. This procedure was followed to award binding site conservation in distant sequences more than that in close sequences. The scores obtained from all the orthologous sequences were summed to produce a single score for each binding site/SH2 domain combination. Conservation score = sigma_i (dist_sequence(i)*ANN_sequence(i)), where run through all the orthologous sequences in the alignment for that particular peptide. From a human interactome (manuscript in preparation) network, we calculated the interaction distance between the SH2 domain containing protein and the potential binding site containing protein using the Dijkstra algorithm. A higher score indicates higher distance in the interactome, which in turn reduces the chances that the SH2 domain containing protein and the potential binding site come into contact. Finally, the raw neural network scores were incorporated in the Bayesian framework as a separated feature.
Bayesian inference
To assess the importance of contextual evidence, we applied the Naïve Bayes algorithm:
P(I|E) = P(I)*P(E1|I)*P(E2|I)...P(Ex|I) / P(E1)*P(E2)...P(Ex)
This computes the probability of interaction given the evidence (P(I|E)). The components of this calculation are the probabilities of seeing each piece of evidence given interaction (PEx|I) and the probability of seeing this evidence in the full set of combinations of domain containing proteins and peptides P(Ex). In practice, this latter probability is calculated by evaluating both the probability of the evidence given interaction and the probability of the evidence given non-interaction. The parameters for the model are determined from a set of known SH2 interactions that was
collected and curated manually, deemed 'the foreground set', as well as the full range of possible combinations of SH2 domain containing protein and peptides ('the background set'), assuming that most of these combinations are non-interacting in vivo. The individual features used were transformed into probabilities by binning the feature score of both the foreground set and the background set. For any individual feature score, the probability of belonging to either set was then determined. Each feature was binned to maximize the difference between the foreground set and the background set while making sure each bin contained a reasonable number of samples. In the few cases this was not possible, a pseudo probability was used to avoid an excessive probability ratio between the foreground and the background probabilities.
Immunoprecipitation
HEK293 cells were grown in DMEM (Invitrogen) supplemented with 10% fetal bovine serum, Penicillin (10000 units/ml) and Streptomycin (10000 U/ml), at 37 C in 5% CO2 in a humid environment. For lysis, cells were starved for 24 h in DMEM and induced for indicated time with 500 ng/ml EGF (Sigma). Cells were lysed in 1% Triton X-100, 50 mM Tris–HCl (pH 7.5), 150 mM NaCl, 50 mM β-glycerophosphate, 20 mM sodium pyrophosphate, 30 mM NaF, 1 mM benzamidine, 2 mM EGTA, 200 μM NaVO4, 1 mM dithiothreitol (DTT), 1 mM phenylmethylsulfonyl fluoride, 10 μg/ml aprotinin, 10 μg/ml leupeptin, 10 μg/ml pepstatin, and 1 μg/ml microcystin-LR. The amount of cell lysate produced was determined with a Bio-Rad protein assay. Phosphorilated proteins were immunoprecipitated by adding 5 μg of SHP2 or ERK antibody to 3 mg cell lysate and incubated overnight at 4°C with gentle rocking. Resulting immunoprecipitated were collected with sepharose Protein A beads, centrifuged and washed in lysis buffer. 25 μl of reducing SDS sample buffer was added; tubes were boiled for 5 min and the contents run on 10% SDS-PAGE for 2.5 h, at 65 mA. Separated proteins were transferred to nitrocellulose membranes for 1 h at 100 V. After 1 h of incubation in blocking buffer (5% non-fat milk or 5% bovine serum albumin in 20 mM Tris–HCl (pH 7.5), 137 mM NaCl, and 0.1% Tween 20) the membranes were probed with anti SHP2 (Santa Cruz Biotechnology) and ERK(p) (BD Biosciences) Santa Cruz Biotechnology. To reveal the amount of immunoprecipitated proteins, the membranes were
probed with horseradish peroxidase-conjugated anti-rabbit secondary antibody (Amersham Pharmacia Biotech) and visualized by enhanced chemiluminescence (Amersham Pharmacia Biotech) on LAS-3000 imaging system (Fujifilm Life Science)
GST – Pull down assay
HEK293 cells were grown in DMEM (Invitrogen) supplemented with 10% fetal bovine serum, at 37 C in 5% CO2 in a humid environment. For lysis, cells were starved for 24 h and induced for indicated time with 500 ng/ml EGF (Sigma). Cells were lysed in 1% Triton X-100, 50 mM Tris–HCl (pH 7.5), 150 mM NaCl, 50 mM β-glycerophosphate, 20 mM sodium pyrophosphate, 30 mM NaF, 1 mM benzamidine, 2 mM EGTA, 200 μM NaVO4, 1 mM dithiothreitol (DTT), 1 mM phenylmethylsulfonyl fluoride, 10 μg/ml aprotinin, 10 μg/ml leupeptin, 10 μg/ml pepstatin, and 1 μg/ml microcystin-LR. The amount of cell lysate produced was determined with a Bio-Rad protein assay. GST-SH2 protein (100 μg) and GST (50 μg) slurry were incubated each with 3 mg of protein lysate for 4 h, rocking, at 4 C. The beads were centrifuged and washed in lysis buffer. 25 μl of reducing SDS sample buffer was added; tubes were boiled for 5 min and the contents run on 10% SDS-PAGE for 2.5 h, at 65 mA. Separated proteins were transferred to nitrocellulose membranes for 1 h at 100 V. After 1 h of incubation in blocking buffer (5% non-fat milk or 5% bovine serum albumin in 20 mM Tris–HCl (pH 7.5), 137 mM NaCl, and 0.1% Tween 20) the membranes were probed with anti ERK(p) (Santa Cruz Biotechnology) and to reveal the amount of immunoprecipitated proteins, the membrane were probed with horseradish peroxidase-conjugated anti-rabbit secondary antibody (Amersham Pharmacia Biotech) and visualized by enhanced chemiluminescence (Amersham Pharmacia Biotech) on the LAS-3000 imaging system (Fujifilm Life Science)
References
Barker, W.C., Garavelli, J.S., Hou, Z., Huang, H., Ledley, R.S., McGarvey, P.B., Mewes, H.W., Orcutt, B.C., Pfeiffer, F., Tsugita, A., et al. (2001). Protein Information Resource: a community resource for expert annotation of protein data. Nucleic Acids Res 29, 29-32.
Blacken, G.R., Gelb, M.H., and Turecek, F. (2006). Metal affinity capture tandem mass spectrometry for the selective detection of phosphopeptides. Anal Chem 78, 6065-6073.
Blom, N., Gammeltoft, S., and Brunak, S. (1999). Sequence and structure-based prediction of eukaryotic protein phosphorylation sites. J Mol Biol 294, 1351-1362.
Buday, L., Wunderlich, L., and Tamas, P. (2002). The Nck family of adapter proteins: regulators of actin cytoskeleton. Cell Signal 14, 723-731.
Chughtai, N., Schimchowitsch, S., Lebrun, J.J., and Ali, S. (2002). Prolactin induces SHP-2 association with Stat5, nuclear translocation, and binding to the beta-casein gene promoter in mammary cells. J Biol Chem 277, 31107-31114.
Crooks, G.E., Hon, G., Chandonia, J.M., and Brenner, S.E. (2004). WebLogo: a sequence logo generator. Genome Res 14, 1188-1190.
Cunnick, J.M., Dorsey, J.F., Munoz-Antonia, T., Mei, L., and Wu, J. (2000). Requirement of SHP2 binding to Grb2-associated binder-1 for mitogen-activated protein kinase activation in response to lysophosphatidic acid and epidermal growth factor. J Biol Chem 275, 13842-13848.
Depetris, R.S., Hu, J., Gimpelevich, I., Holt, L.J., Daly, R.J., and Hubbard, S.R. (2005). Structural basis for inhibition of the insulin receptor by the adaptor protein Grb14. Mol Cell 20, 325-333.
Diella, F., Gould, C.M., Chica, C., Via, A., and Gibson, T.J. (2008). Phospho.ELM: a database of phosphorylation sites--update 2008. Nucleic Acids Res 36, D240-244.
Ding, S.J., Qian, W.J., and Smith, R.D. (2007). Quantitative proteomic approaches for studying phosphotyrosine signaling. Expert Rev Proteomics
4, 13-23.
Dosztanyi, Z., Csizmok, V., Tompa, P., and Simon, I. (2005). IUPred: web server for the prediction of intrinsically unstructured regions of proteins based on estimated energy content. Bioinformatics 21, 3433-3434.
Eck, M.J., Shoelson, S.E., and Harrison, S.C. (1993). Recognition of a high-affinity phosphotyrosyl peptide by the Src homology-2 domain of p56lck. Nature 362, 87-91.