Natural History of Vanishing White Matter
Eline M. C. Hamilton, MD,
1Hannemieke D. W. van der Lei, MD, PhD,
1Gerre Vermeulen, MD,
1Jan A. M. Gerver, MD,
1Charles M. Lourenço, MD,
2Sakkubai Naidu, MD,
3Hanna Mierzewska, MD, PhD,
4Reinoud J. B. J. Gemke, MD, PhD,
5Henrica C. W. de Vet, PhD,
6Bernard M. J. Uitdehaag, MD, PhD,
7Birgit I. Lissenberg-Witte, PhD,
6VWM Research Group,* and
Marjo S. van der Knaap, MD, PhD
1,8Objective: To comprehensively describe the natural history of vanishing white matter (VWM), aiming at improving counseling of patients/families and providing natural history data for future therapeutic trials.
Methods: We performed a longitudinal multicenter study among 296 genetically confirmed VWM patients. Clinical information was obtained via disease-specific clinical questionnaire, Health Utilities Index and Guy’s Neurological Dis-ability Scale assessments, and chart review.
Results: First disease signs occurred at a median age of 3 years (mode = 2 years, range = before birth to 54 years); 60% of patients were symptomatic before the age of 4 years. The nature of thefirst signs varied for different ages of onset. Overall, motor problems were the most common presenting sign, especially in children. Adolescent and adult onset patients were more likely to exhibit cognitive problems early after disease onset. One hundred two patients were deceased. Multivariate Cox regression analysis revealed a positive relation between age at onset and both preservation of ambulation and survival. Absence of stress-provoked episodes and absence of seizures predicted more favorable outcome. In patients with onset before 4 years, earlier onset was associated with more severe disability and higher mortality. For onset from 4 years on, disease course was generally milder, with a wide variation in severity. There were no significant differences for sex or for the 5 eIF2B gene groups. The results confirm the presence of a genotype– phenotype correlation.
Interpretation: The VWM disease spectrum consists of a continuum with extremely wide variability. Age at onset is a strong predictor for disease course.
ANN NEUROL 2018;84:274–288
V
anishing white matter (VWM; Online Mendelian Inheritance in Man database 603896) 1–3 is one of the more prevalent leukodystrophies.4 It is caused by recessive mutations in any of the genes EIF2B1–5.5,6 Patients typically have normal early development, followedby chronic neurological deterioration and additionally stress-provoked episodes of rapid decline.2 No curative treatment is available.7Although VWM was initially rec-ognized as a disorder of young children,1,2,8it has become apparent that disease onset and severity vary widely, from
View this article online at wileyonlinelibrary.com. DOI: 10.1002/ana.25287
Received Oct 31, 2017, and in revised form Jul 2, 2018. Accepted for publication Jul 2, 2018.
Address correspondence to Dr van der Knaap, Department of Child Neurology, VU University Medical Center, De Boelelaan 1117, 1081 HV Amsterdam, the Netherlands. E-mail: [email protected]
A table listing the VWM Research Group collaborators is available as an online supplementaryfile.
Current address for Dr van der Lei: Department of Pediatric Rehabilitation Heliomare Rehabilitation Center Wijk aan Zee the Netherlands. Current address for Dr Vermeulen: Dutch National Institute for Public Health and the Environment (RIVM) Bilthoven the Netherlands.
Current address for Dr Gerver: Department of Pediatrics Red Cross Hospital Beverwijk the Netherlands.
From the1Department of Child Neurology and Amsterdam Neuroscience, VU University Medical Center, Amsterdam, the Netherlands;2Clinics Hospital of Ribeirão Preto, University of São Paulo, São Paulo, Brasil;3Department of Neurogenetics, Kennedy Krieger Institute, Johns Hopkins University School of Medicine, Baltimore, MD;4Department of Child and Adolescent Neurology, Institute of Mother and Child, Warsaw, Poland;5Department of Pediatrics, VU
University Medical Center, Amsterdam, the Netherlands;6Department of Epidemiology and Biostatistics, VU University Medical Center, Amsterdam, the Netherlands;7Department of Neurology, VU University Medical Center, Amsterdam, the Netherlands; and8Department of Functional Genomics, Center
for Neurogenomics and Cognitive Research, Amsterdam Neuroscience, VU University, Amsterdam, the Netherlands. *Additional supporting information may be found online in the Supporting Information section at the end of the article.
© 2018 The Authors. Annals of Neurology published by Wiley Periodicals, Inc. on behalf of American Neurological Association. 274
antenatal or early infantile onset disease with rapid demise9–11to adult onset slow disease.3,12
Knowledge of the epidemiology and natural history of VWM is essential for physicians to counsel patients and families and make decisions on clinical management. Additionally, natural history studies are valuable for insight into pathomechanisms, genotype–phenotype corre-lations, and setup of therapeutic trials. Natural history studies in VWM are scarce and rather small.13–15 We report results of a 12½-year natural history study of VWM, focusing on occurrence of neurological signs in relation to age and disease duration, identification of prog-nostic factors, and assessment of dimensions of disability by 2 validated scales: Health Utilities Index (HUI) and Guy’s Neurological Disability Scale (GNDS).
Patients and Methods
Study Design
Between January 2004 and October 2016, we performed a multicenter longitudinal observational study on all genetically proven VWM patients enrolled in the Amster-dam Database of Leukoencephalopathies. The database contains all VWM patients referred for mutational analysis and proven to have biallelic mutations in the genes EIF2B1–5 and 17 patients referred for magnetic resonance imaging (MRI) analysis and genetically confirmed else-where.16 VWM patients with additional diseases affecting neurological function were excluded. Written informed consent was obtained from participating patients or guard-ians. The study was approved by the ethics committee of VU University Medical Center, Amsterdam.
Clinical Information
We obtained information on disease course by a custom-ized disease-specific clinical questionnaire, completed by the patient’s physician or the patient and/or family mem-bers in consultation with the authors. If these sources were not available, we performed retrospective chart review. The questionnaire aimed at robust parameters that could easily be assessed by physicians, also when reviewing patient files retrospectively, and by parents. It involved items on demographic details, pregnancy and delivery, early motor development, early cognitive development, disease onset and presenting signs, provoking factors, epi-sodes of deterioration, disease course, neurological signs, and survival. Data on medical history were obtained retro-spectively when the patient entered the study. From then on, data were collected prospectively, using the question-naire, HUI scores from age 2 years, and GNDS scores from age 8 years at 1 to 4 time points. HUI and GNDS scores were assessed by proxies (physicians or parents), in 3 patients by self-assessment, using postal or digital forms,
telephone interviews, or in-person interviews. All data were checked for internal consistency and consistency with other data.
Patients were scored as having lost walking without support when they could no longer walk without equip-ment or the help of another person; they were scored as having lost walking with or without support when fully wheelchair dependent. To avoid introducing a bias by omitting patients who were more seriously affected and did not achieve walking, we scored patients who presented before 18 months and never achieved walking as having lost ambulation at disease onset and scored patients who had mildly delayed early development and never achieved walking but presented with signs of neurological deteriora-tion later than 18 months as having lost ambuladeteriora-tion at 18 months. Patients who died before 18 months or were not followed until that age were not included in analyses concerning ambulation. The disease course was defined as exacerbating if ≥1 episodes of acute major neurological deterioration occurred. Ovarian failure was assessed in females from 16 years at latest follow-up.
Health Utilities Index
HUI17is a well-validated instrument to assess health status and health-related quality of life (HRQL). It has been used extensively as an outcome measure, also for neurological dis-orders, in patients from age 1 year.18–21It comprises distinct attributes of health status that enable valuation of function-specific scores (single-attribute utility scores) and generic multiattribute preference-based measures of quality of life (HUI Health Index) at a point in time. We applied the HUI Mark 3 (HUI3) proxy version, which comprises 8 attri-butes: Vision, Hearing, Speech, Ambulation, Dexterity, Emotion, Cognition, and Pain. Each attribute has 5 or 6 levels (Supplementary Table 1A)17; single-attribute scores range between 0 (severe impairment) and 1 (no impairment; see Supplementary Table 1B). We measured 1 attribute of the HUI Mark 2 (HUI2) on Self-Care. We used HUI deci-sion tables to generate HUI2 and HUI3 single-attribute util-ity scores22,23 and applied coding algorithms to obtain overall HUI3 Health Index scores (see Supplementary Table 1C).23 The latter represent the patient’s state on a scale from 0 (equivalent to death) to 1 (equivalent to perfect health). The minimum is a negative score (−0.36); all nega-tive scores indicate a state rated “worse than dead” in the preference survey among the general population.23For miss-ing data, we applied inspection and logical deduction according to published guidelines.24 If > 2 attribute scores were missing, the concerning inventory was excluded (1% of inventories). We used hot deck imputation with pattern similarity to impute the few remaining missing values up to a maximum of 2 domains.24 Imputations were only
calculated for the HUI3 attribute scores on Cognition in 3% of inventories and on Emotion in 1%.
To analyze the evolution of HUI scores over time, we gave each patient a baseline score at disease onset, cor-responding to the age-matched reference scores from HUI3 reference population data.25,26 For individuals younger than 5 years, for whom no reference scores are available, we applied the reference score of 0.92 for age 5 years. For death, we used a score of−0.5, deviating from score 0 of the HUI scale, because numerous patients had negative scores during life, while being happy, as apparent from Emotion scores, not in line with worse than dead. Moreover, scores of such patients would otherwise rise from below 0 during life to 0 at death. Changing death status from 0 to −0.5 alters the meaning of the negative scores but does not influence the statistical characteristics of the scale. We gave deceased patients in whom no HUI was obtained because of age < 2 years or nonresponse a baseline score at onset and end score at death.
Guys Neurological Disability Scale
GNDS is a reliable measure to assess neurological disability, created to assess outcome in multiple sclerosis (MS).27 As VWM and MS are comparable in terms of white matter involvement and chronic disease with episodic worsening, we chose the GNDS to assess neurological function in VWM. Nowadays, the scale is also applied in other neuro-logical disorders.28,29The system has proven to be reliable when applied as a postal questionnaire.27,30It assesses the patient’s disability in the previous month on the basis 12 subcategories: Cognitive disability, Mood disability, Visual disability, Speech/Communication disability, Swal-lowing disability, Upper-limb disability (hereafter called ‘Arm’), Lower-limb disability (hereafter called ‘Leg’) Blad-der disability, Bowel disability, Sexual Disabilities, Fatigue, and Other Disabilities. Each domain is scored with a 6-level severity scale ranging from 0 (no disability) to 5 (maximum disability; Supplementary Table 2). A GNDS sum score for total disability is reached by summing up all 12 subscores, with 0 for minimum and 60 for maximum disability. We followed GNDS instructions27 for dealing with missing values for Mood, Fatigue, and Sexual Disabil-ities. Because of the large number of imputations for Sexual Disability necessary for young and celibate patients, we left this item out except for the calculation of the GNDS sum score. For missing values in other domains, we performed hot deck imputation as described for the HUI, up to a number of 2 missing values. Inventories with more missing items were excluded (5% of inventories). For Visual, Swal-lowing, Bladder, Bowel, and Other Disabilities, we imputed the scores in 1% of inventories.
Age at Onset Groups
We used age at onset to categorize the patients into the following 6 groups: antenatal to early-infantile: <1 year (1), late-infantile: 1 to <2 years (2), early-juvenile: 2 to <4 years (3), juvenile: 4 to <8 years (4), late-juvenile to adolescent: 8 to <18 years (5), and adult: ≥18 years (6). Clinical disease onset was defined as the age at which the first neurological sign had been noted retrospectively. Clinical disease duration was defined as the time from dis-ease onset onward.
For certain analyses we preferred a less detailed sub-division of age at onset categories; early onset: <4 years; intermediate onset: 4 to <18 years; and late onset: ≥18 years.
Statistical Analysis
We used summary statistics to describe clinical characteris-tics. Patient characteristics were reported by median and quartiles and/or ranges for nonnormally distributed data. Nominal and ordinal data were analyzed by chi-square test, Fisher exact test, or Kruskal–Wallis test to study dif-ferences between age-of-onset groups. We performed time-to-event analysis of the events “disease onset,” “loss of walking without support,” “loss of walking with or without support,” “start of tube feeding,” “start of clear cognitive decline,” “first seizure,” and “death,” with age and disease duration as two separate time variables. Indi-viduals in whom the respective event had not occurred were censored for the item at the latest follow-up. We esti-mated median ages and disease durations at events by Kaplan–Meier curves. Group differences regarding age at onset, sex, exacerbating disease course, and affected gene were analyzed with log-rank test. For analyses regarding affected genes, each genotype (combination of 2 muta-tions) was represented once. If one genotype was observed in multiple patients, the median score was calculated by survival analysis. We used Cox proportional hazards models to calculate hazard ratios for predictors of survival and loss of walking with or without support, with age at onset as continuous variable and sex, presence of episodes, and presence of seizures as categorical variables. Because for the variable “seizures” the number of missing values was considerably higher than for other variables, we per-formed multiple imputation for this parameter, with the other variables as predictive values, including cumulative hazards for“loss of walking with or without support” and “survival,” creating 5 datasets on which Cox regression analysis was performed.
We compared HUI Health Index scores in relation to disease duration per age at onset group via linear mixed models, with fixed effects for age at onset group and dis-ease duration, and their 2-way interaction. Although not
all were normally distributed, we analyzed the degree of disability per HUI attribute and GNDS domain per age at onset category by mean values, as this represented the center of the 4- up to 6-level data’s distribution most accurately.
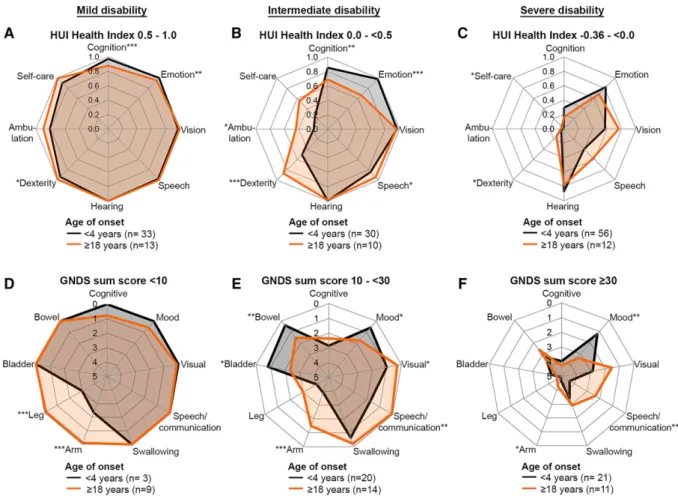
We created spider plots using 8 selected HUI single attribute scores and 9 selected GNDS domain scores. For the HUI, the attribute Pain was omitted because pain was not a prominent feature and its score was less reliable.31 For the GNDS, Fatigue, Sexual, and Other Disabilities were omitted, because the scores were not very informa-tive. The spider plots separately concerned mild, interme-diate, and severe disability as assessed by the HUI Health Index and GNDS sum scores. The values in the spider plots represented mean scores for early (<4 years) and late (≥18 years) age at onset patient categories. By contrasting these 2 categories, we aimed at clearly illustrating effects of age at onset on the different domains. The 2 categories were compared using the independent samples t test; p < 0.05 was considered significant. We used linear regres-sion to analyze the relation of GNDS sum scores and HUI Health Index scores and comparable domain-specific HUI and GNDS scores within patients at similar time points. Statistical analysis was performed using SPSS ver-sion 22 (IBM, Armonk, NY) and Prism verver-sion 6.07 (GraphPad, San Diego, CA).
Results
Patients
In total, 305 VWM patients were eligible for the study, referred from 198 centers worldwide. Nine patients were excluded because of comorbidity (ie, Down syndrome, bili-ary atresia, galactosemia, glutaric aciduria type 1, encephalo-cele and cortical dysplasia, Leigh syndrome due toLRPPRC mutations, and perinatal asphyxia), leaving 296 patients (134 males and 162 females) from 261 families. Genetic analysis revealed that 5 patients had mutations in EIF2B1, 49 in EIF2B2, 23 in EIF2B3, 22 in EIF2B4, and 197 in EIF2B5. In the case of missing data, patients were selec-tively included in the analyses on the basis of available information. Throughout the results section, we report the number of patients who were included in the different ana-lyses in parentheses or in respective tables.
Clinical and Demographic Characteristics
The age of the patients at the latest follow-up or death ran-ged from 3 months to 62 years (median = 11 years); dis-ease duration ranged from 1 week up to 39 years (median = 6 years). For 63% of patients, we obtained clin-ical questionnaires, mostly completed by physicians, in 10% by the patient and/or family members in consultation
with the authors. For the remaining patients, information was obtained by chart review.
Patients originated from Africa (n = 1), Australia and New Zealand (n = 11), Asia (n = 26), South America (n = 28) North America (n = 56), and Europe (n = 174). The database contains all known Dutch VWM patients (n = 33); based on our numbers, the incidence in the Neth-erlands is estimated to be 1:80,000 live births or higher. Parental consanguinity was reported in 42 of 210 families.
Age at Onset
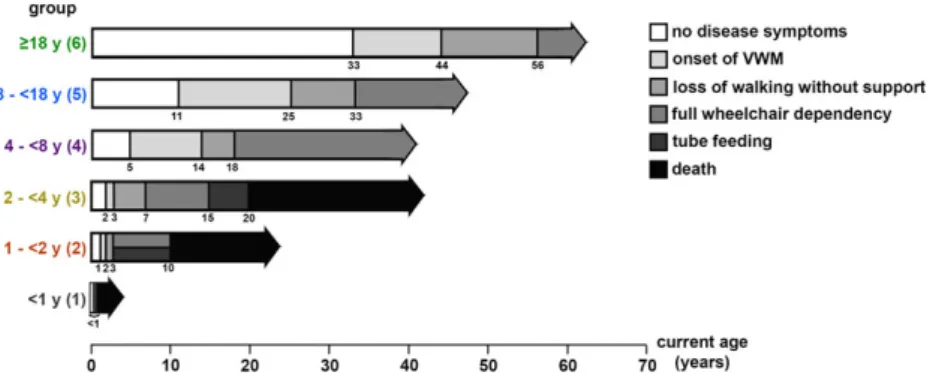
The distribution of age at onset was heavily skewed to the right; for the interval 18 to 54 years, it was rather uniform (Fig 1A). Median age at onset was 3 years (mode = 2 years, range = before birth to 54 years). Of all patients, 87% had onset at <18 years, 60% <4 years, 11% <1 year, and 2% before birth. When categorizing the patients in the 6 age at onset groups, early-juvenile (2–<4 years) onset was most common (see Fig 1B). An overview of clinical characteris-tics classified by age at onset group is given in Supplemen-tary Table 3. Outline of disease course per age at onset group is depicted in Figure 2.
Presentation
Supplementary Table 4 summarizes all presenting signs and symptoms. Motor problems, especially gait problems, were most common. The nature offirst signs varied for dif-ferent ages of onset (Supplementary Table 5). Antenatal onset was characterized by intrauterine growth retardation, oligohydramnios, reduced fetal movements, and/or con-tractures at birth. After birth, these patients often presented signs of encephalopathy, with irritability, somnolence, and seizures. Several severe, mostly infantile and early-juvenile onset cases presented with similar signs of encephalopathy. Loss of acquired motor skills was common among all age at onset groups. Patients with late-juvenile, adolescent, or adult onset more often presented with cognitive or psychi-atric problems.
Fifty-three percent of presentations occurred after a provoking event (see Supplementary Table 3). Infection (often with fever) was the most common trigger (54%), especially upper respiratory, gastrointestinal, or urinary tract infections, influenza, otitis, and viral rashes. Mild head trauma was the second most common trigger (44%). Occasional triggers were vaccination and acute fright.
Seven patients were asymptomatic at study closure. Three had not had any disease signs: one, currently 5 years old, had been genetically tested because of an affected sib-ling; two, currently 6 and 18 years, had been identified by incidental findings on MRI performed because of head trauma and headache. The other 4 patients had been iden-tified by MRI for transient neurological signs: vertigo,
lowered consciousness and anopia after head trauma, unprovoked dizziness, and 1-sided vision loss. They are currently 8, 12, 12, and 43 years old.
Early Development
Early motor development was delayed in 25% of patients (69/276). For group 1 patients, in 47% (15/32) no
developmental problems had been noticed until subacute deterioration. Remaining patients (53%) had mild or severe development delay. The majority had reached some motor milestones ranging from head control to unsup-ported sitting, but 19% (6/32) never developed inten-tional movements. In most group 2 patients, early motor development was reported to be normal; 40%
FIGURE 1: Distribution of age at onset. (A) Histogram representing the number of patients per age at onset (years) for 291 vanishing white matter patients. (B) Distribution of patients per age at onset group per sex.
FIGURE 2: Disease course per age at onset group. Age at onset of vanishing white matter (VWM) and age at times of loss of walking without support, full wheelchair dependency, start of tube feeding, and death among 291 patients are shown (numbers of patients for each item are shown in Supplementary Table 3). The horizontal arrows range from birth to the longest follow-up in the respective age at onset group. The numbers below the horizontal arrows indicate the median age (years) at the respective event as estimated with the use of Kaplan–Meier curves. [Color figure can be viewed at www.annalsofneurology.org]
(n = 20/50) had mild developmental delay. Maximum motor milestones ranged from crawling (n = 2) to sup-ported walking (n = 6) to unsupsup-ported walking (n = 11). For patients of groups 3 to 6, 90% (174/194) had normal early motor development. All 4 groups contained a few patients with mild developmental delay (overall 10%).
Early cognitive development was abnormal in 14% of patients, predominantly in patients with onset at <2 years (see Supplementary Table 3).
Ambulation
Unsupported walking was achieved in no patients of group 1, 74% of patients of group 2, and all patients of groups 3 to 6 (see Supplementary Table 3). There were significant differences in age and disease duration at loss of walking without support and wheelchair dependency when comparing the 6 onset groups (see Supplementary Table 3, Fig 3A). Subanalysis of groups 4, 5, and 6 revealed no significant difference regarding disease dura-tion at loss of walking without support (log-rank p = 0.55) or with and without support (log-rank p = 0.82).
Neurological Signs
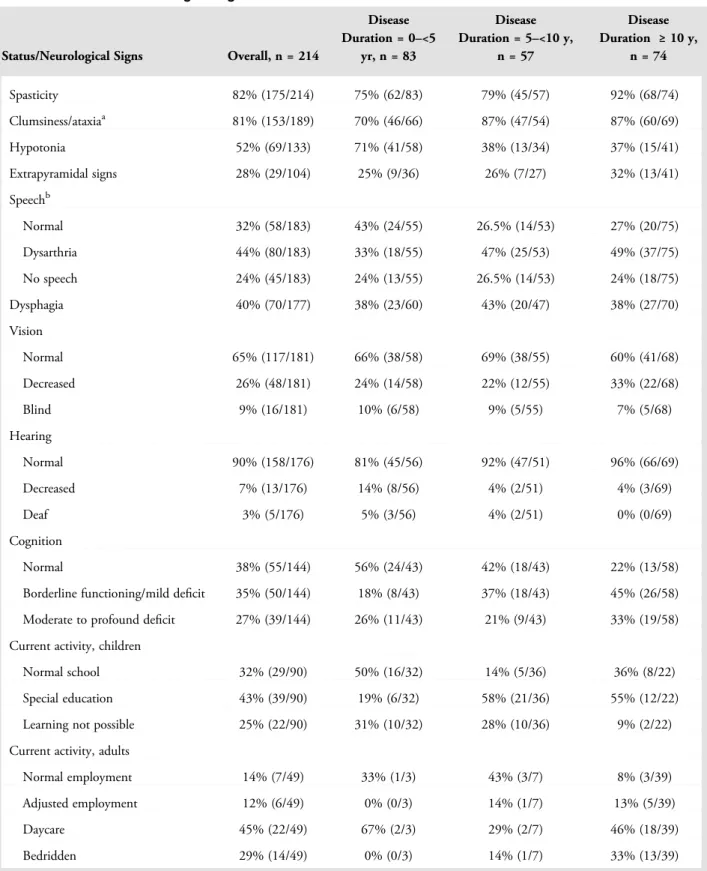
Table 1 presents an overview of patients’ current status at latest clinical inventory, subdivided for disease duration. Spasticity and ataxia were most common. Speech was affected in most patients, swallowing in less than half; 34% of patients received tube feeding (see Supplementary Table 3). Vision and hearing were generally well pre-served. Optic atrophy was reported in 17 patients but had not been investigated systematically. Cognitive decline had occurred in 62% of patients; it was observed earliest in the disease course in patients with onset at <2 years and ≥18 years (see Supplementary Table 3, Fig 3B); patients with onset at <1 year were not included in the analysis of cognitive decline. Subanalysis of groups 4, 5, and 6 revealed that cognitive decline occurred earlier in the disease course in group 6 than in groups 4 and 5 (log-rank p < 0.001; see Fig 3B, right).
Seizures had occurred in 60% of patients; later dis-ease onset was associated with lower incidence for all groups (see Supplementary Table 3). The nature of sei-zures was variable, including nonmotor seisei-zures and focal onset seizures with and without impaired awareness. Gen-eralized onset tonic–clonic seizures were most common. Most patients had occasional seizures, mostly well con-trolled with medication, less often moderately concon-trolled. Few patients had refractory epilepsy; this was reported most often in groups 1 and 2, and also occurred in groups 3 to 5, but never in group 6.
Mortality
Survival analysis revealed an estimated overall median sur-vival of 38 years at a median disease duration of 24 years; 102 patients were deceased. Of deceased patients, median age at death was 6 years (range = 3 months to 60 years) and median disease duration at death was 3 years (range = 1 week to 30 years). There was a significant dif-ference in age and duration at death for the 6 onset groups (see Fig 3C, Supplementary Table 3). Death rate was con-siderably higher in groups 1 to 3, in which 47% (82/174) of patients were deceased, than for groups 4 to 6, in which 15% (18/117) had died. No significant difference regard-ing survival duration (log rankp = 0.77) and disease dura-tion at death (p = 0.74) was observed between groups 4 to 6.
Deceased patients were generally at an advanced, often vegetative stage. Respiratory failure was the leading cause of death (61%). In a high proportion of patients, deterioration preceding death was triggered by infection (40%). Other causes of death were discontinuation of life support, coma, refractory epilepsy, and cachexia.
Disease Course and Provoking Factors
Exacerbating disease course was described in 82% of patients (see Supplementary Table 3). The median num-ber of episodes was 3, mode = 1 (often at first presenta-tion), range = 1 to 25 (n = 162 patients). In 99% of patients, episodes involved motor problems (197/198 patients), most often gait problems, ataxia, and weakness. Cognitive function was affected in 50% (71/142 patients), including loss of language, cognitive slowing, memory problems, and loss of social interaction.
Sixty-two percent of patients had had one or more episodes of coma or altered consciousness (see Supplemen-tary Table 3). Coma and irritability were mostly observed in patients with early onset; 87% of patients with coma (55/63) and 92% of patients with irritability (58/63) had onset at <8 years.
Episodes of deterioration were provoked by febrile infections in 80% (154/193) of patients with episodes, head trauma in 58% (106/182), and infection without fever in 27% (42/155). Other provoking factors men-tioned less often were anesthesia in 16% (15/92), acute psychological stress or fright in 18% (27/150), and heat in 5% (4/87). In many more patients, heat was stated to adversely affect function, but in most recovery occurred immediately after cooling down. There were incidental reports of deterioration after the use of alcohol, sleep dep-rivation, growth spurt, vaccination, and severe allergic reaction. Seizures were also reported as a provoking factor, although they may also have occurred secondary to deterioration.
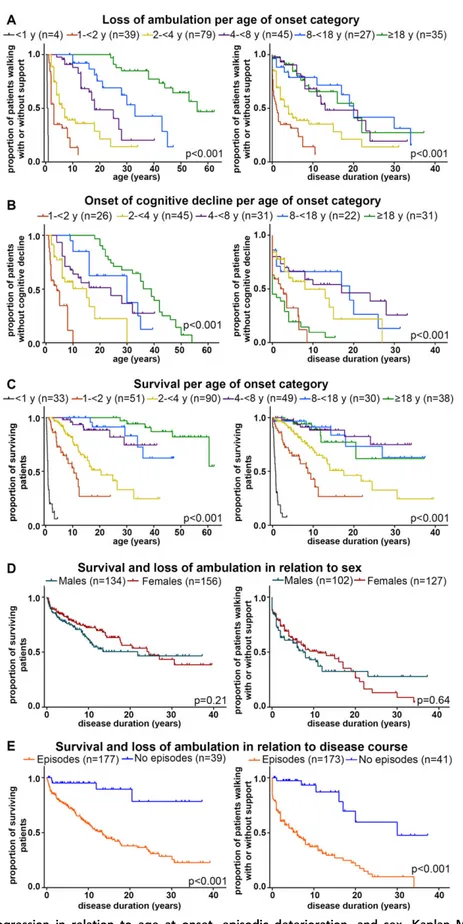
FIGURE 3: Disease progression in relation to age at onset, episodic deterioration, and sex. Kaplan–Meier plots on (A) full wheelchair dependency (loss of walking with or without support) in relation to age (left) and disease duration (right), per age at onset group; (B) onset of cognitive decline in relation to age (left) and disease duration (right), per age at onset group; (C) survival in relation to age (left) and disease duration (right), per age at onset group; (D) survival (left) and loss of walking with or without support (right) in relation to disease duration, grouped by sex; (E) survival (left) and loss of walking with or without support (right) in relation to disease duration, grouped by disease course with and without episodic deterioration. In all plots, censored patients (absence of cognitive decline, still ambulant or alive at last follow-up) are indicated by crosses.
Earlier disease onset was associated with higher sensi-tivity to febrile infections; fever caused deterioration in 86% of patients with exacerbating disease course and onset at <4 years versus 50% with onset at ≥18 years. Head trauma as a provoking factor was reported with the highest rate in patients with onset at ≥2 to <8 years (see Supplementary Table 3).
After an episode of deterioration, patients rarely (10%) showed complete recovery (19/183 episodes); only few (3%; 5/183) showed almost complete recovery; the majority of episodes (51%; 93/183) were followed by par-tial recovery or persisting severe handicap (23%, 42/183). In 13% (24/183), death directly followed an episode of deterioration, most often in patients with disease onset at <2 years.
Sex
The VWM prevalence ratio was 1:1.21 for males:females. Imbalance was largest in the adult onset group (see Fig 1B), but statistical analysis of distribution did not reveal significant differences (p = 0.43). Time-to-event analysis of survival and loss of walking without and with support showed some differences between sexes, but these were not statistically significant (see Fig 3D).
Prognostic Factors
Kaplan–Meier plots indicated that exacerbating disease course had unfavorable effects on survival and preservation of ambulation (see Fig 3E). Multivariate Cox regression analyses revealed that earlier age at onset, episodic deterio-ration, and seizures had significant positive associations with death and loss of ambulation as independent prog-nostic indicators, whereas there were no sex-based differ-ences in outcome (Table 2).
Reproductive Organs
Females. In 86% of women≥ 16 years old (48/56), signs of ovarian failure were reported (primary or secondary amenorrhea, irregular menses, or infertility). Ovarian dys-genesis was found on ultrasound in 1 patient at 3 years and at autopsy in 2 patients at 10 months and 6 years.2,32 Six women had offspring; none reported episodic deterio-ration during or shortly after pregnancy.
Males. Except for 1 case of infertility due to oligozoos-permia, there were no reports of involvement of reproduc-tive organs. Of the 26 males ≥16 years old, 4 had offspring.
Other Organs
Involvement of other organs was observed in 7 group 1 patients, including congenital cataract (n = 4), renal
hypodysplasia (n = 2), and hepatomegaly/hepatosplenome-galy (n = 2). Several patients with disease onset at later ages also presented diseases of other organs, but these were never reported in >1 patient and are not considered here.
Other Features
Height was normal in 82% of patients (133/163) and below normal in 18% (29/163, mainly with onset at <8 years). Weight was normal in 79% (125/159), below normal in 16% (26/159), and above normal in 5% (8/159). Head circumference was normal in most patients (132/169); 12% had microcephaly (21/169, mainly with onset at <4 years), and 10% had macrocephaly (16/169, mainly in onset groups 1–3 at advanced disease stages). Two patients underwent ventriculoperitoneal shunting because of suspected increased intracranial pressure, with-out clinical improvement. Headache was the most com-monly reported additional problem (26 patients). Dizziness was described in 6 patients, peripheral neuropa-thy in 3, and scoliosis in 7.
History of depression was present in 21 patients (median age at start = 30 years, range = 12–47 years). In 23 patients, enhanced aggression, erratic behavior, or other behavioral problems had been observed, mostly in adulthood.
Genotype–Phenotype Correlation
Among all 296 patients, the total number of different mutation combinations was 157. No statistically signi fi-cant differences were observed for the 5 eIF2B gene groups regarding age at onset (log rankp = 0.31) and sur-vival (log rankp = 0.65). Only for the parameter “loss of walking without support” was an overall significant differ-ence observed (log rank p = 0.025). Ambulation was bet-ter preserved in the group of patients with EIF1B1 mutations, but this group was very small (only 5 patients) and therefore not necessarily representative. When exclud-ing these 5 patients from the analysis, no overall differ-ences remained for the groups EIF2B2 to EIF2B5 (log rankp = 0.12).
To assess the mutation-specific genotype–phenotype correlation, we compared all available groups of at least 3 patients from different families with the same mutation combination. In most groups of patients with similar genotype, severity measures, such as age at onset and sur-vival, were rather consistent, but some variability was pre-sent, especially for mutations associated with a milder phenotype (details in Supplementary Table 6). The homo-zygous p.Arg113His mutation in EIF2B5 was most fre-quent (n = 36) and most often, but not invariably, associated with a mild phenotype.33
TABLE 1. Status and Neurological Signs in Relation to Disease Duration
Status/Neurological Signs Overall, n = 214
Disease Duration = 0–<5 yr, n = 83 Disease Duration = 5–<10 y, n = 57 Disease Duration ≥ 10 y, n = 74 Spasticity 82% (175/214) 75% (62/83) 79% (45/57) 92% (68/74) Clumsiness/ataxiaa 81% (153/189) 70% (46/66) 87% (47/54) 87% (60/69) Hypotonia 52% (69/133) 71% (41/58) 38% (13/34) 37% (15/41) Extrapyramidal signs 28% (29/104) 25% (9/36) 26% (7/27) 32% (13/41) Speechb Normal 32% (58/183) 43% (24/55) 26.5% (14/53) 27% (20/75) Dysarthria 44% (80/183) 33% (18/55) 47% (25/53) 49% (37/75) No speech 24% (45/183) 24% (13/55) 26.5% (14/53) 24% (18/75) Dysphagia 40% (70/177) 38% (23/60) 43% (20/47) 38% (27/70) Vision Normal 65% (117/181) 66% (38/58) 69% (38/55) 60% (41/68) Decreased 26% (48/181) 24% (14/58) 22% (12/55) 33% (22/68) Blind 9% (16/181) 10% (6/58) 9% (5/55) 7% (5/68) Hearing Normal 90% (158/176) 81% (45/56) 92% (47/51) 96% (66/69) Decreased 7% (13/176) 14% (8/56) 4% (2/51) 4% (3/69) Deaf 3% (5/176) 5% (3/56) 4% (2/51) 0% (0/69) Cognition Normal 38% (55/144) 56% (24/43) 42% (18/43) 22% (13/58)
Borderline functioning/mild deficit 35% (50/144) 18% (8/43) 37% (18/43) 45% (26/58) Moderate to profound deficit 27% (39/144) 26% (11/43) 21% (9/43) 33% (19/58) Current activity, children
Normal school 32% (29/90) 50% (16/32) 14% (5/36) 36% (8/22)
Special education 43% (39/90) 19% (6/32) 58% (21/36) 55% (12/22)
Learning not possible 25% (22/90) 31% (10/32) 28% (10/36) 9% (2/22)
Current activity, adults
Normal employment 14% (7/49) 33% (1/3) 43% (3/7) 8% (3/39)
Adjusted employment 12% (6/49) 0% (0/3) 14% (1/7) 13% (5/39)
Daycare 45% (22/49) 67% (2/3) 29% (2/7) 46% (18/39)
Bedridden 29% (14/49) 0% (0/3) 14% (1/7) 33% (13/39)
a
Nine patients were left out as coordination was not evaluable due to absence of intentional movements.
Intrafamilial Variation
Thirty-three families had >1 affected child. Siblings from 18 families were categorized in the same onset group. In the other 15 families, siblings were categorized in 2 subse-quent onset groups. Disease course and severity among siblings were relatively similar. Siblings with disease onset at <2 years all showed homogeneous phenotypes with rapid deterioration. With childhood or adult onset, wider individual variation was observed and siblings could show more divergent phenotypes with involvement of different domains.
Disability Scores
An overview is provided in Supplementary Table 7A. In total, 262 patients were eligible for formal HUI scoring based on the age criterion of ≥2 years. We obtained at least 1 formal HUI inventory in 65% of patients (171/262) at disease durations ranging from 6 months to 38 years. In several patients, >1 HUI inventory was per-formed, bringing the total number to 258.
For GNDS scoring, 178 patients were eligible based on the age criterion of ≥8 years. In 64% of patients (114/178), at least 1 GNDS inventory was obtained at disease durations ranging from 1 to 38 years. In several patients, >1 GNDS inventory was performed, bringing the total number to 172.
HUI Health Index
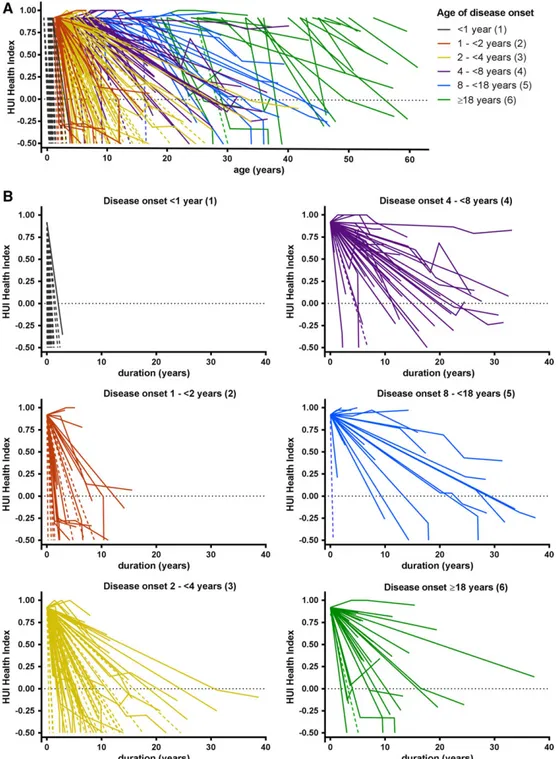
The overall median HUI Health Index score derived from formal assessments across all time points was 0.21 (quar-tiles = −0.14 to 0.69). Thirty-six percent of scores (93/258) were negative. We also gave all patients a stan-dard baseline score at disease onset and all deceased patients a score of−0.5 at death. In 60 patients, no formal HUI scoring was obtained; they only received baseline and death scores. The disease course per patient on the basis of all HUI scores from disease onset until latest follow-up or death is depicted in Figure 4A. There was a wide variability in disease course, but later onset was gen-erally associated with less disability and lower mortality. The HUI Health Index scores per onset group in relation to disease duration are depicted in Figure 4B and show a wide variability. Analysis at group level by linear mixed model analysis showed that the course of the scores dif-fered significantly between the age at onset groups (p < 0.001). Disease progression was most rapid in group 1, followed by group 2, subsequently group 3, and then groups 4 to 6. There were no significant differences between groups 4, 5, and 6.
HUI Single-Attribute Scores
The distribution of scores per HUI attribute is displayed in Supplementary Table 7B. Dependent on age at onset, there were differences in the distribution of disability TABLE 2. Multivariate Cox Regression Analyses of Factors Affecting Survival and Loss of Walking with or
without Support
Factor Survival Preservation of Ambulation
n Hazard Ratio (95% CI) p n Hazard Ratio (95% CI) p
Age at onset
Continuous variable 259 1.07 (1.02–1.13) 0.009 213 1.05 (1.01–1.09) 0.008 Sex
Male 118 1.0, reference 0.28 95 1.0, reference 0.53
Female 141 1.26 (0.83–1.93) 118 1.13 (0.78–1.64)
Exacerbating course
Absent 46 1.0, reference 0.033 40 1.0, reference 0.001
Present 213 0.33 (0.12–0.91) 173 0.25 (0.11–0.56)
History of seizuresa
Absent 97 1.0, reference 0.016 88 1.0, reference <0.001
Present 162 0.42 (0.21–0.85) 125 0.27 (0.16–0.45)
a
Information was imputed for 75 patients. CI = confidence interval.
scores at different stages of the disease. We therefore made spider plots presenting the distribution of HUI single attribute scores for early and late onset categories and sep-arately for mild, intermediate, and severe disability, as assessed by overall HUI Health Index scores (Fig 5). For mild disability, early onset was typically associated with motor signs, whereas late onset patients more often
presented cognitive problems. At the intermediate disabil-ity stage, motor problems were already severe in early onset patients. In the case of severe disability, profound motor problems, loss of self-care, and moderate to severe cognitive decline was invariably present in early and late onset categories. Hearing and Emotion were generally spared. Mean scores and confidence intervals of all
FIGURE 4: Disease course in vanishing white matter patients as assessed by Health Utilities Index (HUI) Health Index scores. Graphs depict disease course in relation to age (A) and disease duration (B). One line represents 1 patient. Age at onset groups are marked by different colors. Scores range from−0.50 (dead) to 1 (perfectly healthy). Solid lines represent patients in whom ≥1 formal scores were obtained. Dotted lines represent patients in whom only baseline and death scores were available. In some patients, the score initially improves as a result of a better score at thefirst formal assessment compared to the standard baseline score.
HUI attributes for all 3 onset categories are available at https://www.vumc.com/branch/Children-White-Matter-Disorders.
Quality of Life: Impact on Emotion
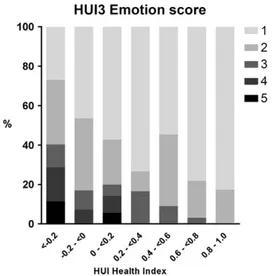
Considering the large number of negative formal HUI Health Index scores (n = 93), a state considered worse than dead by the general population, we evaluated the scores on the HUI attribute Emotion (Fig 6). In total, only 8 of 258 Emotion scores represented a state “so unhappy that life is not worthwhile.”
Guy’s Neurological Disability Scale
The overall median GNDS sum score across all time points was 21 (quartiles = 10–33). The distribution of scores per GNDS domain is displayed in Supplementary Table 7C.
We again made spider plots to depict the distribution of GNDS domain scores for the early and the late onset cate-gories and separately for mild, intermediate, and severe dis-ability, as assessed by the GNDS sum score (Fig 5). Early onset cases typically presented motor signs at early disease stages, whereas late onset patients more often presented cognitive problems early in the disease course. Speech/ Communication was better preserved in late onset cases. Mood was relatively spared among early onset cases. Mean scores and confidence intervals of all GNDS domain scores for the 3 onset categories are available at https://www. vumc.com/branch/Children-White-Matter-Disorders.
Other Problems
In 51% of the questionnaires (87/172), other problems due to VWM were mentioned in addition to the
FIGURE 5: Spider plots of selected Health Utilities Index (HUI) and Guy’s Neurological Disability Scale (GNDS) scores in the early and late age at onset categories. Mean HUI single attribute scores and GNDS domain scores are shown for 3 different disease stages for early (<4 years, black lines) and late (≥18 years, orange lines) onset vanishing white matter. (A–C) HUI Health Index scores of≥0.5 to 1.0 represent mild to no disability (A), scores of 0 to < 0.5 represent intermediate disability (B), and scores of −0.36 to 0 represent severe disability (C). HUI attribute scores range from 0.0 (most disabled) to 1.0 (normal status). (D–F) GNDS sum score <10 represents mild disability (D), score = 10 to <30 represents intermediate disability (E), and score≥ 30 represents severe disability (F). GNDS domain scores range from 0 (normal status) to 5 (total loss of function). HUI attributes and GNDS domains in which the scores of the early and late age at onset categories are significantly different are indicated by *p < 0.05, **p < 0.01, and ***p < 0.001. In the plots of GNDS scores, the order of domains was based on the order of the items in the questionnaires. The order of the HUI domains was adapted to create analogy with the GNDS spider plots for overlapping items. For the HUI, a higher score is associated with better function, whereas for the GNDS a higher score is associated with worse function.
11 GNDS domains. Details are available in Supplemen-tary Table 7D.
Correlation HUI and GNDS Scores
Comparison of HUI Health Index and GNDS sum scores for individuals revealed a significant correlation (p < 0.001, r2= 0.82). Comparison of scores on domains that were
covered by both systems, obtained in individuals at the same time points, showed a significant correlation for all domains (p < 0.001), Cognition (r2= 0.57), Vision
(r2= 0.69), Speech/Communication (r2= 0.57), Leg Function (r2= 0.78), and Arm Function (r2= 0.77).
Discussion
Our study confirms that VWM has an extremely broad phenotypic range and that age at onset is an important determinant of prognosis.15,34 Patients with onset at <1 year consistently have a rapidly progressive disease and die within several months. They rarely show any recovery after episodic deterioration. Many are encephalopathic and have refractory epilepsy. Involvement of extracerebral organs occurs only in this group. Patients with onset at 1 to <2 years typically show rapid decline, with wheelchair dependency after months to a few years and often death after several years. Disease course in patients with onset at 2 to <4 years is more variable, but generally fairly progres-sive. Many die after 1 to several years, but others reach adulthood, although invariably severely handicapped. No significant differences in rates of deterioration are present between patients with onsets at 4 to <8, 8 to <18, and ≥18 years; mortality is low. Patients with onset at
≥18 years are more likely to have cognitive decline early in the diseases course.
Thus, within the VWM spectrum, 2 key disease courses can be distinguished: presentation at <4 years (60% of cases in our cohort) is generally followed by a rapidly progressive course dominated by motor dysfunc-tion with a profound age at onset effect on disease course. Presentation from 4 years on (40%) is associated with a more heterogeneous, less progressive course with low mor-tality, independent of age at onset. These are not strictly separated phenotypes, and much variation is seen, with some early onset patients having an unexpectedly slow dis-ease course and some late onset patients experiencing rapid decline and death. For most leukodystrophies, later age at onset is associated with slower clinical progres-sion.35It is interesting that in VWM, apart from the lon-ger symptom-free interval, presentation in adulthood is not associated with a more favorable disease course than presentation in later childhood or adolescence. For all ages of onset, seizures and episodic deteriorations are important negative predictors of disease course, underlining the importance of seizure control and preventive measures such as avoiding head trauma, antibiotics, and antipyretics for all patients.7The present study confirms the presence of a genotype–phenotype correlation.15,33,36
In patients with severe phenotypes, the genotype appears to supersede the effect of environmental or other genetic factors on the symptomatology, whereas in milder variants, larger variability is observed, most likely due to the impact of environment, such as exposure to factors that provoke episodic deterioration.
Prior studies have pointed to sex-related differences among VWM patients, such as the male:female imbalance among adolescent/adult onset patients and possible differ-ences in disease severity.13,14,33Our study did not confirm consistent clinical differences between males and females. Although we also observed an overrepresentation of females among adult onset cases, this finding was not statistically significant. Still larger numbers of patients are required to definitively address the question of sex differences in VWM. Using the HUI and GNDS, we estimated disability in VWM patients with different ages at onset and disease courses in a standardized way. The scores provide insight into profiles of sequential loss of function. The domains ambulation and manual dexterity are most severely affected. The majority of patients are dependent on carers for eating, bathing, dressing, and/or toilet use. Over time, loss of bladder and bowel function occurs, and at advanced disease stage speech and swallowing are affected. Compared to children, who soon have prominent motor handicap, adult onset patients show earlier and more prominent cognitive problems, as commonly observed in
FIGURE 6: Individuals’ Health Utilities Index Mark 3 (HUI3) Emotion scores in relation to their formal HUI Health Index scores, which range from −0.36 (most disabled state) to 1 (no handicap). 1 = happy and interested in life; 2 = somewhat happy; 3 = somewhat unhappy; 4 = very unhappy; 5 = so unhappy that life is not worthwhile.
leukodystrophies in general,37 and more often have pre-served speech in advanced disease. Vision and hearing remain relatively intact in all patients.
The attribute utility scores of the HUI not only rep-resent a measure of health status, but also embody the subjective views of society on objectively defined health status features, as obtained from a random sample of 504 people from Canada.23Remarkably, despite one-third of HUI Health Index scores representing a “worse than dead” health state, most patients were perceived as “happy” or “somewhat happy” (scores on the attribute Emotion). Clearly, society’s perspective may not corre-spond to the quality of life perceived by patients or their caregivers, a phenomenon known as “disability para-dox.”38As has been observed in other debilitating
neuro-logical disorders,39,40patients often adjust their subjective perception of quality of life. This change of internal stan-dards or“response-shift”41 is not represented in the HUI. In the majority of patients, the responses were generated by parents and health professionals, who tend to provide lower valuations for HRQL than patients,39,42,43 suggest-ing that the discrepancy between HRQL as perceived by patients and as perceived by society may even be greater. No agreement exists on how to do justice to both the objective function and the subjective judgment of HRQL. This study has some limitations. We aimed for robust parameters of disease progression. However, certain parame-ters, such as wheelchair dependency, may be influenced by factors such as motivation. For survival, differences in clinical practice, medical resources, and cultural preferences regarding end stage disease impact outcome. Several items were scored by subjective assessment; without formal testing, parameters such as cognitive decline, vision, and hearing are rather rough indicators of the respective items. Interobserver differ-ences and selection and information biases may have ham-pered the study. In natural history studies, assessments would optimally be prospective and occur at regular intervals from disease onset until death in all patients. Death and loss to follow-up caused numerous missing data in all patient groups. We have no evidence that nonresponse was in any way systematic. As a result of the multicenter nature of the study and the wide variability in disease course, we had to deal with different intervals for the clinical scoring, incom-plete datasets, censored data, and survival effects, with longer follow-up and therefore more follow-up data on patients with milder disease course; survival analysis and mixed model linear analysis are the appropriate statistical methods to ana-lyze such datasets and are applied here.
This study also has important strengths. Most limi-tations mentioned are lessened or overcome by the large number of patients for a rare disease, enhancing the power of the study and compensating for missing data. Other
strengths are the longitudinal character of the study, with duration of 12½ years, and the use of standardized instru-ments that have been extensively validated in diverse populations.18,27,30,44,45 The latter also enables the com-parison of the burden of VWM to other patient groups. Overall, this study provides robust insights into domains of disability in VWM for different age at onset groups.
The study results are important for health services, as type and severity of disability determine patients’ capa-bilities to perform daily activities, type and level of care needed, and social and economic impact of the disease. Additionally, estimates derived from natural history are crucial for study design of clinical trials, selection of clini-cally relevant endpoints, and determination of which patient population to target. There are currently no cura-tive treatment options for VWM, but the technological progress in the field of leukodystrophies is promising.46,47 Prospects of curative therapy have intensified the need to document the natural history of VWM. In this view, the current work may serve as a reference point to design and evaluate future therapeutic interventions.
Acknowledgment
This study received financial support from ZonMw AGIKO grant (920-03-308) and the Optimix Foundation for Scientific Research.
We thank all patients, families, and referring physi-cians for their cooperation and contribution.
Author Contributions
M.S.v.d.K. contributed to the conception and design of the study. All authors contributed to data acquisition and design. E.M.C.H. and M.S.v.d.K. drafted the manuscript and figures. All members of the VWM Research Group contributed to identification and inclusion of patients and the acquisition of clinical data.
Potential Conflicts of Interest
Nothing to report.
References
1. Schiffmann R, Moller JR, Trapp BD, et al. Childhood ataxia with diffuse central nervous system hypomyelination. Ann Neurol 1994;35:331–340. 2. van der Knaap MS, Barth PG, Gabreels FJ, et al. A new
leukoencephalo-pathy with vanishing white matter. Neurology 1997;48:845–855. 3. van der Knaap MS, Kamphorst W, Barth PG, et al. Phenotypic
varia-tion in leukoencephalopathy with vanishing white matter. Neurology 1998;51:540–547.
4. Bonkowsky JL, Nelson C, Kingston JL, et al. The burden of inherited leukodystrophies in children. Neurology 2010;75:718–725.
5. Leegwater PA, Vermeulen G, Konst AA, et al. Subunits of the transla-tion initiatransla-tion factor eIF2B are mutant in leukoencephalopathy with vanishing white matter. Nat Genet 2001;29:383–388.
6. van der Knaap MS, Leegwater PA, Konst AA, et al. Mutations in each of thefive subunits of translation initiation factor eIF2B can cause leukoen-cephalopathy with vanishing white matter. Ann Neurol 2002;51:264–270. 7. van der Knaap MS, Pronk JC, Scheper GC. Vanishing white matter
disease. Lancet Neurol 2006;5:413–423.
8. Hanefeld F, Holzbach U, Kruse B, et al. Diffuse white matter disease in three children: an encephalopathy with unique features on mag-netic resonance imaging and proton magmag-netic resonance spectros-copy. Neuropediatrics 1993;24:244–248.
9. van der Knaap MS, van Berkel CG, Herms J, et al. eIF2B-related dis-orders: antenatal onset and involvement of multiple organs. Am J Hum Genet 2003;73:1199–1207.
10. Fogli A, Wong K, Eymard-Pierre E, et al. Cree leukoencephalopathy and CACH/VWM disease are allelic at the EIF2B5 locus. Ann Neurol 2002;52:506–510.
11. Black DN, Harris R, Schiffmann R, Wong K. Fatal infantile leukodys-trophy: a severe variant of CACH/VWM syndrome, allelic to chromo-some 3q27. Neurology 2002;58:161–162.
12. Prass K, Bruck W, Schroder NW, et al. Adult-onset leukoencephalo-pathy with vanishing white matter presenting with dementia. Ann Neurol 2001;50:665–668.
13. Carra-Dalliere C, Horzinski L, Ayrignac X, et al. Natural history of adult-onset eIF2B-related disorders: a multicentric survey of 24 cases [in French]. Rev Neurol (Paris) 2011;167:802–811.
14. Labauge P, Horzinski L, Ayrignac X, et al. Natural history of adult-onset eIF2B-related disorders: a multi-centric survey of 16 cases. Brain 2009;132:2161–2169.
15. Fogli A, Schiffmann R, Bertini E, et al. The effect of genotype on the natural history of eIF2B-related leukodystrophies. Neurology 2004; 62:1509–1517.
16. van der Knaap MS, Bugiani M, Boor I, et al. Vanishing white matter. In: Valle D, Beaudet AL, Vogelstein B, et al, eds. The online meta-bolic and molecular bases of inherited disease (OMMBID). New York, NY: McGraw-Hill, 2010;1–44.
17. Horsman J, Furlong W, Feeny D, Torrance G. The Health Utilities Index (HUI): concepts, measurement properties and applications. Health Qual Life Outcomes 2003;1:54.
18. Feeny D, Leiper A, Barr RD, et al. The comprehensive assessment of health status in survivors of childhood cancer: application to high-risk acute lymphoblastic leukaemia. Br J Cancer 1993;67:1047–1052. 19. Gemke RJ, Bonsel GJ, van Vught AJ. Long-term survival and state of
health after paediatric intensive care. Arch Dis Child 1995;73: 196–201.
20. Fisk JD, Brown MG, Sketris IS, et al. A comparison of health utility measures for the evaluation of multiple sclerosis treatments. J Neurol Neurosurg Psychiatry 2005;76:58–63.
21. Kennes J, Rosenbaum P, Hanna SE, et al. Health status of school-aged children with cerebral palsy: information from a population-based sample. Dev Med Child Neurol 2002;44:240–247. 22. Torrance GW, Feeny DH, Furlong WJ, et al. Multiattribute utility
function for a comprehensive health status classification system. Health Utilities Index Mark 2. Med Care 1996;34:702–722.
23. Feeny D, Furlong W, Torrance GW, et al. Multiattribute and single-attribute utility functions for the Health Utilities Index Mark 3 system. Med Care 2002;40:113–128.
24. Naeim A, Keeler EB, Mangione CM. Options for handling missing data in the Health Utilities Index Mark 3. Med Decis Making 2005;25:186–198. 25. Pogany L, Barr RD, Shaw A, et al. Health status in survivors of cancer
in childhood and adolescence. Qual Life Res 2006;15:143–157.
26. Fryback DG, Dunham NC, Palta M, et al. US norms for six generic health-related quality-of-life indexes from the National Health Mea-surement study. Med Care 2007;45:1162–1170.
27. Sharrack B, Hughes RA. The Guy’s Neurological Disability Scale (GNDS): a new disability measure for multiple sclerosis. Mult Scler 1999;5:223–233. 28. Van den Berg-Vos RM, Franssen H, Wokke JH, Van den Berg LH.
Multifocal motor neuropathy: long-term clinical and electrophysio-logical assessment of intravenous immunoglobulin maintenance treatment. Brain 2002;125:1875–1886.
29. Khan F, Amatya B, Ng L, Galea M. Rehabilitation outcomes in persons with spina bifida: a randomised controlled trial. J Rehabil Med 2015;47:734–740. 30. Rossier P, Wade DT. The Guy’s Neurological Disability Scale in
patients with multiple sclerosis: a clinical evaluation of its reliability and validity. Clin Rehabil 2002;16:75–95.
31. Janse AJ, Sinnema G, Uiterwaal CS, et al. Quality of life in chronic ill-ness: children, parents and paediatricians have different, but stable perceptions. Acta Paediatr 2008;97:1118–1124.
32. Boltshauser E, Barth PG, Troost D, et al.“Vanishing white matter” and ovarian dysgenesis in an infant with cerebro-oculo-facio-skeletal phenotype. Neuropediatrics 2002;33:57–62.
33. van der Lei HD, van Berkel CG, van Wieringen WN, et al. Genotype-phenotype correlation in vanishing white matter dis-ease. Neurology 2010;75:1555–1559.
34. Labauge P, Fogli A, Niel F, et al. CACH/VWM syndrome and leuco-dystrophies related to EIF2B mutations [in French]. Rev Neurol (Paris) 2007;163:793–799.
35. Van Haren K, Bonkowsky JL, Bernard G, et al. Consensus statement on preventive and symptomatic care of leukodystrophy patients. Mol Genet Metab 2015;114:516–526.
36. van der Knaap MS, Leegwater PA, van Berkel CG, et al. Arg113His mutation in eIF2Bepsilon as cause of leukoencephalopathy in adults. Neurology 2004;62:1598–1600.
37. Vanderver A. Genetic leukoencephalopathies in adults. Continuum (Minneap Minn) 2016;22:916–942.
38. Albrecht GL, Devlieger PJ. The disability paradox: high quality of life against all odds. Soc Sci Med 1999;48:977–988.
39. Landfeldt E, Lindgren P, Bell CF, et al. Health-related quality of life in patients with Duchenne muscular dystrophy: a multinational, cross-sectional study. Dev Med Child Neurol 2016;58:508–515. 40. Petrou S, Kupek E. Estimating preference-based Health Utilities
Index Mark 3 utility scores for childhood conditions in England and Scotland. Med Decis Making 2009;29:291–303.
41. Sprangers MA, Schwartz CE. Integrating response shift into health-related quality of life research: a theoretical model. Soc Sci Med 1999;48:1507–1515.
42. Saigal S, Stoskopf BL, Feeny D, et al. Differences in preferences for neonatal outcomes among health care professionals, parents, and adolescents. JAMA 1999;281:1991–1997.
43. White-Koning M, Arnaud C, Dickinson HO, et al. Determinants of child-parent agreement in quality-of-life reports: a European study of children with cerebral palsy. Pediatrics 2007;120:e804–e814. 44. Furlong WJ, Feeny DH, Torrance GW, Barr RD. The Health Utilities
Index (HUI) system for assessing health-related quality of life in clini-cal studies. Ann Med 2001;33:375–384.
45. Hoogervorst EL, van Winsen LM, Eikelenboom MJ, et al. Compari-sons of patient self-report, neurologic examination, and functional impairment in MS. Neurology 2001;56:934–937.
46. Helman G, Van Haren K, Escolar ML, Vanderver A. Emerging treatments for pediatric leukodystrophies. Pediatr Clin North Am 2015;62:649–666. 47. Ricca A, Rufo N, Ungari S, et al. Combined gene/cell therapies
pro-vide long-term and pervasive rescue of multiple pathological symp-toms in a murine model of globoid cell leukodystrophy. Hum Mol Genet 2015;24:3372–3389.