Ion acceleration by fs laser in target-normal-sheath-acceleration regime and
comparison of time-of-flight spectra with particle-in-cell simulations
L. Torrisi *and G. Costa
Department of Mathematics and Computer Sciences, Physics Sciences and Earth Science (MIFT), Messina University, V.le F.S. d’Alcontres 31, 98166 Messina, Italy
(Received 25 August 2019; published 15 January 2020)
The ions acceleration through an fs laser irradiating a reduced graphene oxide foil in a target-normal-sheath-acceleration regime is investigated using a SiC detector connected in time-of-flight configuration. The experimental data indicated maximum proton energy of 1.8 MeV and a large number of carbon ions accelerated at different energies depending on their charge state. Particle-in-cell (PIC) simulations were applied to the studied target given the electron density as a function of the space and time and permitted one to evaluate the electrical field developed in the rear side of the foil driving the forward ion acceleration. The simulation indicates that the carbon ions are subjected to a lower acceleration with respect to protons, due to their slow velocity, depending on the charge-to-mass ratio. The latter does not permit carbon ions to be affected by the maximum electric field but a lower intensity due to the fast time decay of the electric field. Considering the angular emission of protons and the six carbon ions, the charge particles assume a Boltzmann energy distribution with a fixed cutoff at high energy, in agreement with the experimental measurements of ion energy.
DOI:10.1103/PhysRevAccelBeams.23.011304
I. INTRODUCTION
MeV protons and light ions have been accelerated using target normal sheath acceleration (TNSA) regime and high-pulsed laser intensities above 1015 W=cm2by femtosecond
(fs) pulses. Accelerated protons and carbon ions have a yield proportional to their content in the target foil.
The ion acceleration is due to the electric field devel-oped behind the laser-irradiated thin target, which is generated between the emitted relativistic electrons, pushed out by the laser light, and the positive target ions. The maximum forward ion acceleration depends on the electron density and temperature of the generated non-equilibrium plasma[1].
Recently our experiments, obtained using fs laser pulse at an intensity of about 1018 W=cm2, have permitted proton
acceleration to energy above 1 MeV and carbon energy up to about 6 MeV[1,2].
The main mechanisms to explain the observed results consist of the ponderomotive acceleration from the front surface of the target and the electrostatic sheath acceler-ation from the rear surface of the target. The electrostatic
sheath created by the hot electrons allows a strong charge separation over a small-scale length, which produces a strong electric field given by
E ¼ ffiffiffiffiffiffiffiffiffiffi nekT ϵ0 s ; ð1Þ
where ne is the plasma electron density, kT the plasma
electron temperature, and ε0 is the dielectric constant in
vacuum [3,4]. Typical electric fields are of the order 1012 V=m and their duration is comparable with the laser
pulse duration.
In this paper, the experimental data of forward ion acceleration in the TNSA regime, using a thin carbon foil and monitoring them with time-of-flight (TOF) technique, are explained thanks to a comparison with particle-in-cell (PIC) Epoch code simulation data [5]. It represents an innovative comparison because the literature does not report such an approach starting from spectra acquired using semiconductor detectors.
For the first time, this paper reports about a comparison between experimental ion measurements with TOF spectra performed using a SiC detector and PIC simulation data for TNSA regime experiments obtained using an fs laser at 4 × 10¹⁸W=cm2 intensity. It shows a good agreement of
results indicating protons and other ions acceleration and explaining the difference of the ion acceleration on the base of their mass-to-charge ratio.
*Corresponding author. [email protected]
Published by the American Physical Society under the terms of the Creative Commons Attribution 4.0 International license. Further distribution of this work must maintain attribution to the author(s) and the published article’s title, journal citation, and DOI.
II. EXPERIMENTAL SETUP
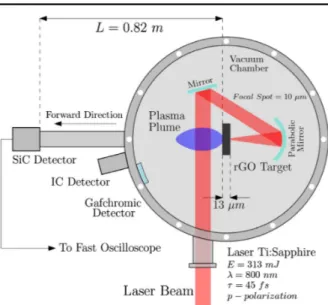
The experiments were performed at the Institute of Plasma Physics and Laser Microfusion (IPPLM) fs laser of Warsaw (Poland) using a Ti-Sapphire laser operating at 800 nm wavelength, with 313 mJ pulse energy, 45 fs pulse duration, 109 contrasts, focused to 10-μm spot diameter,
with an intensity of about 8.8 × 10¹⁸W=cm2 and single
pulse emission. A pedestal of amplified spontaneous emission was present from 10 ps before the main pulse at a level of 10−9 of the main pulse intensity[6].
The solid target consists of reduced graphene oxide (rGO) foil, 13 μm in thickness, irradiated at an incidence angle of 3°. Such target was chosen for the interest toward an innovative foil containing high carbon and hydrogen con-centration, mechanically high resistant and ready to become reduced and highly conductive just irradiated by the laser pulse, in accordance with the literature [7]. The target preparation method is described in our previous paper[8].
The plasma diagnostics use a SiC detector, having 4 mm2active surface area and 80 μm active depth, placed
at a known distance from the target (82 cm) placed along the normal to the target surface for TOF measurements of photons, electrons, and ions. The solid angle of the SiC detector, the very high accurate detector in this experiment, is very low and corresponds to 6 μsr. The SiC detector allows on to detect x rays, electrons, and ions in the same TOF spectrum. Moreover, due to its energy gap of 3.3 eV it is blind to visible radiation and does not reveal the intense visible emission emitted by the plasma. In addition, its leakage current at room temperature is more than 2 orders of magnitude lower with respect to silicon detector, permitting one to have high sensitivity at room temperature. More details on the SiC-TOF approach are described in our previous paper[9].
An ion collector (Faraday Cup) was also employed operating in TOF connection (70 cm from the target) placed in forward at a 3° angle with respect to the normal to the surface. Gafchromic films (HD-V2) were employed to evince the presence of high energetic protons filtered by suitable aluminium absorbers[10]. Being the proton range in Al of 14.4 μm and 41.6 μm for 1 MeV and 2 MeV, an Al absorber of 15 μm and another of 42 μm were employed to cover the gafchromic detector to reveal protons higher than 1 and 2 MeV, respectively.
Ion stopping powers, energy loss, and ranges were calculated using SRIM code[11].
The experimental setup is reported in the schematic of Fig.1.
A. PIC simulation procedure
In this work, we compare the experimental results with 2D-PIC simulation by the use of EPOCH code[5], version 4.9.0, developed by the University of Warwick (UK). PIC-EPOCH code simulates collisionless plasma kinetics; the
core of its solver can be distinguished in two coupled solvers: the first one is the field solver, which calculates Maxwell’s equations for an electro-magnetic (EM) field on a fixed spatial grid subject to the currents calculated by particle motions. The second is the particle pusher, which moves particles in the space under the influence of EM fields and calculates the currents due to the charge particles motion. By these two solvers, the collisionless interaction of a kinetic plasma can be taken into account[12,13]. The cell box is settled to the dimension of 50 μm × 30 μm (x direction × y direction), from−20 μm to 30 μm in the x direction and between $15 μm in the y direction. The box contains square cells with a size of 10 nm, in order to have simulation stability, due to the high electron density of the solid target, to resolve the plasma skin depth.
Assuming the target density to be that of the graphene oxide of 1.7 g=cm3, and assuming the carbon atoms to be
all ionized, the electron density in the simulated plasma is 5.2 × 10²³ electrons=cm3.
The critical plasma density nc at which the plasma
frequency ω equals the frequency of the laser traveling in plasma is[14]
nc¼
ε0meω2
e2 ¼ 1.7 × 10
21=cm3; ð2Þ
where ε0is the dielectric constant in the vacuum and meis
the electron mass.
We introduced 90 electrons per cell, with a density in the foil of 200 nc, which is defined between 0 and 13 μm,
according to the target thickness.
The target bulk was considered fully ionized, introducing 50 macroparticles of carbon 6þ per cell, at densities of about 35 nc (1=6 ne). Finally, 20 nm of surface thickness
contains 2000 particles per cell for each carbon charge state and for protons. The shape function is the default EPOCH function, i.e., second order triangular shape. Numerical heating may vary by changing the number of particles per cell. In particular, it could increase, by reducing the number of macroparticles, increasing the size of the cells, increas-ing the density of the plasma, increasincreas-ing the time step of the simulation, changing the boundaries conditions and more. In order to minimize the numerical heating, we used thermal boundary conditions in both y directions and simple outflow in the x direction, with square cells of 10 nm. In addition, EPOCH provides the possibility to use smoothed currents, which we have used in our simulations. Finally, the effect of the numerical heating could become severe with the increase of the simulation time; our simulations do not exceed 300 fs. Based on what has been explained, the simulations are numerically stable and resolve the laser-plasma interaction well.
To take into account preplasma formation, due to prepulse interaction with the target, we introduce an increasing exponential shape for electrons density, namely np, up to the critical density, nc, defined between−2 μm
and 0 μm in x backward direction [15], which has the following form:
np¼ ncexp
"
−1 μmx #: ð3Þ
Thus, the preplasma has a short range of 2 μm, and decreases its value at 0.37 nc at 1 μm from the target
surface. For the simulation, in the bulk target, we introduce 50 particles of each carbon charge state. Moreover, in the forward surface, we assume a thin layer of impurity (20 nm), containing 2000 particles of each charge, from 1þ to 6þ of carbon, and 1500 proton particles. Really we know that the hydrogen concentration in graphene oxide (GO) is less than 1%[8], but this assumption permits one to increase particles statistics. The temperature of all particles is initiated to 1 keV. The plasma target has a transverse size of $15 μm, i.e., the target is touching simulation box boundaries, where thermal boundary conditions for par-ticles are applied.
The laser pulse enters in the simulation box from x ¼ −20 μm, and reaches the target at the time referred to as t ¼ 0. A laser pulse intensity of 4 × 10¹⁸W=cm2with
normal incidence on the target, and being p polarized, is assumed. The pulse has a Gaussian temporal profile, with an FWHM of 45 fs. The full pulse duration is chosen to 90 fs. The PIC-simulation code returns the output value of interest every 20 fs, as defined by the user.
III. RESULTS
A typical SiC-TOF spectrum acquired irradiating the GO foil using a single laser shot is reported in Fig. 2. The spectrum reports a photopeak due to the detection of x rays
and relativistic electrons emitted from the plasma, followed by a large, structured and intense ion peak, in agreement with similar experiments using SiC-TOF technique[16]. The faster detected ions are protons, due to hydrogen present in the sample as water, C─O─H functional groups chemically bonded to C atomic structure, and absorbed as gas in the GO foil. The minimum flight time of the proton signal is measured at a TOF of 44 ns, corresponding to a velocity of 1.87 × 10⁷m=s and to the kinetic energy of
1.8 MeV. Protons are followed, at higher TOF values, by an intense and structured peak due to the main elements composing the target, i.e., to the accelerated carbon ions, with a velocity lower than protons. The net and high discontinuity of the ion spectrum between the little proton peak and the bigger ion peak occurs at a TOF of about 83 ns, corresponding to the detection of carbon ions at a kinetic energy of 6 MeV.
The maximum proton energy was also measured through the IC detector but its signal was very disturbed by the high electromagnetic noise produced during the laser pulse emission.
In addition, the maximum proton energy of 1.8 MeV was also confirmed by the gafchromic detectors employed with Al absorbers; in fact, the gafchromic detectors have shown the typical dark color of an ion dose when the absorber was 15 μm and not when it was increased to 42 μm, in agreement with the literature[2].
By rotating the SiC detector in a forward direction around to the normal to the target surface, the angular ion emission was recorded and it was observed that it decreases in energy and yield assuming the maximum value at a 0° angle, as expected. The high proton and carbon energy are maintained high near to 0° ($2°) while its yield remains significant approximately within $25° and $20°, respectively. According to the literature[17,18], the higher FIG. 2. SiC-TOF spectrum obtained irradiating a graphene oxide foil, 13 μm thick, by 313 mJ pulse using a TOF distance of 0.82 m.
carbon charge states are more directive of the lower and protons have a little larger angular distribution. Thus, the angular dependence θ of the ion yield Y can be given as
YðθÞ ∝ cosnθ; ð4Þ
where the exponent n ¼ 50 denotes protons and n ¼ 60 to 75 denotes carbon-ions from C1þup to C6þ, respectively.
The ion emission has high directivity, which is higher for the C6þions with respect to the C1þions and with respect
to the larger emitted protons. Increasing the ion mass and the ion charge state, the angular distribution becomes more narrow around the normal to the target surface, in agree-ment with our measureagree-ments and with the literature[19]. In order to deconvolve the ion peak, separating the contribution of the protons from that of carbon ions, and separating the different detected carbon ion charge states, a PIC simulation comparison of the expected data with the experimental spectrum was performed.
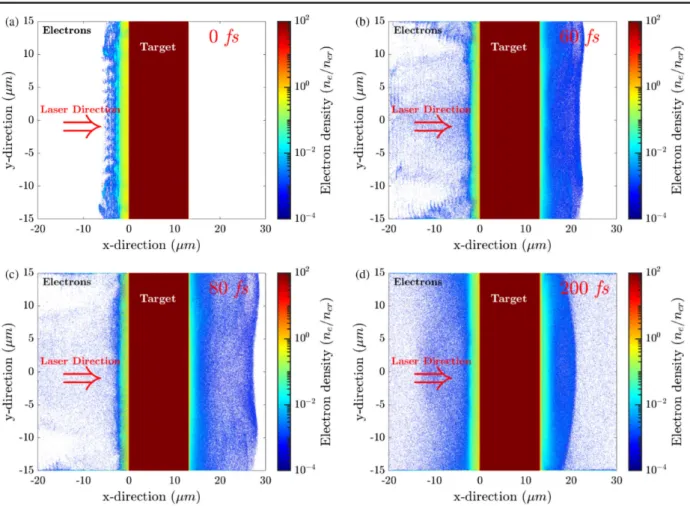
Figure 3 shows a 2D-PIC spatial map for emitted electrons density profile in the simulation box reporting
the target foil at different times, starting with the laser interaction 0 fs up to a time duration of 200 fs. At 0 fs, the laser reaches the target, thick 13 μm with the density of about 5.2 × 10²³electrons=cm3. Of course, the emission of
electrons starts in a backward direction. Subsequently, the laser guides the electrons in the forward direction, which between 60 and 80 fs are responsible for the main peak in the longitudinal electric field (there is a large number of electrons close to the target surface). Within about 100 fs, the fastest electrons left the simulation box. The 200 fs frame shows an increase in the number of electrons close to the target surface due to the electrons reaccelerating back into the target and reejecting from the rear target surface. This expansion of electrons will be responsible for a further peak, with lower intensity, in the longitudinal electric field driving the ion acceleration.
The electron density that is emergent from the back of the irradiated target, in the TNSA regime, can be plotted as a function of the target distance in a forward direction, for the different times after the laser shot. Figure4(a)indicates that the emitted electron density decreases exponentially FIG. 3. 2D-PIC spatial map for emitted electrons density profile, in critical density unit, near to the target at different times starting with the laser interaction: 0, 60, 80, and 200 fs.
from the rear target surface and reduces to about one order of magnitude at about 0.1 μm from the rear target surface, at 100 fs, while a significant increment in the value occurs for a time of about 300 fs. More details of the forward emitted electron density versus target distance, for the lower levels of electron density, as calculated by the PIC simulation, are reported in the plot of Fig.4(b).
The electron density that is emergent from the back target can be plotted as a function of the time from the laser shot for a fixed distance, as reported in Fig.4(c). This plot shows as the density decrease strongly with the time as observable at times higher than 100 fs from the laser shot. The forward emission of electrons generates an electric field between the electron cloud and the positive target, which is responsible for the TNSA ion acceleration, according to Eq. (1). This electric field is characterized by the electron density and plasma temperature kinetics and is developed as a function of the time and of the space as reported in Fig.5.
Figure 5(a) shows the longitudinal electric field, in x -forward direction, as a function of the distance from the target surface, indicating a peak value approximately of about 1.75 × 10¹² V=m at about 60 fs from the laser shot
and positioned at about 14 μm. This means that the peak is (a)
(b)
(c)
FIG. 4. Electron density versus distance from the back target surface for submicrometric length (a) and for micrometric lengths (b) at three different times from the laser shot: 100, 200, and 300 fs. Electron density from the back target surface versus time, for three distances from the target: 0.5, 1.5, and 2.5 μm (c).
(a)
(b)
FIG. 5. Longitudinal electric field versus distance from the target surface, evaluated from PIC code as closeup and normal figure (inset) (a) and as a function of the time in the position of maximum value (14 μm) (b).
placed at about 1 μm from the rear target surface and that the acceleration voltage corresponds to 1.75 MV. Thus, an acceleration for the fast accelerated protons is expected approximately up to an energy of about 1.75 MeV, in good agreement with the measurements of 1.8 MeV.
The electric field peak has a spatial width (FWHM) of about 0.5 μm. Figure5(b)reports the longitudinal electric field as a function of time by fixing the distance from the front target surface at 14 μm. It is possible to observe that two peaks occur in the time due to the return of emitted electrons towards the target, of which the first is the more intense with a duration of about 50 fs (FWHM) and it is responsible for the higher forward proton acceleration. The second peak is about one-third less intense and has a double duration.
Thus, the electrical field developed on the rear side of the target changes with time. Protons, which are very light, are accelerated by the maximum value of the electric field, but the successive carbon ions, having a higher mass and minor velocity, do not receive the maximum acceleration value of the electric field since it decreases during their acceleration motion.
On the basis of the results obtained by the experimental measurements of TOF ion spectra and of the PIC theoretical simulations above, it is possible to find an important data agreement. It permits one to correlate the ion acceleration effect with the detected spectra separating the contribution to the acceleration of each ion species depending on its mass to charge ratio. Protons are the faster ions, followed by the carbon ions of which the faster is the more charged C6þ and the slower the fewer charged C1þ. The TOF
spectra acquired using a SiC detector with an active area of only 4 mm2, placed at 0°, along with the axis of maximum
emission yield and energy, show profiles in energy decreas-ing with time and not as expected in a Boltzmann distribution. This effect is due to the less energetic ions mainly emitted at large angles and not detected if not as a background signal compared with the minimum detection limit. Thus, the TOF spectra and the ion energy distribu-tions, which can be derived, do not show a Boltzmann distribution but peaks quickly damped.
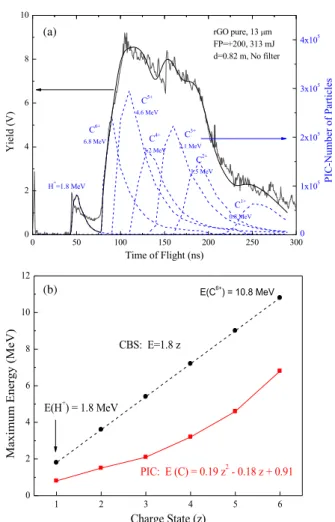
Correlating the PIC ion energy distributions with the angular distribution of the accelerated particles as described by Eq. (4), it is possible to deconvolve the TOF ion spectrum in the different ion contributions as reported in the plot of Fig.6(a). The deconvolution reports the proton contribution and that of the six carbon charge states. From such ion peaks, it is possible to evaluate their maximum energy, which corresponds to 1.8, 6.8, 4.6, 3.2, 2.1, 1.5, and 0.8 MeV for Hþ, C6þ, C5þ, C4þ, C3þ, C2þ, and Cþ,
respectively. By comparing the ion yield, in terms of peak areas, it is possible to observe that the maximum contri-butions are due to higher ionized states of carbon ions, due to their angular distribution being more peaked with respect to the lower charge states and to the protons.
The ion energy distributions, obtained by PIC simula-tions, fit very well into the experimental TOF spectrum. They indicate that the protons have a maximum ion acceleration per charge state (1.8 MeV=z) while the carbon ions have a lower acceleration due to their higher mass, having a maximum value for C6þ (1.13 MeV=z) and a
minor value for C1þ (0.8 MeV=z). This result confirms
that the faster protons reach the spatial position where the electrical field of acceleration is maximum, while the carbon ions, having a higher mass and lower velocity, are subjected to a lower average electric field which is reduced during their forward motion.
Figure6(b)reports the ion energy as a function of the ion charge state as obtained by applying the PIC code and by applying the Torrisi’s Coulomb-Boltzmann-shifted (CBS) theory[20]. In the PIC-EPOCH approach, it is possible to observe that the maximum carbon ion energy EMincreases
with a law proportional to the square of the charge state z, (a)
(b)
FIG. 6. SiC-TOF spectrum and deconvolution peaks of protons and carbon ions, with their maximum energy, as evaluated from PIC code (a) and maximum ion energy versus charge state calculated by PIC and using the CBS approach (b).
due to the higher mass of carbon ions with respect to protons. The fit of the PIC data gives
EMðCzþÞ ¼ 0.19 z2− 0.18 z þ 0.91: ð5Þ
This equation is valid only for carbon ions and takes into consideration the carbon mass.
If we use a CBS approach, instead, the acceleration is assumed to be of 1.8 MeV per charge state both for protons
and per carbon ions (EMðHþÞ ¼ 1.8 z), thus the C6þ ions
should have an energy of 10.8 MeV. Experimental data agree with the PIC model instead of with the CBS approach. This last case, in fact, is applicable to lower laser intensities and to higher laser pulse durations, as reported in the literature, and demonstrates that its appli-cation for intensities above 1018W=cm2 can be only
approximated[20,21].
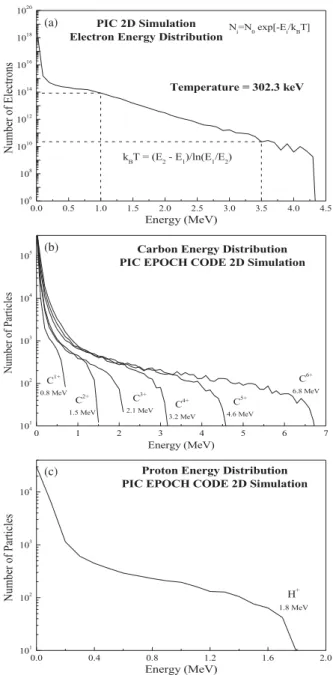
The PIC simulation has permitted us to evaluate the equivalent plasma temperature by the electron energy distributions. Assuming a Boltzmann energy distribution, with a cutoff at about 4.4 MeV electron energy, Fig.7(a) shows the evaluated electron temperature of the plasma kT corresponding to about 302.3 keV. This result is in agree-ment with the theoretical evaluation of the temperature, calculated using the following equation[18]:
kT ¼ m0c2 0 @ ffiffiffiffiffiffiffiffiffiffiffiffiffiffiffiffiffiffiffiffiffiffiffiffiffiffiffiffiffiffiffi 1þ I0λ 2 L 1.37 × 10¹⁸ s − 1 1 A; ð6Þ
where m0is the rest electron mass, c is the light velocity, I0
is the laser intensity (in W=cm2), and λ
L is the laser light
wavelength (in μm). The theoretical value from Eq. (6), proportional to the I0λ2factor, is of about 354 keV, thus in
good agreement with the value determined by the PIC simulation.
Finally, Fig.7(b)reports the carbon ion energy obtained by the PIC simulation, in which it is possible to observe that ions follow Boltzmann distributions with a cutoff propor-tional to the charge state and ranging within 0.8 MeV for C1þand 6.8 MeV for C6þ. Similarly, Fig.7(c)shows the
proton energy by computational method, of which the cutoff energy is calculated at 1.8 MeV. From the last two graphs [Fig. 7(b) and7(c)], and from the angular distri-butions given in Eq. (4), it was possible to convolve the TOF spectrum obtained by using the SiC detector shown in Fig.2, as reported in Fig.6(a).
IV. DISCUSSION AND CONCLUSIONS This article shows innovative results of the comparison between TOF ion spectra and PIC simulation data for ions accelerated from the TNSA regime using an fs laser at 4 × 10¹⁸ W=cm2 intensity. The comparison, in fact, is not
simply between the two different approaches, the first being experimental and the second theoretical, because the literature reports a few examples of correlation[22].
The typical spectrum here reported for proton and carbon acceleration from a reduced graphene oxide target was obtained using a SiC detector placed at a known flight distance from the target and triggered by the laser shot and was extracted from a campaign of experiments at IPPLM laboratory (Poland) [1,23]. Originally, the spectrum was interpreted using the Coulomb-Boltzmann-shifted theory
(a)
(b)
(c)
FIG. 7. Electrons energy spectrum and plasma temperature evaluation (a), number of carbon ions versus energy by charge state (b), and number of protons versus energy (c), calculated from PIC simulations.
presented in the literature[20], affirming that the ions are simultaneously subject to an acceleration of the electrical field developed in the rear side of the target. This theory, useful and confirmed for lower laser intensity and for ns and hundred ps laser pulses, is not valid for a high laser intensity of the order of 1018W=cm2or more and for laser
pulses of tens fs. Experiments performed irradiating gold targets with an fs laser, in fact, have not permitted one to detect the high energy of the high charge states of the gold ions[1]. The results presented in this paper confirm, in fact, that protons can be accelerated at high kinetic energy because they are effectively subjected to the maximum electric field developed in the nonequilibrium plasma. However, heavy ions are not accelerated or are only weakly accelerated because they do not arrive in synchrony with the maximum electric field, which decays exponentially in times of the order of 100 fs. Just light ions, such as carbons, may be accelerated, but less with respect to protons, especially if they have high charge; heavier ions like gold ions are not accelerated due to their too high mass and too low velocity.
It is well known that the 2D simulations overestimate the maximum energy of the ions compared to 3D simulations. In our work, to take account of this effect, the intensity of the laser in the simulation was chosen half that of the experiment (4 × 10¹⁸ W=cm2 the employed intensity in
simulation vs 8 × 10¹⁸W=cm2real intensity in the
experi-ment) because of the reduced degrees of freedom. However, our model starts from an assumption about the length and shape of the preplasma. A preplasma of 80 μm long is assumed. It is known that the change of the shape or size of the preplasma produces variations in the final energy of the accelerated particles[24]. In this work, the modeling done on the preplasma has allowed us to obtain the maximum energy observed experimentally and to fit the experimental spectrum.
Work is in progress in order to develop a 3D PIC simulation despite the calculation difficulties it provides.
PIC simulations correlated to the experimental measure-ments has permitted us to plot the different ion contribu-tions to the TOF spectrum, taking into consideration their angular emission distribution and their detection through the little SiC detector placed along the normal to the target surface direction.
PIC simulation determinates an electrical field driving the acceleration of about 1.75 MeV, in good agreement with the 1.8 MeV measured by the TOF spectrum. This result confirms that the electron density time and space evolution predicted by PIC can be correct and that the high electric field duration is of about 100 fs and localized at about 1-μm distance from the rear target surface.
Carbon ions, instead, arriving at this distance after the protons, find a lower electric field value and thus are less accelerated, proportionally to their charge state.
PIC has permitted also to determine the plasma temper-ature of about 300 keV, in good agreement with theoretical previsions, and has proposed a Boltzmann electron and ion energy distributions with a cutoff at the maximum electric field of their acceleration.
Actually, works are in progress for other types of targets to compare again the TOF spectra with PIC simulations to test the time and spatial kinetics of collisional plasma for other types generated by an fs laser at high intensity and high contrast.
ACKNOWLEDGMENTS
Many thanks to Dr. M. Rosinski and P. Parys of IPPLM of Warsaw (Poland) for the support given to this paper and for the assistance during the TOF spectra acquisition at their laboratory. Many thanks to Dr. M. Cutroneo and A. Torrisi of Nuclear Physics Institute of Rez (Czech Republic), which have collaborated on the measurements of the TOF using SiC at Warsaw. This research was supported by the CANAM infrastructure LM2015056, GA, GACR No. P108/12/G108 and GACR 16‐05167S.
[1] L. Torrisi, M. Cutroneo, M. Rosinski, J. Badziak, P. Parys, J. Wołowski, A. Zaraś-Szydłowska, and A. Torrisi, Near 3 MeV Protons from TNSA fs Laser irradiating advanced targets, Contribution to Plasma Physics 59, e201800127 (2019).
[2] L. Torrisi, M. Cutroneo, A. Torrisi, M. Rosinski, A. Zaras-Szydlowska, and P. Parys, Investigation of the effect of plasma waves excitation on target normal sheath ion acceleration using fs laser-irradiating hydrogenated struc-tures, Contribution to Plasma Physics 59, e201900029 (2019).
[3] V. Malka, J. Faure, Y. A. Gauduel, E. Lefebvre, A. Rousse, and K. T. Phuoc, Principles and applications of compact laser-plasma accelerators,Nat. Phys. 2008, 4, 447.
[4] M. Borghesi, Laser-driven ion acceleration: State of the art and emerging mechanisms,Nucl. Instrum. Methods Phys. Res., Sect. A 740 , 6 (2014).
[5] K. Bennett, C. Brady, H. Schmitz, C. Ridgers, T. Arber, R. Evans, and T. Bell, Users Manual for the EPOCH PIC codes (University of Warwick, Poland, 2014),http://kfe.fjfi .cvut.cz/∼valenpe7/files/12VUIF/epoch_user-4.3.pdf. [6] A. Zaraś-Szydłowska, J. Badziak, M. Rosiński, J.
Makowski, P. Parys, M. Piotrowski, L. Ryć, and J. Wołowski, High power laser laboratory at the institute of plasma physics and laser microfusion: Equipment and preliminary research,Nukleonika 60 , 245 (2015). [7] L. Torrisi, L. Silipigni, and M. Cutroneo, Radiation effects
of IR laser on graphene oxide irradiated in vacuum and in air,Vacuum 153, 122 (2018).
[8] L. Torrisi, M. Cutroneo, V. Havranek, L. Silipign, B. Fazio, M. Fazio, G. Di Marco, A. Stassi, and A. Torrisi, Self-supporting graphene oxide films preparation and characterization methods,Vacuum 160 , 1 (2019).
[9] M. Cutroneo, P. Musumeci, M. Zimbone, L. Torrisi, F. La Via, D. Margarone, A. Velyhan, J. Ullschmied, and L. Calcagno, High performance SiC detectors for MeV ion beams generated by intense pulsed laser plasmas, J. Material Research 28 , 87 (2012).
[10] Ashland, Gafchromic HD-V2, http://www.gafchromic .com/documents/gafchromic-hdv2.pdf.
[11] J. Ziegler, SRIM-The stopping and range of ions in matter,
http://www.srim.org/.
[12] T. D. Arber, K. Bennett, C. S. Brady, A. Lawrence-Douglas, M. G. Ramsay, N. J. Sircombe, P. Gillies, R. G. Evans, H. Schmitz, and A. R. Bell, Contemporary particle-in-cell approach to laser-plasma modelling,Plasma Phys. Controlled Fusion 57, 113001 (2015).
[13] J. Derouillat, A. Beck, F. P´erez, T. Vinci, M. Chiaramello, A. Grassi, M. Fl´e, G. Bouchard, I. Plotnikov, N. Aunai, J. Dargent, C. Riconda, and M. Grech, Smilei: A collaborative, open-source, multi-purpose particle-in-cell code for plasma simulation,Comput. Phys. Commun. 222, 351 (2018). [14] S. Eliezer, The Interaction of High-Power Lasers with
Plasmas (IOP, Bristol, 2002).
[15] J. Psikal and M. Matys, Dominance of hole-boring radiation pressure acceleration regime with thin ribbon of ionized solid hydrogen,Plasma Physics and Controlled Fusion, 60 , 044003 (2018).
[16] L. Torrisi, M. Cutroneo, and J. Ullschmied, TNSA and ponderomotive plasma production in enriched carbon polyethylene foils,Phys. Plasmas 24, 043112 (2017). [17] L. Laska, K. Jungwirth, J. Krasa, E. Krousky, M. Pfeifer,
K. Rohlena, A. Velyhan, J. Ullschmied, S. Gammino, L. Torrisi, J. Badziak, P. Parys, M. Rosinski, L. Ryc, and J. Wolowski, Angular distributions of ions emitted from laser
plasma produced at various irradiation angles and laser intensities,Laser Particle Beams 26, 555 (2008). [18] M. Roth and M. Schollmeier, in CERN Proceedings
of Accelerator School: Plasma Wake Acceleration, Geneva, Switzerland, 2014, edited by B. Holzer, Report No. CERN-2016-001 (Springer International Publishers, New York, 2016), 231–270, https://doi.org/10.5170/ CERN-2016-001.231.
[19] A. M. Elsied, N. C. Termini, P. K. Diwakar, and A. Hassanein, Characteristics of ions emission from ultrashort laser produced plasma, Scientific Reports 6, 38256 (2016).
[20] L. Torrisi, Coulomb-Boltzmann-shifted distribution in laser-generated plasmas from 1010 up to 1019W=cm2
intensity,Radiat. Eff. Defects Solids 171, 34 (2016). [21] L. Torrisi, Large-scale studies of ion acceleration in
laser-generated plasma at intensities from 1010W=cm2 to
1019 W=cm2,Optics Laser Technology 99, 7 (2018).
[22] M. Passoni, A. Sgattoni, I. Prencipe, L. Fedeli, D. Dellasega, L. Cialfi, I. W. Choi, I. J. Kim, K. A. Janulewicz, H. W. Lee, J. H. Sung, S. K. Lee, and C. H. Nam, Toward high-energy laser-driven ion beams: Nanostructured double-layer tar-gets,Phys. Rev. Accel. Beams 19, 061301 (2016). [23] L. Torrisi, M. Cutroneo, A. Torrisi, L. Silipigni, G. Costa, M.
Rosinski, J. Badziak, J. Wołowski, A. Zaraś-Szydłowska, and P. Parys, Protons accelerated in the target normal sheath acceleration regime by a femtosecond laser, Phys. Rev. Accel. Beams 22, 021302 (2019).
[24] P. Varmazyar, S. Mirzanejhad, and T. Mohsenpou, Effect of pre-plasma on the ion acceleration by intense ultra-short laser pulses,Laser Particle Beams 36, 1 (2018).