PHD IN BEHAVIORAL NEUROSCIENCE
PhD Program in Neuroscience - XXXI Cycle
Curriculum: Behavioral Neurophysiology
PREMOTOR CORTEX ENCODING OF DYNAMIC
HAND FORCE AND MOTOR OUTPUT OBSERVATION
UNDERLYING HAND-OBJECT INTERACTION
Supervisor: Prof. Alexandra Battaglia-Mayer PhD Student: Stefano Colangeli
Summary
INTRODUCTION ... 1
MATERIALS AND METHODS ... 6
RESULTS ... 15
DISCUSSION ... 28
INTRODUCTION
Objects manipulation is a common daily action and a late achievement of evolution, which is unique to the primates lineage. It is subserved by a complex and distributed anatomo-functional system that specifies both hand configuration and force necessary to grasp and manipulate objects. Hand-object interaction has covered a prominent role in behavioral neurophysiology, raising fundamentals questions on how visuo-spatial and motor parameters are encoded and combined in the cerebral cortex.
From an historical perspective, the analysis of this function and of neural representation of movement in general was boosted by the introduction of the method, by Evarts (Evarts, 1968), of recording single cells activity from the cerebral cortex of behaving monkeys trained in specific motor tasks. The conceptual roots of this new and pioneering line of investigation were expressed in a coherent fashion ten years later by Thach (1978): “Theoretical requirements for the neural control of movement and posture, together with the motor deficits caused by ablation of the nervous system at different levels, have generated the theory that there are representations encoded in neural activity of abstract commands that govern volitional movement and posture, and that these commands descend from higher levels sequentially through adaptive stages to arrive at the muscles in a language appropriate for muscle control”.
Under this perspective, it was natural to select force as a key parameter to be represented in motor cortex (MI), since MI has a direct access to the interneurons and motoneurons of the spinal cord though the pyramidal tract and force is developed by muscles activity. Not surprisingly, in Evarts’s seminal study (1968), monkeys were trained to make flexion and extension movements at the wrist against loads that opposed or assisted movement, or to maintain postural fixation while resisting these loads. The conclusion was that neural activity of pyramidal tract neurons (PTNs), identified by antidromic stimulation at the bulbar pyramids, was related to the magnitude of force exerted by the animal, therefore to movement kinetics,
rather than to the position or displacement of the wrist, therefore to kinematics. A methodologically more advanced study, where direction, force and position were dissociated, concluded that these parameters were represented in equal fashion in M1 neural activity (Thach, 1978), without contending the crucial role of force. Relations between MI neural activity and muscle force were shown at about the same time by adopting precision grip tasks under isometric conditions, that allowed the study of force variation in absence of limb displacement, (Hepp-Reymond, 1978), and by Cheney and Fetz (1980), through spike-triggered averaging of EMG activity, that allowed to distinguish MI cells with monosynaptic connections with spinal motoneurons from those lucking such connections. The important conclusion of this study was that only M1 cells with monosynaptic connections to motoneurons encoded static force during a wrist flexion/extension task, therefore only layer V cortico-motoneuronal cells.
All above mentioned studies were based on tasks were force variation was confined at a single joint and spatial dimension, be it wrist flexion-extension, forearm supination-pronation, thumb-index finger opposition, therefore unable to fully capture the potential contribution to neural activity of the kinematic parameters, such as position direction, and velocity. Limb kinetics must be specified for all movements, and it representation in neural activity can only be appreciated in more naturalistic conditions, when movement unfolds over different spatial dimensions, such as hand reaching to visual targets.
Indeed, when for the first time hand movements were studied in a two-dimensional (2-D) space, it was found that cell activity in MI (Georgopoulos, et al., 1982) and posterior parietal area 5 (Kalaska et al., 1983) was related in an orderly fashion to the direction of reaches, since it was maximal in a preferred direction and decreased for directions further and further away from it. Most important, the broad directional tuning of MI cells suggested that reach direction could only be encoded through a population code, rather than by single cell activity (Georgopoulos, et al., 1983), given the broad, therefore ambiguous, directional tuning of individual neurons. In
addition, in both MI and area 5 cell activity was monotonically tuned to arm position in space (Georgopoulos et al., 1984; for a recent review, see Battaglia-Mayer, 2019).
Since force is a vector defined by its magnitude and direction, these results opened the way to further analysis of the relationships between cell activity, force and direction in the cerebral cortex. In this context, an important contribute came from studies by Kalaska’s group (Kalaska and Hyde, 1985; Kalaska, et al., 1989), who have extended the analysis of the neural encoding of static force to the direction of 2-D multi-joint arm reaching. The conclusion of these studies was cell activity in MI was broadly tuned to the direction of static force.
However, the most compelling results came from an elegant and imaginative study (Georgopoulos et al., 1992) where monkeys were trained to exert 2-D directional forces under isometric conditions in presence of a constant bias force that mimicked the presence of gravity. This approach allowed to study the relationships between M1 cell activity and different forces, that were dissociated: 1) the amount of force exerted by the monkey, decomposed into a static and dynamic components, with the first equal and opposite to the bias force, the second corresponding to the net force; 2) the net force, which is necessary to move the hand in the desired direction against the bias force, therefore corresponding to the dynamic force; 3) the change of force over time. The result of this study was that population activity in M1 varied with the direction of the dynamical force and with the force change over time, but not with the amount of force exerted by the monkey. The authors of this study suggested that the force exerted by the subject and its magnitude could be encoded at the spinal level, thanks to the convergence of different supraspinal and propriospinal inputs.
The extension of these studies to posterior parietal cortex (Kalaska et al., 1990; Sergio et al., 2005; Hamel-Paquet et al., 2006) supported the view that while MI output correlated better with movement kinetics, parietal cortex operations were more concerned with encoding movement kinematics. Therefore, these last studies were in line with the classical hierarchical model of
cortical control of movement, for which high-order areas, such a parietal cortex, specified movement kinematics, while downstream areas, such as MI, movement kinetics.
In the meanwhile, an emerging perspective was that the encoding of movement kinematics and kinetics were encoded in a parallel fashion in different areas of the parieto-frontal system, also thanks to a recursive signaling sustained by reciprocal cortico-cortical connections (Johnson, et al., 1996; Caminiti, et al., 1996). This view was also supported by the description of different parallel cortico-spinal system originating, beyond MI, from all premotor areas projecting to it (see Dum & Strick, 1991, Lemon, 2008) and, as recently shown, from posterior parietal cortex (Rathelot, et al., 2017; Innocenti, et al., 2018) as well. This perspective received additional support from human fMRI studies (Ehrsson, et al., 2001).
Moreover, a case-report of a parietal patient studied in Battaglia-Mayer’s lab (Ferrari-Toniolo, et al., 2014) showed a defective control of the direction of the dynamic hand force application over time, in absence of significant reduction of force magnitude. The results of this study prompted a full reassessment of the relationships between neural activity and dynamic force in posterior parietal cortex of monkeys (Ferrari-Toniolo, et al., 2015). The result was that hand dynamic force and it change over time, but not the amount of force exerted by the subject, are significantly encoded in the activity of cells in macaque parietal area (PFG). Moreover, since PFG is also the parietal node of the mirror system (see Rizzolatti et al. 2014), in Ferrari-Toniolo et al. experiment, cell activity was also studied during trials in which monkeys merely observed on a screen the result of their hand force application, as motion of a visual cursor on the screen. It was therefore possible to determine that the activity of most cells in area PFG was modulated by the hand force necessary to implement the desired target motion, reflecting an inverse model, rather than by the intended motion of the visual cursor (forward model). Since then, different studies have confirmed the crucial involvement of parietal cortex in encoding hand force during grasping (Davare et al., 2007; Neely et a., 2013; Keisker et al., 2010; Intveld et al., 2018). Today, despite 50 years of behavioral neurophysiological studies on the relationships between
cell activity and force in monkeys, only few studies available on the encoding of hand force in PMd (Werner et al., 1991; Hepp-Reymond, et al., 1994; 1999; Xiao et al., 2006), in spite of its direct connections with both MI and the motor output centers of the spinal cortex (see Caminiti et al., 2017). Furthermore, since the discovery of the mirror system (Gallese, et al., 1996; Rizzolatti, et al., 1996), an increasing number of studies has shown action observation-related activity in several areas of the parieto-frontal system, including MI (Tkach, et al., 2007; Dushanova and Donoghue, 2010; Hatsopoulos and Suminski, 2011) and PMd (Cisek & Kalaska, 2004; Tkach et al., 2007). The congruence between action observation- and execution-related activity in PMd has been execution-related to covert mental rehearsal of action, to motor learning and communication, with implications for the development of neurally-controlled prosthetic devices (Suminski et al., 2009). However, it remains to be determined whether PMd cells modulated by action observation also encode motor parameters, such as dynamic hand force, and/or his observable consequences on the action space.
Starting from this background, the aim of the present work is to understand how PMd encodes hand-force and the observation of its output, and how these processes interact.
To this objective, three macaque monkeys were trained in a “hand-force” condition, which required to move a visual cursor on a screen toward eight peripheral targets by exerting a force on an isometric joystick, in absence or presence of an opposing force field. Monkeys were also trained in an “observation” task, in which they observed the result of their action, in the form of motion of a visual cursor on a computer screen. This approach combines in a single experiment isometric action performance and observation of its consequences in the external world, in a way that allows the study of PMd encoding of action parameters by dissociating the representation of inverse and forward models of action, as done in posterior parietal cortex by Ferrai-Toniolo et al. (2015). This also allows a direct comparison of the relative contribute of different parietal and fontal areas in encoding hand force and its change over time in the parieto-frontal system.
MATERIALS AND METHODS
Animals and surgical proceduresThree male rhesus monkeys (Macaca mulatta; Monkey 1 (S); body weight 7.5 kg. Monkey 2 (K); body weight 8.5 kg. Monkey 3 (D); body weight 12.3 kg) were used. All surgical procedures were performed under aseptic conditions. The animals were pre-anesthetized with ketamine (10 mg/kg, i.m.) and anesthetized with a mix of oxygen/isoflurane (1%–3% to effect). A circular recording chamber (18 mm inner diameter) was mounted over the dorsal premotor cortex (PMd, area 6), to allow neural recording from a region corresponding to area F2 ((Matelli, Luppino, & Rizzolatti, 1985) (Matelli, Luppino, & Rizzolatti, 1991) (see Fig 1B). At the end of the experiment, for a post-mortem examination, the dura was opened, and reference pins were inserted at known chamber coordinates, to delimitate the recording region and facilitate recognition of the entry point of microelectrode penetrations and their reconstruction relative to key anatomic landmarks, such as the central and the arcuate sulcus. Animal care, housing, and surgical procedures were in conformity with the European (Directive 63-2010 EU) and the Italian (DL 26-2014) legislative decree on the use of non-human primates in scientific research.
Experimental apparatus, behavioral control, and tasks
During recording session each animal was placed in a darkened, sound-attenuated chamber and seated on a primate chair, with its head fixed in front of a 40-inch monitor (100 Hz, 800 × 600 resolution, 32-bit color depth; monitor-eye distance 150 cm) and was instructed to control a visual cursor on the screen by applying a force pulse on an isometric joystick (ATI Industrial Automation), which measured the force applied with the hand in two dimensions, with a sampling frequency of 1000 Hz. During the experiment, monkey S and monkey K used the right arm, whereas monkey D used the left arm, while their other arm was gently restrained.
Monkeys were trained in two main tasks: the Isometric (Iso) and Observation task (Obs) task. (see Fig 1A). In addition, during selected recording sessions, Monkey D was exposed, unexpectedly, to a new task condition, Re-Calibration (Re-Cal; see below for details) which required a change of force output to guide the visual cursor in the desired location, without prior training. Finally, an eye saccade task (Sac, Fig.1A) was used as a control condition, to evaluate the influence of eye movement-related signals on the recorded neural activity.
Isometric hand condition (Iso)
In a classical center-out paradigm, a central target [4 degrees of visual angle (DVA) in diameter] and a cursor (0.6 DVA in diameter) were first presented on the screen (see Fig. 1A). The cursor was located in proximity to the central target with a small offset separation from its border, corresponding approximately to 2 DVA. By exerting a force on the joystick (0,8 N), the animal had to move the cursor within the central target, and to keep it there by exerting a constant static
force for a given control time (center holding time, CHT, 500–600 ms), at the end of which one
of eight peripheral visual targets (PT) was presented (8 DVA eccentricity). After a reaction time (RT; upper limit 800 ms), by applying a dynamic force for a given time (dynamic force time, DFT, upper limit 2000 ms), the animal moved the cursor from the center to the lighted target and maintained it there for a variable target-holding time (THT, 50–100 ms), which for its short duration reflected the achievement of the action end-point. It is known from oculomotor studies that this epoch rather than reflecting the eye position of the end of a saccade, reflects its recent history (Genovesio, Brunamonti, Giusti, & Ferraina, 2007). The reward, consisting in drops of water or fruit juice, was given if each trial was performed within the pre-specified temporal limits. It is worth stressing that, to move and bring the visual cursor to the target, the animal applied a proper force amount in given directions, in absence of joint displacement. Typically, a force pulse of 1N resulted in a cursor displacement of 2.5 DVA. Therefore, the animal had to increment the hand force exerted on the joystick of ∼3.2 N to bring the cursor from the center to the peripheral target (8 DVA eccentricity). In this task, the animals were free to move their eyes without any spatial and temporal constraint. A minimum of 64 trials were collected, in this task condition, since the animals performed at least eight replications in each movement directions.
Observation task (Obs)
Intermingled with the trials of the Iso task, in 50% cases Obs trials were presented, with temporal structure similar to that of the Iso task (see Fig. 1A). During the CHT (500–600 ms), the animal moved its cursor from the offset position inside the central target; a peripheral target (PT) was then presented, and after a variable time, that on average was equal to the RT seen in the Iso, a visual cursor was presented and moved toward the PT, and remained within the PT for a variable time (CPT, 50–100 ms). The cursor’ motion was similar to that used by the animal in the Iso trials. In fact, its trajectories corresponded, after a random selection, to those collected during the execution of isometric task. During the time of cursor’s motion (CMT), the animal, who was required to hold its own cursor on the central target for the entire duration of the trial to get its reward, observed the moving cursor, as shown by the analysis of eye movement behavior, which had no restrictions during the Obs trials. As in the Iso task, a total of a minimum of 64 Obs trials were collected during each recording session (8 replications x 8 movement directions).
Recalibration task (Re-Cal)
In 30 sessions, to dissociate the information about the cursor displacement (position and direction) and the amount of force exerted by the animal, we have introduced a variation of the
Iso task. In this new type of trials (Re-Cal), the ratio between cursor’s displacement on the
screen and the force exerted on the joystick, was reduced of 1/2, so that a force pulse of 1N determined a cursor displacement of 1.25 DVA. The animal was therefore required to recalibrate its hand force output in the force task, to compensate for the unexpected perturbation. After adaptation, the perturbation was removed during a “Wash-out” session, to allow the animal to return to its basic pre-perturbation performance (i.e., Iso task). In these sessions, the neural activity was recorded in the three consecutive blocks of Iso, Re-Cal and
Saccade task (Sac)
To evaluate the influence of eye-related signals on the neural activity recorded during the Iso,
Re-Cal, and Obs, a saccadic eye movement task was used as control. The monkeys fixated a
white central target for a variable center-holding time (CHT, 700–1000 ms). Then, one out of eight possible peripheral targets was presented at 45° angular interval, on a circle of 8 DVA radius. To obtain a liquid reward, the monkey was required to make a saccade to the target and keep fixation there for a variable eTHT (300–400 ms). Upper limit for eye reaction time (eRT) and movement time (eMT) were both set at 800 ms. In all task conditions, eye movements were sampled (at 220 Hz) through an infrared oculometer (Arrington Research) and stored together with joystick force signals and key events, which were sampled at 1 kHz. The National Institutes of Health-funded software package REX was used to control stimuli presentation and to collect eye movement and hand force data.
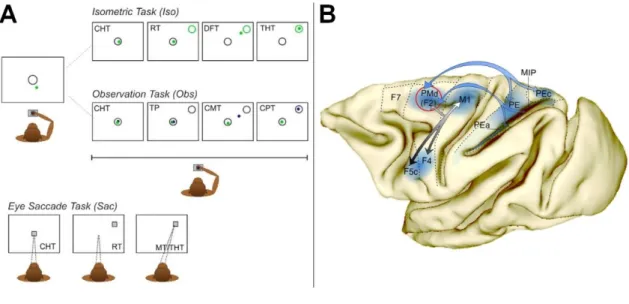
Figure 1. Apparatus, tasks, and recording sites. A. The monkey controlled a cursor (green dot) on a screen, by
applying a force pulse on an isometric joystick, to perform two types of intermingled trials of the Iso and Obs tasks. All trials began with the presentation of a circle on the center of the screen (A, leftmost panel). The animal had to move the cursor from its offset position within the central target and keep it there by exerting a static force for a variable CHT. In the Iso trials, a peripheral green target was presented in one of eight positions, and within a given RT the monkey had to guide the cursor toward it, by exerting a dynamic force of appropriate magnitude and direction (DFT) and hold it there for a short target holding time (THT). In the Obs trials, the animal kept his cursor on the central target, and at the end of the CHT, a peripheral blue target was lighted. The animal was required to observe the movement of a second cursor (blue dot) toward the target, while maintaining his own cursor at the center. In the Sac task, the monkey performed saccades to a visual target presented in one of eight locations. The animal used the contralateral arm to the recording chamber. B, Recording site in area PMd (F2) of Monkey S, Monkey K and Monkey D (red circle). Arrows indicate the connections of the area of recording with motor cortex, ventral premotor cortex and posterior parietal cortex. F7, rostral dorsal premotor cortex. F2, caudal dorsal premotor
cortex. F5c, the caudal part of the rostral ventral premotor cortex. F4, caudal ventral premotor cortex. M1, primary motor cortex. PEa, PE, PEc, superior parietal lobule. MIP, medial intraparietal cortex.
Behavioral analysis
The force applied by the animal (subject force) was measured through an isometric joystick. At the beginning of each trial, an offset was applied to the cursor’s position, requiring the subject to exert a force (static force) to bring it into the central target, and to keep it there during the CHT. To move the cursor from the center to the peripheral target, the force had to be dynamically changed in amplitude and direction. Therefore, the vector describing the force exerted by the subject on the joystick can be decomposed in a static and a dynamic component, according to the relation: subject force = static force + dynamic force.
The instantaneous force change during the cursor motion was defined at each time point as the difference vector between the force at a given 10 ms time bin t and the force at the previous time bin as follows:
instantaneous force change (t) = force (t) – force (t – 1)
where “force” can equally represent either the subject force or the dynamic force, being the static force component constant in time. Given that the cursor position on the screen was proportional to the applied force, the instantaneous force change was proportional to the displacement of the cursor between two consecutive time bins and, consequently, to its instantaneous velocity on the screen.
The force signal was low-pass filtered (FIR filter, cut frequency 30 Hz, order 100) and down-sampled to 100 Hz.
The RT was defined as the time elapsing from the presentation of peripheral target to the onset of the cursor’s motion, whereas the DFT was defined as the time from the cursor’s motion onset to its entry into the peripheral target, thus corresponding to the entire cursor’s motion time. The cursor motion onset was determined as the first deviation of cursor velocity exceeding 3 SDs of the signal calculated around target onset (from 50 ms before to 50 ms after target onset time), for at least 90 ms.
Electrophysiological recordings
Neural activity from single cells was recorded extracellularly through a 5 channels electrode matrix (Thomas Recording) equipped with quartz-insulated platinum-tungsten fibers (80 μm diameter, 0.8–2.5 MΩ impedance). Electrodes were equidistantly disposed in a linear array with inter-electrode distance of 0.3 mm and inserted through the intact dura into the cortical tissue. The raw signal was amplified, digitalized, and optically transmitted to a digital signal-processing unit (RA16PA-RX5-2, Tucker-Davis Technologies) where it was stored together with the key events at 24 kHz. The raw signal was also filtered in actual time with a digital biquad filter (0.3–5 kHz), to obtain a threshold-triggered, window-discriminated single unit activity (SUA). SUA data were further discriminated offline.
Analysis of neural data
Single-unit activity.
To characterize the firing rate of a single unit in the different tasks and directions, the spike density function (SDF) during each trial was first calculated. The SDF, obtained by convolving the spike train data with a Gaussian kernel (30 ms width, 1 ms resolution), was then averaged over successive 10 ms time bins, thus obtaining the temporal evolution of the firing frequency with a sampling rate of 100 Hz. The mean firing frequency for the epochs of interest (RT, DFT) was calculated as the averaged SDF across replications during each epoch. A two-way ANOVA (Factor 1: epoch; Factor 2: direction) here referred as ANOVA ‘ED’ was used to assess significant modulation of cell activity within a particular epoch, relative to CHT (p < 0.05 for any factor or for their interaction). A further two-way ANOVA (Factor 1: condition; Factor 2: direction), here referred as ANOVA ‘CD’, was used to test significant (p < 0.05, for Factor 1 or for the interaction) differences of cell activity across different tasks.
Cells were considered as modulated when a statistically significant modulation (2w ANOVA,
p < 0.05, see above) of the firing rate between the control time (CHT) and at least one epoch of
Population activity
The population SDF was obtained by first standardizing each unit’s SDF across all task conditions. The average activity and its standard error (SE) across all units was then computed for each bin, thus obtaining the temporal evolution of the standardized population SDF. To compare the population activity across two conditions (e.g., Iso vs Re-Cal) during epochs of interest, the average value of each unit’s standardized SDF was computed. The resulting activities were then compared by means of a two-sample t-test (p < 0.05).
Directional tuning of single cells
The directional tuning of cell activity was computed through a nonlinear fitting procedure. A truncated cosine function was fitted into the experimental mean firing rates, calculated during the epochs of interest (e.g., RT, DFT, THT), using the least square method. The fitting model was described by the following directional tuning function as follows:
𝐹(𝑑) = { 𝐴 + 𝐵 cos(𝛼(𝑑)) 𝐴
|𝛼| ≤ 𝜋 |𝛼| > 𝜋
where F is the firing rate (in spikes/sec) as a function of the direction of movement (d) expressed in radians. The argument of the cosine function, α(d) = (d – PD) ∙ π/TW, contains two fitting parameters: the preferred direction (PD) expressed in radians, and the tuning width (TW, radians). The other parameters resulting from the fitting procedure (A and B) are linked to the tuning gain (TG) and to the baseline firing rate (BF) by the relations: TG = 2B and BF = A - B. The statistical significance of the directional tuning was assessed using a bootstrap procedure, to test whether the degree of directional bias of the tuning curve could have occurred by chance (Georgopoulos, Kettner, & Schwartz, 1988). The parameter used in this procedure was the tuning strength (TS), defined as the amplitude of the mean vector expressing the firing rate in polar coordinates (Crammond & Kalaska, 1996). This quantity represents the directional bias of the firing rate: TS = 1 identifies a cell that only discharges for movements in one direction, whereas TS = 0 represents a cell with uniform activity across all directions (Batschelet, 1981). A shuffling procedure randomly reassigned single-trial data to different target directions, and the TS was determined from the shuffled data. This step was repeated 1000 times, obtaining a bootstrapped distribution of TS, from which a 95% (one tailed) confidence limit was evaluated. A cell was labeled as directionally- tuned in a specific epoch if the TS value calculated from the original unshuffled data was higher than the computed confidence limit (p < 0.05).
Population vector analysis
To study the directional correspondence between the overall population activity and the behavioral output as a function of time, a population vector (PV) analysis was performed. The analysis was performed on the neural and behavioral data from 500 ms before to 500 ms after the cursor’s motion onset.
The population vector 𝑃𝑉⃗⃗⃗⃗⃗ for a given target direction d at a given time bin t, was calculated in standard fashion as follows:
𝑃𝑉
⃗⃗⃗⃗⃗ 𝑑(𝑡) = ∑ 𝑤𝑑𝑖(𝑡) ∙ 𝑖
𝑃𝐷 ⃗⃗⃗⃗⃗ 𝑖
where 𝑃𝐷⃗⃗⃗⃗⃗ 𝑖 is the preferred direction of the i-th cell and 𝑤𝑑𝑖(𝑡) is its weighted discharge rate during movements toward targets in direction d, at time t. The PDs were obtained from neural activity collected during DFT of Iso, Re-Cal, and Wash-out tasks.
The weight function for a given cell was defined as follows:
𝑤𝑑(𝑡) = 𝐹𝑅𝑑(𝑡) − 𝐹𝑅𝑎𝑣𝑔(𝑡) 𝑅(𝑡)
where 𝐹𝑅𝑑(𝑡) is the firing rate of that cell at time t for movements toward direction d, 𝐹𝑅𝑎𝑣𝑔(𝑡) is its discharge rate averaged over all directions at each time bin (t), and R(t) = (max(𝐹𝑅𝑑(𝑡)) -
min(𝐹𝑅𝑑(𝑡))/2 represents the half-range of its activity across directions (Georgopoulos, Kettner, & Schwartz, 1988). By using this weight function, the contribution of each cell to the population vector is normalized, ranging from - 1 to 1 for symmetrically distributed firing rates. The population of cells used to compute the PV included only the units that showed a significant directional tuning (see above) during the DFT of the center-out task.
Decoded trajectories of cursor motion
A neural representation of the applied force in time, hence of the resulting cursor trajectory, based on the information encoded by the population vector, was constructed following two different hypotheses. As a first hypothesis, the 𝑃𝑉⃗⃗⃗⃗⃗ was assumed to encode the dynamic force, that is, the force to be exerted by the animal to bring the cursor from the center to the periphery. Therefore, a representation of the applied force at each time bin was obtained by placing each instantaneous population vector 𝑃𝑉⃗⃗⃗⃗⃗ (𝑡) at the center of the workspace. As a second hypothesis, the 𝑃𝑉⃗⃗⃗⃗⃗ was assumed to encode the instantaneous force change (i.e., the infinitesimal increment of force applied at any given time). In this case, a representation of the predicted force exerted on the joystick was obtained by connecting tip-to-tail all the 𝑃𝑉⃗⃗⃗⃗⃗ (𝑡), with t starting at the movement onset time (Georgopoulos, Kettner, & Schwartz, 1988). To quantify the similarity between the “actual” cursor trajectory resulting from animal force application and the “decoded” trajectory reconstructed from the PV analysis, a vector time series were first constructed from each of the trajectories to be compared, with elements representing the displacement between two consecutive points.
RESULTS
Neural activity related to dynamic hand force production and observation the resultant visual cursor’s motion
The electrical signs of the neural activity of 643 cells was recorded from area PMd from three macaque brains, and studied in three different tasks: Iso, Obs and Sac. The proportion of cells with neural activity significantly modulated and directionally tuned in the above-mentioned tasks is shown in Figure 2.
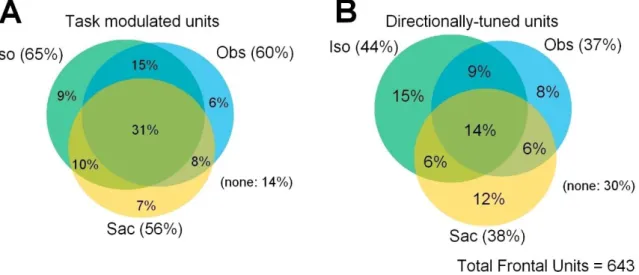
Figure 2. Venn diagrams showing the percentages of cells significantly modulated (A) and directionally tuned (B)
in the isometric force (Iso), observation (Obs) and Eye Saccade (Sac) tasks. The “none” group shows the proportion of cells that were not modulated (A) or directionally tuned (B) in any condition. In A, modulation was assessed through a 2w ANOVA (p < 0.05), while directional tuning was statically evaluated through a bootstrap technique (see Methods for details)
It can be seen that a similar proportion of cells was modulated in Iso (65%) and Obs (60%) tasks (Figure 2A). Furthermore, we found that many cells (56%) were modulated in the Sac task. Similar results were obtained from the analysis of the directional modulation of cell activity (Figure 2B).
Since we were interested in studying the neural encoding of hand force, the following analyses were performed on a dataset (n = 283) obtained by excluding saccadic-related cells.
Figure 3 illustrates the activity of three typical task-related neurons (Fig. 3 A, B, C, upper panels) that are strongly representative of our dataset.
Figure 3. Neural activity of three typical cells recorded from area PMd during the Iso and Obs tasks. A, B, C.
Examples of cells significantly modulated (ANOVA, p < 0.05) only in the Iso task (A), only in the Obs task (B), or in both conditions (C). In the upper panels, the neural activity is displayed in the form of raster plots with superimposed SDFs in the eight different directions of the task adopted. In the Iso and Obs tasks, activity is aligned to the onset of hand ramp force (0 ms; green vertical line). Gray vertical lines before and after the onset of DFT indicate target presentation and end of THT, respectively, while the red vertical line indicates cursor’s entry on the target. The lower panels display the behavioral data collected during recording the cell activity shown in upper panels: dynamic force pulses (thin curves), force velocity profile (thick cur\ves) during the Iso and Obs tasks.
Figures 3A and 3B show the activity of two typical cells significantly modulated in only one of the two behavioral conditions. The Iso-related cell (Fig. 3A) was significantly modulated during the DFT and during the static holding of the cursor on the peripheral target (ANOVA ‘ED’,
pepoch < 0.001, ANOVA ‘CD’, pcondition < 0.001) and not during the Obs condition (ANOVA
‘ED’, pepoch = 0.418). The Obs-related cells (Fig. 3B) was significantly modulated during the
DFT (ANOVA ‘ED’, pepoch < 0.001, ANOVA ‘CD’, pcondition < 0.001) but not during the Iso
condition (ANOVA ‘ED’, pepoch = 0.206). However, the majority of the cells of our dataset was
not modulated exclusively in one task (Fig. 2). In Fig. 3C we report the activity of an example cell with significant modulation and directional tuning in both Iso and Obs tasks, particularly during DFT epoch (Iso condition: ANOVA ‘ED’, pepoch < 0.05, ANOVA ‘CD’, pcondition < 0.05;
Obs condition: ANOVA ‘ED’, pepoch < 0.001, ANOVA ‘CD’, pcondition < 0.01). It is worth
noticing, however, that this cell modulation and directional tuning, in the Iso task appeared, after the Target Onset (Ton), i.e. during the reaction-time (RT). This pre-movement activity
present in the Iso condition, disappeared when the animal was instructed to only observe the simulated motion of the visual cursor (i.e. Obs condition).
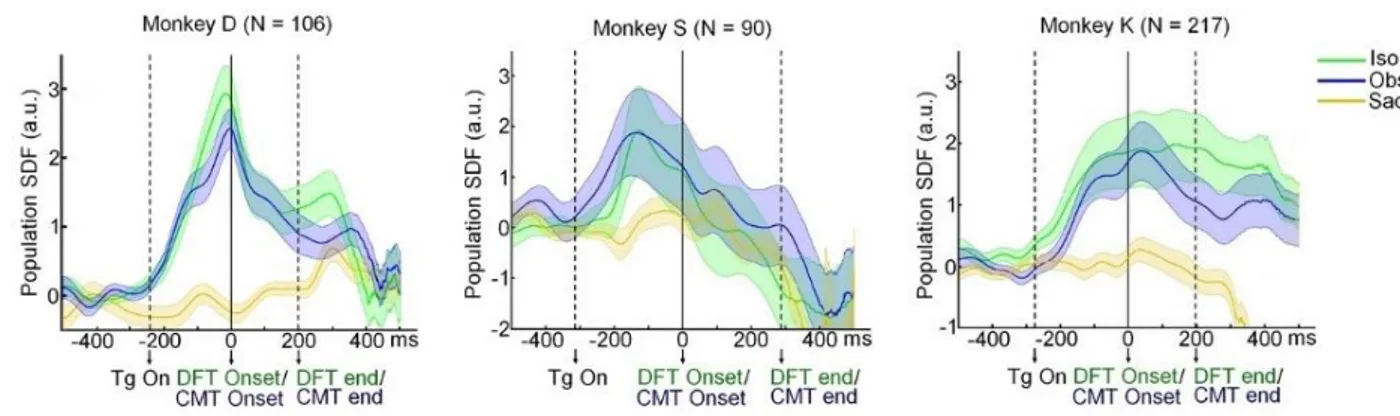
We then analyzed the temporal evolution of the neural activity in the Iso and Obs task, at population level. To this aim we computed the population SDF, by averaging the SDFs of the cells belonging to each of the three datasets (Monkey D, monkey S, Monkey K). We found that in all animals, the population activity recorded in the Iso task was not significantly different (two-sample t test; p < 0.05) to that studied during the Obs task (Fig. 4). This was true for the entire duration of the tasks, namely during the RT, DFT and THT.
Figure 4. Mean standardized population SDF (±SE) relative to the Iso (green), Obs (blue), and Sac (yellow) tasks
in the three monkeys (N, number of cells). Neural activity is aligned to the onset of ramp force.
Therefore, even if the two behavioral conditions differed considerably, the population activity during the DFT was virtually identical to that of the Obs condition, in which the monkeys had just to observe the movement of a cursor while exerting a small static force to keep the cursor in the central target of the screen.
Modulation of dynamic hand force by changing the force field: adaptation to a new task dynamics
The activity of a group of 106 cells (selection based on firing rate > 10 Hz) was studied in a task which required the application of a different amount of force to bring the cursor from the center to the peripheral target (Fig. 5A). The cell activity was therefore studied in a sequence of three blocks, characterized by different values of the ‘force scaling factor’, representing the ratio between the force to be applied and the cursor displacement. The session started with a block of 64 regular Iso trials, at the end of which the animal had to perform the isometric task
in a new force condition, referred as Re-Cal, during which the new value of the force scaling factor, imposed to the animal an unexpected remapping of the force output on the cursor’s motion. The monkey had to readjust the hand force exerted on the joystick, by doubling it, in order to bring the cursor to the desired location.
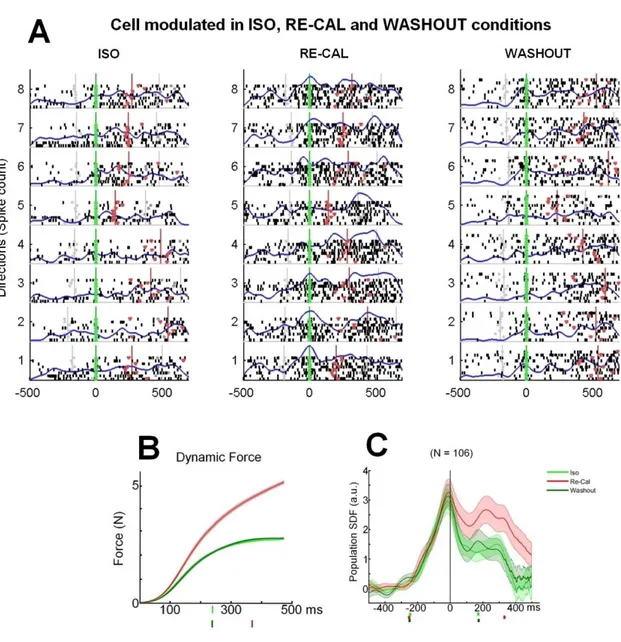
Figure 5. Effects of force recalibration on premotor cells. A, Neural activity of a typical cell recorded from area
PMd during the Iso (FR = 13,64 spikes/sec), Re-Cal (FR = 34,27 spikes/sec), and Wash-out (FR = 9,88 spikes/sec) task, displayed in the form of raster plots (dots), with the SDFs (blue curves) superimposed, in eight directions. Activity is aligned to the onset of ramp force (0 ms; green vertical line). Gray vertical lines before and after the onset of DFT indicate target presentation and the end of THT, respectively, while red vertical line indicates cursor’s entry on the target. B, Mean (±SE) amount of force exerted by the animal from the onset of its application (0 ms) to bring the cursor from the center to the peripheral target in the three tasks. The Iso and Wash-out conditions are represented in light green and dark green, respectively; the Re-Cal condition in red. C, Mean standardized population SDFs (continuous curves) and relative SE (shaded area) from cells of monkey D (N = 106). The activity is aligned to onset of force application (0 ms). The dots on x-axis before the onset of force (0 ms) represent the
mean time of target presentation. The dots after the onset of force (0 ms) represent the mean time of cursor’s arrival at the peripheral target.
The monkey adapted rapidly to the new force condition and after having executed a block of 64 successful Re-Cal trials, the activity was then re-tested in a condition, here referred as “Wash-out”, identical to the Iso task. In this block, the perturbation was removed, to allow the animal to return to the basic pre-perturbation condition of the Iso task (Fig. 5B). As it can be seen in a typical cell shown in Figure 5A (associated animal’s behavior reported in Figure 5B), during the Re-Cal task, the firing rate of cell increased significantly with respect to the Iso task and returned to the original level when retested in the Wash-out session. The first change resulted in a significant increase of the mean firing rate (2-way ANOVA pC < 0.01) during the
Re-Cal condition, occurring in the DFT. In the Wash-out condition, instead, this cell
significantly reduced its firing rate (2-way ANOVA pC < 0.01). The firing rate of this cell during the DFT did not significantly differed between Iso and Wash-out (2-way ANOVA, pC = 0.082 and interaction factor: condition direction, pCD = 0.149).
Significant changes of cell activity during force-cursor remapping condition (Re-Cal), with respect to the Iso task, similar to those described in the example reported above, were observed during the DFT in 68 out of 106 (64%) cells (2-way ANOVA; Factor 1: condition, pC < 0.05 and/or interaction factor: condition x direction, pCD < 0.05). Most of these cells, increased their firing rate when exposed to Re-Cal condition (60%, 41/68). In this group, the neural activity of 36% (15/41), collected during the Re-Cal trials, did not change during the Wash-out (2-way ANOVA; Factor 1: condition, pC > 0.05 and interaction factor: condition direction, pCD > 0.05), as if neural response retained memory of the new force-field exposure in the previous trials. However, most cells (53%, 22/41) significantly decreased their firing rate when tested in the Wash-out condition. Furthermore, only a very small amount of cells (9%) increased their firing rate across this task condition.
In order to determine how these changes were reflected in the whole population, we calculated the population SDF separately for each behavioral condition of the Task (Iso, Re-Cal and
Wash-out). The results of the three population SDFs aligned to the dynamic force onset are shown in
figure 5C, which displays a clear pattern of neural activity which reflect the changes in the dynamic force exerted on the joystick. Statistically significant differences (1-way ANOVA, Factor: condition, p < 0.05 and Bonferroni post-hoc test: Iso vs Re-Cal p = 0,014; Re-Cal vs
Iso, p = 0.049; Iso vs Wash-out, p = 0.89) were observed during the DFT, characterized by a
during which the force had to be maintained constant, in order to keep the cursor in its endpoint. These differences were absent in the RT, during which the task imposed only the application of a static, even though different, force. Therefore, on premotor cells the remapping process was not reflected during the planning phase of the upcoming action.
Directionally-tuned cells in PMd
To further investigate the coding of force in PMd cells, we studied their directional tuning properties, focusing on the same datasets used for the previous analysis on force recalibration (total number of cells, n=106). In this task condition we also found the highest number of cells with statistically significant directional tuning. This was found only during DFT, in which their proportion was higher in Re-Cal (49%) condition, as compared to Iso (25%) and Wash-out (27,30%) task, and in the THT (Iso, 26,40%; Re-Cal, 42%; Wash-out, 32%, see Table 1). This is also shown by the rose diagrams in Figure 6A, that document a clear expansion in the proportion of PMd cells directionally-tuned in the above conditions and epochs.
Table 1. Number and percentage of cells with significant directional-tuning in Iso, Re-Cal and Wash-out tasks
Epoch Number of cells
Iso Re-Cal Wash-out
RT 22/106 (20%) 26/106 (24%) 28/106 (26,4%)
DFT 27/106 (25%) 52/106 (49%) 29/106 (27,3%)
Figure 6. Directional properties of cells in Re-Cal task. A, polar histogram showing the number of cells with a
statistically significant directional tuning (bootstrap, p < 0.05) for each epoch and task condition. B, Tuning Gain, calculated for each epoch and task condition with reported statistic (paired t-test: *, < 0.05, **, < 0.01, ***, 0,001).
Study of the directional properties during perturbation and post-perturbation time
To deepen the description of the properties of frontal neurons exposed to the change in force condition, we evaluated how the force re-calibration affected the tuning properties of PMd cells, by studying both the shift of the preferred direction (PD) and the depth of modulation of the tuning curve (Tuning Gain, TG).
First, we evaluated the shift of their PDs, either when the animal was exposed to the perturbation (Re-Cal) and when this was removed (Wash-out).
After the change of force conditions, we did not find a significant shift (Watson-Williams for circular data, p = 0.63) of cell PDs at a population level. The net shift was rather low but the magnitude of the shift, obtained by calculating the absolute value of the shift of preferred direction for each cell considered and by mediating each cell value, was higher than the shift observed in the Wash-out condition. The observation that after the Wash-out of the force field, the preferred direction tended to return to the orientation observed in the Iso, is also confirmed by the lower magnitude of the PD shift between Iso/Wash-out (14,34°) than between
Iso/Re-Cal (22,39°) conditions, although this difference did not resulted significant (Watson-Williams
for circular data: differenceIso-ReCal vs differenceReCal-Washout, p = 0.794; differenceIso-Washout vs
differenceIso-ReCal, p = 0.238; differenceIso-Washout vs differenceReCal-Washout, p = 0.139).
Furthermore, the lack of a net shift of PD after perturbation could depend on the type of force field adopted in our experiment, that did not impose any directional bias to the cursor’s motion, but rather a modification of the force amplitude. However, by subdividing the original
population in two sub-populations, for each of them we found an important variation from the preferred directions observed in the Iso condition.
We also investigated the depth of tuning modulation of the cells in all three behavioral conditions for each of the three task epochs. Figure 6B shows that directionally-tuned cells during the execution time of the Re-Calibration condition display an increased tuning gain, as compared to the Iso condition. Notably, these differences were only statistically significant for the THT (1-way ANOVA, Factor: condition, p = 0.0011), while for DFT there was only a tendency towards significance (1-way ANOVA, Factor: condition, p = 0.061). This result suggests that the total force modulation needed was stronger at the end of the isometric action, to stop the cursor’s motion, rather than during its motion.
Force output modulation in two different population of cells
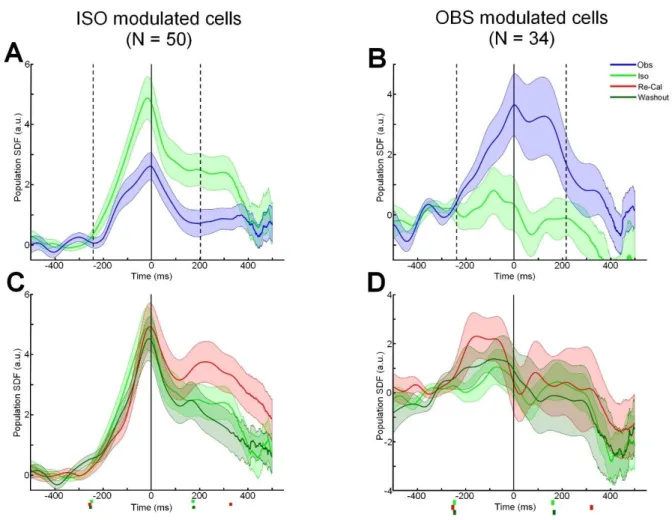
Given the numerical relevance of PMd cells modulated in the Obs task, we decided to study the role of different cells populations in the force recalibration process. For this, we divided the 106 cells considered for all above analyses of directional properties in two groups: a) a first one was formed by cells modulated (ANOVA, p < 0.05) during the DFT of the Iso condition (without any requirement on the modulation in the Obs task); b) a second group included cells modulated during the cursor’s motion time of the Obs trials but not in the Iso condition. We noticed that the Iso-modulated cells showed a significant decrease of their normalized activity with respect to that recorded during the Obs condition (Fig. 7A), while the second group on the contrary where more strongly modulated by the Obs task, with respect to the Iso one. Therefore, we were interested in analyzing which was the role of each of the two subsets of cells in the ‘recalibration’ process, tested by perturbing the force field. To this scope, we studied the population SDFs of both groups in the Iso, Re-Cal and Wash-out for the two groups separately (Fig. 7C, D). For both groups, the neural activity in the Re-Calibration condition was studied by analyzing the respective population SDFs (Fig. 7). While the cells of group a), which was modulated in the Iso task (Figure 7A), changed their response (paired t-test, p < 0.05), thus reflecting the increase in the amount of force imposed by the force recalibration (Figure 7C), those of group b) (Figure 7B) did not significantly change their activity profile during force perturbation, therefore were not affected by the change in task dynamics (paired t-test, p > 0.05; Fig. 7D),
Figure 7. Mean standardized population SDFs (continuous curves) and their SE (shaded area) from two subsets
of cells in monkey D (N, number of units). Neural activity is aligned to onset of force application (0 ms). The markers before the onset of force (0 ms) represent the mean time of target presentation. The markers after the onset of force (0 ms) represent the mean time of the cursor’s arrival at the peripheral target. A, mean population SDF from cells significantly modulated in Iso task (p < 0.05) and whose firing frequency was significantly (p < 0.05) higher in the Iso task (green) than in the Obs task (blue). B, mean population SDF from cells significantly modulated in Obs task (p < 0.05) and whose firing frequency was significantly (p < 0.05) higher in the Obs task (blue) than in the Iso task (green). C, Mean population SDF from cells significantly modulated in Iso task (p < 0.05) and tested in Iso (green), Re-Cal (red) and Wash-out (dark green) conditions. D, mean population SDF from cells significantly modulated in Obs task (p < 0.05) and tested in Iso (green), Re-Cal (red) and Wash-out (dark green) conditions.
Population coding of hand force output and cursor’s kinematics
The neural representation of the behavioral output as a function of time was studied by comparing the temporal evolution of the instantaneous PV (computed at 10 ms time bins) with both the evolution of the instantaneous force change (see Materials and Methods), a time-varying force vector controlled in the Iso task, and the kinematics of the cursor during the Obs task, in absence of any hand force change. As shown in previous studies of motor
(Georgopoulos, Ashe, Smyrnis, & Taira, 1992) and parietal (Ferrari-Toniolo, Visco-Comandini, Papazachariadis, Caminiti, & Battaglia-Mayer, 2015) cortex, also in PMd the PV predicts the instantaneous force changes over time. In fact, we were able to reconstruct the cursor’s motion trajectory, i.e., the “decoded trajectory”, by placing tip-to tail the instantaneous PVs computed from the activity of premotor cells in each target direction. For this purpose, we divided the cells in two distinct groups, those with significant preferred direction (PD, see Materials and Methods) in Iso task (Figure 8A1, B1, C1), and those that presented a PD in Obs task (Figure 8A2, B2, C2). Consistent with the previous analysis of the population SDFs, the cells modulated in the Sac task were not included.
Figure 8. Population vectors and decoded trajectories of cursor motion. Decoded trajectory (thick curve) of the
cursor’s motion toward the eight target directions, as predicted by the “instantaneous force change” encoding hypothesis, therefore obtained by connecting tip-to-tail all the PVs computed at each time bin from the activity recorded during the Iso (green) and Obs (blue) tasks. Gray dotted lines indicate mean actual cursor’s trajectories.
A1, Monkeys S, cells with PD in Iso task. A2, Monkeys S, cells with PD in Obs task. B1, Monkeys K, cells with
PD in Iso task. B2, Monkeys K, cells with PD in Obs task. C1, Monkeys D, cells with PD in Iso task. C2, Monkeys D, cells with PD in Obs task.
The results (Figure 8) show that the decoded trajectory of the cursor’s motion resulting from force application was predicted with high fidelity in the Iso condition (Figure 8A1, B1, C1, green lines) by cells directionally-tuned in Iso task of the three monkeys. The temporal evolution of the PV computed through the neural activity recorded during the Obs task (Figure 8A1, B1, C1, blue lines) of these cells did not predict the cursor motion associated to this task condition. Indeed, the trajectories were not reconstructed in monkey S (Figure 8A1) and Monkey D (Figure 8C1), while in monkey K they were poorly reconstructed (Figure 8B1). This reflects the scarce influence of this parameter on the activity of this group of cells in the absence of any force production.
Concerning the cells with PD in Obs task, the results show that, the trajectories are better reconstructed in the Obs condition in the three monkeys (Figure 8A2, B2, C2, blue lines), with respect to the Iso condition. In this case, a variable accuracy of the trajectory prediction has been observed (Figure 8A2, B2, C2, green lines). Indeed, in Monkey S (Figure 8A2) the trajectories are not reconstructed, in monkey D (Figure 8C2) they are poorly reconstructed, while in Monkey K the decoded trajectories are more accurate. Interestingly, the monkey with higher fidelity to behavioral output in both groups of cells (i.e. monkey K, Figure 8B1, B2), is the monkey that also presents the higher percentage of cells with PD in both the Iso and Obs tasks (See Table 2), therefore with similar tuning properties across task conditions.
Table 2. Number of cells used in PV analysis
Monkey Cells with PD in Iso
Cells with PD in Obs
Cells with PD in Iso and Obs
S 54/65 (83%) 21/65 (32%) 10/65 (15%) K 70/107 (65%) 72/107 (67%) 35/107 (33%) D 32/44 (73%) 20/44 (46%) 8/44 (18%)
Encoding the force determining the desired cursor motion or the intended cursor motion?
The final crucial question of this study was to determine whether cell activity in the task studied encoded the force necessary ti implement the desired cursor motion, thus reflection and inverse model, or rather the intended cursor motion, as in forward models.
To address this issue, the PV analysis was repeated to compare the trajectories decoded from neural activity recorded under different force outputs (Iso, Re-Cal, Wash-out). In fact, if cell
activity reflects the force output, it can be expected that the length of the PVs(t) in the Re-Cal condition, and consequently the length of the decoded trajectories, would be approximately twice as long as that associated to the Iso and Wash-out tasks. On the contrary, the PV would reflect the intended cursor motion.
Figure 9. Decoded trajectory and output force. A, Decoded trajectories in the eight directions of cursor motion
obtained by using the PVs computed for different task conditions (green represents Iso; red represents Re-Cal: dark green represents Wash-out), characterized by different force modulations by the animal, as to bring the cursor from the center to the peripheral target. Trajectories are plotted from the DFT onset to the time the cursor enters the peripheral target (filled circles), by using only cells with significant directional tuning in each task. B, Average (±SE) values of force output (in Newton) on the left, and cursor position (distance of the cursor from the central starting position, DVA) on the right, measured at the end of DFT.
Figure 9A shows that in the Re-Cal condition, the length of the neural trajectories increases significantly, to return similar to that of the Iso task, after the Wash-out session, when the force output returned identical to that of the Iso task. Furthermore, by plotting the magnitude of exerted force, and the cursor position at the end of DFT across conditions (Fig. 9B), we can conclude that, in these cells, the PV predicts the force variations better than the intended cursor motion on the screen.
DISCUSSION
The goal of this study was to assess the role of PMd in the cortical network encoding hand force, in addition to its well-known role in the control of limb kinematics (Caminiti, Johnson, Galli, Ferraina, & Burnod, 1991). For this reason, we studied the neural activity of a large population of premotor cells in different behavioral tasks. These were aimed at dissociating action kinematics from kinetics and at assessing the relationships between the hand force-related activity and the observation-force-related activity elicited when the animals observed in play-back the consequences of their hand force output, as motion of a visual cursor on the screen.
Activity of hand force-related cells under different force conditions
Most PMd cells were modulated and directionally-tuned during the time of dynamic force application the Iso task. The modulation of neural activity started with varying latencies after the presentation of the visual target, therefore during the RT, reached its peak close to the onset of the dynamic force, that is action onset, and then slowly returned to the baseline. Thus, in many instances cell activity could have been related to the intended direction of force application or to the desired trajectory of the resulting cursor motion.
To determine whether cell activity was truly related to force output, in the Re-Cal condition the force/cursor displacement relationships were changed in such a way that the monkeys had to double the amount of force exerted on the joystick to compensate for such change and successfully bring the cursor to the target, as if force was applied against an opposing load. Under these conditions cell activity in a large fraction PMd cells changed significantly, in most instance by enhancing the firing rate, which remained higher than Iso condition during the time of force change. In a similar fashion, most cells’ preferred direction changed, or even emerged during this time, when the cell was not directionally-tuned in the Iso task. Thus, under the new force field conditions, both cells modulation and the direction tuning changed. Finally, these premotor neurons responded to the increased force output by also increasing the power and precision of the directional tuning of cells.
During the Wash-out condition, when the force/cursor displacement relationships returned identical to those of the Iso task, cells activity in PMd returned to the level of the pre-perturbation conditions.
Encoding the hand force causing the desired cursor motion or the intended cursor trajectory?
The final crucial question of this study concerning encoding of force was to determine whether cell activity in the task studied encoded the force necessary to implement the desired cursor motion, thus reflecting and inverse model, or rather the intended cursor trajectory, as in forward models. To address this issue at the population level, the PV analysis was repeated to compare the trajectories decoded from neural activity under different force outputs (Iso, Re-Cal,
Wash-out). We reasoned that if cell activity reflected the force output, one could expect that the length
of the time-varying population vector in the Re-Cal condition, and consequently the length of the decoded trajectories, would be approximately twice as long as that associated to the Iso and
Wash-out conditions. On the contrary, the population output would reflect the intended cursor
motion. Consistent with the results obtained at single cell level, we found that the length of the decoded trajectories in Re-Cal conditions increased as expected, relative to the Iso task, and then returned to the baseline when the new force-field was washed-out. This suggest the cells population output reflects an inverse model that specifies the force necessary to implement the cursor motion appropriate to bring it to the target.
These changes of neural activity across Iso, Re-cal and Wash-out conditions can be interpreted as a neural correlate of motor adaptation to changed task dynamics, that is for rapid error corrections that return behavior to baseline performance (Shmuelof & Krakauer, 2011). They are similar to the data gained in dorsal and ventral premotor cortex from force-field adaptation experiments based on arm movement (Xiao et al., 2006). In the latter study the majority of cell were responsive to changes of the force-field, by changing their PD and/or firing rate, but these cells did not preserve these modifications at the end of the Wash-out condition. Thus, there seem to be a common mechanisms of force hand force encoding and response to unexpected modifications of the dynamics of the action space across dorsal and ventral premotor cortex, that reflect an adaptation rather than a learning process.
As compared to the mechanisms of force encoding in posterior parietal cortex under identical task conditions, (Ferrari-Toniolo, Visco-Comandini, Papazachariadis, Caminiti, & Battaglia-Mayer, 2015), an important difference is that, although in the latter neural activity changed in response to the new force field, as in PMd, in parietal cortex at the end of a “wash-out” session cell and population activity did not return to the pre-perturbation conditions, thus retained memory of the new learned association, probably at the service of predictive control of future hand force application. Therefore, in such a case a learning process might have occurred.
Furthermore, although the neural hallmarks of motor learning and plasticity were apparently not represented in our results, we observed an intriguing phenomenon which might represent a way to face unexpected change in task dynamics. Indeed, despite after removal of the perturbation of the force field PMd neural activity returned to the level typical of the pre-perturbation condition, at the end of the Wash-out session we found an increase in the number of cells recruited in the DFT, as compared to pre-perturbation conditions, as well as a significant shift of cells PD during Wash-out, as compared to baseline (Iso), even if this shift was less pronounced than in the Re-Cal condition.
Altogether these results suggest that at the transition between Iso, Re-cal, and Wash-out conditions, that is across conditions that require exerting an isometric hand force, recalibrating the force output to face an unexpected force field change, returning to the baseline condition after its wash-out, a potential dynamic re-arrangement of the PMd neural assembly underlying these processes occurred, since the assembly size expanded by increased the number of its constituent cells, now endowed with increased directional power and precision, then a reshaping occurred with assembly composition returning to the baseline conditions, as if neurons could opt to go in and out of the assembly depending on task conditions. A similar reshaping of neural assemblies has been postulated for motor learning in M1 of mice (Peters, Chen, & Komiyama, 2014) and remains to be explored in future analysis of our data.
Cell Activity, Hand Force and Observation
Based on the cortico-cortical and cortico-descending connections of PMd (Caminiti, et al., 2017), as well as on previous studies showing observation-related activity in this area (Cisek and Kalaska, 2004; Tkach et al., 2007), we expected that the activity of cells studied in our tasks could have been potentially related not only to hand force, but also to the observation of the cursor motion, as determined by the animal’s isometric force output in different directions. Indeed, we found that, among the population of cells studied, most of them were modulated in both the hand force related tasks (Iso, Re-Cal, Wash-out) and in the Obs conditions, although with different firing rate profiles.
At population level, the strength of activation showed no significant difference between action execution, that in our study coincided with hand force change over time, and the observation of the resulting cursor’s motion shown in play-back to the animals in different trials, as also observed by Cisek and Kalaska, Tkach et al. when contrasting action- and observation-related activity.
The analysis of the population of observation related-cells that were not modulated in the isometric condition (Iso task) showed that their activity did not change when the force field changed, therefore by task dynamics, suggesting that these cells did not encode the hand force change but merely reflected the observation in the visual space of the consequences of the force application, in terms of cursor motion in the visual field. Therefore, we can conclude that their activity encodes the observable consequence of hand-force application on the joystick, which in the real life could be represented by any object, from the robotic arms used in endoscopic surgery, to the joystick necessary to move miniature explorers or soldiers in children videogames.
In conclusion, thanks to different and apparently heterogeneous populations of cells reflecting instantaneous hand force and the resulting cursor motion, dorsal premotor cortex can encode in a coherent fashion an ethologically-relevant function consisting of hand force application on objects and monitoring its consequences in the visual world, which are important to determine objects affordance.
REFERENCES
Batschelet, E. (1981). Circular statistics in biology (Vol. 111, p. 388). London: Academic press.
Battaglia-Mayer, A. (2019). A Brief History of the Encoding of Hand Position by the Cerebral Cortex: Implications for Motor Control and Cognition. Cerebral Cortex. 29:716-731
Caminiti R, Borra E, Visco-Comandini F, Battaglia-Mayer A, Averbeck BB, Luppino G. (2017). Computational Architecture of the Parieto-Frontal Network Underlying Cognitive-Motor Control in Monkeys. eNeuro. 4.
Caminiti R, Ferraina S, Johnson PB. (1996). The sources of visual information to the primate frontal lobe: a novel role for the superior parietal lobule. Cereb Cortex. 6:319-28.
Caminiti R, Johnson PB, Galli C, Ferraina S, Burnod Y. (1991). Making arm movements within different parts of space: the premotor and motor cortical representation of a coordinate system for reaching to visual targets. J Neurosci. 11:1182-97.
Cheney, P. D., Fetz, E. E. (1980). Functional classes of primate corticomotoneuronal cells and their relation to active force. Journal of neurophysiology. 44:773-791.
Cisek P, Kalaska JF. (2004). Neural correlates of mental rehearsal in dorsal premotor cortex. Nature. 431:993-6.
Crammond DJ, Kalaska JF. (1996). Differential relation of discharge in primary motor cortex and premotor cortex to movements versus actively maintained postures during a reaching task. Exp Brain
Res. 108:45-61.
Davare, M., Andres, M., Clerget, E., Tonnard, J. L. & Olivier, E. (2007). Temporal Dissociation between Hand Shaping and Grip Force Scaling in the Anterior Intraparietal Area. J Neurosci. 27, 3974–3980. Dum RP, Strick PL. (1991). The origin of corticospinal projections from the premotor areas in the frontal lobe. J Neurosci. 11:667-89.
Dushanova, J., Donoghue, J. (2010). Neurons in primary motor cortex engaged during action observation. Eur. J. Neurosci. 31: 386–398.
Ehrsson HH, Fagergren E, Forssberg H. (2001). Differential fronto-parietal activation depending on force used in a precision grip task: an fMRI study. J Neurophysiol. 85:2613-23.
Evarts EV. (1968). Relation of pyramidal tract activity to force exerted during voluntary movement. J
Neurophysiol. 31:14-27.
Ferrari-Toniolo S, Papazachariadis O, Visco-Comandini F, Salvati M, D'Elia A, Di Berardino F, Caminiti R, Battaglia-Mayer A. (2014). A visuomotor disorder in the absence of movement: does optic ataxia generalize to learned isometric hand action? Neuropsychologia. 63:59-71.
Ferrari-Toniolo, S., Visco-Comandini, F., Papazachariadis, O., Caminiti, R., & Battaglia-Mayer, A. (2015). Posterior Parietal Cortex Encoding of Dynamic Hand Force Underlying Hand–Object Interaction. Journal
of Neuroscience, 35(31), 10899-10910.
Ferrari-Toniolo, S., Visco-Comandini, F., Papazachariadis, O., Caminiti, R., & Battaglia-Mayer, A. (2015). Posterior Parietal Cortex Encoding of Dynamic Hand Force Underlying Hand–Object Interaction. Journal
of Neuroscience. 35:10899-10910.
Gallese V, Fadiga L, Fogassi L, Rizzolatti G. (1996). Action recognition in the premotor cortex. Brain. 119:593-609.
Genovesio A, Brunamonti E, Giusti MA, Ferraina S. (2007). Postsaccadic activities in the posterior parietal cortex of primates are influenced by both eye movement vectors and eye position. J Neurosci. 27:3268-73.
Georgopoulos, A. P. (1992). Motor Cortex: A Changing Perspective. In R. Caminiti, P. B. Johnson, & Y. Burnod, Control of Arm Movement in Space: Neurophysiological and Computational Approaches (pp. 175-183). Springer-Verlag.
Georgopoulos A. P., Caminiti, R., Kalaska, J. F., (1984) Static spatial effects in motor cortex and area 5: Quantitative relations in a two-dimensional space. Exp Brain Res 54: 446-454.
Georgopoulos, A. P., Caminiti, R., Kalaska, J. F., & Massey, J. T. (1983). Spatial coding of movement: a hypothesis concerning the coding of movement direction by motor cortical populations. Experimental