Index
1. Introduction. ... 3
2. TAPIRO research reactor ... 3
3. The ERANOS code. ... 5
3.1 Architecture... 5
3.2 Cell Calculations. ... 6
3.3 Static Calculations. ... 7
4. The Serpent code... 7
5. The FISPACT code. ... 11
6. ERANOS model and preliminary results. ... 12
7. Fluxes and reaction rates. ... 16
7.1 Average Microscopic Cross Sections ... 30
7.2 Capture to Fission Ratio... 39
8. Activation results. ... 45
9. Conclusions ... 54
1. Introduction.
The reduction of the nuclear waste is one of the most important nuclear issues, followed by the current worldwide R&D for the closed fuel cycle fulfillment and the IV Generation reactors development. The spent fuel discharged from nuclear power plants constitutes the main contribution to nuclear waste. The high radiotoxicity of the spent fuel is due to plutonium and some minor actinides (MAs) such as neptunium, americium and curium, above all. One way to reduce their hazard is to transmute MAs in appropriate nuclear reactors. To allow the MAs transmutation an important effort have been done on the nuclear data due to the poor knowledge in this field. Several NEA and IAEA Working Groups addressed these issues, even recommending integral measurements, complementary to parallel efforts for differential measurements, for the several nuclides of MAs from viewpoints of design of transmutation systems and of fuel cycles. In the framework of one of the NEA Expert Group on Integral Experiments for Minor Actinide Management (EGIEMAM) the feasibility of MAs irradiation campaign in TAPIRO research reactor is carried out in this report.
This work is divided into two different parts, the first one consider the neutronic analysis by two different code, the deterministic ERANOS and the Monte Carlo SERPENT codes; the second one carried out by FISPACT code allows to evaluate the activation of different MAs samples, supplied by CEA.
2. TAPIRO research reactor.
TAPIRO (TAraturaPIlaRapida a potenzazerO), a fast nuclear research reactor located at C.R ENEA-CASACCIA, was developed by ENEA, based on the project of the Argonne Fast Source Reactor (AFSR, Idaho falls). Thestartup was in 1971 and is currently used in supporting experimental programs finalized to [1]:
validation of calculation codes for studies on the development of Gen-IV reactors (ADS systems);
analysis on fast neutrons damages on materials and electronics components;
training and experiences for nuclear engineering courses.
Figure 1 - TAPIRO reactor room.
It has a maximum power of 5 kW with a neutron flux of 4 x 10¹² n/(cm2 s) in the centre of the core. The core is cylindrical with a diameter of about 12 cm and a similar height. It is made with metallic uranium ( 98.5 % uranium and 1.5 % molybdenum) with an enrichment of 93.5 % in 235U. It consists of 2 parts: the upper part is fixed while the lower one is movable. The core is surrounded by a double layer of copper reflector and by an external biological shield of borate concrete. It is refrigerated by helium. The reactor is equipped with 2 shim rods, 2 safety rods and a regulating rod. These rods are realized with the same material of the reflector and the reactor is controlled increasing or reducing the leaks of neutrons.
A horizontal section of the reactor at 1 m from the floor is showed in Figure 2:
Figure 2 - Horizontal Section of TAPIRO parallel to the floor.
To allow irradiation experiences, the system has different channels, located in different positions; they are realized with a metallic cylindrical clad and they are filled with plugs made of copper, in the
reflector's area, and of shielding material in the external part. The copper part of each plug is removable to permit the insertion of sample material or detectors used for experiences. An important characteristic of the channels is that their sections are gradually reduced to cut down the gamma ray streaming effect. The main channels are shown in Table1) [1]:
Table 1 - TAPIRO experimental channels
3. The ERANOS code.
The European Reactor Analysis Optimized calculation System, ERANOS [3], has been developed and validated with the aim of providing an appropriate basis for neutronic calculations of current fast (and thermal) reactor cores. It consists of data libraries, deterministic codes and calculation procedures developed within a European framework and it meets the needs expressed by the industrialists and the teams working on the design of fast reactors, present and future.
ERANOS is written using the ALOS software which requires only standard FORTRAN compilers and include advanced programming features. It allows, with the use of LU user’s language, to perform programs of R&D in reactor physics without needing specific development.
3.1 Architecture.
Fast reactor core, shielding and fuel cycle calculations can be performed with the ERANOS system. A modular structure was adopted for easier evolution and incorporation of new functionalities.
Blocks of data can be created (data SETs) or used by different modules or by the user with LU control language. Programming and dynamic memory allocation are performed with the use of the ESOPE language. It can be possible to make an external temporary storage or permanent storage with the
Name Position Penetration
Diametral channel (D.C.) Piercing. Horizontal. Diametral in the core.
Inner and outer fixed reflector. Core.
Tangential channel
Piercing. Horizontal. 50 mm above core mid-plane. Parallel to D.C. 106
mm from core axis.
Inner and outer fixed reflector.
Radial channel 1 (R.C.1) Radial. Horizontal on core mid-plane, at 90° with respect to D.C.
Inner and outer fixed reflector, up to 93 mm from core axis. Radial channel 2 Radial. Horizontal on core mid-plane,
at 50° with respect to R.C.1.
Outer fixed reflector,up to 228 mm from core axis. Grand Horizontal Channel
(G.H.C.) Radial. Concentric with R.C.1. Up to reflector outer surface Grand Vertical Channel
(G.V.C.) Above core, on the same axis.
Outer fixed reflector, up to 100 mm from upper core base.
Thermal column Horizontal. Shield, up to outer reflector
GEMAT and ARCHIVE functions, respectively. ESOPE, LU, GEMAT, and ARCHIVE are all part of the ALOS software.
This type of structure, based on a modular system, allows to link together different modules in procedures corresponding to recommended calculation routes ranging from fast-running and moderately-accurate ‘routine’ procedures to slow-running but highly-accurate ‘reference’ procedure. The main contents of ERANOS-2.2 package are:
nuclear data libraries, multi group cross sections from ERALIB1, ENDF-/B-VI.8, JEF-2.2, JEF-3.1 evaluated nuclear data files, and other specific data;
a cell and lattice code ECCO;
reactor flux solvers (diffusion, Sn transport, nodal variational transport); a burn-up module;
different processing modules (material and neutron balance, breeding gains,…);
perturbation theory and sensitivity analysis modules;
core follow-up modules;
a fine burn-up analysis subset named MECCYCO (mass balances, activities, decay heat, dose rate).
Each nuclear data package contains four neutron cross section libraries obtained by processing the corresponding nuclear data files by the NJOY and CALENDF codes and they are:
a 1968 energy group library containing 41 main nuclides;
a 33 energy group library containing 246 nuclides, including pseudo fission products;
a 175 energy group library used for shielding calculation only;
a 172 energy group library used mainly for thermal spectrum calculations.
3.2 Cell Calculations.
ERANOS code has been developed within the European Collaboration on Fast Reactors over the past 30 years or so. It consists of data libraries, deterministic codes and calculation procedures.
ERANOS is a deterministic code system, neutron physics calculations are performed at the cell/lattice level and at the core level. The development of the ECCO Code was decided in 1985 by several R&D teams working within the framework of the European Fast Reactor Collaboration [3].
ECCO [4], European Cell COde, is the cell code allowing to calculate the cross sections matrices to be used in spatial core calculations performed by different ERANOS modules.
First of all, it is necessary to provide to ECCO media composition (homogeneous mixtures), expansion coefficients and geometric description of the cell. Then the cross sections are calculated by using the defined media and the associated nuclear data libraries by means of the collision probability method. The nuclear data libraries are available at different temperature (293.6, 573.6, 973.6, 1473.6, 2973.6 K) to take into account the Doppler effect for the main nuclides.
An ECCO calculation corresponds to a succession of STEPs, and for each STEP one can select energy structure, cell geometry (heterogeneous or homogeneous), flux calculation type, and so on.
1D, plane or cylindrical calculated by exact collision probabilities method;
2D, rectangular lattice made of cylindrical and/or square pins within a square tube, hexagonal lattice made of cylindrical pins within a hexagonal sheet calculated by approximate collision probability method (Roth and double step methods);
3D, XYZ and HEX-Z calculated by approximate collision probability method.
The user has the possibility to chain several calculation steps so as to produce design or reference calculations, or even to use specific capabilities, according to the need of the study.
A route is a recommended way to perform ECCO calculations. The first route is the “reference” one that does not care about the time calculation and treats the heterogeneous cell at fine energy group level (1968 groups). The second route is the “project” or “design” one in which some simplifying hypotheses are assumed, the elastic slowing down is treated in a homogeneous geometry but at fine group level, the self-shielding is treated in a heterogeneous geometry at broad group level (33 groups).
3.3 Static Calculations.
ERANOS allows several types of flux calculations: diffusion and transport calculations with different methods; in each case can be addressed external source, up-scattering and adjoint calculations. For all geometries, 1D plane, cylindrical and spherical, 2D RZ, R-theta, rectangular lattice XY, hexagonal lattice, and 3D rectangular lattice XYZ, hexagonal-Z can be used finite difference diffusion solvers. In 1D and in some 2D geometries, like RZ and XY, finite difference Sn transport calculations can be
performed by means of the BISTRO [5] code. The physics of thermal and fast reactors require the capability to solve the transport equation in accurate manner for different 2D and 3D geometries; variational nodal methods are well adapted for these topics because of the reduced numbers of unknowns used and the good accuracy in the solution by using high order approximation for spatial and angular expansions of flux and current in the node.
Both 2D (XY and hexagonal) and 3D (XYZ and hexagonal-Z) geometries are available within the TGV/VARIANT variational nodal module. The module performs direct flux calculations, with and without an external source, and adjoint calculations, and is possible to set up several parameters for different types of analyses. The computing time, in comparison with other methods devoted to the transport equation solution (like Sn), is very competitive.
4. The Serpent code.
Serpent is a three-dimensional continuous-energy Monte Carlo reactor physics burnup calculation code, developed at VTT Technical Research Centre of Finland since 2004. [6]
The suggested applications of Serpent include:
Spatial homogenization and group constant generation for deterministic reactor simulator calculations
Fuel cycle studies involving detailed assembly-level burnup calculations
Validation of deterministic lattice transport codes
Coupled multi-physics applications (available in Serpent 2)
Educational purposes and demonstration of reactor physics phenomena.
Similar to other Monte Carlo codes, such as MCNP and Keno-VI, Serpent uses a universe-based combinatorial solid geometry (CSG) model, which allows the description of practically any two- or three-dimensional fuel or reactor configuration. The geometry consists of material cells, defined by elementary quadratic and derived macrobody surface types.
The code also provides some additional geometry features specifically for fuel design. These features include simplified definition of cylindrical fuel pins and spherical fuel particles, square and hexagonal lattices for LWR and fast reactor geometries, and circular cluster arrays for CANDU fuels.
The random dispersion of microscopic fuel particles in high-temperature gas cooled reactor fuels and pebble distributions in pebble-bed type HTGR cores can be modeled using geometry types specifically designed for the task.
4.1 History of the Serpent project
The development of Serpent started at VTT in 2004, under the working title “Probabilistic Scattering Game”. The name was later changed to Serpent, due to the various ambiguities related to the PSG acronym.
The main reason to start developing a new Monte Carlo neutron transport code from scratch was the fact that the general-purpose codes available at that time were not particularly well suited for lattice physics applications. Group constant generation requires the combination of several user-definedreaction rate tallies and the estimation of combined statistical errors becomes complicated. The overall calculation time increases dramatically along with the number of tally definitions, and the calculation of certain parameters, such as scattering matrices, diffusion coefficients and effective delayed neutron fractions lies completely beyond the standard tally capabilities.
The source code was completely re-written by the end of 2005. The new version included a bound-atom scattering model for moderator isotopes. Parallel calculation using the Message Passing Interface (MPI) was also implemented.
Another major improvement was a new geometry routine that could overcome the localized absorber problems of delta-tracking in simple lattice geometries.
The current version of Serpent 1 began to formulate when the source code was completely re-written for a second time by the beginning of 2008. A persistent methodological flaw in the free-gas scattering model was corrected, which finally reduced the differences to MCNP results to the level of statistical accuracy. The old geometry routine was also replaced by a more general approach based on the combination of delta-tracking and the conventional surface tracking method.
The development ofburnup calculation routines began in early 2008. The first version was based on an external coupling to the ORIGEN2 depletion code. It was soon decided, however, that the code should also have the capability to run burnup calculation as a complete stand-alone application.
A pre-release version (1.0.0) of the Serpent code was made available to some universities and research institutes in October 2008. The code was submitted for public distribution to the NEA Data Bank in April 2009 and released one month later [6].
4.2 Monte Carlo method in Serpent
The Monte Carlo simulation can be run in k-eigenvalue criticality source or external source mode. Neutron transport is based on a combination of conventional surface-to-surface ray-tracing and the Woodcock delta-tracking method. The tracking routine has proven efficient and well suited for geometries where the neutron mean-free-path is long compared to the dimensions.
The main drawback of delta-tracking is that the track-length estimate of neutron flux is not available and reaction rates have to be calculated using the potentially less-efficient collision estimator. This is usually not a problem in reactor calculations when reaction rates are scored in regions of high collision density. However, the efficiency of the collision estimator becomes poor in small or optically thin volumes located far or isolated from the active source.
The continuous-energy Monte Carlo method has been used for criticality safety analyses, radiation shielding and dose rate calculations, detector modeling and the validation of deterministic transport codes for decades.
The main motivator is usually the need to model geometry and interaction physics to within maximum accuracy, often regardless of the computational cost. Monte Carlo codes are well suited for the job, with the capability to handle complicated three-dimensional geometries and to model neutron interactions at the microscopic level without major approximations. In fact, Monte Carlo codes are often used to complement or even replace experimental measurements.
The computational requirements for reactor analysis, in particular the modeling of operating power reactors, are considerably higher. The strong coupling between neutronic, thermal hydraulics and fuel behavior means that the transport problem cannot be solved separately, and even though considerable efforts are devoted to developing various multi-physics calculation systems, the Monte Carlo method cannot yet be considered a practical option for routine design and safety analyses of large LWR cores. The traditional approach to reactor analysis relies instead on a multi-stage calculation scheme, where the complexity of transport physics is gradually simplified, while simultaneously increasing the scale of the modeled system. In practice, the calculation sequence is divided into:
1. Spatial homogenization, where the interaction physics at the fuel assembly level is condensed into a set of assembly-specific multi-group constants;
2. Core simulation, where the full-scale neutronic solution obtained using diffusion theory or other simplified transport method is iteratively coupled to thermal hydraulics.
The same code and cross section data can be used for modeling any fuel or reactor configuration without compromising the reliability of the calculation scheme. The particle transport simulation in is inherently three-dimensional, which makes it possible to capture the effects of axial heterogeneities. [7]
4.3 Interaction physics
Serpent reads continuous-energy cross sections from ACE format data libraries, based on JEF-2.2, JEFF-3.1, JEFF-3.1.1, ENDF-VI.8 and ENDFBVII.
The interaction physics is based on classical collision kinematics, ENDF reaction laws and probability table sampling in the unresolved resonance region.
Interaction data is available for 432 nuclides at 6 temperatures between 300 and 1800K. Thermal bound-atom scattering data is included for light and heavy water and graphite.
Continuous-energy cross sections in the library files are reconstructed on a unionized energy grid, used for all reaction modes. The use of a single energy grid results in a major speed-up in calculation, as the number of CPU time consuming grid search iterations is reduced to minimum. Macroscopic cross sections for each material are pre-generated before the transport simulation.
Instead of calculating the cross sections by summing over the constituent nuclides during tracking, the values are read from pre-generated tables, which is another effective way of improving the performance.
A built-in Doppler-broadening preprocessor routine allows the conversion of ACE format cross sections into a higher temperature. This capability results in a more accurate description of the interaction physics in temperature sensitive applications, as the data in the cross section libraries is available only in 300K intervals.
5. MCNP code
MCNP6.1[8] is a general-purpose Monte Carlo N-Particle which is a worldwide reference for radiation transport simulations and nuclear components design and modelling. In fact, this code is used for neutron, photon, electron, or coupled neutron/photon/electron transport. Thus, the code deals with transport of neutrons, gamma rays, and coupled transport, i.e., transport of secondary gamma rays resulting from neutron interactions. The MCNP code can also treat the transport of electrons, both primary source electrons and secondary electrons created in gamma-ray interactions.
The code treats an arbitrary three-dimensional configuration of materials in geometric cells bounded by first- and second-degree surfaces and fourth-degree elliptical tori.
MCNP simulation – as well as a standard Monte Carlo one – is constructed starting from following aspects:
geometry definition
materials description and cross-section selection (nuclear data)
location and characteristics of the neutron, photon, electron source
type of answers or tallies to be obtained through the simulation
variance reduction techniques implemented to improve calculation efficiency
System geometry is constructed by the user through cells defined by the intersections, unions, and complements of the regions bounded by the surfaces. Surfaces are defined by supplying coefficients to the analytic surface equations or, for certain types of surfaces, known points on the surfaces. MCNP also provides a macro-body capability, where basic shapes such as spheres, boxes, cylinders, etc., may be combined using boolean operators.
Pointwise cross-section data typically are used, although group-wise data also are available. For neutrons, all reactions given in a particular cross-section evaluation are accounted for. Thermal neutrons are described by both the free gas and S(α,β) models. For photons, the code accounts for incoherent and coherent scattering, the possibility of fluorescent emission after photoelectric absorption, absorption by pair production with local emission of annihilation radiation, and bremsstrahlung. A multi-scattering model is used for electron transport that includes positrons, k x-rays, and bremsstrahlung but does not include external or self-induced fields.
Important standard features that make MCNP very versatile and easy to use include a powerful general source, criticality source, and surface source; both geometry and output tally plotters; a rich collection of variance reduction techniques; a flexible tally structure; and an extensive collection of cross-section data.
MCNP contains numerous tallies: surface current & flux, volume flux (track length), point or ring detectors, particle heating, fission heating, pulse height tally for energy or charge deposition, mesh tallies, and radiography tallies.
The MCNP code is developed and maintained by Los Alamos National Laboratory simulation group. This code is widely used and main specific areas of application include following:
radiation protection and dosimetry
radiation shielding, radiography, medical physics
nuclear criticality safety
detector design and analysis
accelerator target design
fission and fusion reactor design
decontamination and decommissioning
6. The FISPACT code.
FISPACT is an inventory code that was included in the European Activation System1 [9]. The code has been developed for activation calculations for materials used in the fusion fields2 [10]. It is able to give information about atomic density and activity of a material irradiated with neutrons or charged particles. It takes its origins from FISPIN, an activation code used for fission reactors [10]. There are several (about ten) versions of the code starting from Version 1 through Version 2007. The code uses external libraries of all cross sections and decay data for the most important nuclides that play a key role in the neutron flux irradiation. The output of the code gives information about the activity (Bq), the amount of nuclides (in atoms and grams) and also the γ-dose rate (Sv/h). FISPACT works with one energy group cross sections so it requires the collapsing of the library with the neutron spectrum [10]. The EAF3 libraries[11] cover an energy range from thermal to 60 MeV. The code can calculate the effects of irradiation of different minor actinides. It have to be considered that the EAF libraries contain infinite dilution cross sections; this means that, if the actinides is present in significant proportion in the material, the output data won't be representative because the code doesn't include self-shielding and burn-up effects [10]. However, the calculation of a pure actinide is possible to model fuel in a fission power station or in a transmutation system, but the results won't be as exact as a dedicated fission reactor code such as FISPIN. To perform a calculation many data files are required
FILES file contains all the information about the location of all files requested for running the code; it must be located in the same directory of the FISPACT executable. The fundamental information that are necessary to write an input in FISPACT are: material details that has to be irradiated, time of irradiation and decay time after which evaluate the activity, specific information about the value of the neutron flux and the neutron spectrum that will be used [10]. The input is composed by a series of words that allow to perform different actions; these words can be divided in two categories:
preliminary code words: they are concerned with library specifications;
1 EASY: it is an international standard for simulation of activation, transmutation processes and radiation damages caused
by nuclear reactions and decays. It is developed by the United Kingdom Atomic Energy Authority at Culham.
2 It has been adopted by the ITER project as the reference activation code. 3
The European Activation File (EAF) is an extensive data library prepared for the European Activation System (EASY). The EAF-2010 activation-transmutation neutron nuclear data library includes 816 target isotopes.
main code words: they gives details about the materials composition and the irradiation history.
Usually, these words are used following the chronological order of the neutron irradiation. It is possible to create irradiation routines that can be repeated in loop to simulate, for example, a one week irradiation program. The input file describes also the required type of output. A typical output consists of a first part that reports preliminary information such as the name of the program, its version and library information. This part is then followed by the nuclide inventory that is reported for each time interval specified in the input. The standard output table gives information about the composition in atoms, the mass (g), the activity (Bq), the α, β, and γ energy and different type of γ-dose (Sv/h).
7. ERANOS model and preliminary results.
The preliminary neutronic analysis of the reactor was carried out to better evaluate the irradiation feasibility.
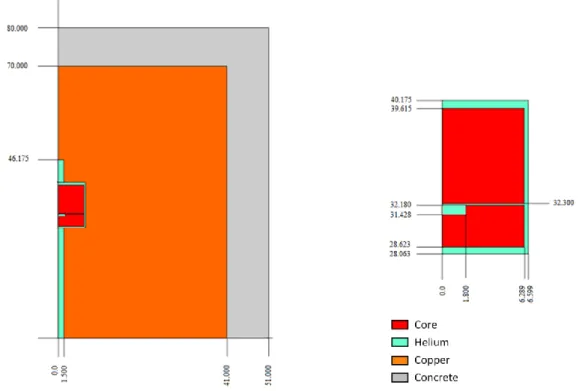
The model of the system, developed using the RZ geometry, allows to give more importance to the core, but this leads to less precision on the shield because it is spherical. The ERANOS model is shown in Figure 3:
Figure 3 - ERANOS model of TAPIRO (dimensions in cm, the image is not in scale).
As it can be noticed in Figure 3, only 50 cm of the concrete shield were considered (instead 175 cm); the reason of this choice is that the calculation goals are referred to the internal part of the system, above all the core and the reflector. After a preliminary check, it was possible to evaluate a negligible change between the two configurations, even the multiplication factor remains constant. Moreover, the
calculation time for the accurate geometry was extended of a factor 10. As showed in the same figure, the cooling channel between the core and the reflector (for upper, lower and external interfaces), is filled with coolant (He). In this position, near the core axis, there is a cavity; this is realized to allow the insertion of the shim pellet. The use of this pellet is useful to create the condition of minimum critical mass (M.C.M) relative to the first criticality of the reactor [2]. The configuration used in the calculations performed by ERANOS is the operative critical mass (M.C.O) without the shim pellet. In the M.C.O. configuration the cavity is filled with helium.
At first, two different energy structures, 33 and 172, have been considered to analyze the influence on the keff value of different energetic structures. The reactivity calculation has been carried out solving
the transport equation using different Sn approximations; in particular S4, S8 and
S16Gaussianequadratures. This method is implemented in BISTRO module inside ERANOS and it is
more accurate in comparison with the diffusion method. Obviously, this one is more simple to solve and it requires less computational resources than the other but, in some region of the spectrum, the given solution is not enough precise. For 33 energy groups and S4 approximation, a preliminary
calculation has been performed with two different reference libraries: ENDFB-6.8 and JEFF-3.1 to check the influences of the reference data (Table2):
Table 2 - keff comparison for diffusion and transport theory
Once defined the calculation mode and the reference library the reactivity calculation results depend on the Pnapproximation used in ECCO for the determination of the cross sections, from the Sn
approximation chosen in BISTRO and also from the energy grid used. The reactivity calculation results are shown in the following tables. Each table is relative to a different value of the discrete ordinate (4, 8, 16) and the keff values are submitted for different Pn approximations and energy groups.
Table 4 - keff comparison with N=8
Table 5 - keff comparison with N=16
In Tables 3-5 it can be noticed that the keff values decrease towards the critical condition according with
the increase of the calculations accuracy. However, the increase of the accuracy needs more computational resources and so the calculation time grows up.
The results shows that the increasing of Sn,from 4 to 16, and correspondingly the degree of the Pn
polynomial allow a more accurate analysis of this small system where leakage and neutron scattering has an important effect. About the different energy structures analyzed, even if for a fast reactor the standard 33 energy grid is used, the results obtained with 172 energy groups have be chosen to have a more fine characterization of the neutron spectrum up to the biological shield and to better carry on in the minor actinides analysis. About Pn approximation another important evidence is that P1
approximation is not suitable because the basic transport equation solved in this case is characterized by terms that not allow to take into account important information about the neutron transport phenomenon. Corrected P0 and P3 are much better, in both cases the results are very closed, so to carry
on the next analysis the P0 corrected results are chosen.
About the value of the discrete ordinates, it can be said that the best choice is represented by the S16
approximation because of the cylindrical shape of the core; this value of the angular ordinate ensures a more accurate calculation.
After this considerations all the other calculations and analysis have been carried out with 172 energy group structure, corrected P0 and S16 discrete ordinates approximations.
The reference keff is equal to 1.02461 and the reactivity of the system is:
𝜌 =𝐾𝑒𝑓𝑓− 1
𝐾𝑒𝑓𝑓 = 2402 𝑝𝑐𝑚
A first set of runs by Serpent code has been executed to estimate the keff values with the control rods in completely inserted, with the TAPIRO core maintained at room temperature.
8. Serpent model and preliminary results.
The Serpent code uses a universe-based geometry model for describing complicated structures, very similar to MCNP. This means that the geometry can be divided into separate levels, which are all constructed independently and nested one inside the other.
Values for geometry are taken from MCNP model of TAPIRO, with some differences. Reactor core, inner and outer reflector are faithfully reproduced, such as diametral, tangential, and radial 1 irradiation channels. Conversely radial channel 2 and source channel can’t be represented with the version used serpent (1.1.19), because they are not parallel to any axis (this option has been inserted in serpent 2). The TAPIRO control system is based on the regulation of the neutron escape from core. For this purpose, five copper cylindrical rods have been located in the inner reflector. Each of the rods can be withdrawn for a total axial length of 15 cm creating a void region of the same length in the reflector. In their withdrawal, the rods go down into apposite cavities in the lower part of the inner reflector. Two control rods of 7.5 cm of diameter are used as safety rods (SR1 and SR2) since they realize the greater negative reactivity insertion of the rods set. Safety rods are maintained completely inserted during normal operation and used for normal shutdown or for SCRAM. Two shim rods of 5.7 cm of diameter ensure the reactor rise to power (S1 and S2).
The fine adjustment of the criticality is obtained by the regulating rod. All results showed lately in this work has been obtained with all rods completely inserted, in order to have the highest possible value of neutron flux.
A further simplification compared to the real geometry of the research reactor is the representation as a regular parallelepiped of the part of concrete that surrounds the thermal column. This was possible because the region has a null neutronic relevance, so doesn't influence the aim of this work.
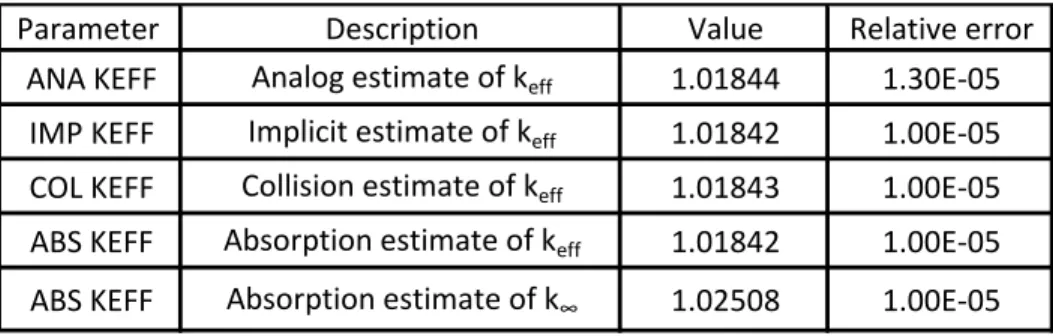
There are several ways that Serpent uses to calculate keff . The analog estimate looks at the entire
geometry, while the implicit estimate is calculated only in the universe set by the user. In addition the eigenvalue can be calculated using the collision estimate or the absorption estimate, that take into account different type of interaction between neutron and matter, and through which can be also calculated k∞(Table 6) .
Table 6 - keff Serpent results
9. MCNP model
The TAPIRO model implemented in MCNP code is the standard reference modelutilized for reactor operation and experiment modelling. It is actually constructed through surface-based cell volumes allowing a complete domain representation of both reactor core, reflector and irradiation channels.
Parameter Description Value Relative error
ANA KEFF Analog estimate of keff 1.01844 1.30E-05
IMP KEFF Implicit estimate of keff 1.01842 1.00E-05 COL KEFF Collision estimate of keff 1.01843 1.00E-05 ABS KEFF Absorption estimate of keff 1.01842 1.00E-05 ABS KEFF Absorption estimate of k∞ 1.02508 1.00E-05
The core is composed of a number of fuel cylindrical plates cooled by helium and a calibration pellet. The central part of the diametral channel is filled by radially oriented pellets as well.
The MCNP results presented here are obtained without the calibration pellet and with the central pellets inserted. In addition, the Safety Rods (SR1 and SR2) and Shim Rods (S1 and S2) are considered inserted.
Considered irradiation channels are the diametral channel, tangential channel and radial channel 1. They are all filled with air and the copper plugs are also removed.
Nuclear data library utilized is JEFF3-1 provided by NEA Data Bank and processed at 300 K. Model normalization is made at the flux peak according to standard reference [12].
Diametral channel characterization is obtained through flux evaluation and minor actinides fission and capture reaction rate. This is performed with the mesh tally MCNP feature through which a mesh is superimposed over the actual geometry to obtain the response in a customized calculation grid.
Preliminary results reported in this document constitute a first evaluation of requested quantities. Further optimized simulations are needed to compare long-running analog calculations and possible optimized variance reduction techniques.
The flux in the diametral channel and the fission reaction rates for all minor actinides are reported. Relative errors are mostly below 5%. By contrast Pu239 exhibits errors up to 33%-60% as depicted in error bars within the plot Figure 14 – 239Pu fission rate in the diametrical channel. In addition, Cm244 and Cm245 errors far from reactor core – namely in the external part of the reflector towards the shield – are as high as 12%-33% and 10%-34% respectively. Work reported in the future will include the same results with acceptable statistical uncertainties.
Within the present report, absorption reaction rates are not showed – as well as averaged absorption reaction rates – since stochastic errors are too high and Monte Carlo simulations require further optimizations.
10. Fluxes and reaction rates.
For the 172 energy groups, an energy integrated flux traverse, along one of the TAPIRO experimental channels (the diametrical one), has been shown in Figure 4, for both ERANOS and Serpent codes.
As diametral channel has the axis parallel to y-axis, this axis has been divided into 220 parts, one for centimeter, while on the XZ plane the mesh forms a square of 0.4 cm side. So each detector has a volume of 0.16 cm3. As showed in Figure 4 the neutron flux decrease rapidly outside the core, and became negligible outside the copper reflector, where few neutrons arrive, with a consequently increase of the statistical error of Monte Carlo calculations. The absence of neutron after the reflector is due to massive absorption of borated concrete.
Considering these issues and that for an irradiation problem must be used the highest possible value of flux, from now will be considered only the internal part of the diametral channel, from the core center until y = 50 cm.
Figure 4- Diametrical neutron flux comparison at 5 kW.
The highest value of the neutron flux is 3.00 x 10¹² [n/cm2s] [12], obtained in the centre of the core. The overall trend decreases moving from the core trough the shield with an important reduction at the interface core/reflector.
It is evident in the Figure 4 that there is a good agreement between the two codes; the total flux is characterized by the same trend and, as expected, by the same values in all the positions of the diametrical channel. Conversely, MCNP simulations show some minor discrepancies within the reactor core. Error bars are reported in the figure, even if small compared to plot scale.
The neutron flux expressed for energy groups is known as the neutron spectrum, this can be analyzed in different position in the reactor to evaluate the neutron balance and the neutron energy transition in the system. In this work the neutron spectrum has been determined in different position inside TAPIRO, among the diametrical channel to characterized this experimental channel and to choose the minor actinides samples position. The spectra analyzed are in the central part of the core, close to the boundary of the fuel, at the beginning of the reflector, in a position of the diametrical channel equivalent to the tangential channel distance, in the middle of the reflector and also in the middle of the shield.
The spectrum of TAPIRO in the centre of the core is shown in Figure 5 :
0.0E+00 5.0E+11 1.0E+12 1.5E+12 2.0E+12 2.5E+12 3.0E+12 3.5E+12 4.0E+12 0.00 5.00 10.00 15.00 20.00 25.00 30.00 35.00 40.00 45.00 50.00 N e u tr o n fl u x (n e u tr o n s/ cm 2s) Radius (cm)
Diametrical neutron flux
SERPENT ERANOS
Figure 5- TAPIRO central core spectrum comparison
The spectrum in Figure 5 with a peak around 820 keV, is a typical fission spectrum, this is a peculiarity of this reactor; for this reason TAPIRO is a unique reactor that can be used for calibration scopes. The Figure 5 shows an almost perfect coincidence of the neutron spectrum in the central part of the core, although the two codes have a different transport solution method.
The neutron spectrum evaluated in other positions of the system are shown in Figure 6-8 :
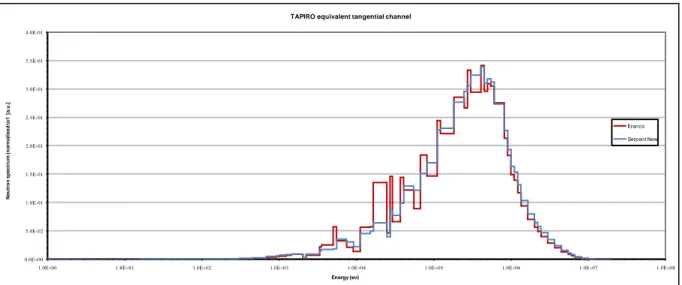
Figure 6- TAPIRO neutron spectrum in the equivalent tangential channel
The spectrum in the equivalent tangential channel position (Figure 6) shows a neutron transition from higher to epithermal energy, this is due to the neutron scattering in the copper reflector. In this case the neutron peak is near 450 keV.
1.0E-05 5.0E-02 1.0E-01 1.5E-01 2.0E-01 2.5E-01 3.0E-01
1.0E-04 1.0E-03 1.0E-02 1.0E-01 1.0E+00 1.0E+01 1.0E+02 1.0E+03 1.0E+04 1.0E+05 1.0E+06 1.0E+07 1.0E+08
N e u tr o n spe ctr u m ( n o rm a li sed t o 1 ) [a .u .] Energy (eV)
Tapiro central core spectrum comparison
SERPENT ERANOS 0.0E+00 5.0E-02 1.0E-01 1.5E-01 2.0E-01 2.5E-01 3.0E-01 3.5E-01 4.0E-01
1.0E+00 1.0E+01 1.0E+02 1.0E+03 1.0E+04 1.0E+05 1.0E+06 1.0E+07 1.0E+08
N e u tr o n s p e c tr u m ( n o rm a li s e d t o 1 [ a .u .] Energy (ev)
TAPIRO equivalent tangential channel
Eranos
Figure 7 - TAPIRO central reflector spectrum comparison
The spectrum in the reflector center, Figure 7, has the same characteristic of the previous one, in this case the peak is near 300 keV. Figure 7 is still characterized by a good agreement with some differences due to the different geometry description, more accurate in SERPENT, where the influence of different materials and their interfaces is more dominant than in ERANOS, and even for the statistical influences that affected SERPENT.
Figure 8- TAPIRO neutron spectrum in the middle of the shield
In the last spectra position, in shield center (Figure 8), it can be noticed that the neutron spectrum in the selected points of the diametrical channel is characterized by a progressive transition from a nearly fission spectrum in the in core position of the channel to a progressive softening moving to peripheral positions. The thermal neutron population that is negligible at core center progressively growth with the detector distance from the core axis.
This is evident by the growth of the curve at lower energies, in this case the spectrum has a peak near 250 keV. 0.0E+00 5.0E-02 1.0E-01 1.5E-01 2.0E-01 2.5E-01 3.0E-01
1.0E-05 1.0E-04 1.0E-03 1.0E-02 1.0E-01 1.0E+00 1.0E+01 1.0E+02 1.0E+03 1.0E+04 1.0E+05 1.0E+06 1.0E+07
N e u tr o n spe ctr u m ( n o rm a li sed t o 1 ) [a .u .] Energy (eV)
Tapiro central reflector spectrum comparison
SERPENT ERANOS 0.0E+00 2.0E-02 4.0E-02 6.0E-02 8.0E-02 1.0E-01 1.2E-01 1.4E-01 1.6E-01
1.0E-02 1.0E-01 1.0E+00 1.0E+01 1.0E+02 1.0E+03 1.0E+04 1.0E+05 1.0E+06 1.0E+07
N e u tr o n s p e c tr u m ( n o rm a li s e d t o 1 ) [a .u .] Energy (ev)
TAPIRO hals shield spectrum
Eranos
Another important aspect to analyze the importance of the fast, epithermal and thermal flux in the whole system is the evaluation of the neutron flux distribution in four macro-energy zones. The choice of these four macro zones has been finalized to the analysis of the neutron spectrum in relation to the possibility to evaluate the behavior of different minor actinides, considering in the following paragraphs, in the various positions of the system.
Then a comparison between the neutron flux distribution in the four macro-energy zones can be done:
Figure 9 - Flux in macro energy zones comparison
The trend shows in Figure 9 for both calculation codes is very similar. Figure 9 shows the predominance of the flux between 1 MeV and 100 keV till the second half of the reflector, where the epithermal flux (100 keV - 1 keV) become dominant. The thermal flux (1 keV - 0.1 eV) is important just in the last part of the shield due to the presence of light nuclides. The high energy flux (19 MeV - 1 MeV) is significant in the core where many high energy neutrons are generated from the fissions, and just a little bit in the first part of the reflector. The only noticeable difference can be found in the energy group between 1 MeV and 1 keV, but only after the middle of the reflector. This differences can be justified with the presence of some interfaces in the geometry used for SERPENT, interfaces that causes a decrease of the number of neutrons with energy between 1 MeV and 100 keV due to scattering.
These comparisons allow to conclude that the results of the flux calculation obtained with ERANOS can be considered very reliable.
A reaction rate is defined as the product between the macroscopic cross section that characterize a particular reaction and the neutron flux. It expresses the number of reactions per unit time (1/s):
𝑅(𝑟⃗) =< 𝜎(𝑟⃗, 𝐸)𝜙(𝑟,⃗⃗⃗ 𝐸) >𝐸
Where the <>E represents the integration over energy. These information are very important to describe
the behavior of different actinides relative to the fission and capture reactions, in different position of TAPIRO. The minor actinides that have been considered in this work are a small part of those that were
0.00E+00 1.00E-01 2.00E-01 3.00E-01 4.00E-01 5.00E-01 6.00E-01 7.00E-01 0 10 20 30 40 50 N e u tr o n fl u x [ a .u .] Radius (cm)
Diametrical neutron flux in different energy zones 19 MeV - 1 MeV Eranos 19 MeV - 1 MeV Serpent 1 MeV- 100 keV Eranos 1 MeV - 100 keV Serpent 100 keV - 1 keV Eranos 100 keV - 1 keV Serpent 1 keV - 1E-01 eV Eranos 1 keV - 1E-01 eV Serpent
used in an experiment performed in the U.S. at INL (Idaho National Laboratory) [13]. These minor actinides are shown in Table 6:
Table 7 - Minor actinides chosen for a preliminary analysis in TAPIRO
Thanks to the previous flux calculation, it was possible to determine the fission and the capture reaction rates for all the tabled minor actinides, along the diametrical channel of TAPIRO, these are shown in Figures 10-31.
Figure 10 - 235U fission rate in the diametrical channel.
Figure 11 - 238U fission rate in the diametrical channel.
Uranium Plutonium Neptunium Americium Curium 235 U 239Pu 237Np 241Am 243Cm 238 U 241Pu / 243Am 244Cm / 242Pu / / 245Cm 0.0E+00 5.0E+11 1.0E+12 1.5E+12 2.0E+12 2.5E+12 3.0E+12 3.5E+12 4.0E+12 4.5E+12 5.0E+12
0.00E+00 5.00E+00 1.00E+01 1.50E+01 2.00E+01 2.50E+01 3.00E+01 3.50E+01 4.00E+01 4.50E+01 5.00E+01
Fis si on ra te [ fi ss ion s/ s] Radius [cm]
Fission rate 235U diametrical channel
Serpent Eranos 0.0E+00 1.0E+11 2.0E+11 3.0E+11 4.0E+11 5.0E+11 6.0E+11 7.0E+11
0.00E+00 5.00E+00 1.00E+01 1.50E+01 2.00E+01 2.50E+01 3.00E+01 3.50E+01 4.00E+01 4.50E+01 5.00E+01
Fis si on ra te [ fi ss ion s/ s] Radius [cm]
Fission rate 238U diametrical channel
Serpent Eranos
Figure 12 - 235U capture rate in the diametrical channel.
Figure 13 - 238U capture rate in the diametrical channel.
The two isotopes of uranium considered have a similar trend (Figures Figure 10-13), about the shape of the curve. 235U is higher than 238U both for capture and fission rates, and the maximum value is located in the centre of the core. 235U (Figure 10), as expected from a fissile isotope, is capable of sustaining nuclear fission with neutrons of any energy. As expected from flux traverse behavior, fission rate is higher in core center, but has a relative maximum near the end of reflector, where the number of thermal and epithermal neutron begin to be consistent. 238U is practically insensitive to thermal neutron, while has a great affinity with fast fissions, so its fission rate (Figure 11) is more regular and narrow and about one order of magnitude lower than 235U. Capture reaction rates have a behavior less regular, with a little relative maximum just out of the core, probably due to scattering into inconel, and a bigger maximum at the end of outer reflector. The second peak is particularly evident in 238U capture rate (Figure 13 ) only for the Serpent estimation.
The differences between the two codes are negligible inside the core and then gradually increase moving to the reflector and the shield. Obviously, these differences depend on the different value of the cross sections of the two isotopes, of the geometry description, fluxes evaluation and of the Serpent statistic.
In all Serpent simulations relative errors are contained in the range between 0.6% and 25%, as conversely showed in Monte Carlo simulation. Obviously the highest dispersion for all isotopes reaction rates are located in the last few points at the extremities of the traverses. The results are
0.0E+00 1.0E+11 2.0E+11 3.0E+11 4.0E+11 5.0E+11 6.0E+11 7.0E+11
0.00E+00 5.00E+00 1.00E+01 1.50E+01 2.00E+01 2.50E+01 3.00E+01 3.50E+01 4.00E+01 4.50E+01 5.00E+01
C ap tu re ra te [ca p tu res /s ] Radius [cm]
Capture rate 235U diametrical channel
Serpent Eranos
Core Reflector Shielding
0.0E+00 5.0E+10 1.0E+11 1.5E+11 2.0E+11 2.5E+11 3.0E+11 3.5E+11
0.00E+00 5.00E+00 1.00E+01 1.50E+01 2.00E+01 2.50E+01 3.00E+01 3.50E+01 4.00E+01 4.50E+01 5.00E+01
C ap tu re ra te [ ca p tu re s/ s] Radius [cm]
Capture rate 238U diametrical channel
Serpent Eranos
compatible with the estimated neutron flux traverse, since value of reaction rates in a point is never greater than flux value in the same point.
MCNP simulations exhibit a good agreement for 235U even taking into account the relative errors reported in the plot. By contrast, 238U fission reaction rates are different even taking into account for the error gaps. Error bars are reported in the figure.
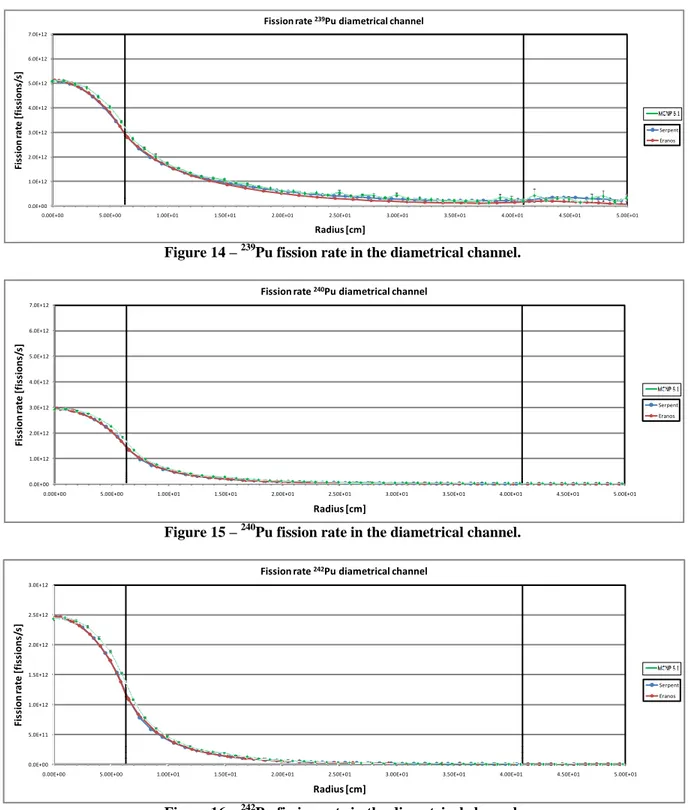
Figure 14 – 239Pu fission rate in the diametrical channel.
Figure 15 – 240Pu fission rate in the diametrical channel.
Figure 16 – 242Pu fission rate in the diametrical channel.
0.0E+00 1.0E+12 2.0E+12 3.0E+12 4.0E+12 5.0E+12 6.0E+12 7.0E+12
0.00E+00 5.00E+00 1.00E+01 1.50E+01 2.00E+01 2.50E+01 3.00E+01 3.50E+01 4.00E+01 4.50E+01 5.00E+01
Fis si on ra te [ fi ss ion s/ s] Radius [cm]
Fission rate 239Pu diametrical channel
Serpent Eranos 0.0E+00 1.0E+12 2.0E+12 3.0E+12 4.0E+12 5.0E+12 6.0E+12 7.0E+12
0.00E+00 5.00E+00 1.00E+01 1.50E+01 2.00E+01 2.50E+01 3.00E+01 3.50E+01 4.00E+01 4.50E+01 5.00E+01
Fis si on ra te [ fi ss ion s/ s] Radius [cm]
Fission rate 240Pu diametrical channel
Serpent Eranos 0.0E+00 5.0E+11 1.0E+12 1.5E+12 2.0E+12 2.5E+12 3.0E+12
0.00E+00 5.00E+00 1.00E+01 1.50E+01 2.00E+01 2.50E+01 3.00E+01 3.50E+01 4.00E+01 4.50E+01 5.00E+01
Fis si on ra te [ fi ss ion s/ s] Radius [cm]
Fission rate 242Pu diametrical channel
Serpent Eranos
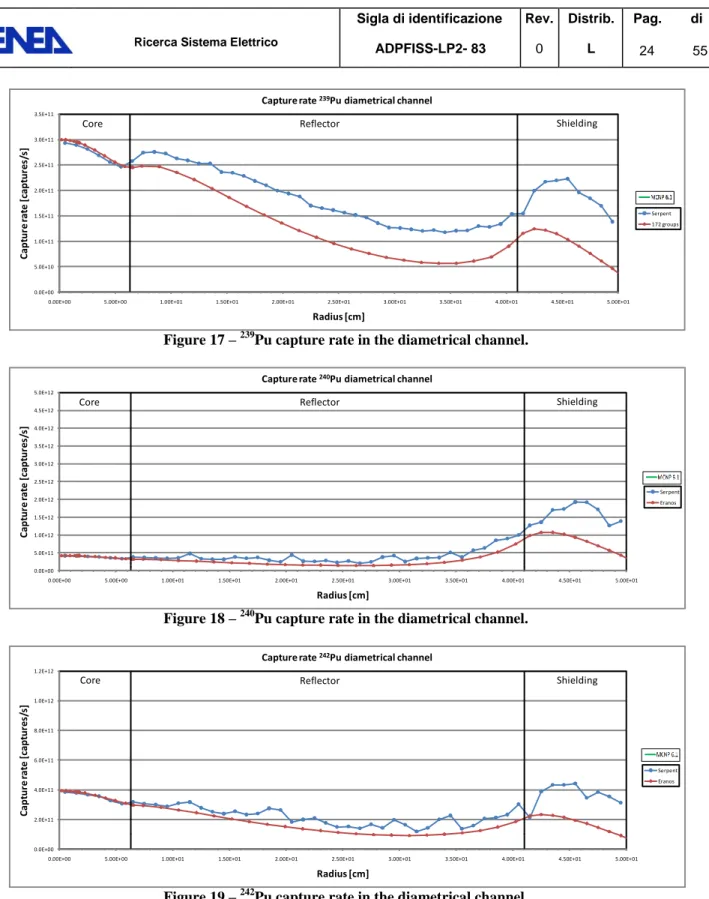
Figure 17 – 239Pu capture rate in the diametrical channel.
Figure 18 – 240Pu capture rate in the diametrical channel.
Figure 19 – 242Pu capture rate in the diametrical channel.
Regarding plutonium, has been considered three isotopes, 239Pu, largely produced in nuclear plants from absorption of 238U and often used in nuclear weapons, that represent about 0.8% of spent nuclear fuel and has an half-life of 24100 years, 240Pu, a fertile isotopes produced by absorption from 239Pu, with an half-life of 6563 years, and 242Pu, an isotopes of plutonium with low radioactivity, about 15 times less than 239Pu, but the second longest lived, with an half-life of 373300 years.
0.0E+00 5.0E+10 1.0E+11 1.5E+11 2.0E+11 2.5E+11 3.0E+11 3.5E+11
0.00E+00 5.00E+00 1.00E+01 1.50E+01 2.00E+01 2.50E+01 3.00E+01 3.50E+01 4.00E+01 4.50E+01 5.00E+01
C ap tu re ra te [ ca p tu re s/ s] Radius [cm]
Capture rate 239Pu diametrical channel
Serpent 172 groups
Core Reflector Shielding
0.0E+00 5.0E+11 1.0E+12 1.5E+12 2.0E+12 2.5E+12 3.0E+12 3.5E+12 4.0E+12 4.5E+12 5.0E+12
0.00E+00 5.00E+00 1.00E+01 1.50E+01 2.00E+01 2.50E+01 3.00E+01 3.50E+01 4.00E+01 4.50E+01 5.00E+01
C ap tu re ra te [ ca p tu re s/ s] Radius [cm]
Capture rate 240Pu diametrical channel
Serpent Eranos
Core Reflector Shielding
0.0E+00 2.0E+11 4.0E+11 6.0E+11 8.0E+11 1.0E+12 1.2E+12
0.00E+00 5.00E+00 1.00E+01 1.50E+01 2.00E+01 2.50E+01 3.00E+01 3.50E+01 4.00E+01 4.50E+01 5.00E+01
C ap tu re ra te [ ca p tu re s/ s] Radius [cm]
Capture rate 242Pu diametrical channel
Serpent Eranos
For the fission rates (Figures 14-16), it is possible to see a trend similar to the uranium isotopes. The fissions of the 239Pu are more evident in the core respect to the other, this is a fissile isotope.
The MCNP comparison shows a deviation in the core-reflector region. Error gaps are reported in the figure, even if small compared to plot scale.
Instead, the capture rates (Figures 17-19) is completely different; the decrease moving away from the core is lighter and in the second part of the reflector, the reaction rate start to increase reaching a peak just after the shield interface and then goes down very quickly, thanks to the rapid reduction of the neutron flux. This phenomenon is more evident for 240Pu whose peak is one order of magnitude bigger than the peaks of the other two isotopes. It is important to notice that for 240Pu this peak is higher than the value reached inside the core.
For the fission rates two codes are in completely harmony instead of capture rates where the differences are evident, especially in 239Pu capture rate.
Figure 20 – 237Np fission rate in the diametrical channel.
Figure 21 – 237Np capture rate in the diametrical channel.
First of minor actinides taken into account is neptunium, and precisely its most stable isotope, 237Np, with an half-life of 2.14·106 years. It is the only neptunium isotope produced in significant quantity in the nuclear fuel cycle, both by successive neutron capture by 235U (which fissions most but not all of the time) and 237U, or (n,2n) reactions where a fast neutron occasionally knocks a neutron loose from
238
U or isotopes of plutonium. 237Np also formed into spent nuclear fuel as the decay product of 241Am, but it happens only on long period.
0.0E+00 5.0E+11 1.0E+12 1.5E+12 2.0E+12 2.5E+12 3.0E+12 3.5E+12
0.00E+00 5.00E+00 1.00E+01 1.50E+01 2.00E+01 2.50E+01 3.00E+01 3.50E+01 4.00E+01 4.50E+01 5.00E+01
Fis si on ra te [ fi ss ion s/ s] Radius [cm]
Fission rate 237Np diametrical channel
Serpent Eranos 0.0E+00 2.0E+11 4.0E+11 6.0E+11 8.0E+11 1.0E+12 1.2E+12 1.4E+12
0.00E+00 5.00E+00 1.00E+01 1.50E+01 2.00E+01 2.50E+01 3.00E+01 3.50E+01 4.00E+01 4.50E+01 5.00E+01
C ap tu re ra te [ ca p tu re s/ s] Radius [cm]
Capture rate 237Np diametrical channel
Serpent Eranos
Even if 237Np is predicted to be fissile, like other odd isotopes, its fissionability has been experimentally showed [14]. This justify the behavior of fission reaction rate (Figure 20), similar to fissionable isotopes, while capture reaction rates has two relatives maximum coincident with the begin and the end of the reflector (Figure 21).
It can be noticed that near the interfaces between the core and the reflector, and the core and the shield there are small and rapid variations of the reaction rates. The reason is the interface effect that affects a deterministic calculation system like ERANOS. This effect occurs also in the other isotopes but in some cases is less evident.
Relatives errors are between 0.4% into the core and 6% into the external points of diametral channel. In the capture cross section there is an evident Serpent overestimation among whole channel instead of the perfect overlapping between both codes.
MCNP exhibits the same trend in overestimating the reaction rates for 237Np within the central core-reflector region. Error bars are reported in the figure, even if small compared to plot scale.
Most common and stable isotopes of americium, 241Am and 243Am, has been selected to be simulated.
241
Am,with half lives of 432.2 years, derives from decays of some isotopes of plutonium (241Pu), curium (241Cm) and berkelium, while 243Am, with half-life of 7370 years, derives mainly from 242mAm or 243Pu in nuclear fuel cycle.
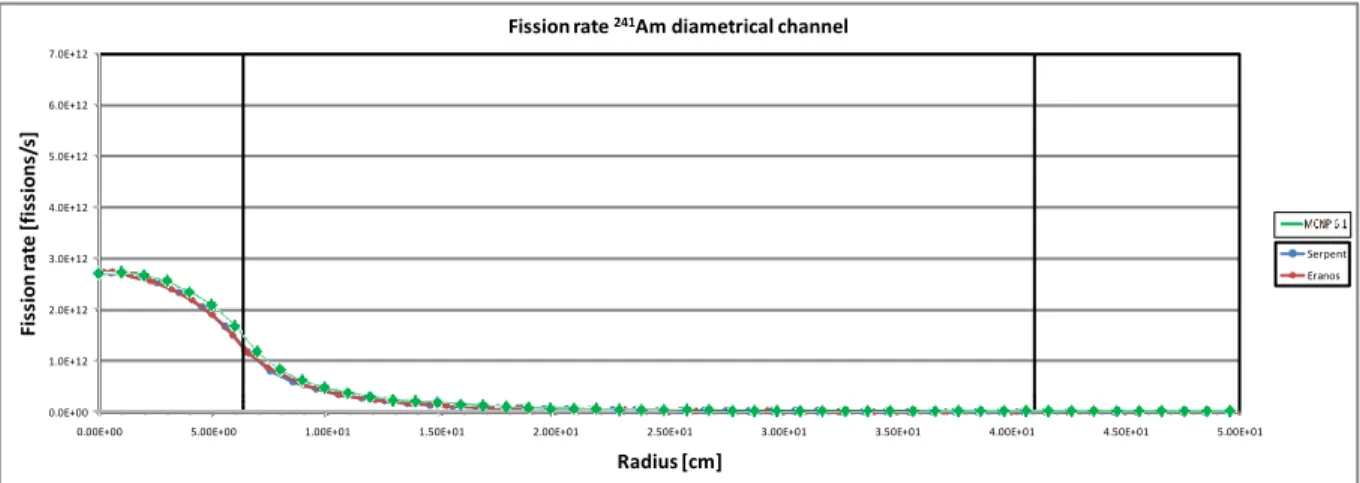
For americium isotopes 241 and 243 shown in Figures 22-25 it is possible to see a decreasing trend from the centre of the core, with a small peak at the beginning of the shield for the capture rate. An important consideration is that for americium, and also for neptunium, the reaction rates are of the same order of magnitude, differently from the case of uranium, plutonium and also curium, as shown in Figures 20-21, where the fission rate is bigger.
Figure 22 – 241Am fission rate in the diametrical channel.
0.0E+00 1.0E+12 2.0E+12 3.0E+12 4.0E+12 5.0E+12 6.0E+12 7.0E+12
0.00E+00 5.00E+00 1.00E+01 1.50E+01 2.00E+01 2.50E+01 3.00E+01 3.50E+01 4.00E+01 4.50E+01 5.00E+01
Fis si on ra te [ fi ss ion s/ s] Radius [cm]
Fission rate 241Am diametrical channel
Serpent Eranos
Figure 23 – 243Am fission rate in the diametrical channel.
Figure 24 – 241Am capture rate in the diametrical channel.
Figure 25 – 243Am capture rate in the diametrical channel.
MCNP simulations for 241Am and 243Am fission reaction rates present an overestimation within the inner portion of the reflector as well as the reactor core. Errors are reported in the figure, even if small compared to plot scale.
Capture rates are about one order of magnitude lower from fission rates, and all results are compatible with the estimated flux traverse, the harmony between both code is better than in plutonium isotopes
0.0E+00 5.0E+11 1.0E+12 1.5E+12 2.0E+12 2.5E+12
0.00E+00 5.00E+00 1.00E+01 1.50E+01 2.00E+01 2.50E+01 3.00E+01 3.50E+01 4.00E+01 4.50E+01 5.00E+01
Fis si on ra te [ fi ss ion s/ s] Radius [cm]
Fission rate 243Am diametrical channel
Serpent Eranos 0.0E+00 2.0E+11 4.0E+11 6.0E+11 8.0E+11 1.0E+12 1.2E+12 1.4E+12 1.6E+12 1.8E+12
0.00E+00 5.00E+00 1.00E+01 1.50E+01 2.00E+01 2.50E+01 3.00E+01 3.50E+01 4.00E+01 4.50E+01 5.00E+01
C ap tu re ra te [ ca p tu re s/ s] Radius [cm]
Capture rate 241Am diametrical channel
Serpent Eranos
Core Reflector Shielding
0.0E+00 2.0E+11 4.0E+11 6.0E+11 8.0E+11 1.0E+12 1.2E+12 1.4E+12 1.6E+12
0.00E+00 5.00E+00 1.00E+01 1.50E+01 2.00E+01 2.50E+01 3.00E+01 3.50E+01 4.00E+01 4.50E+01 5.00E+01
C ap tu re ra te [ ca p tu re s/ s] Radius [cm]
Capture rate 243Am diametrical channel
Serpent Eranos
rates. Relative errors for Serpent evaluation are between 0.07% and 5.5% for capture rate simulations and between 0.07% and 4% for fission rate simulations.
Figure 26 – 243Cm fission rate in the diametrical channel.
Figure 27 – 244Cm fission rate in the diametrical channel.
Figure 28 – 245Cm fission rate in the diametrical channel.
0.0E+00 1.0E+12 2.0E+12 3.0E+12 4.0E+12 5.0E+12 6.0E+12 7.0E+12
0.00E+00 5.00E+00 1.00E+01 1.50E+01 2.00E+01 2.50E+01 3.00E+01 3.50E+01 4.00E+01 4.50E+01 5.00E+01
Fis si on ra te [ fi ss ion s/ s] Radius [cm]
Fission rate 243Cm diametrical channel
Serpent Eranos 0.0E+00 1.0E+12 2.0E+12 3.0E+12 4.0E+12 5.0E+12 6.0E+12 7.0E+12
0.00E+00 5.00E+00 1.00E+01 1.50E+01 2.00E+01 2.50E+01 3.00E+01 3.50E+01 4.00E+01 4.50E+01 5.00E+01
Fis si on ra te [ fi ss ion s/ s] Radius [cm]
Fission rate 244Cm diametrical channel
Serpent Eranos 0.0E+00 1.0E+12 2.0E+12 3.0E+12 4.0E+12 5.0E+12 6.0E+12 7.0E+12
0.00E+00 5.00E+00 1.00E+01 1.50E+01 2.00E+01 2.50E+01 3.00E+01 3.50E+01 4.00E+01 4.50E+01 5.00E+01
Fis si on ra te [ fi ss ion s/ s] Radius [cm]
Fission rate 245Cm diametrical channel
Serpent Eranos
Figure 29 – 243Cm capture rate in the diametrical channel.
Figure 30 – 244Cm capture rate in the diametrical channel.
Figure 31 – 245Cm capture rate in the diametrical channel.
Most common isotopes of curium in spent fuel are 243Cm, 244Cm and 245Cm, respectively having half life of 29.1, 18.1 and 8500 years.
These elements show a regular decreasing trend for the fission rate (Figures 26-31) and a small peak in the first part of the shield.
0.0E+00 2.0E+10 4.0E+10 6.0E+10 8.0E+10 1.0E+11 1.2E+11 1.4E+11 1.6E+11
0.00E+00 5.00E+00 1.00E+01 1.50E+01 2.00E+01 2.50E+01 3.00E+01 3.50E+01 4.00E+01 4.50E+01 5.00E+01
C ap tu re ra te [ ca p tu re s/ s] Radius [cm]
Capture rate 243Cm diametrical channel
Serpent Eranos
Core Reflector Shielding
0.0E+00 2.0E+11 4.0E+11 6.0E+11 8.0E+11 1.0E+12 1.2E+12 1.4E+12 1.6E+12 1.8E+12 2.0E+12
0.00E+00 5.00E+00 1.00E+01 1.50E+01 2.00E+01 2.50E+01 3.00E+01 3.50E+01 4.00E+01 4.50E+01 5.00E+01
C ap tu re ra te [ ca p tu re s/ s] Radius [cm]
Capture rate 244Cm diametrical channel
Serpent Eranos
Core Reflector Shielding
0.0E+00 1.0E+11 2.0E+11 3.0E+11 4.0E+11 5.0E+11 6.0E+11
0.00E+00 5.00E+00 1.00E+01 1.50E+01 2.00E+01 2.50E+01 3.00E+01 3.50E+01 4.00E+01 4.50E+01 5.00E+01
C ap tu re ra te [ ca p tu re s/ s] Radius [cm]
Capture rate 245Cm diametrical channel
Serpent Eranos
Regarding 244Cm, Serpent's databases doesn't contain data on total fission (MT = 18), and fission is given using the partial modes, so results showed are the sum of first and second-chance fissions (MT = 19 and 20). Fission rate obtained (Figure27) shows a typical even isotope behavior.
Moreover, MCNP simulations for 243Cm, 244Cm and 245Cm fission reaction rates present aslight overestimation in the inner portion of the reflector as well as the reactor core – which is quite within calculation errors.
Capture rates (Figures from 29 to 31) showed different trends. If 243Cm has its maximum at the end of the core, with another important peak at the end of reflector, with 244Cm captures are more likely in core center.
Behavior of 245Cm capture rate is similar to fission rate, but again with two small relative maximum. Relative errors are between 0.05% and 2.5% in all cases, except for fission of 244Cm. In fact errors related to MT = 20, due to lack of statistics, are elevated. Errors for total fission rate are calculated with the quadratic sum, because of the independence of functions leads to a null variance.Total fission rate errors are between 0.65% and 11%.
10.1 Average Microscopic Cross Sections
The possibility to extract flux and reaction rates traverses allow to have all the data to determine the average microscopic cross sections, relatives to the capture and fission of the selected minor actinides. The simple calculation has been performed using Microsoft Excel. The average microscopic cross sections have been calculated along the diametrical channel of TAPIRO and are defined as:
𝜎̅(𝑟⃗) = < 𝜎(𝑟⃗, 𝐸)𝜙(𝑟,⃗⃗⃗ 𝐸) >𝐸 < 𝜙(𝑟,⃗⃗⃗ 𝐸) >𝐸
Where σ is the microscopic cross section and φ is the neutron flux. This parameter has been obtained as a ratio between the reaction rate and the flux for all meshes, along the diametrical channel. The average microscopic cross sections for all the selected minor actinides are shown in the following pages.
The MCNP simulation comparison is just preliminary since the relative errors need to be reduced and variance optimization possibly has to be implemented. Anyhow only fission reaction rates are presented in the present paragraph.
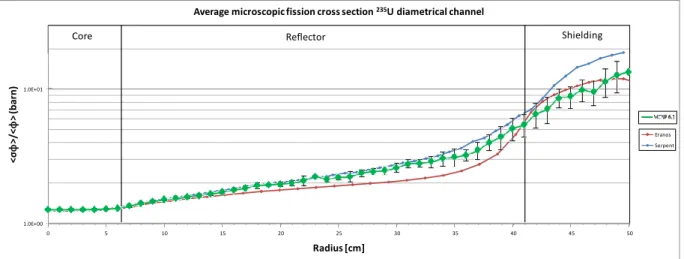
Figure 32 - 235U average microscopic fission cross sections
1.0E+00 1.0E+01 0 5 10 15 20 25 30 35 40 45 50 <σ ϕ >/ < ϕ > (b ar n ) Radius [cm]
Average microscopic fission cross section 235U diametrical channel
Eranos Serpent
Figure 33 - 238U average microscopic fission cross sections
As we can see in Figure 32 , values of 235U fission cross section have a monotonic increase, passing from fast to epithermal and thermal spectrum, as expecting from a fertile material reaching about 20 b in the points far from core center, while 238U fission cross section (Figure Figure 33), like expected from a fertile material, is higher and about constant into the core, where neutrons are fast, and rapidly decrease where neutrons become epithermal and thermal, passing from 0.2 to 0.001 b.
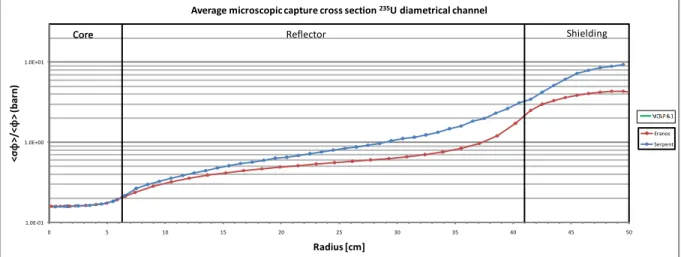
Figure 34 - 235U average microscopic capture cross sections
1.0E-04 1.0E-03 1.0E-02 1.0E-01 0 5 10 15 20 25 30 35 40 45 50 <σ ϕ >/ < ϕ > (b ar n ) Radius [cm]
Average microscopic fission cross section 238U diametrical channel
Eranos Serpent
Core Reflector Shielding
1.0E-01 1.0E+00 1.0E+01 0 5 10 15 20 25 30 35 40 45 50 <σ ϕ >/ < ϕ > (b ar n ) Radius [cm]
Average microscopic capture cross section 235U diametrical channel
Eranos Serpent
Core Reflector Shielding
Figure 35 - 238U average microscopic capture cross sections
Regarding capture cross section, Figures 34 and Figure 35 showed a behavior increasing starting from center, revealing that captures are more likely with slow neutrons. Changes of inclination correspond to relative maximum of reaction rates.
Relatives errors are between 0.007% and 2% for 235U cross sections, and between 0.07% and 20% for
238
U cross sections.
Figure 36 – 239Pu average microscopic fission cross sections
1.0E-02 1.0E-01 1.0E+00 1.0E+01 0 5 10 15 20 25 30 35 40 45 50 <σ ϕ >/ < ϕ > (b ar n ) Radius [cm]
Average microscopic capture cross section 238U diametrical channel
Eranos Serpent
Core Reflector Shielding
1.0E+00 1.0E+01 0 5 10 15 20 25 30 35 40 45 50 <σ ϕ >/ < ϕ > (b ar n ) Radius [cm]
Average microscopic fission cross section 239Pu diametrical channel
Eranos Serpent
Core Reflector Shielding
Figure 37 – 240Pu average microscopic fission cross sections
Figure 38 – 242Pu average microscopic fission cross sections
The differences emerged for uranium fission are still present for plutonium fission (Figures 36-38). The average microscopic fission cross sections are more close in the core and then they follow a very different trend: 239Pu increases moving to the shield while the others decrease. In fact the odd isotopes of plutonium is fissile while the other two are fertile.
1.0E-01 1.0E+00 1.0E+01 0 5 10 15 20 25 30 35 40 45 50 <σ ϕ >/ < ϕ > (b ar n ) Radius [cm]
Average microscopic fission cross section 240Pu diametrical channel
Eranos Serpent
Core Reflector Shielding
1.0E-02 1.0E-01 1.0E+00 1.0E+01 0 5 10 15 20 25 30 35 40 45 50 <σ ϕ >/ < ϕ > (b ar n ) Radius [cm]
Average microscopic fission cross section 242Pu diametrical channel
Eranos Serpent