Article
Geopolymerization Ability of Natural and Secondary
Raw Materials by Solubility Test in Alkaline Media
Barbara Liguori1,* ID, Ilaria Capasso1, Marco De Pertis2, Claudio Ferone2 ID and Raffaele Cioffi2
1 Dipartimento di Ingegneria Chimica, dei Materiali e della Produzione Industriale, Università Federico II, 80125 Napoli, Italy; [email protected]
2 Dipartimento di Ingegneria, Università Parthenope, 80143 Napoli, Italy;
[email protected] (M.D.P.); [email protected] (C.F.); [email protected] (R.C.)
* Correspondence: [email protected]; Tel.: +39-081-768-2395 Received: 17 July 2017; Accepted: 9 August 2017; Published: 11 August 2017
Abstract:The extent of the dissolution of aluminosilicate compounds is crucial, since the amount of Si and Al initially dissolved is essential for the following polycondensation and can strongly influence physical and mechanical performances of the final product. In order to set up a method to test the ability of a material to react in alkaline media, different aluminosilicate sources have been selected: a mineral resource (a zeolitized tuff), an industrial by product (silt from washing process of construction and demolition wastes), a heat treated clay sediment and a calcined clay (metakaolin). Two test methods, static and dynamic, have been applied to evaluate the attitude of a silicoaluminate precursor to give a geopolymerization reaction. In particular, a fixed amount of precursor was put into contact with a alkaline solution under continuous stirring or in static conditions at 60◦C for fixed times. The dynamic test method seems to be more suitable, since it is faster and requires lower amounts of reactants (solution). Moreover, the dynamic test provides a reactivity sequence (ordered from the more to the less reactive precursor) metakaolin > treated clay sediment > zeolitized tuff≈silt both for Si and Al release, which is coherent with the performances of geopolymers obtained by using the above precursors.
Keywords:raw materials; geopolymer; solubility test; alkaline media
1. Introduction
Investigations in the field of alkali activated materials had an exponential increase starting from 1978 after the research results of the French author Davidovits, who developed and patented binders obtained from the alkali-activation of metakaolin and named them after with the term “geopolymer”. Synthesis of geopolymers is based on the reaction of aluminosilicate materials with an alkali metal hydroxide and an alkali metal salt and their transformation into a three-dimensional inorganic amorphous structure [1]. During the last decades, geopolymers have drawn the attention of the scientific community throughout the world, due to their excellent mechanical properties and their high fire and acid resistance. Moreover, geopolymers have long been studied as an alternative to traditional cements, and are now attracting increased attention for their low CO2emissions, durability and low
production costs [2,3].
In theory, any pozzolanic compound or source of reactive silica and alumina which is able to readily react with alkali, can act as a geopolymer precursor under certain conditions [4,5]. In fact, the formation of geopolymers from natural minerals [5,6], calcined clays [7,8], industrial by-products [9–12] or a combination of them [13–15] has been widely explored. In the last decades, due to the increasing
cost of raw materials and the continuous reduction of natural resources, the selection of sustainable alumina-silicate materials has become imperative.
The formation of a geopolymer is a result of several chemical reactions, which starting from an amorphous silico-aluminate source, lead to a 3D-structure (Figure1). The geopolymerization can be scheduled as follows:
Environments 2017, 4, x FOR PEER REVIEW 2 of 13
The formation of a geopolymer is a result of several chemical reactions, which starting from an amorphous silico-aluminate source, lead to a 3D-structure (Figure 1). The geopolymerization can be scheduled as follows:
Figure 1. Geopolimerization reactions.
The extent of the dissolution of aluminosilicate compounds is crucial, since the amount of Si and Al initially dissolved is essential for the following polycondensation and can strongly influence physical and mechanical performances of the final product.
Many papers have been published on the dissolution of aluminosilicate, especially in the geochemical literature [16,17]. However, there is a lack of data concerning the behavior in alkaline media of secondary raw materials, often proposed as a precursor of geopolymers at an industrial scale. Accordingly, it is extremely interesting focusing scientific studies on the individuation of a method that could evaluate the “geopolymerising” capacity of different materials.
Solubility tests in alkaline solution allow the direct determination of the amount of reactive silicate and aluminate species. Several test regimes can be found in literature [5,16,17]. Numerous parameters can affect the solubilisation of silicon and aluminum in alkaline media, such as the molarity of the solution, the solid-to liquid ratio, the time of contact and the mixing conditions.
In order to set up a method to test the ability of a material to react in alkaline media, different aluminosilicate sources have been selected: a mineral resource (a zeolitized tuff), an industrial by product (silt from washing process of construction and demolition wastes), a clay sediment and a calcined clay (metakaolin). The selected materials change as concern origin, chemical and mineralogical composition and pre-treatment conditions.
2. Experimental
The experimental part consisted of three steps: (1) the chemical and mineralogical characterization of the studied materials; (2) the evaluation of the parameters affecting the dissolution rate of the starting solids, such as Si/Al and heat treatment; (3) the examination of the residual solids after leaching.
Four different materials were selected as raw materials: a mineral source (a zeolitized tuff, Neapolitan Yellow Tuff, indicated as NYT), an industrial by product (silt, S), a Heat treated Clay Sediment (HCS) and a calcined clay (metakaolin, MK).
The zeolitized tuff is a phillipsite-rich tuff (Si/Al = 2.7) from a Marano (Naples, Italy) cave. Tuff sample was dried overnight at 60 °C and stored at controlled humidity (Relative Humidity = 50%).
The silt (Si/Al = 2.39) was provided by IPS (Italy) and derives from the washing process of construction and demolition wastes. Silt sample was dried overnight at 105 °C and milled to form a fine powder.
The clay sediment (CS), (Si/Al = 2.77), was collected from a reservoir (Sabetta, Morigerati, Salerno) located in the south of Italy and treated up to 750 °C, in order to enhance its reactivity [18].
The metakaolin powder, which is commonly used as precursor for geopolymerization, was provided by Neuvendis (Si/Al = 1.1).
In order to evaluate the influence of thermal treatment on the reactivity, a phillipsite rich- tuff was selected. In particular, a weighted amount of tuff was heat treated in air at different temperatures from 400 to 800 °C, using a Nabertherm HTC 03/15 oven.
The chemical composition of the raw materials was obtained, according to the following procedure: they were first calcined at 550 °C for 2 h, then a weighted amount of the dry samples was subjected to digestion, under microwave-induced heating (Perkin-Elmer Multiwave 3000 oven) in a
Figure 1.Geopolimerization reactions.
The extent of the dissolution of aluminosilicate compounds is crucial, since the amount of Si and Al initially dissolved is essential for the following polycondensation and can strongly influence physical and mechanical performances of the final product.
Many papers have been published on the dissolution of aluminosilicate, especially in the geochemical literature [16,17]. However, there is a lack of data concerning the behavior in alkaline media of secondary raw materials, often proposed as a precursor of geopolymers at an industrial scale. Accordingly, it is extremely interesting focusing scientific studies on the individuation of a method that could evaluate the “geopolymerising” capacity of different materials.
Solubility tests in alkaline solution allow the direct determination of the amount of reactive silicate and aluminate species. Several test regimes can be found in literature [5,16,17]. Numerous parameters can affect the solubilisation of silicon and aluminum in alkaline media, such as the molarity of the solution, the solid-to liquid ratio, the time of contact and the mixing conditions.
In order to set up a method to test the ability of a material to react in alkaline media, different aluminosilicate sources have been selected: a mineral resource (a zeolitized tuff), an industrial by product (silt from washing process of construction and demolition wastes), a clay sediment and a calcined clay (metakaolin). The selected materials change as concern origin, chemical and mineralogical composition and pre-treatment conditions.
2. Experimental
The experimental part consisted of three steps: (1) the chemical and mineralogical characterization of the studied materials; (2) the evaluation of the parameters affecting the dissolution rate of the starting solids, such as Si/Al and heat treatment; (3) the examination of the residual solids after leaching.
Four different materials were selected as raw materials: a mineral source (a zeolitized tuff, Neapolitan Yellow Tuff, indicated as NYT), an industrial by product (silt, S), a Heat treated Clay Sediment (HCS) and a calcined clay (metakaolin, MK).
The zeolitized tuff is a phillipsite-rich tuff (Si/Al = 2.7) from a Marano (Naples, Italy) cave. Tuff sample was dried overnight at 60◦C and stored at controlled humidity (Relative Humidity = 50%). The silt (Si/Al = 2.39) was provided by IPS (Italy) and derives from the washing process of construction and demolition wastes. Silt sample was dried overnight at 105◦C and milled to form a fine powder.
The clay sediment (CS), (Si/Al = 2.77), was collected from a reservoir (Sabetta, Morigerati, Salerno) located in the south of Italy and treated up to 750◦C, in order to enhance its reactivity [18].
The metakaolin powder, which is commonly used as precursor for geopolymerization, was provided by Neuvendis (Si/Al = 1.1).
In order to evaluate the influence of thermal treatment on the reactivity, a phillipsite rich- tuff was selected. In particular, a weighted amount of tuff was heat treated in air at different temperatures from 400 to 800◦C, using a Nabertherm HTC 03/15 oven.
The chemical composition of the raw materials was obtained, according to the following procedure: they were first calcined at 550◦C for 2 h, then a weighted amount of the dry samples was subjected to digestion, under microwave-induced heating (Perkin-Elmer Multiwave 3000 oven) in a standard solution prepared by mixing 1 mL of HCl (37%, w/w), 1 mL of HNO3(65%, w/w)
and 4 mL of HF (39.5%, w/w). After addition of 24 mL of 8 M H3BO3solution to attain fluoride
complexation, the resulting solution was analysed by inductively coupled plasma optical emission spectrometry (ICP-OES).
The mineralogical composition was evaluated by X-ray diffraction analysis (XRD) using a PANalytical X'Pert Pro diffractometer equipped with PixCel 1D detector (operative conditions: CuKα1/Kα2radiation, 40 kV, 40 mA, 2θ range from 5◦ to 80◦, step size 0.0131◦2θ, counting time
40 s per step).
The chemical and mineralogical compositions of the above materials are presented in Tables1
and2, respectively.
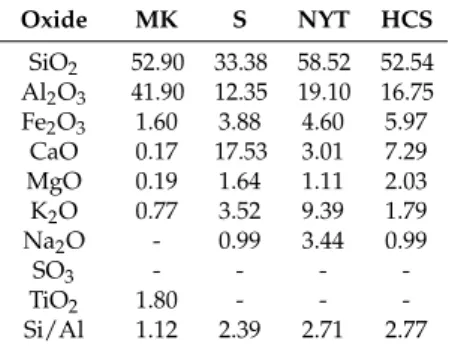
Table 1.Chemical composition of raw materials (w/w%).
Oxide MK S NYT HCS SiO2 52.90 33.38 58.52 52.54 Al2O3 41.90 12.35 19.10 16.75 Fe2O3 1.60 3.88 4.60 5.97 CaO 0.17 17.53 3.01 7.29 MgO 0.19 1.64 1.11 2.03 K2O 0.77 3.52 9.39 1.79 Na2O - 0.99 3.44 0.99 SO3 - - - -TiO2 1.80 - - -Si/Al 1.12 2.39 2.71 2.77
Note: MK: Metakaolin; S: Silt; NYT: Neapolitan Yellow Tuff; HCS: Heat-treated Clay Sediment.
The alkaline solutions employed for alkaline dissolution tests were prepared by using NaOH in pellets (Baker, analytical R grade).
Solubility tests in alkaline solution have been chosen because they allow the direct determination of the amount of soluble silicate and aluminate species in conditions similar to those experienced in geopolymer activation.
Two different tests have been selected to determine the release of Si and Al in alkaline solution: (1) by mixing 0.5 g of solid with 20 mL of alkaline solution (NaOH) for fixed times under continuous
stirring. After filtering each sample, the liquid part is diluted to 250 mL, the pH is adjusted to pH < 1 by adding concentrated HCl acid and ICP is used in order to determine the Al and Si concentration. The variables studied are the concentration of the alkaline solution (3 and 7 M) and the time of dissolution (5, 10, 24 and 72 h). Mass solution/solid ratio: 40:1.
(2) by putting into contact 0.5 g of solid with 500 mL of alkaline solution (NaOH) in static condition at 60◦C. At fixed times, 5 mL of solution have been collected and, after filtering, the pH has been adjusted to pH < 1 by adding concentrated HCl acid and ICP is used in order to determine the Al and Si concentration. The variables studied are: the concentration of the alkaline solution (3 and 7 M) and the time of dissolution (1, 3, 7 and 14 days). Mass solution/solid ratio: 1000:1.
Table 2.Mineral composition of raw materials.
Sample Mineral Phases
MK Quartz , kaolinite
S Quartz, calcite
NYT Phillipsite, chabazite, analcime, feldspars CS Quartz, kaolinite, illite, calcite
Residual solids after leaching were examined by room temperature XRD and FTIR (Fourier Transformed Infrared).
FTIR analysis was carried out by using a Nexus-Nicolet apparatus and selecting a wavenumber resolution of 4 cm−1for 32 scans from 4000 to 400 cm−1. The FTIR spectra were collected in absorbance mode on transparent pellet obtained by dispersing the sample powders in KBr (2% wt/wt).
3. Results and Discussion 3.1. Extent of Si (Al) Dissolution
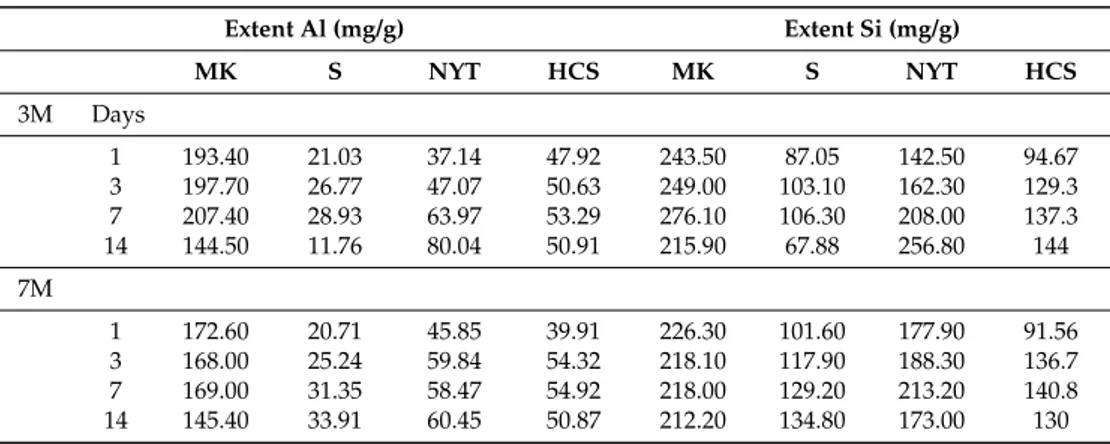
In Tables3and4, the extent of dissolution of Al and Si in the solutions for each starting material, the time of leaching and the alkalinity of the leaching solution are reported for the two reactivity tests previously described. These values represent the amount of Al and Si in mg released per gram of each sample.
Table3data showed that the release of Al and Si is strongly affected by the molarity of the alkaline solution and the time of contact with the leaching solution. The use of higher concentration NaOH solutions (from 3 to 7 M) accelerates the dissolution process of aluminosilicate species for all the tested materials. As expected, the leaching of Si and Al increases with time regardless of the alkalinity.
Table 3.Extent of Al and Si dissolution in relation to time and alkalinity of the solution for dynamic reactivity test. Extent Al (mg/g) Extent Si (mg/g) MK S NYT HCS MK S NYT HCS 3M Hours 5 56.10 4.30 1.59 14.89 56.80 7.66 5.70 27.93 10 72.90 5.46 2.80 15.10 74.10 7.96 9.16 25.93 24 77.45 7.51 7.61 14.69 76.95 7.31 20.66 21.27 72 76.50 9.03 13.28 34.88 74.60 6.92 34.06 43.30 7M 5 61.90 8.22 2.87 16.95 64.65 13.99 9.25 29.59 10 87.65 9.67 5.53 10.59 87.25 17.05 15.10 17.01 24 119.90 11.22 12.48 20.53 118.75 19.27 33.27 34.88 72 141.15 14.11 19.38 33.72 142.50 25.30 48.78 60.20
Looking at the data reported in Table4, the higher solution to solid ratio promotes the release of both silicon and aluminum. Nevertheless, it is not possible to find any correlation between the Si or Al release and alkalinity or time of contact.
Table 4. Extent of Al and Si dissolution in relation to time and alkalinity of the solution for static reactivity test. Extent Al (mg/g) Extent Si (mg/g) MK S NYT HCS MK S NYT HCS 3M Days 1 193.40 21.03 37.14 47.92 243.50 87.05 142.50 94.67 3 197.70 26.77 47.07 50.63 249.00 103.10 162.30 129.3 7 207.40 28.93 63.97 53.29 276.10 106.30 208.00 137.3 14 144.50 11.76 80.04 50.91 215.90 67.88 256.80 144 7M 1 172.60 20.71 45.85 39.91 226.30 101.60 177.90 91.56 3 168.00 25.24 59.84 54.32 218.10 117.90 188.30 136.7 7 169.00 31.35 58.47 54.92 218.00 129.20 213.20 140.8 14 145.40 33.91 60.45 50.87 212.20 134.80 173.00 130
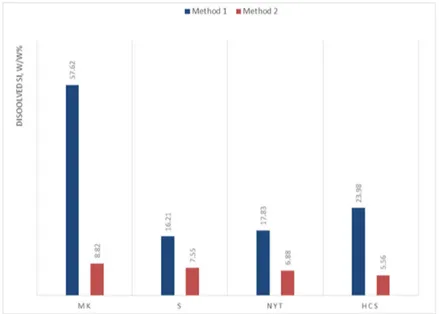
In order to compare materials characterized by different initial amount of Al and Si and to have a more accurate idea of the actual release, Figures2and3showed the percentage of the total Al and Si of the starting material that has been dissolved in relation to the initial chemical composition of the starting materials. These data allowed us to evaluate how strongly the starting material has been affected by the attack of the alkaline solution.Environments 2017, 4, 56 5 of 12
Figure 2. Dissolved Si after leaching for 72 h in 7 M NaOH (% w/w).
Figure 3. Dissolved Al after leaching for 72 h in 7 M NaOH (% w/w).
In the dynamic test, considering the Si and Al release, metakaolin is the most reactive material, followed by calcined clay sediment. The other two sample, S and NYT, reported a similar amount of Si (Al) released, which is significantly lower than MK.
For the static reactivity test, leaching by alkaline attack resulted in a different reactivity sequence for the two elements considered. In particular, considering the aluminum release, calcined clay sediments showed the higher release percentage, whereas metakaolin showed the higher Si release. This could be explained by the fact that that static test did not provide any stirring of the leaching solutions and so the results are more affected by the initial chemical composition of materials, in particular by the structure of the clay phases in the mineralogical composition of the tested materials.
In the dynamic test, the considered materials leached a percentage of aluminum higher than silicon. In fact, referring to the chemical composition of the starting materials, aluminum is present in the clay phase, soluble in alkaline media, whereas silicon is also present as quartz, which is less
Figure 2.Dissolved Si after leaching for 72 h in 7 M NaOH (% w/w).
Environments 2017, 4, 56 5 of 12
Figure 2. Dissolved Si after leaching for 72 h in 7 M NaOH (% w/w).
Figure 3. Dissolved Al after leaching for 72 h in 7 M NaOH (% w/w).
In the dynamic test, considering the Si and Al release, metakaolin is the most reactive material, followed by calcined clay sediment. The other two sample, S and NYT, reported a similar amount of Si (Al) released, which is significantly lower than MK.
For the static reactivity test, leaching by alkaline attack resulted in a different reactivity sequence for the two elements considered. In particular, considering the aluminum release, calcined clay sediments showed the higher release percentage, whereas metakaolin showed the higher Si release. This could be explained by the fact that that static test did not provide any stirring of the leaching solutions and so the results are more affected by the initial chemical composition of materials, in particular by the structure of the clay phases in the mineralogical composition of the tested materials.
In the dynamic test, the considered materials leached a percentage of aluminum higher than silicon. In fact, referring to the chemical composition of the starting materials, aluminum is present in the clay phase, soluble in alkaline media, whereas silicon is also present as quartz, which is less
Figure 3.Dissolved Al after leaching for 72 h in 7 M NaOH (% w/w).
In the dynamic test, considering the Si and Al release, metakaolin is the most reactive material, followed by calcined clay sediment. The other two sample, S and NYT, reported a similar amount of Si (Al) released, which is significantly lower than MK.
For the static reactivity test, leaching by alkaline attack resulted in a different reactivity sequence for the two elements considered. In particular, considering the aluminum release, calcined clay sediments showed the higher release percentage, whereas metakaolin showed the higher Si release. This could be explained by the fact that that static test did not provide any stirring of the leaching solutions and so the results are more affected by the initial chemical composition of materials, in particular by the structure of the clay phases in the mineralogical composition of the tested materials. In the dynamic test, the considered materials leached a percentage of aluminum higher than silicon. In fact, referring to the chemical composition of the starting materials, aluminum is present
in the clay phase, soluble in alkaline media, whereas silicon is also present as quartz, which is less reactive in alkaline environment. This difference is more evident for shorter time of leaching. In fact, for the static test, in which times of contact solid-NaOH solutions are longer (1, 3, 7 and 14 days), this effect disappears and, except for the clay sediment, the percentage of silicon released is higher than the one of aluminum. This was expected considering that, for each of the starting materials considered, silicon is the main component.
Considering the calcined clay sediment, it is important to underline that for both tests the percentage of aluminum released is much higher than that released by tuff and silt. This can be explained by considering that aluminum in the sediments is related to clay phases and, after thermal activation, can be easily released.
Comparing the two reactivity tests in terms of total percentage of dissolution, the dynamic test clearly showed higher values of Si and Al release. This is likely due to the fact that static test is performed in static condition, so the material tested always exposes the same surface of contact to the alkaline solution. The stirring of the system resulted more aggressive and led to higher percentages of release.
“Geopolymerising” capacity of each material can be verified indirectly by comparing collected data on dissolution in alkali media with literature data concerning physical and mechanical properties of geopolymers obtained from different raw materials [10,18–20]. Results obtained with the dynamic test method showed a reactivity sequence of MK > HCS > NYT≈S both for Si and Al release, which is in accordance with mechanical performances of geopolymers obtained by using the above precursors. On the contrary, static methods data showed a clear reactivity sequence regarding the Si leaching but an incoherent sequence HSA > MK > NYT > S regarding Al leaching.
3.2. Effect of Heat-Treatment on Leachability of NYT
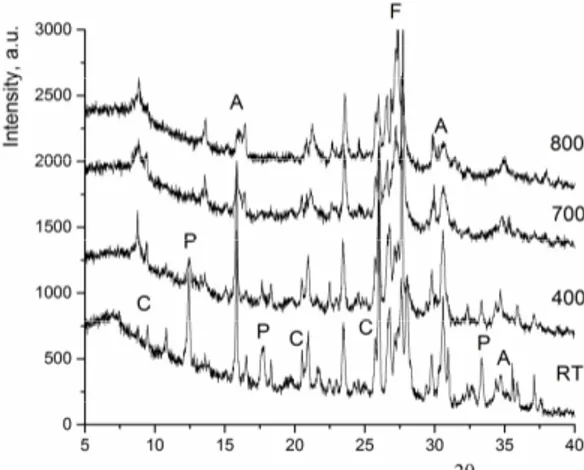
It is well known that the thermal activation of silico-aluminate minerals in the temperature range between 400 and 800◦C results generally in a dehydroxylation [18,21], which causes the loss of the structural water and decompose into a disordered metastable state [22]. This meta-state is widely addressed as being active in pozzolanic reactions [23,24]. Firing to higher temperatures results in the formation of new unreactive phases such as feldspar and/or feldspatoids [25,26]. Anyway, a careful calcination can activate the material leading to an increase of its geopolymeric reactivity [18] and a consequent increase in terms of compression strength of the final product obtained. For this reason, the change in mineral composition of NYT heat-treated at different temperature was investigated by XRD.
Figure 4 reports the results of the X-ray diffraction analysis of the heat-treated original NYT samples.
Environments 2017, 4, 56 6 of 12
reactive in alkaline environment. This difference is more evident for shorter time of leaching. In fact, for the static test, in which times of contact solid-NaOH solutions are longer (1, 3, 7 and 14 days), this effect disappears and, except for the clay sediment, the percentage of silicon released is higher than the one of aluminum. This was expected considering that, for each of the starting materials considered, silicon is the main component.
Considering the calcined clay sediment, it is important to underline that for both tests the percentage of aluminum released is much higher than that released by tuff and silt. This can be explained by considering that aluminum in the sediments is related to clay phases and, after thermal activation, can be easily released.
Comparing the two reactivity tests in terms of total percentage of dissolution, the dynamic test clearly showed higher values of Si and Al release. This is likely due to the fact that static test is performed in static condition, so the material tested always exposes the same surface of contact to the alkaline solution. The stirring of the system resulted more aggressive and led to higher percentages of release.
“Geopolymerising” capacity of each material can be verified indirectly by comparing collected data on dissolution in alkali media with literature data concerning physical and mechanical properties of geopolymers obtained from different raw materials [10,18–20]. Results obtained with the dynamic test method showed a reactivity sequence of MK > HCS > NYT ≈ S both for Si and Al release, which is in accordance with mechanical performances of geopolymers obtained by using the above precursors. On the contrary, static methods data showed a clear reactivity sequence regarding the Si leaching but an incoherent sequence HSA > MK > NYT > S regarding Al leaching.
3.2. Effect of Heat-Treatment on Leachability of NYT
It is well known that the thermal activation of silico-aluminate minerals in the temperature range between 400 and 800 °C results generally in a dehydroxylation [18,21], which causes the loss of the structural water and decompose into a disordered metastable state [22]. This meta-state is widely addressed as being active in pozzolanic reactions [23,24]. Firing to higher temperatures results in the formation of new unreactive phases such as feldspar and/or feldspatoids [25,26]. Anyway, a careful calcination can activate the material leading to an increase of its geopolymeric reactivity [18] and a consequent increase in terms of compression strength of the final product obtained. For this reason, the change in mineral composition of NYT heat-treated at different temperature was investigated by XRD.
Figure 4 reports the results of the X-ray diffraction analysis of the heat-treated original NYT samples.
Figure 4. Phase evolution of the Neapolitan Yellow Tuff (NYT) sample treated up to 800 °C. Figure 4.Phase evolution of the Neapolitan Yellow Tuff (NYT) sample treated up to 800◦C.
Mineral phases reported are limited to zeolite phases or their transformation products by heating. The following considerations can be done:
(a) chabazite (C) and phillipsite (P) structures collapse within about 600◦C;
(b) crystallization of alkali feldspar (F), presumably a K-feldspar (K,Na)AlSi3O8, is observed at about
800◦C, with some residual analcime and an amorphous phase still present;
(c) the sample appears nearly amorphous, apart a very limited presence of feldspars at 800◦C.
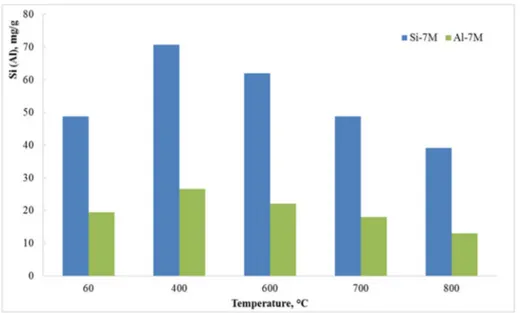
Figure5reported the Si (Al) released in the NYT sample after different heat-treatment at 72 h and 7 M alkaline solution in the dynamic test. The change in crystalline phases directly affects the leaching performance of the tuff, as reported in Figure5. In fact, the heat treatment enhanced the reactivity of tuff up to 400◦C, due to the collapse of the crystalline zeolitic phases and the increase in the amorphous phases.
At higher temperatures, the crystallization of new crystalline and chemically stable phases, such as alkaline feldspars, prevented the Si (Al) leaching in alkaline media, providing the decreasing of the amount of Si and Al released in alkaline media.
Mineral phases reported are limited to zeolite phases or their transformation products by heating. The following considerations can be done:
(a) chabazite (C) and phillipsite (P) structures collapse within about 600 °C;
(b) crystallization of alkali feldspar (F), presumably a K-feldspar (K,Na)AlSi3O8, is observed at
about 800 °C, with some residual analcime and an amorphous phase still present; (c) the sample appears nearly amorphous, apart a very limited presence of feldspars at 800 °C.
Figure 5 reported the Si (Al) released in the NYT sample after different heat-treatment at 72 h and 7 M alkaline solution in the dynamic test. The change in crystalline phases directly affects the leaching performance of the tuff, as reported in Figure 5. In fact, the heat treatment enhanced the reactivity of tuff up to 400 °C, due to the collapse of the crystalline zeolitic phases and the increase in the amorphous phases.
At higher temperatures, the crystallization of new crystalline and chemically stable phases, such as alkaline feldspars, prevented the Si (Al) leaching in alkaline media, providing the decreasing of the amount of Si and Al released in alkaline media.
Figure 5. Effect of the heat-treatment on the Si (Al) released in the NYT sample (data obtained with Test (1) at 72 h and 7 M alkaline solution).
3.3. Characterization of the Solid Residue
In order to better understand the different reactivity properties in alkaline media, the solids after leaching (Dynamic Test) were examined by XRD and FTIR.
From the spectra of metakaolin, considered as reference material in geopolymer synthesis (Figure 6), it is possible to see that the extended contact with 7 M NaOH solution leads to a shift in the 1050 cm−1 band, which typical of metakaolin and associated to the stretching of Al–O and Si–O in
amorphous aluminosilicate structure, towards lower frequencies of about 1000 cm−1 [27].
Figure 5.Effect of the heat-treatment on the Si (Al) released in the NYT sample (data obtained with Test (1) at 72 h and 7 M alkaline solution).
3.3. Characterization of the Solid Residue
In order to better understand the different reactivity properties in alkaline media, the solids after leaching (Dynamic Test) were examined by XRD and FTIR.
From the spectra of metakaolin, considered as reference material in geopolymer synthesis (Figure6), it is possible to see that the extended contact with 7 M NaOH solution leads to a shift in the 1050 cm−1band, which typical of metakaolin and associated to the stretching of Al–O and Si–O in amorphous aluminosilicate structure, towards lower frequencies of about 1000 cm−1[27].
Figure 6. FTIR (Fourier Transformed Infrared) spectra of metakaolin after dynamic reactivity test. All the spectra show a broad band at 3400 cm−1 and a narrow one at 1648 cm−1 that are relative to
the stretching of OH and H–OH groups of water of hydration. Moreover, a peak at about 1450 cm−1,
related to the presence of sodium carbonate [28,29], appeared with the increasing of the time of contact between metakaolin and alkaline solution. This peak is more evident when the time of contact of powder with the alkaline solution increases. In fact, it is more intense in the spectra of the metakaolin in contact with the alkaline solution for 72 h compared to the one of metakaolin after only 5 h of contact with the alkaline solution.
In Figure 7, the XRD spectra of metakaolin before and after reactivity test are reported. The lowering of the kaolinite peaks is a clear consequence of the dissolution of aluminate and silicate species in alkaline environment.
Figure 8 reports the FTIR spectra before and after the reactivity test of the other materials tested. The FTIR spectra of silt, before and after contact with 7 M NaOH solutions for 72 h, showed the appearance of absorption bands located in the range 1430–1440 cm−1 after the reactivity test. These
peaks can be attributed to the formation of sodium carbonate as a consequence of carbonation of the sodium of the alkaline solution.
Figure 7. XRD spectra of (a) metakaolin, (b) metakaolin after 5 h of contact with NaOH 7 M solution and (c) metakaolin after 72 h of contact with NaOH 7 M solution (K = kaolinite, Q = quartz, F = feldspar, NaC = sodium carbonate).
Figure 6.FTIR (Fourier Transformed Infrared) spectra of metakaolin after dynamic reactivity test.
All the spectra show a broad band at 3400 cm−1and a narrow one at 1648 cm−1that are relative to the stretching of OH and H–OH groups of water of hydration. Moreover, a peak at about 1450 cm−1, related to the presence of sodium carbonate [28,29], appeared with the increasing of the time of contact between metakaolin and alkaline solution. This peak is more evident when the time of contact of powder with the alkaline solution increases. In fact, it is more intense in the spectra of the metakaolin in contact with the alkaline solution for 72 h compared to the one of metakaolin after only 5 h of contact with the alkaline solution.
In Figure7, the XRD spectra of metakaolin before and after reactivity test are reported.
The lowering of the kaolinite peaks is a clear consequence of the dissolution of aluminate and silicate species in alkaline environment.
Figure8reports the FTIR spectra before and after the reactivity test of the other materials tested. The FTIR spectra of silt, before and after contact with 7 M NaOH solutions for 72 h, showed the appearance of absorption bands located in the range 1430–1440 cm−1after the reactivity test. These peaks can be attributed to the formation of sodium carbonate as a consequence of carbonation of the sodium of the alkaline solution.
Environments 2017, 4, 56 8 of 12
Figure 6. FTIR (Fourier Transformed Infrared) spectra of metakaolin after dynamic reactivity test. All the spectra show a broad band at 3400 cm−1 and a narrow one at 1648 cm−1 that are relative to
the stretching of OH and H–OH groups of water of hydration. Moreover, a peak at about 1450 cm−1,
related to the presence of sodium carbonate [28,29], appeared with the increasing of the time of contact between metakaolin and alkaline solution. This peak is more evident when the time of contact of powder with the alkaline solution increases. In fact, it is more intense in the spectra of the metakaolin in contact with the alkaline solution for 72 h compared to the one of metakaolin after only 5 h of contact with the alkaline solution.
In Figure 7, the XRD spectra of metakaolin before and after reactivity test are reported. The lowering of the kaolinite peaks is a clear consequence of the dissolution of aluminate and silicate species in alkaline environment.
Figure 8 reports the FTIR spectra before and after the reactivity test of the other materials tested. The FTIR spectra of silt, before and after contact with 7 M NaOH solutions for 72 h, showed the appearance of absorption bands located in the range 1430–1440 cm−1 after the reactivity test. These
peaks can be attributed to the formation of sodium carbonate as a consequence of carbonation of the sodium of the alkaline solution.
Figure 7. XRD spectra of (a) metakaolin, (b) metakaolin after 5 h of contact with NaOH 7 M solution and (c) metakaolin after 72 h of contact with NaOH 7 M solution (K = kaolinite, Q = quartz, F = feldspar, NaC = sodium carbonate).
Figure 7.XRD spectra of (a) metakaolin, (b) metakaolin after 5 h of contact with NaOH 7 M solution and (c) metakaolin after 72 h of contact with NaOH 7 M solution (K = kaolinite, Q = quartz, F = feldspar, NaC = sodium carbonate).
Figure 8. FTIR spectra of silt after dynamic reactivity test.
Moreover, the band at around 1000 cm−1 is always associated with quartz and silicate minerals
(feldspar, phyllosilicates) and it can be related to the stretching of Al–O and Si–O in amorphous aluminosilicate structure [18]. This band decreases and broadens significantly in the spectra of all the residual solids (not reported here), confirming a considerable release of Si and Al and a consequent decrease of the crystallinity of the aluminosilicate structures. The band at around 3640 cm−1 in the
spectra of silt is associated with the –OH band of Ca(OH)2, while the bands at 692 cm−1,is associated
to the presence of quartz.Additionally, the presence of CaCO3, mainlyin the form of calcite, appears,
identified by its main absorption bandsat 1431 cm−1 and at 875 cm−1 [27].
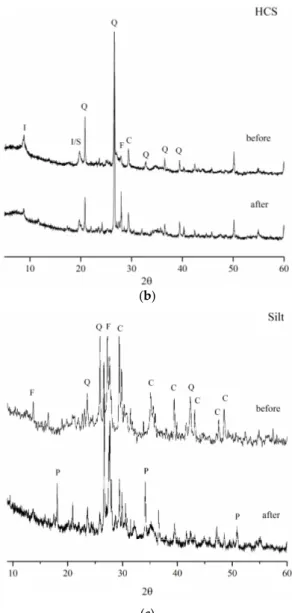
XRD spectra (Figure 9) showed that silt is the only material for which the contact with alkaline solution leads to the formation of a new phase, in fact in the spectrum of the residual solid, the appearance of several peaks associated to portlandite is evident.
This can be explained by the fact that silt has the highest percentage of CaO (17.53% w/w) compared to other materials and, as the aluminosilicate network of the material starts decomposing under the attack of the highly alkaline solution, Ca2+ moves in the solution and precipitates as
Ca(OH)2 [28]. The tuff after reactivity test showed the same crystalline phases of the starting material
(Figure 8).
(a)
Figure 8.FTIR spectra of silt after dynamic reactivity test.
Moreover, the band at around 1000 cm−1is always associated with quartz and silicate minerals (feldspar, phyllosilicates) and it can be related to the stretching of Al–O and Si–O in amorphous aluminosilicate structure [18]. This band decreases and broadens significantly in the spectra of all the residual solids (not reported here), confirming a considerable release of Si and Al and a consequent decrease of the crystallinity of the aluminosilicate structures. The band at around 3640 cm−1in the spectra of silt is associated with the –OH band of Ca(OH)2, while the bands at 692 cm−1, is associated
to the presence of quartz. Additionally, the presence of CaCO3, mainly in the form of calcite, appears,
identified by its main absorption bands at 1431 cm−1and at 875 cm−1[27].
XRD spectra (Figure9) showed that silt is the only material for which the contact with alkaline solution leads to the formation of a new phase, in fact in the spectrum of the residual solid, the appearance of several peaks associated to portlandite is evident.
This can be explained by the fact that silt has the highest percentage of CaO (17.53% w/w) compared to other materials and, as the aluminosilicate network of the material starts decomposing under the attack of the highly alkaline solution, Ca2+ moves in the solution and precipitates as Ca(OH)2[28]. The tuff after reactivity test showed the same crystalline phases of the starting material
(Figure8).
Environments 2017, 4, 56 9 of 12
Figure 8. FTIR spectra of silt after dynamic reactivity test.
Moreover, the band at around 1000 cm−1 is always associated with quartz and silicate minerals
(feldspar, phyllosilicates) and it can be related to the stretching of Al–O and Si–O in amorphous aluminosilicate structure [18]. This band decreases and broadens significantly in the spectra of all the residual solids (not reported here), confirming a considerable release of Si and Al and a consequent decrease of the crystallinity of the aluminosilicate structures. The band at around 3640 cm−1 in the
spectra of silt is associated with the –OH band of Ca(OH)2, while the bands at 692 cm−1,is associated
to the presence of quartz.Additionally, the presence of CaCO3, mainlyin the form of calcite, appears,
identified by its main absorption bandsat 1431 cm−1 and at 875 cm−1 [27].
XRD spectra (Figure 9) showed that silt is the only material for which the contact with alkaline solution leads to the formation of a new phase, in fact in the spectrum of the residual solid, the appearance of several peaks associated to portlandite is evident.
This can be explained by the fact that silt has the highest percentage of CaO (17.53% w/w) compared to other materials and, as the aluminosilicate network of the material starts decomposing under the attack of the highly alkaline solution, Ca2+ moves in the solution and precipitates as
Ca(OH)2 [28]. The tuff after reactivity test showed the same crystalline phases of the starting material
(Figure 8).
(a) Figure 9. Cont.
(b)
(c)
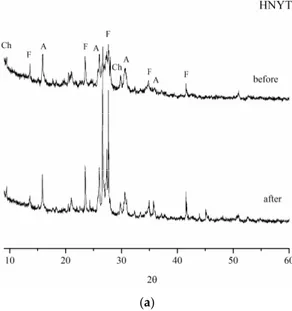
Figure 9. XRD spectra of (a) 600 °C treated NYT (HNYT), (b) HCS and (c) silt, before and after reacitivity test (1) (Q = quartz, F = feldspar, M = mullite, C = calcite, I = illite, S = smectite, A = analcime, Ch = chabasite, P = portlandite).
Due to the fact that the amorphous phase was also leached in the alkaline solution, the amount of crystalline phases in the residual solid seems to be higher than in the starting material. In the case of the calcined clay sediment, the sample after leaching contains the same crystalline phases of the starting materials but, and referring in particular to the clay phases, they are present in a lower amount as indicated by the lowering of the corresponding peaks (I, I/S).
4. Conclusions
Two test methods have been applied to evaluate the attitude of a silicoaluminate precursor to give a geopolymerization reaction. The dynamic test method provides a reactivity sequence of MK > HCS > NYT ≈ S both for Si and Al release, which is coherent with the performances of geopolymers obtained by using the above precursors [10,18–20]. Static test method does not provide a clear reactivity sequence regarding the Si leaching and provides an incoherent sequence HSA > MK > NYT > S regarding Al leaching.
Figure 9. XRD spectra of (a) 600◦C treated NYT (HNYT), (b) HCS and (c) silt, before and after reacitivity test (1) (Q = quartz, F = feldspar, M = mullite, C = calcite, I = illite, S = smectite, A = analcime, Ch = chabasite, P = portlandite).
Due to the fact that the amorphous phase was also leached in the alkaline solution, the amount of crystalline phases in the residual solid seems to be higher than in the starting material. In the case of the calcined clay sediment, the sample after leaching contains the same crystalline phases of the starting materials but, and referring in particular to the clay phases, they are present in a lower amount as indicated by the lowering of the corresponding peaks (I, I/S).
4. Conclusions
Two test methods have been applied to evaluate the attitude of a silicoaluminate precursor to give a geopolymerization reaction. The dynamic test method provides a reactivity sequence of MK > HCS > NYT≈S both for Si and Al release, which is coherent with the performances of geopolymers obtained by using the above precursors [10,18–20]. Static test method does not provide a clear reactivity sequence regarding the Si leaching and provides an incoherent sequence HSA > MK > NYT > S regarding Al leaching.
Furthermore, the dynamic test method is faster and requires lower amounts of reactants (solution) than the static test.
Acknowledgments:This research study has been funded by the University of Napoli “Parthenope” with a grant within the call “Support for Individual Research for the 2015–17 Period” issued by Rectoral Decree No. 727/2015. The support is gratefully acknowledged.
Author Contributions: Barbara Liguori and Ilaria Capasso conceived and designed the experiments; Ilaria Capasso and Marco De Pertis performed the experiments and analyzed the data; Barbara Liguori and Claudio Ferone wrote the paper; Raffaele Cioffi made critical revisions.
Conflicts of Interest:The authors declare no conflict of interest. The founding sponsors had no role in the design of the study; in the collection, analyses, or interpretation of data; in the writing of the manuscript, and in the decision to publish the results.
References
1. Davidovits, J. Geopolymers: Inorganic polymeric new materials. J. Therm. Anal. Calorim. 1991, 37, 1633–1656. [CrossRef]
2. Duxson, P.; Fernández-Jiménez, A.; Provis, J.L.; Lukey, G.C.; Palomo, A.; Van Deventer, J.S.J. Geopolymer technology: The current state of the art. J. Mater. Sci. 2007, 42, 2917–2933. [CrossRef]
3. Van Deventer, J.S.; Provis, J.L.; Duxson, P.; Brice, D.G. Chemical research and climate change as drivers in the commercial adoption of alkali activated materials. Waste Biomass Valoriz. 2010, 1, 145–155. [CrossRef] 4. Xu, H.; Van Deventer, J.S.J. The geopolymerisation of alumino-silicate minerals. Int. J. Miner. Process. 2000,
59, 247–266. [CrossRef]
5. Xu, H.; Van Deventer, J.S.J. The effect of alkali metals on the formation of geopolymeric gels from alkali-feldspars. Colloids Surf. A Physicochem. Eng. Asp. 2003, 216, 27–44. [CrossRef]
6. Xu, H.; Van Deventer, J.S.J.; Lukey, G.C. Effect of alkali metals on the preferential geopolymerization of stilbite/kaolinite mixtures. Ind. Eng. Chem. Res. 2001, 40, 3749–3756. [CrossRef]
7. Peirce, S.; Santoro, L.; Andini, S.; Montagnaro, F.; Ferone, C.; Cioffi, R. Clay Sediment Geopolymerization by Means of Alkali Metal Aluminate Activation. RSC Adv. 2015, 5, 107662–107669. [CrossRef]
8. Messina, F.; Ferone, C.; Molino, A.; Roviello, G.; Colangelo, F.; Molino, B.; Cioffi, R. Synergistic recycling of calcined clayey sediments and water potabilization sludge as geopolymer precursors: Upscaling from binders to precast paving cement-free bricks. Constr. Build. Mater. 2017, 133, 14–26. [CrossRef]
9. Fernández-Jiménez, A.; Palomo, A.; Criado, M. Microstructure development of alkali-activated fly ash cement: A descriptive model. Cem. Concr. Res. 2005, 35, 1204–1209. [CrossRef]
10. Messina, F.; Ferone, C.; Colangelo, F.; Cioffi, R. Low temperature alkaline activation of weathered fly ash: Influence of mineral admixtures on early age performance. Constr. Build. Mater. 2015, 86, 169–177. [CrossRef] 11. Ferone, C.; Colangelo, F.; Messina, F.; Iucolano, F.; Liguori, B.; Cioffi, R. Coal combustion wastes reuse in low
energy artificial aggregates manufacturing. Materials 2013, 6, 5000–5015. [CrossRef]
12. Ferone, C.; Colangelo, F.; Messina, F.; Santoro, L.; Cioffi, R. Recycling of Pre-Washed Municipal Solid Waste Incinerator Fly Ash in the Manufacturing of Low Temperature Setting Geopolymer Materials. Materials 2013, 6, 3420–3437. [CrossRef]
13. Fletcher, R.A.; MacKenzie, K.J.; Nicholson, C.L.; Shimada, S. The composition range of aluminosilicate geopolymers. J. Eur. Ceram. Soc. 2005, 25, 1471–1477. [CrossRef]
14. Cristelo, N.; Tavares, P.; Lucas, E.; Miranda, T.; Oliveira, D. Quantitative and qualitative assessment of the amorphous phase of a Class F fly ash dissolved during alkali activation reactions—Effect of mechanical activation, solution concentration and temperature. Compos. B Eng. 2016, 103, 1–14. [CrossRef]
15. Fernández-Jiménez, A.; De La Torre, A.G.; Palomo, A.; López-Olmo, G.; Alonso, M.M.; Aranda, M.A.G. Quantitative determination of phases in the alkali activation of fly ash. Part I. Potential ash reactivity. Fuel 2006, 85, 625–634. [CrossRef]
16. Panagiotopoulou, C.; Kontori, E.; Perraki, T.; Kakali, G. Dissolution of aluminosilicate minerals and by-products in alkaline media. J. Mater. Sci. 2007, 42, 2967–2973. [CrossRef]
17. Buchwald, A.; Hohmann, M.; Posern, K.; Brendler, E. The suitability of thermally activated illite/smectite clay as raw material for geopolymer binders. Appl. Clay Sci. 2009, 46, 300–304. [CrossRef]
18. Ferone, C.; Liguori, B.; Capasso, I.; Colangelo, F.; Cioffi, R.; Cappelletto, E.; Di Maggio, R. Thermally treated clay sediments as geopolymer source material. Appl. Clay Sci. 2015, 107, 195–204. [CrossRef]
19. Lampris, C.; Lupo, R.; Cheeseman, C.R. Geopolymerisation of silt generated from construction and demolition waste washing plants. Waste Manag. 2009, 29, 368–373. [CrossRef] [PubMed]
20. Villa, C.; Pecina, E.T.; Torres, R.; Gómez, L. Geopolymer synthesis using alkaline activation of natural zeolite. Constr. Build. Mater. 2010, 24, 2084–2090. [CrossRef]
21. Heller-Kallai, L. Thermally Modified Clay Minerals. Dev. Clay Sci. 2006, 1, 289–308.
22. Mendelovici, E. Comparative study of the effects of thermal and mechanical treatments on the structures of clay minerals. J. Therm. Anal. Calorim. 1997, 49, 1385–1397. [CrossRef]
23. He, C.; Osbæck, B.; Makovicky, E. Thermal stability and pozzolanic activity of raw and calcined mixed-layer mica/smectite. Appl. Clay Sci. 2000, 17, 141–161. [CrossRef]
24. Kakali, G.; Perraki, T.; Tsivilis, S.; Badogiannis, E. Thermal treatment of kaolin: The effect of mineralogy on the pozzolanic activity. Appl. Clay Sci. 2001, 20, 73–80. [CrossRef]
25. Liguori, B.; Cassese, A.; Colella, C. Safe immobilization of Cr (III) in heat-treated zeolite tuff compacts. J. Hazard. Mater. 2006, 137, 1206–1210. [CrossRef] [PubMed]
26. Liguori, B.; Caputo, D.; Iucolano, F.; Aprea, P.; De Gennaro, B. Entrapping of Cs and Sr in heat-treated zeolite matrices. J. Nucl. Mater. 2013, 435, 196–201. [CrossRef]
27. Miller, F.A.; Wilkins, C.H. Infrared spectra and characteristic frequencies of inorganic ions. Anal. Chem. 1952, 24, 1253–1294. [CrossRef]
28. Granizo, M.L.; Santiago, A.; Blanco-Varela, M.T.; Palomo, A. Alkaline Activation of Metakaolin: Effect of Calcium Hydroxide in the Products of Reaction. J. Am. Ceram. Soc. 2002, 85, 225–231. [CrossRef]
29. Pingitore, N.E., Jr.; Fretzdorff, S.B.; Seitz, B.P.; Estrada, L.Y.; Borrego, P.M.; Crawford, G.M.; Love, K.M. Dissolution kinetics of CaCO3in common laboratory solvents. J. Sediment. Res. 1993, 63, 641–645.
© 2017 by the authors. Licensee MDPI, Basel, Switzerland. This article is an open access article distributed under the terms and conditions of the Creative Commons Attribution (CC BY) license (http://creativecommons.org/licenses/by/4.0/).