Abstract
Guar (Cyamopsis tetragonoloba L.) is a spring-summer legume with a high drought tolerance, grown mainly in India, Pakistan, United States and South Africa, whose seeds contain galactomannans. These can be used as an emollient, softening or thickening agent, a floccu-lant, as well as in hydraulic fracturing, and as a stabiliser in a wide range of other industrial activities: the production of cosmetics, paper, textiles, paints and varnishes, detergents, in construction, and in food products (jams, jellies, yogurt, mayonnaise, ketchup, diet foods, foods for coeliacs, etc.). In the light of a growing industrial demand for guar flour, in May 2012 a trial was carried out in southern Italy. Seeds from South Africa were sown in large plots on two farms with different soil characteristics. The crop showed yields varying between 1.8 and 2.2 t ha–1. Agronomic results were then used to conduct an integrated sus-tainability analysis using the production cost analysis and the life cycle assessment, in order to assess, respectively, the cost-effectiveness and the environmental impact of the production process of guar in a Mediterranean environment. Compared to other competitive crops, guar, with less than 3000 kg of CO2eq. emissions, can be considered as a low-emission crop. Given the above-mentioned yield, guar grow-ing is economically sustainable when the purchase price of seeds is not less than 0.96 € kg–1.
Introduction
Guar (Cyamopsis tetragonoloba L.) is a drought-tolerant legume characterised by a spring-summer life cycle, which has many uses such as human nutrition, animal fodder and industrial purposes (Whistler and Hymowitz, 1979). It is used in the production of high added value goods, such as those derived from the chemical industry, and is also used in oil and methane extraction (hydraulic fracturing) (Mathur, 2012).
The total world production of guar is estimated to be about 1.0-1.6 Mt per year, with considerable fluctuations depending on climate trends, such as monsoons, which influence market quotations (Sharma and Gummagolmath, 2012). India produces approximately 80% of the world’s guar, followed by Pakistan (15%); the remaining 5% is produced in USA, Australia and South Africa.
This annual field crop is not exigent; it tolerates saline soils and drought well, which allows its cultivation in southern Italy with good results (Losavio et al., 2002; Sortino and Gresta, 2007; Gresta et al., 2013). Due to their water scarcity, Mediterranean areas could develop an interest in guar cultivation as an alternative crop (Gresta et al., 2013) in rotation with other vegetable crops or cereals in open fields, taking advantages of its beneficial effects on soil in terms of nitrogen fixation, boosted through inoculations of specific symbiotic microor-ganisms (Whistler and Hymowitz, 1979; Elsheikh and Ibrahim, 1999). Guar grains, the principal crop product, can be processed using suit-able physical, mechanical and chemical means to obtain transformed and semi-transformed products with a high added value, employable in a wide range of industrial sectors (Mathur, 2012). From the first phys-ical and mechanphys-ical processing of guar seeds, two semi-transformed products are obtained: guar splits with a yield of 27-35%, obtained from endosperm, and guar meal, obtained from teguments and embryos which represent 65-73% of the processed seed. This latter is common-ly considered a valuable by-product since it is largecommon-ly made up of pro-teins (more than 42%) (Kumar and Singh, 2002) and is used as a nutritional supplement in livestock feed, especially poultry (Anjum et al., 2001).
Guar splits are ground to produce guar gum, a high added value product, made up mainly of galactomannans, which are 75-85% of the endosperm (Prajapati et al., 2013). Worldwide, guar gum is used in the food industry as a thickener and stabiliser, as well as in many other industries, including the chemical, pharmaceutical, cosmetics, con-struction, textile, explosives, and paper industries. In recent years the price of guar seed has increased considerably, because of the exponen-tial growth of demand for its use in hydraulic fracturing, leading to speculative phenomena (Gresta et al., 2013). Above considerations make guar production an interesting objective for agronomic research, especially concerning the potential economic benefits for farmers.
Correspondence: Anna Irene De Luca, Department of Agriculture (AGRARIA), Mediterranean University of Reggio Calabria località Feo di Vito snc 89122 (RC), Italy. E-mail: [email protected]
Key words: guar, Cyamopsis tetragonoloba, Mediterranean environment, grain yield, economic and environmental sustainability, life cycle assess-ment.
Conference presentation: SIA XLII Congress, Reggio Calabria, 2013.
Received for publication: 18 November 2014. Revision received: 7 January 2014. Accepted for publication: 7 January 2014.
©Copyright F. Gresta et al., 2014 Licensee PAGEPress, Italy
Italian Journal of Agronomy 2014; 9:565 doi:10.4081/ija.2014.565
This article is distributed under the terms of the Creative Commons Attribution Noncommercial License (by-nc 3.0) which permits any noncom-mercial use, distribution, and reproduction in any medium, provided the orig-inal author(s) and source are credited.
Economic and environmental sustainability analysis of guar
(
Cyamopsis tetragonoloba
L.) farming process in a Mediterranean area:
two case studies
Fabio Gresta,
1Anna I. De Luca,
1Alfio Strano,
1Giacomo Falcone,
1Carmelo Santonoceto,
1Umberto Anastasi,
2Giovanni Gulisano
11
Department of Agriculture (AGRARIA), Mediterranean University of Reggio Calabria;
2
Department of Agricultural and Food Science (DISPA), University of Catania, Italy
Non-commercial
use
To this end, an evaluation of environmental and economic sustain-ability could highlight the most efficient scenarios and test the feasi-bility of the introduction of guar cultivation in Mediterranean areas. Therefore, this study was carried out by comparing two farms in Sicily (Southern Italy), with different paedoclimatic characteristics and using different farming techniques. Both insourcing and outsourcing of labour and services were modelled for each farm.
Four scenarios were thus identified for all phases of the agricultural process; specific data were gathered to elaborate suitable indicators of input and output in order to obtain a single inventory for both environ-mental and economic elaborations. Life cycle assessment (LCA) was used for the environmental evaluation, while measurements of eco-nomic profitability were made by elaborating production costs and income indicators.
Materials and methods
The experimental trial was carried out in 2012 on two farms (Farm 1 and Farm 2), in large plots of 1.5 hectares each, in Gela (Sicily, Southern Italy) using a guar accession from South Africa. The manage-ment techniques carried out in the above manage-mentioned farms are shown in Table 1.
Environmental and economic analysis
The environmental impacts of the farming process were analysed
using the LCA, a useful method to gather information about the most sustainable production techniques (Horne et al., 2009; Zamagni et al., 2008). According to International Organization for Standardization (ISO) standards ISO 14040-44 (ISO 2006a; 2006b), the life cycle study was organised into four phases. The first phase concerned the goal and field definitions (functional unit, system boundaries, impact typolo-gies, impact assessment methodologies and data quality require-ments). The second phase concerned inventory analysis (life cycle inventory) for data gathering and the quantification of inflows and out-flows from the system. The third phase concerned impact evaluation (life cycle impact assessment), entailing the definition of specific indi-cators for each impact category, consistent with the aim of the study; it also implied the definition of data classification and characterisation models. The fourth and final phase concerned life cycle interpretation and the formulation of recommendations in order to offer information to stakeholders and end-users of the study as a decision support tool.
For this study, the boundaries from cradle to gate were considered (from open field seeding to grain harvesting), taking into considera-tion the whole agricultural phase, excluding guar seed processing, transport and use. The hectare was chosen as the functional unit to compare guar production to other alternative crops in the same area. Data required for the development of the study were collected through a specific questionnaire that was submitted to the farms involved in the experiment (Farm 1 and Farm 2). The questionnaire was structured in order to analytically gather all the inputs and outputs necessary to realise a single inventory (Table 2), necessary for the sub-sequent environmental and economic elaborations.
Table 1. Model of the experimental trial.
Farming operations Farm 1 Farm 2
Texture Clayey Sandy
Tillage Ploughing Harrowing
Fertilisation 11-22-16 (260 kg ha–1) 11-22-16 (260 kg ha–1)
Superphosphates 19% (150 kg ha–1) Superphosphates 19% (200 kg ha–1)
Seedbed preparation Rotary tillage Rotary tillage
Sowing and rolling Traditional seeder Traditional seeder
Seeds (20 kg ha–1) Seeds (20 kg ha–1)
Irrigation Sprinkler irrigation system Sprinkler irrigation system
(1600 m3ha–1) (2300 m3ha–1)
Weeding Pendimethalin (2.5 kg ha–1c.c.) Most Micro (2.5 kg ha–1c.c.)
Glyphosate (6.25 kg ha–1c.c.) Roundup (6.25 kg ha–1c.c.)
Phytosanitary treatments Metalaxil-M (0.37 kg ha–1c.c.)
-Harvesting Combine harvester (wheat) Combine harvester (wheat)
Yield 1.84 t ha–1 2.21 t ha–1
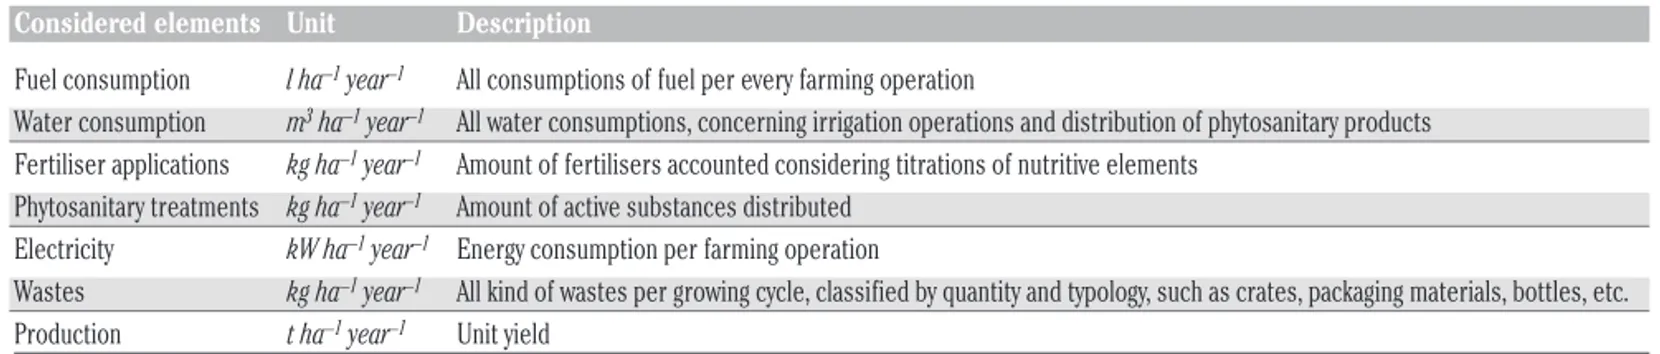
Table 2. Inventory components.
Considered elements Unit Description
Fuel consumption l ha–1year–1 All consumptions of fuel per every farming operation
Water consumption m3ha–1year–1 All water consumptions, concerning irrigation operations and distribution of phytosanitary products Fertiliser applications kg ha–1year–1 Amount of fertilisers accounted considering titrations of nutritive elements
Phytosanitary treatments kg ha–1year–1 Amount of active substances distributed Electricity kW ha–1year–1 Energy consumption per farming operation
Wastes kg ha–1year–1 All kind of wastes per growing cycle, classified by quantity and typology, such as crates, packaging materials, bottles, etc. Production t ha–1year–1 Unit yield
Non-commercial
use
Environmental analysis data were processed through SimaPro 7.3 software (PRé Consultants bv, Amersfoort, The Netherlands) and Ecoinvent V.2.2 database (Swiss Centre for Life Cycle Invent., St. Gallen, Switzerland) while the impact assessment method selected was the Eco-indicator 99 (PRè 2010a, 2010b). The indicator IPCC GWP 100a was used to calculate the global warming potential (GWP), assessing the amount of carbon dioxide and other greenhouse gas emissions in kg of CO2 equivalents, associated with a product throughout its life cycle (Wiedmann e Minx, 2010; Luciani et al., 2011; Strano et al., 2013). An economic analysis was also carried out per hectare of
agricultur-al area, and consisted in the cagricultur-alculation of production costs, that is the monetisation of the technical means employed in the process, includ-ing remuneration of labour, land and workinclud-ing capital.
An analysis was also carried out simulating the use of outsourced services and labour for some operations (Farm 1_Out and Farm 2_Out) in order to evaluate the advantage of purchasing stock capitals. Each element of production costs was grouped into four categories (Gulisano et al., 2013): materials, services, labour, quotas and other attributions. The first category considered all costs concerning technical means (seeds, fertilisers, phytosanitary products, water and energy for
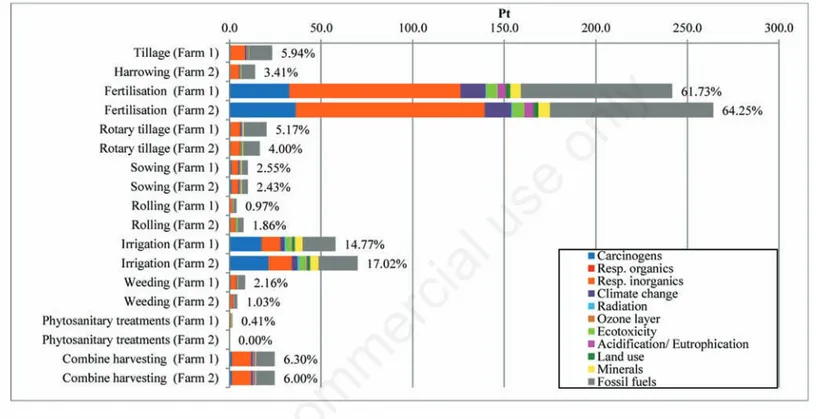
irriga-Figure 1. Life cycle assessment results of guar cultivation - Eco-indicator 99.
Figure 2. Production cost of guar cultivation. Figure 3. Trends of profit on varying purchase price of guar grains.
Non-commercial
use
tion, fuels and lubricants). The second category included outsourced cost items, such as expert consultancies, transport and growing opera-tions. The third category included wages to remunerate the insourced labour. It was assumed that only temporary labour was employed, tak-ing into account the local average wage per hour, includtak-ing social secu-rity contributions.
The fourth category included all those cost items not directly attrib-utable to specific growing operations, represented by quotas (depreci-ation, maintenance and insurance), levies, interests (remuneration of working capital) and rent (remuneration of land).
At farm level, the difference between assets and liabilities in the eco-nomic budget gives an ecoeco-nomic performance indicator, i.e. the profit. In more detail, assets were calculated by multiplying the quantity of products by the unit price of guar grains. In order to infer the econom-ic profitability threshold of the processes analysed in this study, simu-lations were conducted by supposing sale price variations from a min-imum of 0.8 € kg–1to a maximum of 1.4 € kg–1.
Results and discussion
Results of the application of LCA showed that the most sustainable scenario, from an environmental point of view is Farm 1 with a single score of 391.7 Pts, while 411.2 Pts are assigned to Farm 2; the relative gap was less than 5%, a small difference between scenarios. The man-agement techniques with greatest environmental impact were fertilisa-tion (Farm 1: 61.73%; Farm 2: 64.25%), followed by irrigafertilisa-tion (Farm 1: 14.77%; Farm 2: 17.02%) (Figure 1). These values affected the impact categories carcinogens, respiratory inorganics and fossil fuels, mostly due to the use of fertilisers and the energy consumption for irrigation. Elaborations made using IPCC GWP 100a highlighted that the most efficient production process belongs to Farm 1 with emissions of 2751.4 kg of CO2eq., while the scenario represented by Farm 2 emitted 2905.5 kg of CO2eq., with a relative variance of 5.6%. As above, these emis-sions are mostly attributed to the phases of fertilisation (Farm 1: 67.7%; Farm 2: 72.4%), irrigation (Farm 1: 12.0%; Farm 2: 15.7%) and harvest-ing and threshharvest-ing operations (Farm 1 and Farm 2: 5.5%). For fertilisa-tion, they arise mainly from production and application; for irrigafertilisa-tion, from the electricity used (from non-renewable sources); and for har-vesting and threshing, from the fossil fuels consumed. In particular, the production of 1 kg of nitrogen fertiliser (N) releases 8.6 kg of CO2eq. (calculated with IPCC method and using Ecoinvent 2.2 database), therefore, a potential reduction of N amounts could lead to remarkable reductions in GHG emissions.
Regarding economic sustainability, Figure 2 shows that the best per-forming scenario belongs to Farm 1, with a total production cost of 1964.52 € ha–1year–1, while Farm 2 shows a total cost of 2141.95 € ha–1 year–1; the variation between them is 9%.
Analysing the differences that occur when outsourcing, in scenarios Farm 1_Out and Farm 2_Out production costs increase to 2243.2 € ha–1 year–1and 2317.1 € ha–1year–1respectively, with a variation of 3.3%. In all of the four scenarios, the strongest cost incidence is observed with-in the categories materials and quotas and other attributions. Figure 3 shows the trend of profits as the purchase price of the product varies, in particular highlighting that for Farm 2 scenario the profitability threshold starts at 0.96 € kg–1, while Farm 1_Out needs a minimum purchase price of 1.23 € kg–1to break even.
To our knowledge, this is the first study concerning the environmen-tal and economic sustainability of guar production. However, some researchers conducted LCA applications for other crops, potential guar competitors, useful to compare our findings in terms of CO2eq.
emis-sions, taking into account the same functional unit (i.e. the hectare) and impact assessment method (i.e. Eco-indicator 99 and GWP). Abeliotis et al. (2013) compared 7 pea varieties, using an analogous system boundary (except infrastructure construction phase) and the same functional unit: the results of GWP evaluation shows a values gap from 2890 kg CO2eq. ha–1to 6850 kg CO2eq ha–1. In a similar study, Kopke and Nemecek (2010) reported values of 5428 kg CO2eq. ha–1 for potato, 5796 kg CO2eq. ha–1for grain maize, 4247 kg CO2eq. ha–1for corn silage, 3209 kg CO2eq. ha–1 for pea, 3999 kg CO2eq. ha–1 for soy-bean and 3217 kg CO2eq. ha–1 for faba beans; finally, Nemecek et al. (2012) conducted a GWP assessment of 27 different crops through a data mining model (MEXALCA). Therefore, plausibly, according to our findings, guar can be regarded as a low-emission crop (with emissions less than 3000 kg of CO2eq.).
However, through specific arrangements, the environmental impacts generated by guar production can be significantly reduced, for example by promoting nitrogen fixation, refining agricultural practices (sowing time, sowing density, irrigation system and volumes, fertilisation, etc.) and adopting suitable agricultural machineries with growing system (inter-row hoe, combine with air-reel headers, precision seeder, etc.).
Conclusions
In this study, the environmental and economic analysis conducted on two farms in Southern Italy concerning the cultivation of guar in a Mediterranean area has highlighted which elements can influence sus-tainability and their relative intensity. Compared to the other competi-tive crops, guar, with less than 3000 kg of CO2eq. emissions, can be considered as a low-emission crop.
Economic profitability thresholds were calculated in case of out-sourcing of some farming operations, and also profit trends according to purchase price variations. In particular, our findings showed that guar growing is economically sustainable when the purchase price of grains is not less than 0.96 € kg–1and when management techniques such as fertilisation, rotary tillage, sowing, rolling and weeding are insourced by the farm, i.e. using its own workers.
Our results showed that guar growing could be an important oppor-tunity for diversification or integration of incomes, as it competes with other traditional cultivations (vegetables with spring-summer cycles and artichokes). The possible introduction of guar into Mediterranean areas could find synergies with industrial sectors that, in turn, by reducing logistic costs and environmental impacts (grain transporta-tion from farm to factory), could benefit from positive socio-economic impacts.
Furthermore, the cultivation of guar in Mediterranean areas would perform better if value were added to its industrial by-products, and production reached such an amount as to justify the nearby creation of processing industries, which would in turn boost the local economy.
References
Abeliotis K, Detsis V, Pappia C, 2013. Life cycle assessment of bean pro-duction in the Prespa National Park, Greece. J. Clean Prod. 41:89-96. Anjum S, Kalhoro MA, Afza N, Abdul Hai SM, 2001. Guar meal in
poul-try feed. J. Chem. Soc. Pakistan 23:175-7.
Elsheikh EAE, Ibrahim KA, 1999. The effect of Bradyrhizobium inocula-tion on yield and seed quality of guar (Cyamopsis tetragonoloba L.). Food Chem. 65:183-7.
Non-commercial
use
Gresta F, Sortino O, Santonoceto C, Issi L, Formantici C, Galante YM, 2013. Effects of sowing times on seed yield, protein and galac-tomannans content of four varieties of guar (Cyamopsis tetragonoloba L.) in a Mediterranean environment. Ind. Crop Prod. 41:46-52.
Gulisano G, De Luca AI, Strano A, Falcone G. 2013. Valutazioni tecnico-economiche ed ambientali della clementinicoltura in Calabria. Acta Italus Hort. 9:93-5.
Horne R, Grant T, Verghese K. 2009. Life cycle assessment. Principles, practice and prospects. CSIRO Publishing, Collingwood, Australia. Kopke U, Nemecek T. 2010. Ecological services of faba bean. Field Crop
Res. 115:217-33.
Kumar D, Singh NB. 2002. Guar in India. Scientific Publisher, Jodhpur, India.
ISO, 2006a. ISO 14040:2006 Environmental management - Life Cycle Assessment - Principles and framework. International Organization for Standardization (ISO), Geneva.
ISO, 2006b. ISO 14044:2006 Environmental management - Life Cycle Assessment - Requirements and guidelines. International Organization for Standardization (ISO), Geneva.
Losavio N, Ventrella D, Vonella AV, 2002. Adattabilità ambientale e potenzialità produttiva del guar coltivato in regime irriguo nell’Italia meridionale. Riv. Agron. 36:171-5.
Luciani R, Masoni P, Santino D, 2011. Indicatori di sostenibilità ambi-entale: la carbon footprint. Energia, Ambiente e Innovazione, 3:49-51.
Mathur NK, 2012. Industrial galactomannan polysaccharides. CRC Press, Taylor & Francis Group, Boca Raton, FL.
Nemecek T, Weiler K, Plassmann K, Schnetzer J, Gaillard G, Jefferies D, García-Suárez T, King H, Milà I, Canals L, 2012. Estimation of the variability in global warming potential of worldwide crop production using a modular extrapolation approach. J. Clean Prod. 31:106-17. Prajapati VD, Jani GK, Moradiya NG, Randeria NP, Nagar BJ, Naikwadi
NN, Variya BC, 2013. Galactomannan: a versatile biodegradable seed polysaccharide. Int. J. Biol. Macromol. 60:83-92.
PRè (Product Ecology Consultants), 2010a. Introduction to LCA with SimaPro 7. PRé Consultants bv, Amersfoort.
PRè (Product Ecology Consultants), 2010b. SimaPro database manual -Methods library. PRé Consultants bv, Amersfoort.
Sharma P, Gummagolmath KC, 2012. Reforming guar industry in India: issues and strategies. Agric. Econ. Res. Rev. 25:37-48.
Sortino O, Gresta F, 2007. Growth and yield performance of five guar cultivars in a Mediterranean environment. Riv. Agron. 4:359-64. Strano A, De Luca AI, Falcone G, Iofrida N, Stillitano D, Gulisano G. 2013.
Economic and environmental sustainability assessment of wine grape production scenarios in Southern Italy. Agric. Sci. 4:12-20. Whistler RL, Hymowitz T, 1979. Guar: agronomy, production, industrial
use, and nutrition. Purdue University Press, West Lafayette, IN. Wiedmann T, Minx J, 2010. A definition of “carbon footprint”, Research
and consulting - ISAUK Research Report 07-01. Available from: http://www.censa.org.uk/docs/ISA-UK_Report_07-01_carbon_foot-print.pdf
Zamagni A, Buttol P, Porta PL, Buonamici R, Masoni P, 2008. Critical review of the current research needs and limitations related to ISO-LCA practice. ENEA, Roma.