Systems genetics identifies Sestrin 3 as a regulator of a
proconvulsant gene network in human epileptic hippocampus
Michael R. Johnson1,§, Jacques Behmoaras#2, Leonardo Bottolo#3, Michelle L. Krishnan#4, Katharina Pernhorst#5, Paola L. Meza Santoscoy#6, Tiziana Rossetti7, Doug Speed8, Prashant K. Srivastava1,7, Marc Chadeau-Hyam9, Nabil Hajji10, Aleksandra Dabrowska10, Maxime Rotival7, Banafsheh Razzaghi7, Stjepana Kovac11, Klaus Wanisch11, Federico W. Grillo7, Anna Slaviero7, Sarah R. Langley1,7, Kirill Shkura1,7, Paolo Roncon12,13, Tisham De7, Manuel Mattheisen14,15,16, Pitt Niehusmann5, Terence J. O’Brien17, Slave Petrovski18, Marec von Lehe19, Per Hoffmann20,21, Johan Eriksson22,23,24, Alison J. Coffey25, Sven Cichon20,21, Matthew Walker11, Michele Simonato12,13,26, Bénédicte Danis27, Manuela Mazzuferi27, Patrik Foerch27, Susanne Schoch5,28, Vincenzo De Paola7, Rafal M. Kaminski27, Vincent T. Cunliffe6, Albert J. Becker5,§, and Enrico Petretto7,29,§
1Division of Brain Sciences, Imperial College London, Hammersmith Hospital Campus, Burlington
Danes Building, London W12 0NN, UK. 2Centre for Complement and Inflammation Research,
Imperial College London, Hammersmith Hospital, Du Cane Road, London W12 0NN, UK.
3Department of Mathematics, Imperial College London, 180 Queen’s Gate, London SW7 2AZ,
UK. 4Centre for the Developing Brain, Department of Perinatal Imaging and Health, St Thomas’
Hospital, King’s College London, London SE1 7EH, UK. 5Section of Translational Epileptology,
Department of Neuropathology, University of Bonn, Sigmund Freud Street 25, Bonn D-53127, Germany. 6Department of Biomedical Science, Bateson Centre, University of Sheffield, Firth
Court, Western Bank, Sheffield S10 2TN, UK. 7Medical Research Council (MRC) Clinical
Sciences Centre, Imperial College London, Hammersmith Hospital, Du Cane Road, London W12 0NN, UK. 8UCL Genetics Institute, University College London, Gower Street, London WC1E 6BT,
UK. 9Department of Epidemiology and Biostatistics, School of Public Health, MRC/PHE Centre
for Environment and Health, Imperial College London, St Mary’s Hospital, Norfolk Place, W21PG London, UK. 10Department of Medicine, Centre for Pharmacology and Therapeutics, Imperial
College London, Du Cane Road, London W12 0NN, UK. 11Institute of Neurology, University
College London, London WC1N 3BG, UK. 12Department of Medical Sciences, Section of
Pharmacology and Neuroscience Center, University of Ferrara, 44121 Ferrara, Italy. 13National
Institute of Neuroscience, 44121 Ferrara, Italy. 14Department of Genomics, Life and Brain Center,
University of Bonn, D-53127 Bonn, Germany. 15Institute of Human Genetics, University of Bonn,
D-53127 Bonn, Germany. 16Institute for Genomic Mathematics, University of Bonn, D-53127
Reprints and permission information is available online at http://npg.nature.com/reprintsandpermissions/ Correspondence and requests for materials should be addressed to M.R.J. ([email protected]) or to A.J.B. ([email protected]) or to E.P. ([email protected]).
§These authors jointly supervised this work.
Additional information
Author Manuscript
Nat Commun. Author manuscript; available in PMC 2015 October 30. Published in final edited form as:
Nat Commun. ; 6: 6031. doi:10.1038/ncomms7031.
Europe PMC Funders Author Manuscripts
Bonn, Germany. 17Department of Medicine, RMH, University of Melbourne, Royal Melbourne
Hospital, Royal Parade, Parkville, Victoria 3050, Australia. 18Department of Neurology, Royal
Melbourne Hospital, Melbourne, Parkville, Victoria 3050, Australia. 19Department of
Neurosurgery, University of Bonn Medical Center, Sigmund-Freud-Strasse 25, 53105 Bonn, Germany. 20Institute of Human Genetics, University of Bonn, Sigmund-Freud-Strasse 25, 53127
Bonn, Germany. 21Department of Biomedicine, University of Basel, Hebelstrasse 20, 4056 Basel,
Switzerland. 22Folkhälsan Research Centre, Topeliusgatan 20, 00250 Helsinki, Finland. 23Helsinki
University Central Hospital, Unit of General Practice, Haartmaninkatu 4, Helsinki 00290, Finland.
24Department of General Practice and Primary Health Care, University of Helsinki, 407, PO Box
20, Tukholmankatu 8 B, Helsinki 00014, Finland. 25Wellcome Trust Sanger Institute, Wellcome
Trust Genome Campus, Hinxton CB10 1SA, UK. 26Laboratory for Technologies of Advanced
Therapies (LTTA), University of Ferrara, 44121 Ferrara, Italy. 27Neuroscience TA, UCB
Biopharma SPRL, Avenue de l’industrie, R9, B-1420 Braine l’Alleud, Belgium. 28Department of
Epileptology, University of Bonn Medical Center, Sigmund-Freud-Strasse 25, Bonn D-53127, Germany. 29Duke-NUS Graduate Medical School, 8 College Road, Singapore 169857,
Singapore.
# These authors contributed equally to this work.
Abstract
Gene-regulatory network analysis is a powerful approach to elucidate the molecular processes and pathways underlying complex disease. Here we employ systems genetics approaches to
characterize the genetic regulation of pathophysiological pathways in human temporal lobe epilepsy (TLE). Using surgically acquired hippocampi from 129 TLE patients, we identify a gene-regulatory network genetically associated with epilepsy that contains a specialized, highly expressed transcriptional module encoding proconvulsive cytokines and Toll-like receptor signalling genes. RNA sequencing analysis in a mouse model of TLE using 100 epileptic and 100 control hippocampi shows the proconvulsive module is preserved across-species, specific to the epileptic hippocampus and upregulated in chronic epilepsy. In the TLE patients, we map the trans-acting genetic control of this proconvulsive module to Sestrin 3 (SESN3), and demonstrate that
SESN3 positively regulates the module in macrophages, microglia and neurons.
Morpholino-mediated Sesn3 knockdown in zebrafish confirms the regulation of the transcriptional module, and attenuates chemically induced behavioural seizures in vivo.
Epilepsy is a serious neurological disorder affecting about 1% of the world’s population. Recently, a growing body of experimental and clinical data has implicated Toll-like receptor (TLR) signalling1 and release of proconvulsant inflammatory molecules (that is, interleukin (IL)-1β) in both seizure generation and epileptogenesis2,3. However, the pathogenetic mechanisms linking these inflammatory processes with the development (and recurrence) of epileptic seizures in humans are unclear. Despite high heritability of epilepsy4–6, both genome-wide association studies (GWAS) and exome sequencing approaches have so far provided limited insights into the genetic regulatory mechanisms underlying inflammatory pathways in epilepsy aetiology7–11, and traditional single-variant association approaches are likely to be underpowered to detect complex gene network interactions that underlie disease
Europe PMC Funders Author Manuscripts
susceptibility12. As the molecular processes driving complex disease usually affect sets of genes acting in concert, one alternative strategy is to use systems-level approaches to investigate transcriptional networks and pathways within pathologically relevant cells and tissues13,14. Integrated analysis of transcriptional networks with genetic susceptibility data and phenotypic information allows specific transcriptional programmes to be connected to disease states, and thereby can identify disease pathways and their genetic regulators as new targets for therapeutic intervention15.
Almost uniquely among disorders of the human brain, epilepsy surgery offers opportunities for gene expression profiling in ante-mortem brain tissue from pathophysiologically relevant brain structures such as the hippocampus16. This allows direct investigation of
transcriptional programmes in brain tissue from living epilepsy patients. In this study, we integrate unsupervised network analysis of global gene expression in the hippocampi of patients with temporal lobe epilepsy (TLE) with GWAS data in a systems genetics
approach17. We uncover pathways and transcriptional programmes associated with epilepsy that are conserved in mouse epileptic hippocampus, including a proconvulsant gene network encoding IL-1β3 and TLR-signalling genes1 previously implicated in epilepsy. Using genome-wide Bayesian expression QTL mapping18, we probe the genome for key genetic regulators of the network in human brain. We pinpoint an unexpected gene, Sestrin 3 (SESN3) whose protein product controls the intracellular response to reactive oxygen species19–22, as a trans-acting genetic regulator of the proconvulsant gene network in the
human epileptic hippocampus. We carry out validation experiments in independent in vitro and in vivo systems, which confirm the genetic regulation of the proconvulsant
transcriptional programme in epilepsy by Sestrin 3, therefore providing a first evidence of a function for SESN3 in disorders of the human brain.
Results
Identification of a gene network associated with epilepsy
We first assessed the degree of variation in gene expression between hippocampal subfields in TLE patients with hippocampal sclerosis, and compared this with the total variation in gene expression measured both across subjects and between subfields (Supplementary Fig. 1). We found higher variability in gene expression across TLE subjects than between the hippocampal subfields alone, suggesting that variation in whole hippocampus expression can be used to infer co-expression networks in the hippocampus of TLE patients
(Supplementary Fig. 1). After excluding subjects with incomplete clinical data or nonhippocampal sclerosis pathology, whole-genome expression profiles in surgically resected hippocampi from 129 TLE patients (median age at surgery 35 years, range 1–64 years, male/female ratio of 1.2:1; Supplementary Table 1) were available for gene co-expression network analysis.
We then investigated whether the transcriptome in the hippocampus of these 129 TLE patients is organized into discrete gene co-expression networks, and if these have functional implications for susceptibility to epilepsy. Gene co-expression networks were reconstructed genome wide using Graphical Gaussian Models (GGMs)23, which identified a large co-expression network comprising 442 annotated genes (false discovery rate (FDR)<5%, Fig.
Europe PMC Funders Author Manuscripts
1a and Supplementary Data 1). To investigate whether the protein products of the TLE-hippocampus derived transcriptional network (TLE-network) genes have a shared function at the protein level, we used the DAPPLE algorithm24. This method interrogates high-confidence protein–protein interactions to assess the physical connections among proteins encoded by the genes in the network. Genes comprising the TLE-network were found to have increased protein–protein interconnectivity as compared with random protein–protein interaction networks (P = 9.9 × 10⁻⁵, Supplementary Fig. 2). This provides evidence that proteins encoded by the co-expressed genes in the TLE-network interact physically, supporting the validity of the gene network topography.
As gene expression may vary both as a cause and a consequence of disease, we investigated the causal relationship between the TLE-network and epilepsy by integration with genetic susceptibility data. Here, DNA variation was used to infer causal relationships between the network and epilepsy by assessing whether the network as a whole was genetically associated with epilepsy. To this aim, we used focal epilepsy GWAS data6,25 from a
separate cohort of 1,429 cases (consisting mainly of patients with TLE) and 7,358 healthy controls. Although no single-nucleotide polymorphism (SNP) achieved genome-wide significance in the epilepsy GWAS (Supplementary Fig. 3), we found that the TLE-network as a whole was highly enriched for genetic associations to focal epilepsy compared with genes not in the network (P = 2 × 10⁻⁷; Fig. 1a and Supplementary Table 2). These
integrated analyses of co-expression network and genetic susceptibility data from a focal epilepsy GWAS provide independent evidence to support the causal involvement of the TLE-network in epilepsy aetiology.
Conservation and functional specialization of the network
The TLE-network was significantly enriched for genes belonging to several biological pathways involving cell-to-extracellular matrix adhesion including ‘extracellular matrix– receptor interaction’ (P = 3.9 × 10⁻⁵), ‘focal adhesion’ (P = 1.4 × 10⁻⁴) and inflammation, such as the ‘cytokine–cytokine receptor interaction’ (P = 2.4 × 10⁻⁵) and ‘TLR signalling’ (P = 3.9 × 10⁻⁵; Fig. 1b). The observation that the TLE-network was enriched for multiple pathways led us to investigate whether the network contained functionally homogenous transcriptional modules (that is, sub-networks of highly correlated genes) with implications for epilepsy aetiology. Using unsupervised agglomerate clustering approaches (see
Supplementary Methods), we identified two transcriptional modules comprising 69
(Module-1) and 54 (Module-2) unique genes, respectively (Fig. 1c and Supplementary Data 1). Module-1 was specifically enriched for gene ontology categories related to inflammatory mechanisms, whereas Module-2 was enriched for cell-to-extracellular matrix adhesion processes (Fig. 1d and Supplementary Table 3), indicating functional sub-specialization within the larger TLE-network. We observed that Module-1 genes were significantly upregulated as compared with genes in the larger TLE-network, Module-2, or with respect to all other genes profiled in the hippocampus of TLE patients (Fig. 1e). This increased hippocampal expression of Module-1 genes in TLE patients was not observed in separate gene expression data sets from the hippocampus of healthy subjects (that is, individuals clinically classified as neurologically normal; Supplementary Fig. 4). Notably, Module-1 was markedly enriched for highly expressed inflammatory cytokines (16-fold enrichment, P
Europe PMC Funders Author Manuscripts
= 6.6 × 10⁻¹³) many of which belong to the IL-1 signalling cascade (IL-1β, IL-1RN, IL-1α,
TNFα) and the TLR-signalling pathway (11-fold enrichment, P = 1.4 × 10⁻⁶), previously
implicated in epileptogenesis1 and brain inflammation2,3 (Supplementary Fig. 5). Taken together, these data indicate the presence of a coordinated transcriptional programme (Module-1), encompassing TLR activation and release of proinflammatory cytokines (including IL-1β), in chronic human epileptic hippocampus as previously hypothesized3,26. We then investigated whether the TLE-network and Module-1 genes, in particular, were conserved across-species and to this aim we carried out high-throughput sequencing of mRNA (RNA-Seq) in whole hippocampus from 100 epileptic (pilocarpine model)27 and 100 control naïve mice (full details of this model are reported in the Supplementary Methods). We employed GGMs to assess the co-expression relationships between the 371 mouse orthologues of the human TLE-network genes, and found that 312 genes (84%) had significant co-expression (FDR<5%) with at least another network gene in mouse epileptic hippocampus (Fig. 2a). The conserved TLE-network genes formed 1,119 significant partial correlations in mouse epileptic hippocampus, which is significantly higher than expected by chance (P = 0.001 by 10,000 bootstrap permutations; Fig. 2b). In contrast, only 615
significant partial correlations between the same 312 genes were detected in healthy hippocampus (P = 0.659 by 10,000 bootstrap permutations), suggesting that the TLE-network is specifically conserved in the epileptic mouse hippocampus (Fig. 2b). In keeping with the high expression of proinflammatory genes observed in the hippocampus of TLE patients (Supplementary Fig. 5), the mouse orthologues of Module-1 genes that were significantly upregulated in epileptic hippocampus were enriched for TLR-signalling and cytokines (gene set enrichment analysis28, P = 9.03 × 10⁻⁴, Fig. 2c). These comparative genomics analyses revealed that, to a large extent, the hippocampal TLE-network is conserved across-species, and confirm that genes for TLR signalling and proinflammatory cytokines within the TLE-network are upregulated in chronic epileptic hippocampus. SESN3 is a genetic regulator of the proinflammatory network
We set out to identify genetic variants that regulate the gene co-expression modules (that is, regulatory ‘hotspots’) by employing genome-wide Bayesian expression QTL mapping approaches18,29. To this aim, we have developed a multi-step strategy to identify SNPs that regulate the expression of a transcriptional module (or network) as a whole. As first step, we summarize the expression of the genes in each module using principal component (PC) analysis and detect regulatory ‘hotspots’ using a Bayesian regression model at the genome-wide level29. This analysis prioritizes genomic regions associated with variation in mRNA expression of the genes in each module. As a second step, to refine the genetic mapping results, we regress jointly the mRNA levels of module genes to all SNPs within the regulatory locus identified in the first step18. Given the functional specialization within the large TLE-network (Fig. 1d), we investigated the genetic regulation of both Module-1 and Module-2, by analysing 527,684 genome-wide SNPs in the TLE patient cohort. In the first step, we identified a single locus on chromosome 11q21 centred on SNP rs10501829, which was significantly associated with the first PC of Module-1 expression (FDR<5%; Fig. 3a). Module-2 showed no significant genome-wide associations (Supplementary Fig. 6). In the second step, we investigated in detail the locus on chromosome 11q21 regulating Module-1
Europe PMC Funders Author Manuscripts
and carried out joint mRNA levels-SNPs analysis of all genes in Module-1 and all SNPs genotyped within a 1-Mbp region centred on SNP rs10501829. This analysis identified three additional SNPs (rs530190, rs7107661 and rs6483435) in the Best Model Visited (that is, the best combination of SNPs predicting mRNA level of module genes, see Supplementary Methods) that were associated with the majority of genes of Module-1 (58–74% of Module-1 genes are predicted by individual SNPs, Fig. 3b). The set of SNPs regulating in
trans the expression of Module-1 genes defined the boundaries of a minimal regulatory
region spanning ~383 kb (Fig. 3b).
The larger 1-Mbp region centred on SNP rs10501829 contained eight annotated protein-coding genes (Fig. 3b). To further prioritize candidate genes, we carried out co-expression analysis between each of these genes and all genes in Module-1, and found that Sestrin 3 (SESN3) was, on average, most strongly and positively correlated with Module-1 gene expression (P = 1.7 × 10⁻¹³, Fig. 3c). The positive association between SESN3 and
Module-1 gene expression remained significant following genome-wide correlation analysis in human hippocampus (P < 0.00001, Supplementary Fig. 7). In summary, SESN3 is the only gene within the minimal regulatory region and, when compared with all genes within a 1-Mbp window around SNP rs10501829, showed the strongest correlation with Module-1 gene expression. Similarly, in the epileptic mouse hippocampus, we found that increased
Sesn3 mRNA expression was also significantly associated with upregulation of Module-1
genes (P = 5.4 × 10⁻⁶, Fig. 3d), therefore providing independent, cross-species evidence supporting SESN3 as a positive regulator of Module-1 genes in epileptic hippocampus. Taken together, these data prioritize SESN3 as a candidate gene for the trans-acting genetic regulation of Module-1. To test this hypothesis, we first carried out gene knockdown experiments followed by transcriptional analysis of Module-1 genes by means of RNA interference using short interfering RNA (siRNA). Initially, we used murine bone marrow-derived macrophages (BMDMs) and BV2 microglia cell line as an in vitro system as Module-1 recapitulates the ATF3/AP1 transcriptional complex and IL-1 signalling (Supplementary Fig. 8), known to be highly expressed in lipopolysaccharide (LPS)-stimulated macrophages30. Consistent with the positive correlation of Module-1 genes with
SESN3 mRNA expression (Fig. 3c,d and Supplementary Fig. 7), we observed decreased
expression of Module-1 genes after siRNA-mediated knockdown of SESN3 in both LPS-stimulated BMDMs and BV2 microglia cells (Fig. 4a,b). Similar results were found in unstimulated BV2 microglial cells, suggesting that SESN3 can modulate expression of proinflammatory genes (for example, IL-1β, IL-1RN, IL-1α, TNFα) even in the absence of a strong inflammatory stimulus (Fig. 4c). Within the human brain we localized SESN3 expression to neurons by immunohistochemistry (Fig. 4d), and found that it is highly expressed in the hippocampus of TLE patients as compared with hippocampus from control autopsy samples (Fig. 4e and Supplementary Fig. 9). In keeping with this, we found increased Sesn3 mRNA expression in the mouse hippocampus after pilocarpine-induced status epilepticus (Supplementary Fig. 10), suggesting an association between SESN3 gene expression and epilepsy that is conserved across-species. We then tested whether Module-1 genes are upregulated when SESN3 is overexpressed in neurons. To address this aim, we used an integrating lentiviral vector (LV) for gene overexpression in primary murine
Europe PMC Funders Author Manuscripts
neurons (see Supplementary Methods) and quantitative PCR analysis showed that the relative levels of Sesn3 mRNA were markedly increased in transduced neurons compared with the levels observed in mock transduction (Fig. 4f). Consistent with the observed positive correlation between increased Sesn3 expression and Module-1 genes in the
hippocampus (Fig. 3c,d), lentiviral-mediated overexpression of Sesn3 resulted in significant upregulation of Module-1 genes in hippocampal neurons (Fig. 4f). These in vitro
experiments show that Sesn3 is capable of regulating Module-1 gene expression in different cell types and in particular of inducing upregulation of proinflammatory genes in
hippocampal neuronal cells. Our findings in primary neurons are in keeping with previous data reporting the activity of several inflammatory molecules in neuronal cells under pathological conditions31, including IL-1β and its receptor32. Furthermore, the upregulation of proinflammatory genes in neurons supports the ‘neurogenic inflammation’ hypothesis, wherein neurons are proposed as triggers of innate and adaptive immune-cell activation in the central nervous system (CNS; reviewed in Xanthos and Sandkuhler33).
SESN3 regulates chemically induced behavioural seizures
The in vitro data, combined with the positive association between SESN3 and Module-1 gene expression in human and mouse epileptic hippocampus, indicate that SESN3 is a positive regulator of Module-1. We hypothesized that inhibiting SESN3 would reduce the activity of genes in functional pathways enriched in Module-1, including proconvulsant signalling molecules, and thus by extension could have seizure-suppressing effects. To test this hypothesis in vivo, we investigated the role of SESN3 in a zebrafish model of
convulsant-induced seizures34,35. In this model, exposure of 2- or 3-day-old zebrafish larvae to the convulsant agent pentylenetetrazole (PTZ) rapidly induces the expression of synaptic activity-regulated genes in the CNS and causes vigorous episodes of calcium flux in muscle cells as well as intense locomotor activity characteristic of epileptic seizures34,35. This acute seizure model has been primarily used to investigate the anti-/proconvulsant activity of compounds36 and for in vivo drug discovery34. In particular, molecular and behavioural phenotypes in the zebrafish PTZ-induced seizure model have been employed to identify compounds that attenuate seizure activity37. We employed this model to correlate the locomotor responses with gene network dynamics, that is, transcriptional activation of the neuronal activity-regulated gene c-fos38 and an additional subset of Module-1 genes in response to PTZ treatment in Sesn3 morphant and control morphant larvae. Sesn3 showed widespread expression in the brain of 3 and 4 days post fertilization (d.p.f.) zebrafish larvae (Supplementary Fig. 11) and, following PTZ treatment, we found that Sesn3 morphant zebrafish larvae exhibited significantly reduced locomotor activity as compared with control morphant larvae (Fig. 5a). To test the specificity of the morpholino effect, we co-injected the
Sesn3 morpholinos (Supplementary Fig. 12) along with synthetic Sesn3 mRNA, which
cannot be targeted by either of the splice-blocking morpholinos (see Supplementary Methods), and assessed whether the Sesn3 mRNA could rescue the morphant phenotype. We observed an almost complete rescue of the locomotor activity phenotype (only 10% difference between uninjected larvae and larvae co-injected with Sesn3 morpholinos and
Sesn3 mRNA), with no significant differences in the locomotor activities between the
uninjected larvae and the larvae injected with synthetic Sesn3 mRNA alone (Fig. 5b).
Europe PMC Funders Author Manuscripts
To further confirm Sesn3-dependent modification of neuronal response to PTZ, we measured transcriptional activation of the neuronal activity-regulated gene c-fos, an important regulator for cellular mechanisms mediating neuronal excitability and survival38. Consistent with the behavioural assay (Fig. 5a), there was decreased expression of c-fos in the brain (mostly in forebrain and midbrain) following PTZ exposure in Sesn3 morphant larvae as compared with control morphant larvae (Fig. 5c and Supplementary Fig. 12). As silencing of Sesn3 resulted in downregulation of Module-1 genes in vitro (Fig. 4a–c), we tested whether inhibiting Sesn3 could similarly reduce the activity of Module-1 genes following PTZ exposure in vivo. We observed significant reduction in the PTZ-induced mRNA expression of Module-1 genes in the Sesn3 morphant as compared with control morphant larvae (Fig. 5d), and we also found that transient overexpression of Sesn3 in zebrafish larvae increased expression of Module-1 genes independently of PTZ treatment (Fig. 5e). Taken together, these data show that Sesn3 knockdown attenuates both PTZ-induced locomotor convulsive behaviour and the transcriptional responses of c-fos and Module-1 genes to treatment with PTZ. These findings in the zebrafish model support the evidence from our studies of human and mouse epileptic hippocampus and primary murine neurons that SESN3 positively regulates expression of proconvulsive molecules (Module-1 genes).
Discussion
Deciphering the complex regulatory processes of pathophysiological pathways in human brain remains a challenge due to the inaccessibility of ante-mortem tissue but can have important mechanistic and therapeutic implications39. In this study, we have used surgical hippocampal tissue samples and employed systems genetics approaches17 to investigate transcriptional networks for epilepsy and their genetic regulation. We identified a large gene co-expression network in the human epileptic hippocampus that was conserved in mouse epileptic hippocampus and was enriched for GWAS genetic signals of focal epilepsy. In keeping with similar network-based studies of complex disease such as type-1 diabetes40 and autism spectrum disorder41,42, our approach leverages the combined evidence from genetic susceptibility variants across multiple genes15 to link the TLE-hippocampus network with susceptibility to focal epilepsy. Within the TLE-network, we identified a functionally coherent and coordinated transcriptional programme (Module-1), which was overexpressed in the hippocampus of TLE patients, and which encoded epileptogenic IL-1 (refs 2,3,43) and TLR-signalling pathways1. We confirmed the upregulation TLR-signalling genes and proinflammatory cytokines in chronic epilepsy by RNA-Seq analysis in 200 mouse
hippocampi. Preclinical studies in experimental models of epilepsy have consistently shown that individual proinflammatory cytokines such as IL-1β or tumor necrosis factor (TNF)-α are overexpressed in brain areas of seizure generation and propagation44. Therefore, targeting TLR and IL-1 signalling has been proposed as a possible avenue for therapeutic intervention in epilepsy and antiepileptogenesis1,3, including reduction of acute seizures45 and drug-resistant chronic epileptic activity46. The identification of upstream genetic regulators of these pathways in the human epileptic brain might suggest opportunities for novel targets for disease modification. To investigate the genetic regulation of the TLE-network and the proinflammatory module therein, we employed Bayesian expression QTL
Europe PMC Funders Author Manuscripts
mapping approaches18, which identified SESN3 as a trans-acting genetic regulator of a proinflammatory transcriptional programme in the epileptic human hippocampus. The positive regulation of this network by SESN3 was confirmed in vitro across different cell types by gene silencing (resulting in ~50% reduction of Module-1 gene expression) and overexpression experiments (resulting in approximately two- to sevenfold activation of Module-1 genes, Fig. 4), and in vivo using a zebrafish model of chemically induced seizures (Fig. 5e).
SESN3 is a member of the Sestrin family of proteins that have been shown to decrease
intracellular reactive oxygen species and to confer resistance to oxidative stress19. Intrinsic antioxidant defenses are important for neuronal longevity and the genes that regulate these processes might well influence pathological processes associated with oxidative damage in the brain, a common feature of many neurodegenerative diseases including epilepsy47,48. Therefore, we hypothesize that SESN3 might regulate neuro-inflammatory molecules, previously implicated in epilepsy1,33,43,49, through modulation of oxidative stress in the brain.
Our systems genetics analysis in the human hippocampus, combined with in vitro and in
vivo data, revealed SESN3-dependent regulation of epileptogenic IL-1β3 and TLR-signalling genes1. The upstream genetic control of the proconvulsant transcriptional programme by
SESN3 in human TLE-hippocampus suggested a role for this gene in modulating seizures.
To test the potential functional role of SESN3 in vivo, we used an experimental model of acute epileptic seizures34,37 and found that knockdown of Sesn3 attenuated chemical convulsant-induced locomotor activity and c-fos expression, as well as modulating Module-1 gene expression (Fig. 5). Our in vitro data in macrophages, BV2 microglial cells and primary neurons showed that SESN3 is a positive regulator of proinflammatory
molecules (Fig. 4), including IL-1β and TNF-α, major mediators of inflammation, which are capable of inducing changes in neuronal excitability50. The finding of reduced severity of PTZ-induced seizures upon knockdown of Sesn3 in the zebrafish model is consistent with previous studies in rodents describing the effects of proinflammatory cytokines on seizures. In the context of pre-existing brain inflammation, antibody-mediated antagonism of TNF-α function inhibited susceptibility to PTZ-induced seizures in rats51, whereas administration of exogenous TNF-α increased susceptibility to PTZ-induced seizures52. Our findings in zebrafish are therefore in keeping with a role for SESN3 in regulating proinflammatory cytokines and their downstream effect on CNS excitability and seizure susceptibility. Taken together, our data provide the first evidence of a function for SESN3 in regulating proconvulsant agents (for example, TNF-α, IL-1 and TLR-signalling genes) in human epileptic hippocampus, and suggest SESN3 as a new potential target for modulating brain inflammation3,44 and CNS excitability53. Our systems genetics approach builds on and extends previous methods correlating individual genetic variation with disease susceptibility by identifying disease-associated gene networks, pathophysiological pathways and their upstream genetic regulators in human brain. More generally, the systems genetics
framework described here can be employed to identify genes and regulatory networks across diverse neuropsychiatric disorders where genetic factors can perturb underlying molecular pathways in the brain.
Europe PMC Funders Author Manuscripts
Methods
Gene expression profiling in the human hippocampus
All 129 patients considered in this study had mesial TLE and all tissue samples were from indistinguishable hippocampal tissue portions. Sample preparation and microarray analysis of human hippocampi are detailed in Supplementary Methods. Expression data were analysed using Illumina’s GenomeStudio Gene Expression Module and normalized by quantile normalization with background subtraction. Microarray probes were annotated using either the Human HT-12 v3 annotation file or Ensembl (release 72). All patients gave informed consent for use of their tissue and all procedures were conducted in accordance with the Declaration of Helsinki and approved by the Ethics Committee of the University of Bonn Medical Center.
Gene co-expression network analysis
Gene co-expression networks were reconstructed using GGMs, which use partial
correlations to infer co-expression relationships between any microarray probe pair in the data set, removing the effect of other probes23. We used the empirical Bayes local FDR statistics54 to extract significant partial correlations (Supplementary Fig. 13), and which identified a large set of 2,124 inter-connected nodes belonging to the same connected component (TLE-network, Supplementary Data 2). Network extraction and identification of transcriptional modules are described in the Supplementary Methods.
Mapping the genetic control of networks
We used Bayesian variable selection models18,29 to identify the genetic control points (regulatory ‘hotspots’) of transcriptional modules in the TLE patient cohort. First, we combined PC analysis55 with multivariate regression approaches to prioritize genome-wide genomic regions associated with the module expression. We then analysed all genes of the module with all SNPs in the regulatory region using the hierarchical evolutionary stochastic search algorithm18, where the module genes’ expression are jointly considered. Further details are reported in Supplementary Methods.
Genetic association of the TLE-network with epilepsy
To test if TLE-network genes are likely to be causally involved in the disease process, we assessed whether network genes are enriched for SNP variants associated to focal epilepsy by GWAS6,25. Full details on the GWAS of focal epilepsy are reported in Supplementary Methods. Briefly, in the GWAS-enrichment analysis each gene of the TLE-network was assigned a GWAS significance value consisting of the smallest P-value of all SNPs mapped to it. We used the hypergeometric distribution test to assess whether SNPs close to (<100 kb from) any network gene were more likely to associate with epilepsy by GWAS than SNPs close to genes not in the TLE-network. Empirical GWAS-enrichment P-values were generated by 1,000,000 randomly selected gene-sets and are reported in Supplementary Table 2 (see Supplementary Methods for additional details).
Europe PMC Funders Author Manuscripts
RNA-Seq analysis in the mouse hippocampus
RNA-Seq analysis in whole hippocampus from 100 epileptic (pilocarpine model)27 and 100 control naïve mice (NMRI) is detailed in Supplementary Methods. Briefly, raw reads were mapped to the reference mouse genome (mm10) using TopHat version 2.0.8 (ref. 56) and read counts per gene were normalized across all samples using the ‘trimmed mean of M-value’ approach57. Differential expression analysis was performed using the edgeR57 and a threshold of 5% FDR was used to identify significant gene expression changes.
Experimental animals were used only once for each study. All experimental procedures complied with the guidelines of the European Union Directive 2010/63/EU. A local ethical committee approved the experimental protocol.
In vitro studies
Details on all cell cultures used in these studies are reported in Supplementary Methods. SiRNA knockdown experiments were performed in murine BMDMs and BV2 microglia cell lines using a mouse Sesn3 ON-TARGETplus SMARTpool siRNA (100 nM, ThermoFisher Scientific) and Dharmafect 1 (ThermoFisher Scientific) as transfection reagent, according to the manufacturer’s recommendations. For LPS stimulation experiments, the transfected cells were washed twice in DMEM and stimulated with LPS (Sigma, 100 ng ml−1) for an hour.
For overexpression experiments, a third-generation LV was used to transduce murine primary hippocampal neuronal culture. Additional information and details on Sesn3 siRNA target sequences, the real-time quantitative PCR for Module-1 genes and primer sequences are given in Supplementary Methods and Supplementary Table 4. The relative expression levels normalized to Beta-actin (or Gapdh as indicated) gene expression were then determined by the 2−ΔΔCt method.
In vivo studies
To study the function of sestrin 3 in response to PTZ-induced seizures, two different morpholinos were designed to block the normal splicing of the zebrafish Sesn3 primary transcript (see Supplementary Fig. 12 and Supplementary Methods). Embryos that were to be analysed by whole-mount in situ hybridization were first treated with 1-phenyl-2 thiourea at 23 h post fertilization (h.p.f.) to inhibit melanogenesis. At 3 d.p.f., larvae were treated for 1 h with 20 mM PTZ or left untreated, and all larvae were then fixed with paraformaldehyde immediately after the treatment period. RNA in situ hybridization analysis was carried out using a c-fos digoxigenin-labelled probe, which was prepared as recommended by the manufacturer of the in situ hybridization reagents (Roche). Whole-mount in situ
hybridization was performed using standard procedures58. Analysis of zebrafish locomotor activity was carried out using the Viewpoint Zebrabox system (Viewpoint) as previously reported in ref. 34. Briefly, 3 d.p.f. larvae were incubated in E3 medium with or without 20 mM PTZ in microtitre plates, with one larva per well, and larval movements were recorded with the Viewpoint Zebrabox over a recording period of 60 min, using a light cycle of 2 min: 100% light; 2 min: 0% light. The distance swam by each larva was measured for every 10-min period during the recording period, and the cumulative distance swam over the recording period was calculated. Rescue experiments were performed by co-injection of synthetic sesn3 RNA into one-cell stage AB wild-type zebrafish embryos alone (2 nl of 0.3
Europe PMC Funders Author Manuscripts
ng nl−1 sesn3 mRNA) or in combination with Sesn3 morpholinos. Additional details, including the quantitative PCR analyses of c-fos and Module-1 genes, primer sequences are reported in Supplementary Methods. All experimental procedures involving zebrafish were performed in compliance with the UK Animal (Scientific Procedures) Act and approved by the University of Sheffield Animal Welfare Ethical Review Board.
Supplementary Material
Refer to Web version on PubMed Central for supplementary material.
Acknowledgements
We acknowledge funding from Imperial NIHR Biomedical Research Centre/Imperial Innovations (E.P., J.B., M.R.J.), National Genome Research Network (NGFNplus: EMINet, grant 01GS08122; S.S., A.J.B.), DFG (SFB1089; A.J.B.), DFG (KFO177/SFB-1089; A.J.B., S.S.), BMBF (01GQ0806, S.S.), GIF (A.J.B.), ESF EuroEpinomics (A.J.B.), Else-Kröner Fresenius Foundation (A.J.B.), Wellcome Trust (J.B.), Imperial College Junior research fellowship (J.B.) and BONFOR (S.S., A.J.B.), UCB Pharma (M.R.J., E.P., R.K.), Medical Research Council UK (E.P.), CONACYT, Mexico (P.L.M.S., V.T.C.), Imperial College/Imperial College Healthcare, who received a proportion of funding from the Department of Health’s NIHR Biomedical Research Centres (BRC) funding scheme (M.R.J., E.P.). DNA collection for GWAS was part funded by the Wellcome Trust (M.R.J., Grant Reference WT066056). The research leading to these results has received funding from the European Union’s Seventh Framework Programme (FP7/2007-2013) under grant agreement no. 602102 (EPITARGET; M.R.J., S.S., M.S., A.J.B., E.P.). The research was supported by the National Institute for Health Research (NIHR) Imperial Biomedical Research Centre (M.R.J., E.P.). The views expressed are those of the author(s) and not necessarily those of the NHS, the NIHR or the Department of Health. We thank Mario Falchi and Philippe Froguel for providing critical comments on the first version of the manuscript.
Author contributions
A.J.B. initiated and coordinated the hippocampus sample collection including related clinical data and gene expression data generation. E.P. and M.R.J. designed, implemented and coordinated systems genetics and functional studies. J.B. designed and performed functional studies in BMDM and BV2 cells, with assistance from B.R. and A.D. T.R. performed functional studies in neurons with assistance from A.S., S.K., K.W., F.W.G., B.R. and V.D.P. L.B. designed and developed the Bayesian methodology and performed genetic mapping analyses, with assistance from M.C-.H. M.L.K. performed gene expression, correlation and network analyses, with assistance from S.R.L. and T.D. K.P., P.N. and S.S. prepared human brain samples and probes, performed hybridizations, real-time quantitative PCR experiments and contributed data and clinical information in the TLE cohort. P.H., M.Mattheisen and S.C. carried out microarray experiments, SNP genotyping and raw data analyses in the TLE cohort. M.v.L. contributed hippocampal tissue microdissections and clinical data analyses in the TLE cohort. M.R.J., T.J.O’B., J.E., S.P. and A.J.C. coordinated sample collection and/or provided genotype and clinical data for the GWAS analysis of focal epilepsy. M.W., M.S. and P.R. contributed reagents and materials. M.R.J. and D.S. performed the GWAS analysis of focal epilepsy. E.P., M.R.J., M.L.K., D.S. and S.R.L. designed and carried out GWAS-enrichment analyses. E.P. and P.K.S. carried out TFBS motifs sequence analysis. R.M.K., P.F., B.D. and M.Mazzuferi generated the mouse RNA-seq data. E.P., M.R., K.S. and P.K.S. carried out comparative network analyses. A.S. provided primary hippocampal neurons and N.H. and A.D. provided BV2 cell lines and participated in functional studies. V.T.C. and P.L.M.S. designed and carried out experiments
Europe PMC Funders Author Manuscripts
in zebrafish. E.P. and M.R.J. wrote the manuscript with input from A.B., J.B., L.B., V.T.C., V.D.P. and R.M.K. E.P., A.J.B. and M.R.J. were the joint senior authors of the study.
References
1. Maroso M, et al. Toll-like receptor 4 and high-mobility group box-1 are involved in ictogenesis and can be targeted to reduce seizures. Nataure Med. 2010; 16:413–419. [PubMed: 20348922] 2. Vezzani A, et al. Powerful anticonvulsant action of IL-1 receptor antagonist on intracerebral
injection and astrocytic overexpression in mice. Proc. Natl Acad. Sci. USA. 2000; 97:11534–11539. [PubMed: 11016948]
3. Maroso M, et al. Interleukin-1beta biosynthesis inhibition reduces acute seizures and drug resistant chronic epileptic activity in mice. Neurotherapeutics. 2011; 8:304–315. [PubMed: 21431948] 4. Miller LL, Pellock JM, DeLorenzo RJ, Meyer JM, Corey LA. Univariate genetic analyses of
epilepsy and seizures in a population-based twin study: the Virginia Twin Registry. Genet. Epidemiol. 1998; 15:33–49. [PubMed: 9523209]
5. Kjeldsen MJ, Kyvik KO, Christensen K, Friis ML. Genetic and environmental factors in epilepsy: a population-based study of 11900 Danish twin pairs. Epilepsy Res. 2001; 44:167–178. [PubMed: 11325572]
6. Speed D, et al. Describing the genetic architecture of epilepsy through heritability analysis. Brain. 2014; 137:2680–2689. [PubMed: 25063994]
7. Kasperaviciute D, et al. Common genetic variation and susceptibility to partial epilepsies: a genome-wide association study. Brain. 2010; 133:2136–2147. [PubMed: 20522523]
8. Guo Y, et al. Two-stage genome-wide association study identifies variants in CAMSAP1L1 as susceptibility loci for epilepsy in Chinese. Hum. Mol. Genet. 2012; 21:1184–1189. [PubMed: 22116939]
9. EPICURE Consortium. et al. Genome-wide association analysis of genetic generalized epilepsies implicates susceptibility loci at 1q43, 2p16.1, 2q22.3 and 17q21.32. Hum. Mol. Genet. 2012; 21:5359–5372. [PubMed: 22949513]
10. Allen AS, et al. De novo mutations in epileptic encephalopathies. Nature. 2013; 501:217–221. [PubMed: 23934111]
11. International League Against Epilepsy Consortium on Complex Epilepsies. Genetic determinants of common epilepsies: a meta-analysis of genome-wide association studies. Lancet Neurol. 2014; 13:893–903. [PubMed: 25087078]
12. Sullivan PF, Daly MJ, O’Donovan M. Genetic architectures of psychiatric disorders: the emerging picture and its implications. Nat. Rev. Genet. 2012; 13:537–551. [PubMed: 22777127]
13. Guan Y, et al. Tissue-specific functional networks for prioritizing phenotype and disease genes. PLoS Comput. Biol. 2012; 8:e1002694. [PubMed: 23028291]
14. Piro RM, et al. An atlas of tissue-specific conserved coexpression for functional annotation and disease gene prediction. Eur. J. Hum. Genet. 2011; 19:1173–1180. [PubMed: 21654723] 15. Califano A, Butte AJ, Friend S, Ideker T, Schadt E. Leveraging models of cell regulation and
GWAS data in integrative network-based association studies. Nature Genet. 2012; 44:841–847. [PubMed: 22836096]
16. Bartolomei F, Chauvel P, Wendling F. Epileptogenicity of brain structures in human temporal lobe epilepsy: a quantified study from intracerebral EEG. Brain. 2008; 131:1818–1830. [PubMed: 18556663]
17. Civelek M, Lusis AJ. Systems genetics approaches to understand complex traits. Nat. Rev. Genet. 2014; 15:34–48. [PubMed: 24296534]
18. Bottolo L, et al. Bayesian detection of expression quantitative trait loci hot spots. Genetics. 2011; 189:1449–1459. [PubMed: 21926303]
19. Budanov AV, Sablina AA, Feinstein E, Koonin EV, Chumakov PM. Regeneration of
peroxiredoxins by p53-regulated sestrins, homologs of bacterial AhpD. Science. 2004; 304:596– 600. [PubMed: 15105503]
Europe PMC Funders Author Manuscripts
20. Nogueira V, et al. Akt determines replicative senescence and oxidative or oncogenic premature senescence and sensitizes cells to oxidative apoptosis. Cancer Cell. 2008; 14:458–470. [PubMed: 19061837]
21. Zamkova M, Khromova N, Kopnin BP, Kopnin P. Ras-induced ROS upregulation affecting cell proliferation is connected with cell type-specific alterations of HSF1/SESN3/p21Cip1/WAF1 pathways. Cell Cycle. 2013; 12:826–836. [PubMed: 23388456]
22. Hagenbuchner J, et al. FOXO3-induced reactive oxygen species are regulated by BCL2L11 (Bim) and SESN3. J. Cell Sci. 2012; 125:1191–1203. [PubMed: 22349704]
23. Schafer J, Strimmer K. An empirical Bayes approach to inferring large-scale gene association networks. Bioinformatics. 2005; 21:754–764. [PubMed: 15479708]
24. Rossin EJ, et al. Proteins encoded in genomic regions associated with immune-mediated disease physically interact and suggest underlying biology. PLoS Genet. 2011; 7:e1001273. [PubMed: 21249183]
25. Speed D, et al. A genome-wide association study and biological pathway analysis of epilepsy prognosis in a prospective cohort of newly treated epilepsy. Hum. Mol. Genet. 2014; 23:247–258. [PubMed: 23962720]
26. Ravizza T, et al. The IL-1beta system in epilepsy-associated malformations of cortical development. Neurobiol. Dis. 2006; 24:128–143. [PubMed: 16860990]
27. Mazzuferi M, Kumar G, Rospo C, Kaminski RM. Rapid epileptogenesis in the mouse pilocarpine model: video-EEG, pharmacokinetic and histopathological characterization. Exp. Neurol. 2012; 238:156–167. [PubMed: 22960187]
28. Subramanian A, et al. Gene set enrichment analysis: a knowledge-based approach for interpreting genome-wide expression profiles. Proc. Natl Acad. Sci. USA. 2005; 102:15545–15550. [PubMed: 16199517]
29. Bottolo L, et al. ESS + +: a C + + objected-oriented algorithm for Bayesian stochastic search model exploration. Bioinformatics. 2011; 27:587–588. [PubMed: 21233165]
30. Gilchrist M, et al. Systems biology approaches identify ATF3 as a negative regulator of Toll-like receptor 4. Nature. 2006; 441:173–178. [PubMed: 16688168]
31. Cao DL, et al. Chemokine CXCL1 enhances inflammatory pain and increases NMDA receptor activity and COX-2 expression in spinal cord neurons via activation of CXCR2. Exp. Neurol. 2014; 261C:328–336. [PubMed: 24852102]
32. Ravizza T, Vezzani A. Status epilepticus induces time-dependent neuronal and astrocytic expression of interleukin-1 receptor type I in the rat limbic system. Neuroscience. 2006; 137:301– 308. [PubMed: 16289587]
33. Xanthos DN, Sandkuhler J. Neurogenic neuroinflammation: inflammatory CNS reactions in response to neuronal activity. Nat. Rev. Neurosci. 2014; 15:43–53. [PubMed: 24281245] 34. Baxendale S, et al. Identification of compounds with novel anti-convulsant properties in a
zebrafish model of epileptic seizures. Dis. Models Mech. 2012; 5:773–784. [PubMed: 22730455] 35. Baraban SC, Taylor MR, Castro PA, Baier H. Pentylenetetrazole induced changes in zebrafish
behavior, neural activity and c-fos expression. Neuroscience. 2005; 131:759–768. [PubMed: 15730879]
36. Afrikanova T, et al. Validation of the zebrafish pentylenetetrazol seizure model: locomotor versus electrographic responses to antiepileptic drugs. PLoS One. 2013; 8:e54166. [PubMed: 23342097] 37. Baraban SC, Dinday MT, Hortopan GA. Drug screening in Scn1a zebrafish mutant identifies
clemizole as a potential Dravet syndrome treatment. Nat. Commun. 2013; 4:2410. [PubMed: 24002024]
38. Zhang J, et al. c-fos regulates neuronal excitability and survival. Nature Genet. 2002; 30:416–420. [PubMed: 11925568]
39. Zhang B, et al. Integrated systems approach identifies genetic nodes and networks in late-onset Alzheimer’s disease. Cell. 2013; 153:707–720. [PubMed: 23622250]
40. Heinig M, et al. A trans-acting locus regulates an anti-viral expression network and type 1 diabetes risk. Nature. 2010; 467:460–464. [PubMed: 20827270]
41. Voineagu I, et al. Transcriptomic analysis of autistic brain reveals convergent molecular pathology. Nature. 2011; 474:380–384. [PubMed: 21614001]
Europe PMC Funders Author Manuscripts
42. Parikshak NN, et al. Integrative functional genomic analyses implicate specific molecular pathways and circuits in autism. Cell. 2013; 155:1008–1021. [PubMed: 24267887]
43. Vezzani A, Balosso S, Ravizza T. The role of cytokines in the pathophysiology of epilepsy. Brain. Behav. Immun. 2008; 22:797–803. [PubMed: 18495419]
44. Vezzani A, Granata T. Brain inflammation in epilepsy: experimental and clinical evidence. Epilepsia. 2005; 46:1724–1743. [PubMed: 16302852]
45. Marchi N, et al. Efficacy of anti-inflammatory therapy in a model of acute seizures and in a population of pediatric drug resistant epileptics. PLoS One. 2011; 6:e18200. [PubMed: 21464890] 46. Bahcekapili N, et al. Erythropoietin pretreatment suppresses seizures and prevents the increase in
inflammatory mediators during pentylenetetrazole-induced generalized seizures. Int. J. Neurosci. 2014; 124:762–770. [PubMed: 24397543]
47. Papadia S, et al. Synaptic NMDA receptor activity boosts intrinsic antioxidant defenses. Nat. Neurosci. 2008; 11:476–487. [PubMed: 18344994]
48. Chuang YC, et al. Upregulation of nitric oxide synthase II contributes to apoptotic cell death in the hippocampal CA3 subfield via a cytochrome c/caspase-3 signaling cascade following induction of experimental temporal lobe status epilepticus in the rat. Neuropharmacology. 2007; 52:1263– 1273. [PubMed: 17336342]
49. Vezzani A, French J, Bartfai T, Baram TZ. The role of inflammation in epilepsy. Nat. Rev. Neurol. 2011; 7:31–40. [PubMed: 21135885]
50. Balosso S, et al. Molecular and functional interactions between tumor necrosis factor-alpha receptors and the glutamatergic system in the mouse hippocampus: implications for seizure susceptibility. Neuroscience. 2009; 161:293–300. [PubMed: 19285115]
51. Galic MA, et al. Postnatal inflammation increases seizure susceptibility in adult rats. J. Neurosci. 2008; 28:6904–6913. [PubMed: 18596165]
52. Riazi K, et al. Microglial activation and TNFalpha production mediate altered CNS excitability following peripheral inflammation. Proc. Natl Acad. Sci. USA. 2008; 105:17151–17156. [PubMed: 18955701]
53. Baram TZ, Hatalski CG. Neuropeptide-mediated excitability: a key triggering mechanism for seizure generation in the developing brain. Trends Neurosci. 1998; 21:471–476. [PubMed: 9829688]
54. Efron B. Large-scale simultaneous hypothesis testing: the choice of a null hypothesis. J. Am. Statist. Assoc. 2004; 99:96–104.
55. Mardia, KV.; Kent, JT.; Bibby, JM. Multivariate Analysis. Academic; 1979.
56. Kim D, et al. TopHat2: accurate alignment of transcriptomes in the presence of insertions, deletions and gene fusions. Genome Biol. 2013; 14:R36. [PubMed: 23618408]
57. Robinson MD, McCarthy DJ, Smyth GK. edgeR: a Bioconductor package for differential expression analysis of digital gene expression data. Bioinformatics. 2010; 26:139–140. [PubMed: 19910308]
58. Oxtoby E, Jowett T. Cloning of the zebrafish krox-20 gene (krx-20) and its expression during hindbrain development. Nucleic Acids Res. 1993; 21:1087–1095. [PubMed: 8464695]
Europe PMC Funders Author Manuscripts
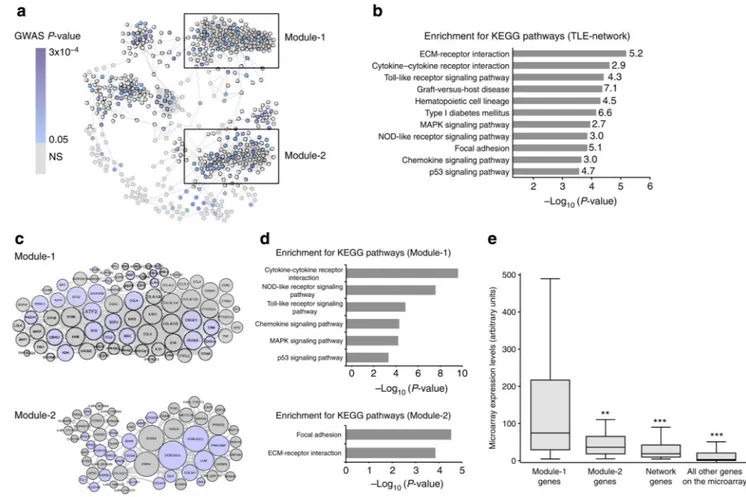
Figure 1. Identification of the TLE-network and functionally specialized transcriptional modules in human epileptic hippocampus
(a) Gene co-expression network identified in the hippocampus of TLE patients (TLE-network). Nodes represent genes and edges represent significant partial correlations between their expression profiles (FDR<5%). Node colour indicates the best GWAS P-value of association with focal epilepsy for SNPs within 100 kb of each gene (Supplementary Data 1). Boxes mark two transcriptional modules within the network. (b) Kyoto Encyclopedia of Genes and Genome (KEGG) pathways significantly enriched in the TLE-network
(FDR<5%). The fold enrichment for each KEGG pathway is reported on the side of each bar. (c) Module-1 and Module-2 details. The size of each node is proportional to its degree of interconnectivity within each module. Light blue indicates genes showing nominal association with susceptibility to focal epilepsy by GWAS. Numbers in parenthesis indicate multiple microarray probes representing the same gene. (d) KEGG pathways significantly enriched in Module-1 (top) and Module-2 (bottom; FDR<5%). (e) Module-1 is significantly highly expressed in the hippocampus of TLE patients. mRNA expression of Module-1 (n = 80 probes, representing 69 unique annotated genes) as compared with Module-2 (n = 60 probes, representing 54 unique annotated genes), other network genes (n = 371 probes, representing 319 unique annotated genes) and all other probes represented on the microarray (n = 48,256). **P = 3.8 × 10⁻⁴; ***P < 10−10, Mann–Whitney test, two-tailed.
Europe PMC Funders Author Manuscripts
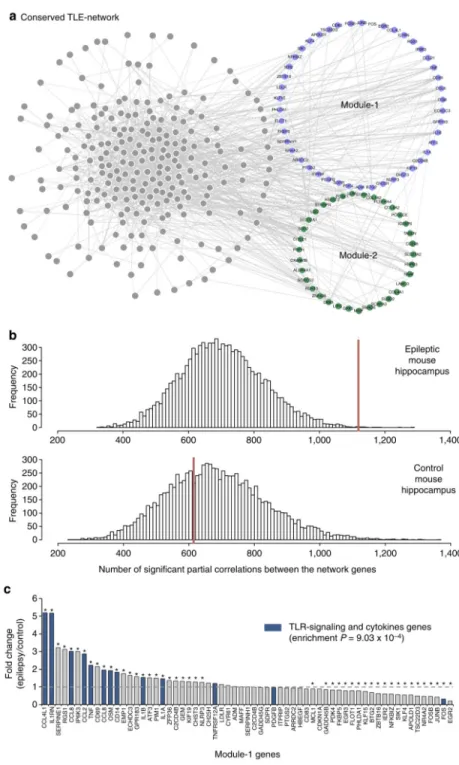
Figure 2. TLE-network conservation in mouse epileptic hippocampus
(a) Human TLE-network genes that are conserved and co-expressed (84%) in the mouse hippocampus. Each node in the network represents a transcript that had significant partial correlation with at least another transcript in the network (FDR<5%). Conserved Module-1 and Module-2 genes are indicated in blue and green, respectively. (b) Distribution of significant partial correlations (FDR<5%) between pairs of transcripts from 10,000 bootstrap permutation samples in epileptic (top) and control (bottom) mouse hippocampus. In each case, the red line indicates the actual number of significant partial correlations (FDR<5%)
Europe PMC Funders Author Manuscripts
between all genes in the network. The number of significant partial correlations observed in control hippocampus was no different from chance expectation (P = 0.659). In contrast, the number of significant partial correlations detected in epileptic hippocampus was
significantly higher than expected by chance (P = 0.001). (c) Differential expression of Module-1 genes between control and epileptic mouse hippocampus shows specific enrichment for TLR-signalling and cytokine genes among the upregulated genes (gene set enrichment analysis28). Stars denote significant fold changes between epileptic and control mouse hippocampus (FDR<5%); blue bars indicate TLR-signalling and cytokine genes.
Europe PMC Funders Author Manuscripts
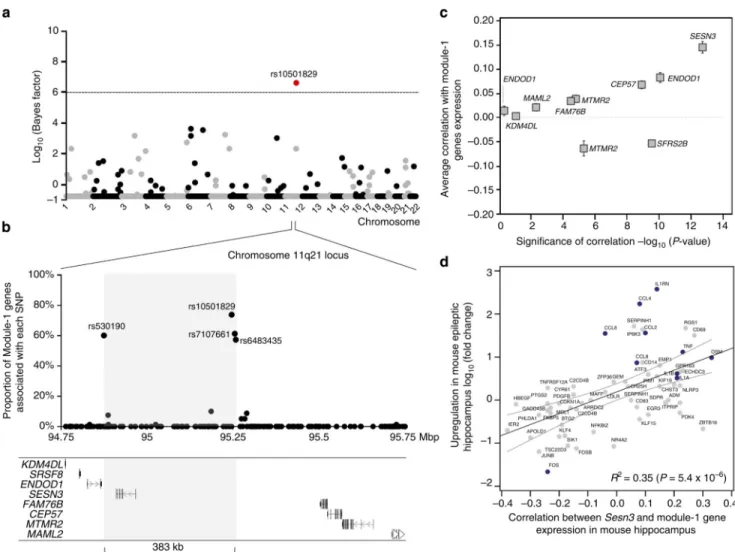
Figure 3. SESN3 is a trans-acting genetic regulator of Module-1 in epileptic hippocampus (a) Genome-wide mapping of the genetic regulation of Module-1. For each autosome (horizontal axis), the strength of evidence for each SNP (filled dot) being a regulatory locus for the first PC of Module-1 expression is measured by the log10(Bayes factor) (vertical
axis). The Bayes factor quantifies evidence in favour of genetic regulation versus no genetic control of module expression, and is reported as a ratio between the strengths of these models. At 5% FDR (that is, log10(Bayes factor)>6, dashed line), SNP rs10501829 (11q21,
highlighted in red) was significantly correlated with Module-1 expression. (b) Joint mRNA levels and SNPs analysis within the 1-Mbp region centred on SNP rs10501829, comprising 178 SNPs genotyped in the TLE patient cohort. We carried out multivariate Bayesian regression modelling18 of all Module-1 probes (n = 80) and all SNPs (n = 178) to identify the most informative SNPs in the region predicting Module-1 expression. For each SNP, we report the proportion of associated genes in Module-1 (vertical axes): four SNPs
(rs10501829, rs530190, rs7107661 and rs6483435) that are individually associated with 58– 74% of Module-1 genes are highlighted. The grey box indicates the boundaries of the associated regulatory region (delimited by SNPs rs530190 and rs6483435), spanning 383 kb. (c) For each candidate gene at the 1-Mbp regulatory locus, we report the average Pearson correlation (r; ± s.e.m.) between the candidate gene’s expression and the expression of
Europe PMC Funders Author Manuscripts
Module-1 genes (y axes) and its statistical significance for deviation from r = 0 (x axes). Two-tailed P-values are reported on a negative log scale and were calculated using one sample Wilcoxon Signed Rank test. Two genes (ENDOD1 and MTMR2) were represented by two microarray probes and were analysed separately. (d) Association between increased
Sesn3 mRNA expression and upregulation of Module-1 genes in epileptic mouse
hippocampus. For each gene, we report its log10(fold change) in epilepsy versus control (y
axes) and its correlation with Sesn3 mRNA expression (x axes). The 95% confidence interval of the slope of the regression line is indicated. TLR-signalling and cytokines genes are highlighted in blue.
Europe PMC Funders Author Manuscripts
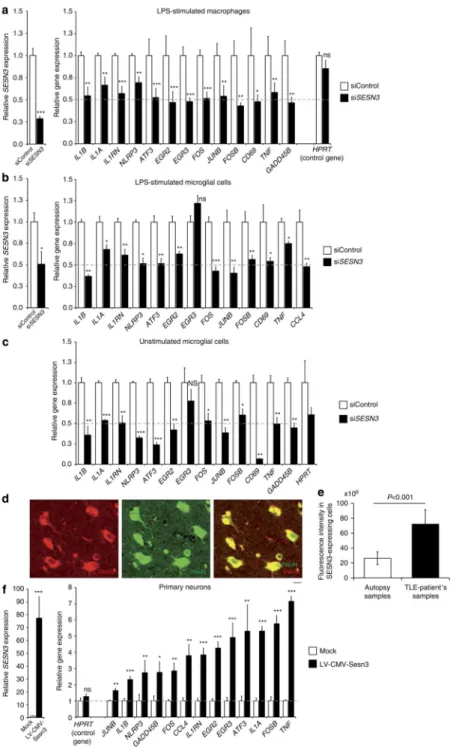
Figure 4. SESN3 regulates expression of Module-1 genes in macrophages, microglial cells and neurons
Effect of siRNA-mediated knockdown of Sesn3 as compared with control siRNA
(siControl), showing significant inhibition of Sesn3 mRNA expression and downregulation of Module-1 genes in murine LPS-stimulated (1 h) BMDM (a) and BV2 microglial cells (b), as well as in unstimulated BV2 microglial cells (c). Five independent biological replicates were used for BMDM experiments and at least three replicates in the BV2 microglia cells experiments. Data normalized to β-actin levels are shown as means relative to control
Europe PMC Funders Author Manuscripts
±s.e.m. (d) SESN3 immunofluorescence of human hippocampal slices from TLE patients: co-immunostainings with NeuN (green) antibody showed that SESN3 (red) is localized in neurons. Scale bar, 100 μm. (e) Quantification of SESN3 expression in human hippocampal tissue by immunofluorescence analysis. Maximum intensity projections of confocal z-stack images of immunohistochemical stainings with antibody against SESN3 were used. For determination of SESN3 cell fluorescence as a measure of SESN3 expression level, SESN3-expressing cells in the CA2 region of the hippocampus in both TLE patients samples (n = 7) and autopsy samples (n = 8) were measured using ImageJ software. Cell fluorescence was assessed as follows: integrated density—(area of selected cell × mean fluorescence of background readings). SESN3 total cell fluorescence in TLE patients is significantly increased as compared with the SESN3 total cell fluorescence in autopsy samples (two-tailed Mann–Whitney test, P<0.001). Fluorescence intensity data are reported as means ±s.e.m. (f) Effect of lentiviral-mediated Sesn3 overexpression on Module-1 genes in primary hippocampal neurons. Left, relative levels of Sesn3 mRNA in transduced neurons (LV-CMV-Sesn3) compared with the levels in mock transduction (Mock). Right, relative mRNA levels of Module-1 genes and a control gene not in the network (Hprt) in transduced neurons compared with levels in mock transduction. Data normalized to Gapdh levels are shown as means relative to control ±s.e.m. Four (Mock group) and twelve (LV-CMV-Sesn3 group) replicates were used in neuronal cell experiments. Statistical significance of the differences (P-value) between siSESN3 (or LV-CMV-Sesn3) and siControl (or Mock) was assessed by
t-test (two-tailed) and adjusting for unequal variances across different groups. *P<0.05;
**P<0.01; ***P<0.001; ****P<0.0001; NS, not significant (P>0.05).
Europe PMC Funders Author Manuscripts
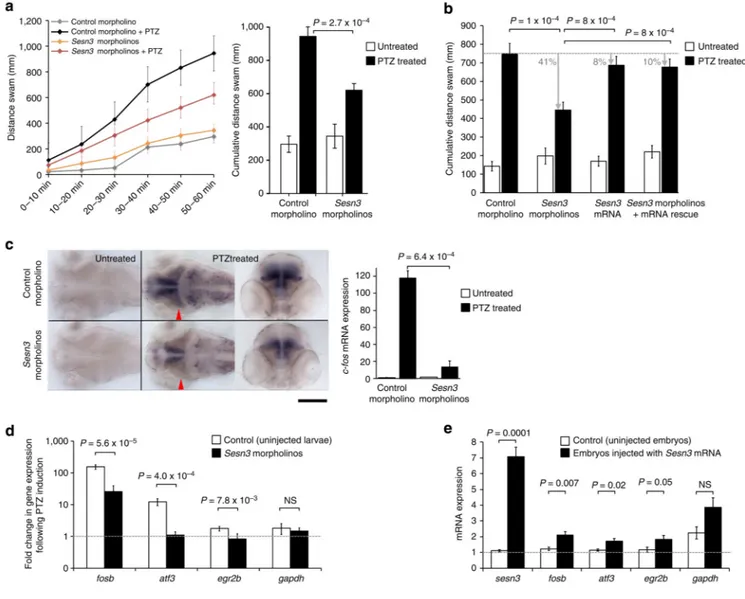
Figure 5. Sesn3 modulates PTZ-induced c-fos expression, locomotor convulsions and Module-1 genes in zebrafish
(a) Left, Sesn3 promotes convulsive locomotor response of zebrafish larvae exposed to PTZ. Three days post fertilization (d.p.f.) zebrafish larvae were incubated with and without 20 mM PTZ for 1 h and locomotor activity was monitored continuously. Larvae microinjected with Sesn3 morpholinos exhibited a sustained reduction in locomotor activity throughout the period of PTZ incubation, in comparison with control morphant larvae. Both Sesn3
morphant and control morphant larvae (n = 12) exhibited similarly low levels of locomotor activity in the absence of PTZ. Right, Sesn3 morpholinos reduced the cumulative locomotor activity of zebrafish exposed to 20 mM PTZ (black columns) without appreciably affecting basal locomotor activity of larvae incubated in the absence of PTZ (white columns). (b) Co-injecting Sesn3 morpholinos with synthetic Sesn3 mRNA showed that Sesn3 mRNA rescued the locomotor activity phenotype (total distance swam, y axis). For each group, 16–18 larvae were analysed. Black bars, 1 h PTZ treatment (20 mM). (c) Sesn3 morpholinos attenuate seizure-induced expression of the synaptic activity-regulated gene c-fos. Left and central images, dorsal views of the brains of 3 d.p.f. control morphant (top) and Sesn3 morphant
Europe PMC Funders Author Manuscripts
larvae (bottom) maintained for 1 h in the absence and presence of 20 mM PTZ, after which larvae were fixed and analysed for c-fos expression by whole-mount in situ hybridization. Red arrowheads: position of the transverse sections of the brains; scale bar, 200 μm. Following PTZ treatment (20 mM, 1 h), quantitative PCR (qPCR) analysis revealed that
Sesn3 morphant larvae exhibited significantly lower mRNA expression of c-fos in the brain
than control morphant larvae (c, right panel). (d) PTZ-induced transcriptional response of Module-1 genes was significantly lower in Sesn3 morphants as compared with uninjected larvae; six samples were used in the qPCR experiments (one sample = 15–20 pooled larvae). (e) Upregulation of Module-1 genes upon injection of synthetic mRNA (1 ng) in zebrafish embryos (n = 30) as compared with uninjected control embryos (n = 30). Total RNA was extracted 28 h post fertilization and qPCR experiments were performed for the two pools of embryos using six technical replicates. Data reported as means±s.e.m. were determined by the 2−ΔΔCt method and normalized to the housekeeping gene β-actin. P-values calculated by
t-test (two-tailed) adjusting for unequal variances across different groups. NS, not significant
(P>0.05).