INDEX
Abstract ... - 3 -
Introduction ... - 5 -
1.1 Overview of skeletal muscle ... 5
1.2 Contraction of skeletal muscle fibers... 2
-1.2.1 Myofibrils and sarcomere ...- 2 -
1.2.2 Sarcoplasmic reticulum, T-tubule, triad and excitation-contraction coupling ...- 6 -
1.3 Energetic metabolism ... 10
-1.3.1 Role of skeletal muscle in metabolism ... - 11 -
1.3.2 Insulin-dependent GLUT4 translocation ... - 14 -
1.3.3 Insulin-independent GLUT4 translocation ... - 15 -
1.3.4 GLUT4 trafficking ... - 17 -
1.4 Type 2 Diabetes ... 19
-1.4.1 ANK1 locus and Type 2 Diabetes susceptibility ... - 19 -
1.4.2 Type 2 Diabetes and sAnk1.5 ... - 20 -
1.5 Skeletal musclespecific isoform of Ank1: sAnk1.5 ... 22
-2. Aim of thesis work ... - 28 -
3. Experimental procedures ... - 29 -
3.1 Animal treatment ... 29
3.2 Animal genotyping ... 29
-3.2.1 DNA extraction ... - 29 -
3.2.2 Qualitative Polymerase Chain Reaction ... - 30 -
3.2.3 Agarose gel electrophoresis ... - 31 -
3.2.4 Real Time Polymerase Chain reaction ... - 32 -
3.2.5 Evaluation of mRNA levels... - 33 -
3.3 Evaluation of protein levels ... 36
-3.3.1 Tissue lysate preparation ... - 36 -
3.3.2 Measurement of protein concentration ... - 36 -
3.3.3 SDS-Page electrophoresis ... - 37 -
3.3.4 Western Blot ... - 38 -
-3.4.2 Immunofluorescence ... - 40 -
3.5 Investigation on mice glucose tolerance... 41
-3.5.1 Intraperitoneal Glucose Tolerance Test... - 41 -
3.5.2 Intraperitoneal Insulin Tolerance Test ... - 41 -
3.6 Statistical analysis ... 42
-4. Results ... - 43 -
4.1 Generation and expansion of MLC-sAnk1.5+/+ mouse colony ... - 43 -
4.2 Characterization of sAnk1.5 mRNA and protein levels in transgenic mice ... - 45 -
4.3 Analysis of glucose and insulin tolerance in transgenic mice ... - 50 -
4.4 High Fat diet experiments ... - 52 -
5. Discussion ... - 58 -
Abstract
Skeletal muscle represents about 40% of the body mass and is the site where the major part of blood glucose is disposed following insulin stimulation. Due to this critical role, skeletal muscle dysfunctions often result in the development of systemic metabolic diseases. Type 2 Diabetes (T2D) is the most common chronic metabolic disorder, representing nearly 90% of the overall diabetes cases. T2D is characterized by insulin resistance followed by reduced insulin release from pancreatic -cells, resulting in high glucose concentration in bloodstream and glucose intolerance. T2D is a multifactorial disorder, as its onset has both genetic and environmental origins.
Genome Wide Association Studies have identified hundreds of single nucleotide polymorphisms (SNPs) associated to T2D susceptibility, in the human genome. Interestingly, several of these SNPs were identified in the ANK1 locus, although these SNPs were found in regions neither coding nor endowed with a regulatory activity. However, two recent independent studies identified a novel SNP in the internal promoter of the ANK1 gene, which drives the expression of sAnk1.5, a striated muscle-specific small ANK1 isoform. The sAnk1.5 protein is localized on the sarcoplasmic reticulum (SR) membrane, in skeletal muscle fibers, and interacts with Obscurin, a giant protein of the sarcomere. This interaction stabilizes the SR and guarantees the close apposition of this organelle around the contractile apparatus. The ANK1 internal promoter carrying the C/C variant displays higher transcriptional activity with respect to the T/T variant. Accordingly, skeletal muscle biopsies of individuals carrying the C/C genotype showed higher levels of both sAnk1.5 mRNA and protein compared to those carrying the T/T genotype.
The aim of this thesis was to investigate whether sAnk1.5 overexpression in skeletal muscle might predispose to T2D susceptibility. Accordingly, we generated a transgenic mouse model with the coding sequence of the murine sAnk1.5 under the transcriptional control of the skeletal muscle-specific rat myosin light chain promoter. In these transgenic mice, protein levels of sAnk1.5 were increased up to 50% in skeletal muscles with respect to wild
type mice. Basal glucose levels, glucose and insulin tolerance were monitored over a period of 12-months. In addition, 2-months old mice were fed with a high fat diet for twelve weeks. The results obtained did not reveal significant differences in glucose and insulin disposal between transgenic and wild type mice.
In conclusion, our results, show that sAnk1.5 overexpression does not appear to predispose to a pre-diabetic or diabetic condition.
Introduction
1.1 Overview of skeletal muscle
Skeletal muscle comprises approximately 40% of total body weight and represents one of the most dynamic and plastic tissue. It converts the chemical energy to mechanical force guaranteeing voluntary movements, the maintenance of the posture and the functional independence of the body. In addition, it fulfills a non-secondary metabolic role contributing to overall body energy metabolism, to the storage of amino acids and carbohydrates and to the maintenance of the body temperature1. Skeletal muscle architecture is characterized by a well-defined mutual arrangement of muscle cells (muscle fibers) organized in bundles, and connective tissue. Muscle fibers are cylindrical structural syncytia, where several nuclei are localized in peripheral regions. Skeletal muscle fibers are characterized by a diameter of 10-100 µm, and display a length that, in humans, may range from 1mm to several centimeters. Each single muscle fiber is enveloped and separated from its neighbors by a connective sheet, the endomysium, which in turn is in continuity with the perimysium, a thicker sheet of connective tissue that surrounds bundles of fibers. The entire muscle is further surrounded by the epimysium, which anchors it to the tendons. These connective layers provide to the maintenance of the overall muscular structure and represent the site where blood vessels and nerves spread into muscle, guaranteeing the nutriments and electrical stimulations to every single fiber2. The cytoplasm of the fibers, also called sarcoplasm, in addition to nuclei and “standard” organelles such as mitochondria, Golgi apparatus, lipid droplets, glycogen stores, is characterized by the presence of three evolutionary conserved structures: the myofibrils, which represent the contractile apparatus, the sarcoplasmic reticulum, which is the site where the calcium ions required for contraction are stored, and the T-tubules, which are invaginations of the plasma membrane (sarcolemma) that
participate in forming the triads. Triads are skeletal muscle specific structures, which represent the cytological core of the excitation-contraction coupling.
1.2 Contraction of skeletal muscle fibers
1.2.1 Myofibrils and sarcomere
The largest part of the cytoplasm of skeletal muscle fibers is occupied by myofibrils. Myofibrils are long filaments parallel to each other and to the fiber’s longest axis, and their length may reach several centimeters. Myofibrils are made up by two types of contractile myofilaments, named thick and thin filaments. Thick filaments are composed by myosin, while thin filaments are composed by actin. The myosin protein has a hexameric structure made up by two heavy chains at the C-terminal region, and four light chains forming the globular heads of the molecule, in the N-terminal region. Each globular head contains an ATPase domain able to hydrolyze ATP to ADP+Pi, a process required to generate the energy needed for the contraction and relaxation3. The actin protein, in turn, is composed by two twisted proto-filaments of filamentous actin (F-actin), each of which is composed by 400 molecules of globular actin (G-actin), thus resembling a row of pearls. Actin myofilaments are bound for their entire length by tropomyosin proteins, associated head-to-tail, and by troponin (Tn) complexes regularly-spaced by 40nm on tropomyosin. Troponin is a protein complex formed by three subunits: troponin C (TnC), troponin I (TnI) and troponin T (TnT). When Ca2+ is released from the lumen of sarcoplasmic reticulum (SR), it binds to TnC, inducing a conformational change that results in TnT release from the inhibitory action of TnI. “Activated” TnT allows tropomyosin sliding along the actin filament, which in turn exposes myosin-binding domains on actin filaments, enabling the mechanical interaction between myosin and actin4,5. The sliding of thin filaments along thick filaments allows muscle contraction6. For decades skeletal muscle fibers were distinguished on the basis of their color as red or white, and on their contractile properties as fast and slow. In addition, fast-twitch muscles, rich in white fibers, where known to have a glycolytic
metabolism and to easily fatigue, while slow-twitch muscles, rich in red fibers, had a high content of myoglobin, mitochondria and were more adapt to sustain a continuous activity. Use of histochemical staining, based on the activity of the myosin ATPase, identified three fiber types: type I present in slow-twitch muscles and type IIa and type IIb, present in fast-twitch muscles. These histochemical differences reflect the type of myosin heavy chain isoforms expressed in these fibers. The type I fibers are slow twitch fibers, rich in mitochondria, with an oxidative metabolism and are fatigue resistant. Type IIa are fast twitch fibers with glycolytic but also oxidative metabolism, which makes them partly fatigue resistant, although less than type I fibers. Type IIb are glycolytic fast-twitch fibers with a lower number of mitochondria, are involved in short-lasting and powerful contractions but are more susceptible to fatigue. An additional type of fibers, IIx, expressing another myosin heavy chain isoform, MHCIIx are characterized by an intermediate metabolic and twitch properties intermediate to those of type IIa and IIb fibers7,8,9. The distribution of these different fibers depends on muscle actions.
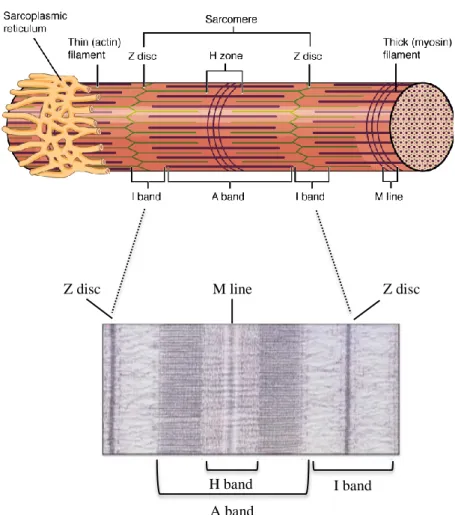
Contractile myofilaments are arranged to form the smallest contractile unit of skeletal muscle fibers: the sarcomere. The reciprocal disposition of myosin and actin generates regularly-spaced regions that differentially reflect polarized light, forming a highly ordered sequence of anisotropic and isotropic bands, when observed under the microscope. The presence of these alternate bands is the reason why the skeletal muscle fibers are defined “striated”. Anisotropic (dark) and isotropic (light) bands are known as A band and I band, respectively. In the center of each A band is present a lighter zone, called H band, crossed in the middle by a transversal structure, the M band. The I band is crossed in the middle by a darker line, the Z disk. Each sarcomere is composed by an entire A band flanked by two moieties of an I band. As a consequence, every single sarcomere extends between two Z disks, with the M band in the middle (Fig. 1). The lateral and longitudinal regular alignment of hundreds of sarcomeres with respect to the longest axis of the muscle fibers form the myofibrils2.
Figure 1: Structure of the sarcomere. In the upper cartoon, reciprocal actin and myosin
filaments disposition in the sarcomere, which give rise to striation (Bands A and I, and H-zone are indicated), is depicted. Z- disks and M-bands of two adjacent sarcomeres are indicated. In the lower picture, an image acquired with the electron microscope of a sarcomere is reported. The image was adapted from Luther, 200910.
Three additional giant proteins, namely titin, obscurin and nebulin1, participate in the proper organization of the sarcomeric scaffold, also contributing to mechanical and physiological properties of muscle fibers (Fig. 2). Titin (3800 kDa) is anchored on both M band and Z disk with its N-terminal and C-terminal regions, respectively. On the M-band, titin interacts with obscurin and myomesin, contributing to M-band stability, while it binds to obscurin and α-actinin on Z disk11. As a consequence, two molecules of titin generate a protein backbone that spans along the entire sarcomere length. Nebulin (800 kDa) anchors at the Z-disk and elapses for the entire length of the actin filaments, thus providing mechanical support for thin filaments positioning, length, and spacing12. Obscurin (850 kDa) is a sarcomeric protein mainly present at the
M-H band A band
I band
M line Z disc
band and at a lesser extent at Z-disk. Initially identified as a titin-interacting protein13,14, it has been later reported that Obscurin interacts with a muscle-specific protein localized in the SR, namely small ankyrin 1.5 (sAnk1.5); this association is responsible for the proper positioning of the SR around myofibrils 15,16,17. Recent studies on Obscurin knockout mice also indicated that obscurin is required for the overall M-band stability18,19. In addition, obscurin is involved in ankyrinB-dependent dystrophin localization and overall sarcolemma integrity19. Dystrophin (427 kDa) is localized in correspondence of the Z-disk and is part of a protein complex called Dystrophin Glycoprotein Complex (DGC). This structure is the core of costamere, a multi-protein complex of the sarcolemma localized in correspondence of the Z-disks. This complex acts as a bridge between fiber actin cytoskeleton and the extracellular matrix, in order to dissipate the mechanical stress generated by repeated cycles of contraction and to protect the integrity of the sarcolemma20.
Figure 2: Localization of sarcomere scaffold protein titin, nebulin and obscurin. Titin is
anchored on both M band and Z disk; as a consequence, two molecules of titin generate a protein backbone that spans along the entire sarcomere length. Nebulin is anchored on the Z-disk and elapses for the entire length of the actin filaments, thus providing mechanical support for thin filaments positioning, length, and spacing. Obscurin is present at the M-band and at a lesser extent at Z-disk; in correspondence of M-band interacts with sAnk1.5 positioning correctly the SR around myofibrils. The image was taken from Feher, 2017 21.
1.2.2 Sarcoplasmic reticulum, T-tubule, triad and excitation-contraction coupling
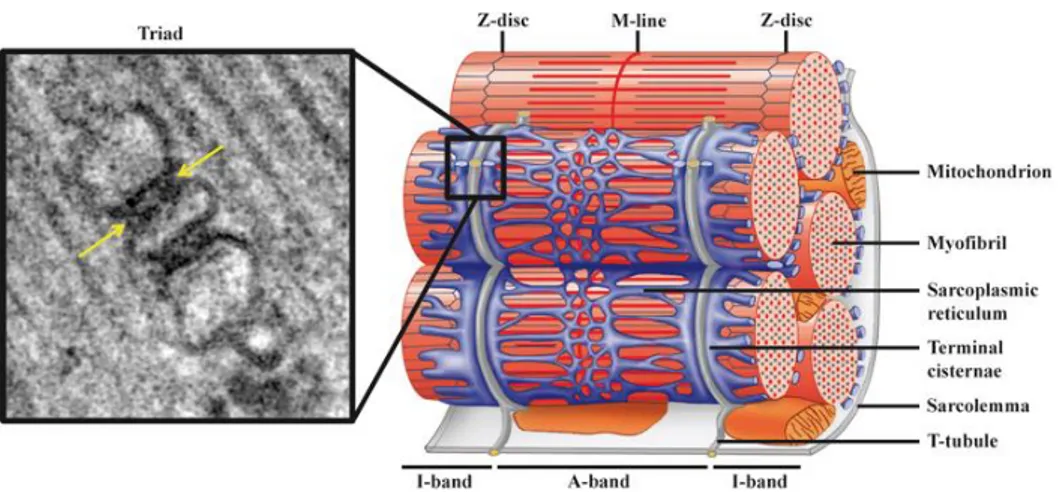
The SR is a specialized form of endoplasmic reticulum where calcium ions (Ca2+) are stored. The SR regulates both Ca2+ release following motor neurons stimulation, allowing muscle contraction, and Ca2+ reuptake from the cytosol to the SR lumen, leading to muscle relaxation22,23. The SR is composed by two different compartments: the longitudinal SR (l-SR) and the junctional SR (j-SR or terminal cisternae). l-SR is formed by anastomosed tubular structures generating a network that wraps myofibrils in correspondence of both A- and I- bands of sarcomeres (Fig.3).
Figure 3: Triad organization in skeletal muscle. The right panel is a schematic
representation of the triad: one T-tubule, a sarcolemma invagination, is flanked by two terminal cisternae, generating the triad, the intracellular structure where the E-C coupling occurs. The triads localize in correspondence of every A-I bands border. The left panel is an image of triad junction acquired with electron microscopy, where the arrows indicate the T-tubule flanked by the terminal cisternae. The image was taken from Al-Qusairi et al, 2011 24.
At their distal ends, l-SR tubules coalesce into dilated structures called terminal cisternae, which form the j-SR, localized at the border between A-band and I-band. In correspondence of every A-I bands border, two terminal cisternae flank the T-tubule, an invagination of the sarcolemma into the sarcoplasm. The structure composed by a T-tubule and the two terminal cisternae is called triad. Triads are the structures where the electrical signal initiated by motor neurons stimulation is converted into the chemical signal represented by calcium
release from the SR. This process allows the excitation-contraction (E-C) coupling mechanism, essential for proper muscle contraction (Fig. 4).
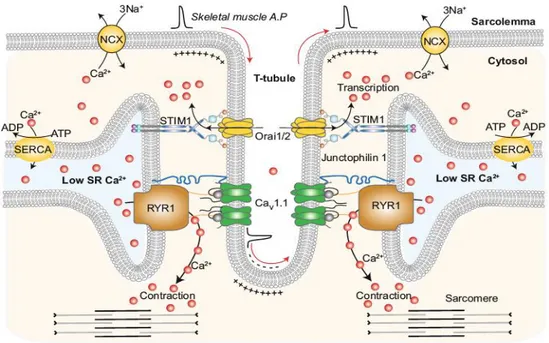
The E-C coupling starts with the release of acetylcholine by the motor neuron, that binds its specific receptors on the sarcolemma inducing the membrane depolarization. When depolarizing wave reaches the T-tubule, it determines the conformational change of dihydropyridine receptor (DHPR), a voltage gated calcium channel specifically localized on the T-tubule membrane. The conformational change of DHPR allows its physical interaction with the ryanodine receptors, RyRs, calcium channels located on the membrane of the j-SR. In mammals, three RyR isoforms, encoded by three different genes, have been identified: RyR1, RyR2, and RyR320. In skeletal muscle, RyR1 is the main expressed isoform. RyR1, once bound by DHPR, changes its conformation allowing massive Ca2+ release from terminal cisternae into fiber cytoplasm. Raising of Ca2+ ions cytoplasmic concentration, [Ca2+]cyt, in the fibers results in tropomyosin sliding along thin filaments, representing the initial event for proper actin-myosin interaction25.
Figure 4: Excitation-contraction mechanism. The T-tubule, a sarcolemma invagination, is
flanked by two terminal cisternae, generating the triad, the intracellular structure where the electrical signal initiated by motor neurons stimulation is converted into the chemical signal represented by calcium release from the SR. When the nervous stimulus occurs, the depolarization wave spread all along the T-tubule, resulting in a conformational change in DHPR, the voltage gated calcium channel present on its membrane. This conformational change allows the physical interaction of DHPR with RyR1, a calcium channel present on the terminal cisternae membranes. This interaction leads RyR1 activation with the release of calcium ions from the SR lumen to the cytosol. The increased concentration of calcium allows the sliding between thick and thin myofilaments. The image was taken from Dickson, 201726.
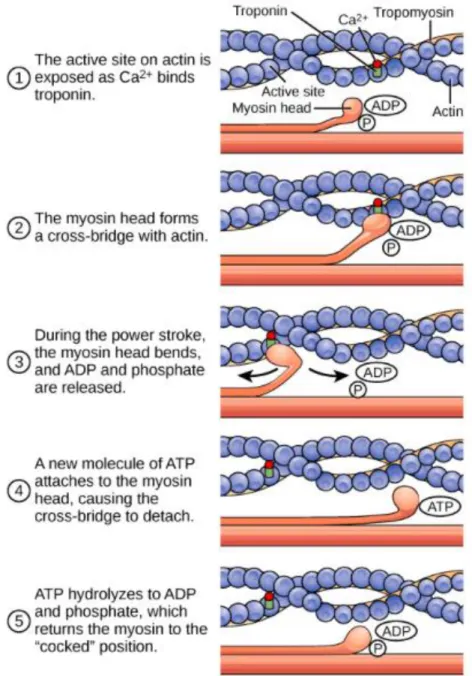
Tropomyosin sliding enables the formation of the actin-myosin complex. The ATPase domains of myosin heads hydrolyze ATP, producing the energy required for myosin movement and sarcomere shortening. Myosin flexes of nearly 45° pulling the actin filament of about 10 nm in the direction of the M band. As a consequence, during contraction sarcomeres shorten, and the width of the I-bands is reduced due to the sliding of thin filaments on thick filaments (Fig.5). To ensure an immediate subsequent new contraction cycle ADP unbinds, and a new ATP molecule binds to myosin heads, thus unfastening myosin from the actin filaments. The hydrolysis of new ATP in ADP+Pi initiates a new cycle of contraction.
Figure 5: Model of cyclic sliding of thin filaments during the contraction. ATP is
hydrolyzed by the ATPase domains of myosin heads, producing the energy required the attachment of myosin to actin filaments. When the Pi produced by ATP hydrolysis is released, myosin heads flexes of nearly 45° pulling thin filaments in direction of the M-band and the sarcomere shortening.
In order to allow muscle relaxation at the end of the contraction, resting [Ca2+]cyt must be restored. This function is provided by the action of Ca2+ pumps that use energy produced by the hydrolysis of ATP to actively pump Ca2+ from the cytoplasm into the SR lumen. These pumps are represented by Sarco/Endoplasmatic Reticulum Ca2+ ATPase (SERCA) pumps, which are
localized on the membrane of the l-SR. For every single hydrolyzed ATP, SERCA pumps transport two calcium ions inside the SR.
Muscle contraction and SERCA pumps activity are processes that require high-energy expenditure, which is mainly satisfied by the hydrolysis of ATP. However, muscle fibers have limited ATP deposits, which would allow only short-lasting maximum efforts; therefore, in order to ensure the energy required for prolonged muscle contraction, it is of paramount importance that ATP is continuously regenerated.
1.3 Energetic metabolism
The energetic metabolism comprises all the reactions required to produce free energy to fulfill biosynthesis processes, to maintain body temperature, and to support any type of work that cells must accomplish. Catabolic reactions release energy, while the anabolic reaction require energy. The intermediate molecule between the catabolic and anabolic reactions is the adenosine-triphosphate (ATP) molecule, whose hydrolysis in ADP+Pi is used by all types of cells to obtain free energy for all their activities. To regenerate ATP, ADP is continuously reconverted in ATP by the mitochondria. Free energy necessary for this latter process is obtained by the oxidation of carbohydrates, proteins and fatty acids. Indeed, cells can obtain around 40% of required free energy from glucose oxidation. Glucose oxidation takes place through three consequential metabolic processes: glycolysis, Krebs cycle and oxidative phosphorylation27.
Glycolysis is the first step of glucose oxidation. It does not require oxygen and occurs in cell cytoplasm. This process is not sufficient to sustain the energy requirement of the cells, because the partial oxidation of glucose in two pyruvate molecules yields only two molecules of ATP and two molecules of NADH. To obtain additional ATP and reducing molecules, pyruvate acids are transported into the mitochondria where they enter the Krebs cycle, at the end of which, they are completely oxidized in CO2 and H2O, with the simultaneous release of 2 ATP, 8 NADH and 2 FADH2. The last step of glucose oxidation is the oxidative phosphorylation, in which NADH and FADH2 are further
oxidized to release H+ and free electrons. The electrons are transferred to enzymes able to pump the H+ ions outside the mitochondria, generating an inward protonic gradient. The energy provided by this proton motive force is used by the ATP synthase to convert ADP in ATP. As a result of all these processes, the oxidation of a single glucose molecule yields 36 ATP molecules2. Indeed, glucose is the main source of free energy for the cells.
1.3.1 Role of skeletal muscle in metabolism
During exercise, skeletal muscle requires an energy expenditure which increases by about 20-30 folds. As a consequence, during prolonged contraction, skeletal muscles deplete an amount of ATP which is about 1000-fold higher compared to resting conditions28. It is important to note that both muscle contraction and relaxation are involved in energy consumption. Indeed, during contraction, myosin proteins hydrolyze ATP to allow the sliding of thin filaments, while during relaxation, SERCA pumps, hydrolyze ATP molecules to reuptake Ca2+ ions from cytosol to the SR lumen29. In addition, skeletal muscle tissue, being involved in the regulation of body temperature, also consumes ATP following shivering, which is a mechanism that allows regulation of thermogenesis by generating heat through repetitive muscle contractions29.
Based on these different ATP-consuming mechanisms, skeletal muscle tissue plays an important role in regulating absorption and systemic homeostasis of glucose.
Glucose is a monosaccharide obtained by the hydrolysis of carbohydrates (disaccharides and polysaccharides) taken from the diet. Molecules of glucose are absorbed by the intestine and then transferred to the bloodstream, from which it is either uptake by all tissues or it can be stored in both liver and skeletal muscles as glycogen. During fasting condition, glucose is released in the bloodstream following the activation of specific mechanisms such as glycogenolysis or gluconeogenesis. Blood glucose concentration varies during the day: in fasting condition glycaemia levels are around 60-90mg/dl of blood, while glucose levels became higher (140mg/dl) following food intake.
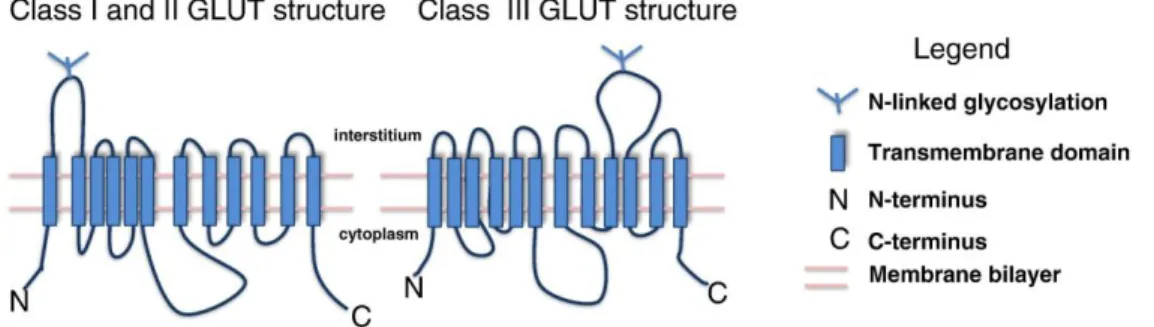
Glucose is a hydrophilic molecule that cannot freely penetrate the lipid bilayer of the membranes. Thus, specific glucose transporters are required (Fig 6). Glucose transport from the extracellular to the intracellular compartments occurs through both an active transport and an ATP-independent facilitated diffusion mechanism. The active transport is present in the intestine and renal tubules, where SGLUT carriers allow glucose uptake against its concentration gradient using the biochemical energy obtained by a Na+/glucose co-transport30. In contrast, in the vast majority of tissues, ATP-independent facilitated diffusion mechanism occurs along glucose concentration gradient through the GLUT transporters family, and do not require energy consumption31. GLUT proteins are a family of glucose transporters composed of twelve membrane spanning helices and a large intracellular loop that connect the sixth and the seventh helices32.
All transporters isoforms share a homology in their sequence, with a domain rich in tryptophan and glycine residues, necessary to glucose translocation across the plasma membrane. GLUT transporters have been classified into three classes based on sequence similarities, pattern of tissue expression, transport kinetics and regulated expression in different physiological conditions.
Class I comprises:
- GLUT1 transporters, which are expressed in the nervous cells and erythrocytes;
- GLUT2 transporters, which are expressed in the liver, kidneys and β-cells of pancreas;
- GLUT3 transporters, with a high affinity for the glucose, which are expressed in tissue that need high amount of energy such as nervous tissue;
- GLUT4 transporters, which are expressed in adipose tissue and striated muscles, and are the only insulin-responsive glucose transporters. Class II comprises:
- GLUT5 transporters, which are expressed in testis and in small intestine;
- GLUT 9 transporters, which are expressed in the liver and kidneys. Class III comprises GLUT6-8-10-12-13 transporters in which the glycosylation site is located on loop 9, at variance of transporters belonging to Class I and II, in which the glycosylation site resides on loop133,34,35
Figure 6: Structure of GLUT transporters. All isoforms of glucose transporters are
composed of twelve membrane spanning helices and a large intracellular loop that connect the sixth and the seventh helices; the N- and C-terminal regions of the glucose transporters reside in the cytoplasmic space. The glycosylation site resides in the extracellular space and is located on loop 1 and loop 9 of GLUT belonging to Class I-II and Class III, respectively. The image was taken from Barron et al, 201636.
GLUT4 is the main glucose transporter expressed in skeletal muscle, heart and adipose tissue. Following translation, GLUT4 is stored in intracellular vesicles, known as GLUT4 storage vesicles (GSVs), localized in proximity to the plasma membrane. GSVs reside in the intracellular compartment until the activation of specific molecular pathways promote their translocation and fusion with the plasma membrane, allowing the exposition of GLUT4 transporters on the extracellular side32. The main stimuli that regulate GLUT4 vesicles trafficking are insulin and muscle contraction37. Both pathways increase glucose uptake by about 10 to 20-folds38. In fact, in basal condition, 5-10% of GLUT4 transporters present in a given cell are exposed on the membrane. This percentage became higher (20-50%) as a consequence of its mobilization.
1.3.2 Insulin-dependent GLUT4 translocation
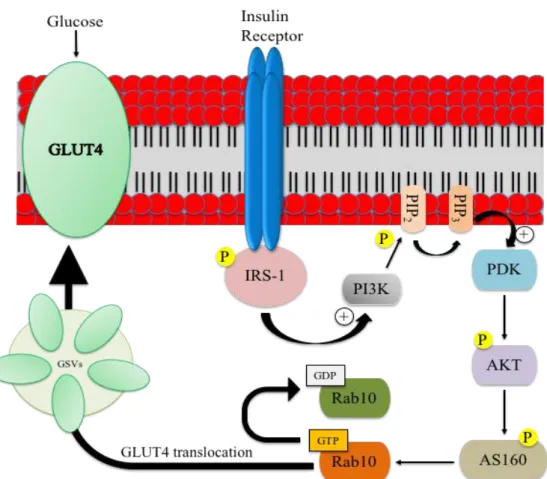
The high amount of glucose in bloodstream in the post prandial period leads to insulin release from the cells of pancreas. Insulin is a peptide hormone (6kDa), composed by two chains connected to each other through disulfide bonds. This hormone interacts with its receptor, present on the target tissues. The insulin receptor (IR) is a tyrosine-kinase receptor, composed by two subunits, on the extracellular side, and two transmembrane subunits. The interaction between the insulin and its receptor generates a conformational change of subunits, allowing the auto-phosphorylation of tyrosine residues present on subunits. These phosphorylated residues allow the recruitment of insulin receptor substrates, such as IRS1, IRS2, IRS3, IRS4 that, through conformational changes, phosphorylate themselves and activate intracellular signaling transduction cascades37. Phosphorylated IRSs recruit phosphatidylinositol 3-kinase (PI3K) and activate its catalytic subunit p110, leading to the generation of phosphatidylinositol 3 phosphate (PIP3). PIP3 accumulates on the intracellular side of the sarcolemma and, through additional signaling molecules, activate the phosphoinositide-dependent kinase-1 (PDK1) resulting in the phosphorylation and activation of AKT39.
AKT is a protein kinase that activates the GTPase activity of AS160 protein. AS160 inhibits RAB10, a G-protein involved in the vesicular trafficking. In the absence of insulin stimulation, RAB10 is in its GDP-bound inactive form, maintaining the intracellular compartmentalization of GLUT4. When the insulin stimulus occurs, the inactivation of AS160 by phosphorylated AKT leads to the generation of the GTP-bound active form of RAB10 protein that in turn allows the translocation of GLUT4 vesicles40 (Fig.7).
Figure 7: Insulin-dependent pathway for GLUT4 vesicles translocation. The insulin
receptor is a tyrosine kinase receptor, which dimerizes and auto phosphorylates following the binding of insulin. The activated receptor triggers and phosphorylates the insulin receptor substrate 1 (IRS-1) on tyrosine residues, which then recruits PI3K and activates its catalytic subunit p110. PI3K catalyzes the phosphorylation of phosphatidylinositol bisphosphate (PIP2) at the plasma membrane to PIP3, which then activates PIP3-dependent kinase (PDK) and then AKT. Through its target, AS160, AKT regulates the activity of Rab10, a G protein involved in the vesicular trafficking. The image was adapted from Thorn et al, 201341.
1.3.3 Insulin-independent GLUT4 translocation
Insulin pathway is not the only molecular mechanism that regulates GLUT4 translocation. Indeed, muscle contraction is able to promote GLUT4 vesicular trafficking. In fact, muscle contraction, by consuming ATP, requires high amount of glucose.
ATP hydrolysis increases sarcoplasmic concentration of adenosine monophosphate (AMP), activating the AMP-dependent kinase (AMPK). AMPK is a heterotrimeric complex composed by an catalytic subunit and
and regulatory subunits, which are both important for target specificity and for complex stability. The interaction between AMP and AMPK leads to the phosphorylation of tyrosine residues present in the kinase domain of the subunit42, resulting in the activation of the kinase. Activated AMPK phosphorylates AS160 (also known as TBC1D4) and TBC1D1, two RAB GTPase activating proteins, allowing the translocation of GLUT4 vesicles toward the plasma membrane43.
Additional insulin-independent mechanisms of GLUT4 translocation involve calcium, bradykinin, nitric oxide and reactive oxygen species by activating molecular mechanisms that partially overlap with insulin- and AMPK-dependent pathways (Fig.8). Increased Ca2+ concentration during muscle contraction activate both protein-kinase C (PKC) and Ca2+ /calmodulin-dependent protein kinase II (CAMKII). These kinases are able to phosphorylate AMPK, activating the AMPK-dependent GSVs translocation. The hormone bradykinin, beyond regulating physiological events such as inflammation and vascular permeability, is also involved in glucose metabolism. Bradykinin enhances IRS1 tyrosine phosphorylation, promoting its interaction with p85α, the PI3K regulatory subunit44. Nitric oxide and reactive oxygen species, produced by mitochondrial activity, promote glucose uptake, although the molecular mechanisms underlying this intracellular signaling have not been fully elucidated yet45.
Figure 8: Insulin-independent pathway for GLUT4 vesicles translocation. Calcium,
bradykinin, nitric oxide and reactive oxygen species by activating molecular mechanisms those partially overlap with insulin- and AMPK-dependent pathways. The image was taken from Alvim et al, 201437.
1.3.4 GLUT4 trafficking
When blood glucose concentration increases, skeletal muscle and adipose tissue absorb circulating glucose through the translocation of GSVs from the intracellular storage pools to the plasma membrane.
Following GSVs translocation toward the plasma membrane, exposure of GLUT4 requires GSVs tethering/docking and fusion with plasma membrane. Insulin stimulus activates small GTPases promoting the cleavage of protein TUG (tether containing a ubiquitin regulatory X domain of GLUT4), which is located at the cis side of Golgi, tethering GSVs to Golgi matrix proteins. Once TUG has been cleaved, GSVs travel along the microtubular network from the perinuclear region to the membrane38,46, and dock to the plasma membrane through the exocyst complex. Finally GSVs fuse with plasma membrane through SNARE complexes formed by the interaction between v-SNARE on
vesicle membrane and two t-SNAREs, such as Syntaxin and Synaptobrevin, on plasma membrane47.
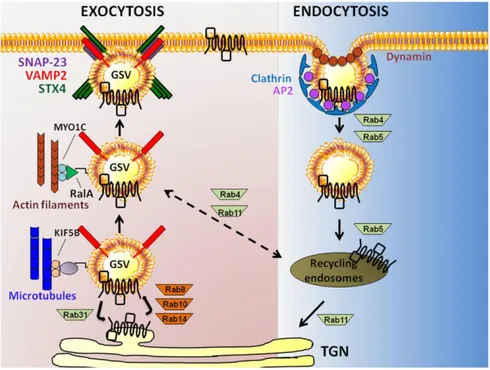
GLUT4 transporters are recycled by internalization processes, involving both clathrin-mediated and clathrin-independent endocytosis. In the former pathway, C- and N-terminal domains of GLUT4 are recognized by AP-2, an adapter protein that simultaneously interacts with GLUT4, phospholipids and clathrin. Clathrin forms a triskelion composed by three clathrin heavy chains (190kDa each) and three clathrin light chains (25kDa each) that allow membrane invagination and the formation of clathrin-coated endocytic vesicles. The clathrin-independent endocytosis is linked to the formation of endosomes from regions of the membrane rich in cholesterol. These structures, called caveolae, are membrane invagination stabilized by membrane proteins called caveolins, which interact with cholesterol and sphingolipids that, in turn, form the coating of the endocytic vesicles48 (Fig. 9). When endocytic vesicles fuse with the endosomal compartment, GLUT4 transporter can be distributed to either plasma membrane or to trans-Golgi network compartment to be inserted in new GSVs. When endocytic vesicles fuse with lysosomes, GLUT4 transporters are definitively broken down 49.
Figure 9: GLUT4 vesicles trafficking. This schematic model shows actin filament and
microtubule-dependent exocytosis of GLUT4, and the clathrin-mediated GLUT4 endocytosis.
1.4 Type 2 Diabetes
Skeletal muscle is the largest insulin sensitive tissue, thus representing the tissue where the major part of glucose (80%) is disposed under insulin stimulation50. In addition, glucose uptake by skeletal muscle is also triggered by the insulin-independent pathway activated during exercise, further underlying the importance of skeletal muscle tissue in the regulation of systemic glucose homeostasis51.
Indeed, skeletal muscle dysfunctions often affect body metabolism, leading to the onset of metabolic disorders52. Type 2 Diabetes (T2D) is the most common chronic metabolic disease. This pathology represents the 90% of diabetes cases and is characterized by insulin resistance followed by insufficient insulin release from pancreatic -cells, resulting in high levels of blood glucose. T2D is a multifactorial disease where environmental (age, lifestyle, obesity, etc.) and hereditary (genetic predisposition) cues are involved in its onset. Although environmental factors play a not-negligible role in the onset of this pathology, they do not impact everyone in the same way. In fact, individuals exposed to similar environmental risks, often display different T2D susceptibility, indicating that genetic factors may account for a higher risk of developing this pathology53. In the last decade, the advent of genome wide association studies (GWAS) have permitted to identify hundreds of genetic loci that can be associated to T2D susceptibility, considerably improving the knowledge of those inherited factors that may be causative for the onset of T2D.
1.4.1 ANK1 locus and Type 2 Diabetes susceptibility
GWAS is an observational study of genetic variants in individuals used to associate genetic variations to particular traits, such as those specific for a given disease. Through GWAS, hundreds of single nucleotide polymorphisms (SNPs) were associated to T2D. The majority of them resides in non-coding sequences, suggesting that the high risk to develop the disease is linked to the genetic regulatory components54. In fact, the majority of T2D associated SNPs have been found either in super enhancer sequences and clusters of
transcriptional enhancers, both well known to be involved in cell type specific gene expression55.
Of note, in the last decade, ANK1 gene was identified as a locus where several different SNPs associated to T2D susceptibility reside54. ANK1 gene encodes for Ankyrin1, a member of the ankyrin superfamily, first identified in erythrocytes, whose role is to connect the integral membrane proteins with the cytoskeleton.
Soranzo and collaborators56 identified two variants, rs4737009 and rs6474359, in ANK1 locus, associated to the production of not-physiological amount of glycated hemoglobin (HbA1c). This modified form of hemoglobin is the result of the glycation reaction, a chemical modification of hemoglobin due to high blood glucose levels. HbA1c is considered a marker for T2D, and these SNPs in
ANK1 gene are currently considered as associated to this metabolic disorder56. More interestingly, earlier studies identified, in the ANK1 locus, the presence of additional SNPs (rs515071 and rs516946), associated to impaired insulin secretion and to defects in -cells activity57,58.
1.4.2 Type 2 Diabetes and sAnk1.5
The polymorphisms identified in ANK1 locus associated to T2D susceptibility are mainly localized in the intron regions of the gene or in those regions without a known regulatory activity. Scott and collaborators, by analyzing 271 skeletal muscle biopsies, revealed the presence, in the regulatory architecture of skeletal muscle, a high number of muscle stretch/super enhancer where specific variants correlate with T2D susceptibility54. In particular, two independent GWAS studies identified a SNP (rs508419) associated to T2D susceptibility in the sequence of an internal promoter of the ANK1 gene (Fig.10). This internal promoter drives the transcription of alternative muscle specific small isoforms of Ankyrin1 (i.e. sAnk1.5, 1.6, 1.7, 1.8, 1.9), among which, sAnk1.5 is by far the most abundant16,59,60,61.
Figure 10: Internal promoter of ANK1 gene, located in the exon 39a, drives only the
expression of muscle specific small ankyrin isoforms. The SNP rs508419 resides in the sequence of this internal promoter. The allelic variation associated to T2D susceptibility is underlined in green. The image was adapted by Gallagher, Forget 199861.
The rs508419 SNP consists in the substitution of a thymine with a cytosine (C>T) that alters the binding of transcriptional regulators, suggesting a potential increase of promoter activity in subjects carrying C/C allele with respect to those carrying the T/T variant62,54. Indeed, in vitro luciferase assay performed on C2C12 muscle cells transfected with plasmid carrying C- or T- variants, demonstrated the actual increase of transcriptional activity of the promoter carrying the C-variant. Accordingly, mRNA and protein levels of sAnk1.5 are increased in skeletal muscle of individuals carrying the C/C variant with respect to those carrying the T/T variant (Fig.11).
Figure 11: The presence of SNP rs508419 lead to an internal promoter increased activity,
resulting in high levels of sAnk1.5 mRNA (A) and protein levels (B) in subjects with C/C allele variant, respect with T/T allele variant. The image was taken from Yan et al., 201662.
To initially investigate whether sAnk1.5 increased levels would associate with T2D phenotype, glucose uptake was analyzed in C2C12 muscle cells transfected with sAnk1.5, both in basal condition and insulin-stimulated state. Results obtained from those experiments indicated that glucose uptake was significantly reduced in cells overexpressing sAnk1.562.
1.5 Skeletal muscle-specific isoform of Ank1: sAnk1.5
Although the potential involvement of sAnk1.5 in T2D susceptibility has been very recently suggested, to date, the structural role of sAnk1.5 within the skeletal muscle fibers has been extensively studied.
sAnk1.5 is one of the small isoforms of Ankyrin1, selectively expressed in striated muscles.
Ankyrin1 is a member of the ankyrin superfamily, which is composed by modular proteins that play a role as adapter proteins between the integral membrane proteins and the cortical cytoskeleton. This superfamily includes three genes: ANK1 (also known as ANKR), first characterized in erythrocytes63,
ANK2 (also known as ANKB), first characterized in brain64, and ANK3 (also known as ANKG) discovered in node of Ranvier and in epithelial cells65,66.
These three canonical ankyrins share a common structural organization, with four structural domains (Fig.12):
1. NH2- terminal region, whose role is to allow the bind to integral membrane proteins; this domain is composed of 24 ANK repeats (24 copies of 33 repeats) folded into four subdomains, each composed by six repeats67;
2. a central spectrin-binding domain, a 64-kDa domain, whose role is critical for the binding to the cytoskeleton;
3. a death domain, composed approximately of 90 amino acid, whose role is still unknown; moreover, death domains are implicated in homo- or heteromeric interaction with other death domains and, for this reason, it is possible that in particular cellular contests this ankyrin domain might mediate ankyrin homo- or heterodimes;
4. C-terminal regulatory domain that regulates the binding activity of the other domains.
Figure 12: Schematic representation of ankyrin proteins domains. The protein contains 24
ANK repeats at N-terminal region to allow the binding with the integral membrane proteins; a spectrin-binding domain for the binding to the cortical cytoskeleton; a death domain (DD) whose role is still unknown; a regulatory domain at C-terminal region which regulate the binding activity of the other domains. The image was adapted from Lux, 201568.
Beyond the three canonical ankyrins (190-220kDa), alternative splicing events, consisting both in domains deletion or insertion, essentially related to the C- terminal region, generate additional isoforms, expressed in tissue and developmental specific manner69,70. The size of these spliced variants ranges between 26kDa to 480kDa, and it is possible to divide them into small and giant isoforms65,69,71,72,73. In skeletal muscle, tissue specific small isoforms (≈ 20kDa) of Ank1 have been identified. These small isoforms lack both the membrane binding domain and the spectrin-binding domain, while they retain
Membrane-binding domain Spectrin-binding domain Regulatory domain C-Term
N-Term
DD
1383 1881
24 ANK repeats 828
which contains an hydrophobic sequence, they are anchored on the sarcoplasmic reticulum membrane, where they localizes in correspondence of the M band and, at lesser extent, of the Z disks of the sarcomere59,60,61. The transcription of these small muscle isoforms is driven by an alternative promoter present between exons 39 and 40 of the ANK1 gene (Fig. 10), which is active only in striated muscle tissue. Five small isoforms of ANK1 gene were identified: sAnk1.5, sAnk1.6, sAnk1.7, sAnk1.8, sAnk1.9, even if sAnk1.5 is the most abundant isoforms present in skeletal muscle16 (Fig.13).
Figure 13: Muscle-specific small isoforms of Ank1. All small isoforms include the exon 39a,
codifying the N-terminal region, which is responsible for the insertion of the proteins in the sarcoplasmic reticulum membrane. Only sAnk1.5 and sAnk1.9 share the Obscurin-binding domain, encoded by the exon 41, and their levels are detectable in skeletal muscle. The image was adapted from Gallagher and Forget, 199861.
sAnk1.5 is a 17kDa protein, whose structure is composed by a N-terminal Transmembrane domain (TM) and a cytosolic tail16,59,71. Through its transmembrane domain, sAnk1.5 localizes on sarcoplasmic reticulum membrane, in particular in correspondence of M-band and, less extend,
Z-disk59. This protein is expressed in early stage of development: before birth, sAnk1.5 can be detected in correspondence of the Z disk, while after birth sAnk1.5 is mainly localized in correspondence of the M band. The C-terminal region of sAnk1.5 contains a sequence of 76 amino acids, first characterized in
ANK3 gene74,75 which is highly conserved in the genome of human, mice and rats, and that is known as Obscurin Binding Domain (OBD). This domain allows the direct interaction between sAnk1.5 and obscurin76. Hybridization and pull-down experiments identified two different sites on the COOH- terminal region of obscurin (aa 6231-6262 and aa 6324-6355) able to interact with sAnk1.5. Moreover, experiments performed on skeletal muscle cells transfected with sAnk1.5 protein mutated in specific residues of the OBD domain, showed a mislocalization of mutated sAnk1.5, due to the inability of the mutated protein to bind obscurin. The interaction between sAnk1.5 and obscurin was further confirmed by immunofluorescence experiments15,77 (Fig.14). In agreement with these results, immunofluorescence signal of sAnk1.5 appeared largely diffused in skeletal muscle fibers of obscurin knock out mouse17,78.
Figure 14: Immunofluorescence experiment performed on longitudinal section of EDL
muscle. -actinin antibody was used to detect Z-disks (panels B and E). Both sAnk1.5 signal (panel A) and Obscurin signal (panel D) were located on the M-bands and less on the Z-disks. Panels C and F represent the merge of -actinin signal with those of sAnk1.5 and Obscurin, respectively, indicating their colocalization. The image was adapted from Giacomello et al., 201577.
To date, the interaction between sAnk1.5 and obscurin is the only known molecular connection that is responsible for tethering the sarcoplasmic reticulum around the contractile apparatus (Fig.15).
Figure 15: Representative model of interaction existing between Obscurin and sAnk1.5
protein at M-band and Z-disk. This molecular “bridge” is critical to assemble the longitudinal sarcoplasmic reticulum around the contractile apparatus. The image was adapted from Feher, 201721.
The importance of this molecular bridge has been further confirmed by the characterization of sAnk1.5 and Obscurin knockout mouse models.
In skeletal muscle of sAnk1.5 knock out mice a significant reduction of l-SR volume was reported in adult mice (Fig.16). Moreover, in aged mice, l-SR volume reduction was accompanied by several structural damages, such as tubular aggregates, contractures and mitochondria and/or triads misplacing79. Interestingly, l-SR volume reduction was also observed in skeletal muscle fibers of Obscurin knock out mice17, further underlying the importance of sAnk1.5/Obscurin interaction in preserving the physiological volume and integrity of the l-SR.
Figure 16: Characterization of sAnk1.5 knock out mice. Longitudinal section of EDL muscle
indicates the same structural architecture of sAnk1.5 KO mice muscle compared to wild type (A and B). Cross section of sAnk1.5 KO mice EDL shows a reduction of sarcoplasmic reticulum volume, visible as vesicles and tubules between the myofibrils and indicate by the arrows, compared to EDL of WT mice. The image was adapted from Giacomello et al., 201577.
2. Aim of thesis work
In the last decade, genome wide association studies (GWAS) identified several SNPs associated with Type 2 Diabetes (T2D). In particular, in the ANK1 locus, a high number of SNPs associated to T2D susceptibility have been identified. However, the majority of these SNPs are localized within introns or in regions without known regulatory activities. Interestingly, two independent GWAS studies identified a T2D-associated SNP (rs508419) in the sequence of the internal promoter of the ANK1 gene, responsible for muscle specific expression of sAnk1.5. The C/C variant of this SNP determines an increased activity of the promoter resulting in increased sAnk1.5 mRNA and protein levels in the skeletal muscle of individuals carrying the C/C genotype, compared to those carrying the T/T one.
The aim of this work was to investigate the actual involvement of sAnk1.5 overexpression in Type 2 Diabetes susceptibility. To this end, we generated a transgenic mouse model where sAnk1.5 was selectively overexpressed in skeletal muscle. We thus monitored glucose and insulin tolerance in transgenic mice over a period of twelve months. In addition, to unveil whether sAnk1.5 overexpression might be associated to T2D susceptibility, we also analyzed glucose and insulin tolerance in transgenic mice fed with a High Fat Diet for twelve weeks.
3. Experimental procedures
3.1 Animal treatment
For this work C57 BL/6J mice were used. They were housed in a controlled environment, with standard condition of temperature (21-25°C) and humidity (50-60%), with a dark-light cycle of 12 hours. Mice had free access to food and water, as reported in the directive 2010/63/EU of the European Parliament and the Council of 22 September 2010 on the protection of animals used for scientific purpose. Mice were sacrificed by occipital-cervical dislocation, as reported in the D.lgs n°26/2014.
MLC-sAnk1.5 transgene was cloned in a pMEX-MLC plasmid in our laboratory. It contains the coding sequence of the murine sAnk1.5, with the untranslated 5’ region (714 nucleotides, GenBank accession number: U73972). The sAnk1.5 coding sequence is under the control of the muscle specific myosin light chain promoter (MLC)80. The transgenic mice (MLC-sAnk1.5 Tg+/-) were generated by the facility of the University of Nanjing, China. Both transgenic and wild type mice (not carrier sibling mice), as control, were then sent to Siena by Dr. Huimei Chen. To expand our colony, we crossed transgenic mice to obtain MLC-sAnk1.5 Tg+/+ mice and wild type mice, to obtain the wild type controls. Both wild type and transgenic male mice used for the scientific procedures were 2-6-10 and 12 months old.
3.2 Animal genotyping
3.2.1 DNA extraction
A little piece of mouse tail (<2mm) was taken from anesthetized weaned pups (about 25-days of age). The procedure below was performed with Puregene Core Kit A (Qiagen, Hilden, Germany). Samples were incubated overnight at 55°C in 300 l of Cell Lysis Solution and 3 l of Proteinase K enzyme. The day after the enzymatic digestion, 100 l of Protein Precipitation solution were
added to the samples, vortexed for 20 seconds and centrifuged for 3 minutes at 16000g, in order to precipitate protein components. The resultant supernatants were collected in new tubes. 300l of Isopropanol were added to the supernatants, samples were inverted 30 times and then centrifuged for 1 minute at 16000g to precipitate the DNA. The supernatants were discarded and the pellets were resuspended in 300l of Ethanol 70%, vortexed for 5 seconds and centrifuged for 1 minute at 16000g. The supernatants were discarded and the pellets were left under the chemical hood, approximately for 30 minutes, to allow ethanol evaporation. At the end, the DNA were resuspended in 40l of RNAse/DNAse-free water and heated for 15 minutes at 55° to facilitate their solubilization. DNA concentration was detected by Nanodrop system (Thermo Scientific, Waltham, Massachusetts, USA) and samples were diluted to the final concentration of 20ng/l.
3.2.2 Qualitative Polymerase Chain Reaction
For mice genotyping, three independent PCR reactions were performed on each DNA sample. Each reaction needs a specific couple of primers, which amplify a certain transgene region (Table 1). Mice were considered transgenic, if each one of the three PCR reactions was positive for the amplicons.
Table 1: Sequences of three couples of primers for sAnk1.5 transgene genotyping
The DNAs were amplified with a master mix containing 2.5l of Buffer 10X, 2.5l of dNTPs (stock 2mM), 1l of each primer (stock 10M), 0.25 l of Dream-Taq DNA polymerase (stock 5U/l), 5 l of DNA (20ng/l) and water
Couple of primers Name Sequences (5’->3’) Expected band size Amplificated region
to the final volume of 25l. Cycle times, temperatures and the number of cycles of the amplification program are reported in the Table 2.
Table 2: Amplification program for sAnk1.5 transgene
3.2.3 Agarose gel electrophoresis
PCR reaction products were resolved by electrophoresis run in a 2% agarose gel, dissolved in TAE buffer (Tris-acetate-EDTA 40mM Tris, 20mM acetic acid, 1mM EDTA, pH 8.3). 1l of SYBR Safe DNA Gel Stain (Invitrogen, Carlsbad, California, USA) per 10mL of agarose gel was added to detect the bands at the end of the run. Before loading, 5l of loading Buffer 6X (0.25% Bromophenol blue; 0.25% Xylene cyanol; 30% glycerol) were added to each sample. The electrophoretic migration was performed in horizontal electrophoresis chamber (Bio-Rad, Hercules, California, USA), for about 30minutes at constant voltage of 130V, using an Electrophoresis Power Supply (EPS 600, Amersham Pharmacia Biotech, Little Chalfont, UK). At the end of migration, PCR amplification products were visualized by UV transilluminator (220-310 nm) (BioRad, GelDOC1000) and the image was captured by a filter Polaroid BX-600 and thermal paper.
The molecular weight of amplification products was evaluated by comparison with a standard of fragments of known size (Gene Ruler 100bp, Thermo
Temperature (°C)
3.2.4 Real Time Polymerase Chain reaction
To discriminate mice carrying MLC-sAnk1.5 Tg +/- genotype from mice carrying MLC-sAnk1.5 Tg +/+ genotype, quantitative PCR was needed: therefore, 1ng of DNA was used for Real Time PCR reaction. Each DNA sample (1ng/l) was resuspended with 0.6l of forward and 0.6l of reverse primers (stock 10M), 10l of Fast SYBR Green Master Mix (stock 10X, Applied Biosystems, Thermo Fisher Scientific) and water to the final volume of 20l. This mix was prepared to analyze each sample in triplicate. GAPDH was used for the normalization. The quantitative PCR was performed on Applied Biosystems StepOne Real-Time PCR System. Primers sequences, temperatures, duration and number of cycles of the amplification program are reported in the Table 3-4. Based on recorded cycle thresholds, quantification of transgene expression relative to a reference sample was performed by Ct method81.
Table 3: Amplification program for sAnk1.5 transgene Real Time PCR
Table 4: Primer sequences of sAnk1.5 transgene and GAPDH for Real Time PCR
3.2.5 Evaluation of mRNA levels
Gastrocnemius muscles were excised from MLC-sAnk1.5 Tg+/+, MLC-sAnk1.5 Tg+/- and wild type mice and the RNA extraction was performed by miRNeasy Mini Kit (Qiagen, Hilden, Germany). Muscles were weighted to add 700l of Qiazol/100mg of muscle.
Samples were homogenized by Tissue Ruptor, with three strokes of five seconds each, rigorously in ice to avoid the samples overheating. The lysates were leaved for 5 minutes at room temperature. Then, 140l of chloroform were added, the cap tube closed and the samples were shaken vigorously for 15 seconds. After 2-3 minutes at resting condition at room temperature, the samples were centrifuged for 15 minutes at 4°C at 12000g. Following this centrifugation, the homogenates stratified in two phases: the aqueous one, on the upper side, which contain the RNA partition, and the organic one, in the lower side, which contain DNA, proteins and other debris materials. The aqueous phase was collected in a new 1.5mL tube. 350l of 70% ethanol were added and the samples were vortexed. 700l of sample at a time were transferred in RNeasy Mini Spin Columns to be centrifuged for 15seconds at 12000g at room temperature. The flow-through was discarded and 700l of RWT Buffer were added to the columns and then centrifuged at room temperature for 15 seconds at 12000g. The flow-through was discarded, 500l of RPE Buffer were added and the columns were centrifuged at room temperature for 15 seconds at 12000g. The washing step with RPE Buffer was then repeated. The columns were centrifuged to the highest speed for 1 minute, to eliminate the RPE buffer residues. The RNeasy Mini Spin Columns were placed in a new 1.5mL tube, 40l of RNase-free water were added directly onto the filters of the columns. To elute RNA, the columns were centrifuged at room temperature, at 12000g for 1.30 minute.
RNA samples were loaded on a 1.2% agarose gel for horizontal electrophoresis migration to verify RNA integrity. 2l of each RNA sample were mixed with 8l of RNase free water and 2l 6X DNA Loading Dye (Thermo Fisher Scientific, Waltham, Massachusetts, USA). The electrophoresis run was
with RNAse Zap solution (Thermo Fisher Scientific, Waltham, Massachusetts, USA), at 70V for about 45minutes. The size of RNAs fragments were evaluated by comparison with a ladder with bands of known length (Gene Ruler 1kb, Thermo Scientific).
To perform the Real Time PCR, RNAs were retro transcribed to obtain cDNA. Retro transcription was performed with the Promega kit and consisted into two steps: 1g of each RNA sample was resuspended with 0.5g of Random primer/g RNA and RNAse-free water to reach a final volume of 15l and incubated at 70°C for 5minutes; then, M-MLV Buffer 5X, dNTPs 20mM, RNasin 40U/l, M-MLV Retro transcriptase 200U/l and RNAse-free water were added to each sample, to achieve a final volume of 25l, and the solution was incubated for 1hours at 42°C. The quantity of reagents needed for the mix for one sample are reported in Table 5.
Table 5: Composition of the mix for cDNA retro-transcription
Amplification of -actin by PCR was performed on cDNAs to verify the correct retro transcription of the samples. 2l of cDNA were amplified in a final volume of 25l, using 2.5l of Buffer 10X, 2.5l of dNTPs (stock 2mM), 1l of both forward and reverse primers for -actin (stock 10M), 0.25 l of
Dream-Taq (stock 5U/l). Temperature, duration and number of cycles of the program of amplification reaction are reported in the Table 6.
Table 6: Amplification program for -actin.
The amplified products of the PCR reactions were resolved by horizontal electrophoresis migration on 2% agarose gel dissolved in TAE, for 30minutes at constant voltage of 130V. The size of amplification products was evaluated by comparison with Gene Ruler 100bp ladder (Thermo Fisher Scientific). Quantitative Real Time PCR was performed on cDNAs obtained. All samples were analyzed in triplicate using Fast SYBR Green PCR fluorescence technology (Applied Biosystems, Foster City, California, USA), and normalized using -actin as an endogenous control. Primer concentrations used in the mix were 0.3 M for both -actin primers, 0.3 M and 0.05M for reverse and forward primers, respectively, of sAnk1.5 transgene. The expression ratio of the gene of interest was calculated using the Comparative CT method (CT) of relative quantification.
The primers sequences used are reported in Table 7.
Table 7: Primer sequences for Real Time PCR
3.3 Evaluation of protein levels
3.3.1 Tissue lysate preparation
Gastrocnemius muscles were excised from three-months-old male mice with MLC-sAnk1.5 Tg-/- and MLC-sAnk1.5 Tg+/+ genotypes. The muscles, excised in ice, were immediately frozen in liquid nitrogen and stored at -80°C until the use. All the steps below were performed on ice to avoid protein degradation. The frozen muscles were lysed in RIPA Buffer (50nM Tris-HCl ph7.4; 1% NP40; 0.25% sodium deoxicolate; 150mM NaCl; 1mM EDTA), supplemented with 1mM PMSF (phenylmethylsulfonyl fluoride) and protease inhibitor cocktail (2g/mL aprotinin, leupeptin, chymostatin, pepstatin A, antipain) and then homogenized with Tissue Ruptor with two strokes of 5 seconds each. Homogenized samples were left for 1 hour at 4° in movement to allow digestion and then centrifuged for 15 minutes at 4° at 11000g to precipitate non-lysate material. The supernatant, rich in proteins, was recovered and transferred in a new tube.
3.3.2 Measurement of protein concentration
Proteins concentration was determined through the Bradford assay. This is a colorimetric assay based on the absorbance shift of the dye Comassie Brilliant Blue G-250 when added with different protein concentrations. The absorbance of the sample at 595 nm is measured and the protein concentration is determined in reference to a standard curve of know concertation of bovine serum albumin (BSA, Sigma Aldrich, St. Louis, Missouri, USA).
Name Forward Sequences
(5’->3’)
Reverse Sequences (5’->3’)
10l of each samples was diluted with 20l (1:3) or 90l (1:10) of bi-distillated water, respectively, and 10l of these dilutions were added to 790l of bi-distillated water and 200l of Bradford solution (Protein Assay Dye Reagent concentration kit, BioRad). The optical density of the entire solution was read to the spectrophotometer Ultrospec 2100 pro UV/visible (Amersham Bioscience, Little Chalfont, UK), using a wavelength of 595nm. Protein concentration (g/l) of each sample was obtained by the average between the OD of the two measurements.
3.3.3 SDS-Page electrophoresis
Muscle lysates were resolved with a run on a polyacrylamide gel, with the addition of sodium dodecyl sulphate (SDS-Page), whose function is due to its denaturant action, which confers a negative charge to the protein. In this way, the natural charge of the protein became negligible and the ratio weight/charge of denatured polypeptides became the same for different protein. As result, the run of the protein will be only based on molecular weight.
The electrophoresis migration was performed on 10% acrylamide homemade gel (Table 8) or on 4-12% gradient PreCast gel (Invitrogen, Thermo Fisher Scientific). 10g of each lysate were mixed to Sample Buffer 4X (250mM Tris-HCl pH 6.8, SDS 2%, glycerol 40%, -mercaptoethanol 20%, bromophenol blue 0.016%) and H2O to a final volume of 20l, heated at 95°C for 5 minutes and then loaded on the gel. The homemade 10% gels were run in TGS 1X running buffer (stock TG10X: 25mM Tris-HCl ph8.3, 1.44% glycine) plus 0.1% SDS, at 25mA, for 2 hours. The 4-12% precast gels were run in NuPAGE MES buffer 1X (50mM MES, 50mM Tris, 0.1% SDS, 1mM EDTA, pH7.3), at 200V for 30 minutes. In order to identify proteins of interest by their molecular weight, gel was also loaded with a ladder (Precision Plus Protein Standards, Dual color, BIORAD) containing proteins of known molecular weights.
Table 8: Polyacrylamide gel 10% composition for SDS PAGE. The gel is composed by an
upper part, the stacking, with a fixed concentration of acrylamide (4%), and by a lower part, the running, whose concentration depends on the molecular weight of the protein to analyze.
3.3.4 Western Blot
Proteins separated by SDS-PAGE were transferred onto nitrocellulose blotting membrane (GE Healtcare Life Science, Little Chalfont, UK). The transferring was performed in TG1X buffer (stock TG10X: 25mM Tris-HCl ph8.3, 1.44% glycine) with the addition of 0.1% SDS and 15% methanol, at 400mA, at 4°C for 2 hours. To evaluate the transfer quality, the nitrocellulose membrane was stained with Ponceau red (0.2% Red Ponceau, 0.2% Trichloroacetic acid TCA) for 5 minutes and rinsed rapidly with distillated water to remove the excess. The image of stained transferred proteins was acquired with ChemiDoc technology (Biorad). The membrane was incubated with a blocking solution composed of non-fat dried milk 5% dissolved in TBS-T (Tris-Buffered Saline and TWEEN 20: 20mM Tris-HCl, pH7.4, 150mM NaCl, 0.1% TWEEN 20), for one hour at room temperature, in order to mask non-specific sites, which can interact with the primary antibodies. The membranes were incubated overnight at 4° with the primary antibodies, diluted in TBS-T solution with 5% non-fat milk. The antibodies used were:
1- rabbit antibody for sAnk1.5 III bleed (1:1000)16
2- mouse antibody for GAPDH (Clone GA1R, 1mg/ml, Thermo Fisher Scientific, 1:1000)
The day after, the membranes were rinsed three times for 10 minutes with 0.5% non-fat milk TBS-T and then incubated for one hour with secondary antibodies at room temperature. The secondary antibodies (anti- rabbit/mouse IgG, GE Healtcare), specific for the constant fragments of the primary antibodies and conjugated to the horseradish peroxidase, were diluted 1:3000 in 5% milk TBS-T. Following the membranes were rinsed three times with 0.5% non-fat milk TBS-T for 10 minutes. The bands relative to the binding of the antibody to the proteins of interest were detected and acquired through the release of a luminescent signal detectable with a luminescence counter (Chemidoc, BIORAD). This signal was obtained through the incubation of the membranes with Enhanced Chemi Luminescence (ECL, Biorad) solution, which reacted with the horseradish peroxidase.
3.4 Evaluation of protein localization
3.4.1 Isolation and culture of single fibers
Flexor Digitorum Brevis (FDB) muscles were excised from wild type,
MLC-sAnk1.5 Tg+/+, and MLC-Tg+/+ mice and incubated in a myorelaxing solution for 10 minutes on ice. A collagenase solution composed of Collagenase (SIGMA C0130 0,4%W/V) + Tyrode (SIGMA T2145) + 10% Fetal Bovine Serum (FBS) (SIGMA 12103C) was prepared and filtered. Tyrode buffer and myorelaxing solution composition are reported in Table 9.
The muscles were transferred in a tube with 3mL of collagenase solution and incubated previously at 4° for 1 hour and then at 37°, 5% CO2 for 1:30 hour. Meanwhile, Lab-tek 8wells (Sarstedt) culture chambers were coated with laminin (SIGMA, St. Louis, Missouri, USA) and left in the incubator at 37°C, 5% CO2. After collagen digestion, the muscles were rinsed three times with 3mL of different solutions: Tyrode for 10 minutes at 37°C, 5% CO2; Tyrode + FBS 10% for 10 minutes at 37°C, 5% CO ; Tyrode + FBS 10% +