Excitation of propagating spin
waves in ferromagnetic nanowires
by microwave voltage-controlled
magnetic anisotropy
Roman Verba
1, Mario Carpentieri
2, Giovanni Finocchio
3, Vasil Tiberkevich
4& Andrei Slavin
4The voltage-controlled magnetic anisotropy (VCMA) effect, which manifests itself as variation of anisotropy of a thin layer of a conductive ferromagnet on a dielectric substrate under the influence of an external electric voltage, can be used for the development of novel information storage and signal processing devices with low power consumption. Here it is demonstrated by micromagnetic simulations that the application of a microwave voltage to a nanosized VCMA gate in an ultrathin ferromagnetic nanowire results in the parametric excitation of a propagating spin wave, which could serve as a carrier of information. The frequency of the excited spin wave is twice smaller than the frequency of the applied voltage while its amplitude is limited by 2 mechanisms: (i) the so-called “phase mechanism” described by the Zakharov-L’vov-Starobinets “S-theory” and (ii) the saturation mechanism associated with the nonlinear frequency shift of the excited spin wave. The developed extension of the “S-theory”, which takes into account the second limitation mechanism, allowed us to estimate theoretically the efficiency of the parametric excitation of spin waves by the VCMA effect.
Electric field control of magnetization in ferromagnets attracts a lot of attention of researchers in magnetism as it makes possible the development of novel magnetic recording and signal processing devices having low power consumption and compatible with standard CMOS technology. The electric field control could be realized using different magnetoelectric effects (see, e.g. review refs 1 and 2), among which of a particular interest is the recently discovered effect of the voltage-controlled magnetic anisotropy (VCMA)3–5. The VCMA effect manifests itself as a variation of the perpendicular magnetic anisotropy at the interface between a ferromagnetic metal and an insulator under the application of an interface voltage. This effect has many attractive features, including linearity (variation of the anisotropy energy is directly proportional to the applied voltage)4,6, absence of a hysteresis7,8, possibility of relatively large variations of the anisotropy field9,10 and practical absence of inertia (at least, in the gigahertz frequency range)11,12. These features make VCMA promising for various practical applications. In particular, the VCMA effect has been already proposed for use in magnetic recording13–15, control of motion of domain walls16–18 and skyrmions19, and for excitation of a ferromagnetic resonance11,12,20.
Recently, we have demonstrated analytically21 that by applying to a ferromagnetic metal - insulator interface a microwave voltage of a frequency ωp = 2πfp and a sufficient magnitude, it is possible to overcome the
thresh-old of parametric excitation of half-frequency (ωSW = ωp/2) short spin waves (SWs) in ferromagnetic nanowires
(at the same time, the linear excitation of SWs by VCMA, when ωSW = ωp, in a zero bias magnetic field is not
possible12,21,22). This means that the VCMA effect could be promising for excitation of propagating SWs in unbi-ased nanosized magnetic waveguides, where these SWs can be used for microwave signal processing.
It should be noted, however, that overcoming the parametric excitation threshold does not guarantee a stable excitation of propagating SWs. In the externally driven parametric process the excitation of monochromatic half-frequency propagating SWs could be hindered by many connected parasitic nonlinear phenomena, such as modulational instability, auto-oscillations and even developed turbulence of parametrically excited SWs23. The 1Institute of Magnetism, National Academy of Sciences of Ukraine, Kyiv 03142, Ukraine. 2Department of Electrical
and Information Engineering, Politecnico of Bari, I-70125 Bari, Italy. 3Department of Electronic Engineering,
Industrial Chemistry and Engineering, University of Messina, I-98166 Messina, Italy. 4Department of Physics,
Oakland University, Rochester, MI 48309, USA. Correspondence and requests for materials should be addressed to R.V. (email: [email protected])
received: 11 October 2015 accepted: 05 April 2016 Published: 26 April 2016
exact manifestation of these nonlinear phenomena depends on the strength of the microwave driving signal, SW spectrum of a magnetic sample and peculiarities of the parametric interaction between the driving signal and parametric SWs in a given sample geometry.
The conditions necessary for a stable parametric excitation of SWs were studied in details for two- and three-dimensional geometry in the case of spatially uniform parametric pumping in the framework of the so-called L’vov-Zakharov-Starobinets “S-theory”23–25. The “S-theory” shows that the amplitudes of the excited SWs are limited by the “phase mechanism”23, which is the disappearance of the phase correlation between the pumping signal and the excited SWs due to the nonlinear interaction between the SWs. The “S-theory” allows one to calculate the SW amplitudes, thus providing a theoretical estimate for the parametric excitation efficiency. Unfortunately, the conclusions of the conventional “S-theory”23 cannot be directly translated to our case of VCMA-induced parametric excitation of SWs, where the ferromagnetic sample has to be quasi-one-dimensional (nanowire) in order to guarantee a definite direction of the SW propagation21, and the microwave parametric pumping is localized in the region of the VCMA gate electrode.
In our current work we study the peculiarities of the parametric excitation of SWs at a VCMA interface using the micromagnetic simulations. As it is shown below, in a real nanowire geometry the achievable magnitudes of the electric field of the microwave parametric pumping could reach the magnitudes that not only are above the threshold of parametric excitation, but are sufficient to sustain a stable generation of SWs propagating far away from the region of pumping localization and having narrow frequency linewidth. The comparison of our simulation results with the analytical results obtained using the modified “S-theory” demonstrates that in one-dimensional nanoscale ferromagnets the amplitudes of the parametrically excited SWs are limited not only by the classical “phase mechanism” (characteristic for the “S-theory” in bulk ferromagnets23), but, also, by an additional limiting mechanism caused by the dependence of the SW group velocity on the SW amplitude, which appears due to a non-zero nonlinear SW frequency shift.
Results
Micromagnetic simulations.
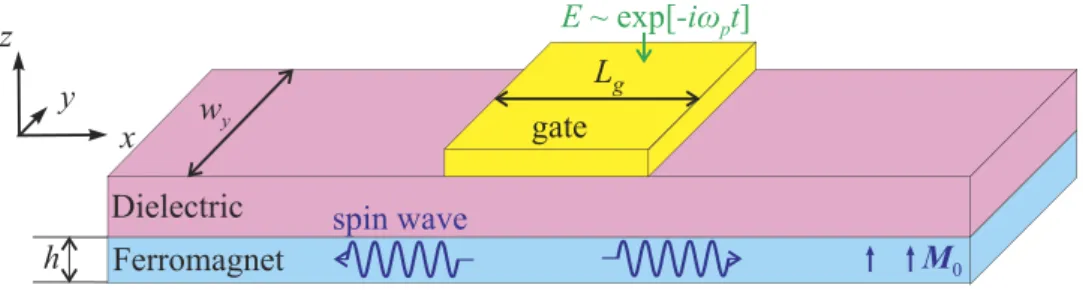
A sketch of a particular SW waveguide geometry used in our micromagnetic simulations is shown in Fig. 1. We consider a nanowire waveguide of the thickness h and width wy made from aconductive ferromagnetic material and grown on a thin MgO dielectric layer. Note, that since VCMA is a purely interface effect4,5,8, the nanowire should be ultrathin (h ~ l nm), and, owing to the perpendicular growth anisot-ropy, ultrathin magnetic nanowires and films in a zero bias magnetic field, typically, exist in the static magnetic state in which the film magnetization is directed out-of-plane26,27. This magnetic configuration will be considered below.
On top of the nanowire there is a conductive excitation (or input) gate, which creates a microwave electric field
E at the VCMA dielectric-ferromagnetic interface. This electric field drives microwave oscillation of the
perpen-dicular interface anisotropy Ks,⊥=βE (where β is the magnetoelectric coefficient). The input gate covers only a
part of the length Lg of the nanowire waveguide. In such a geometry the SWs excited at the input gate could
prop-agate outside the input gate region, where they could be influenced by other gates performing signal processing functions and, eventually, received by an output gate.
First, we performed the simulations for a CoFeB nanowire of the thickness h = 0.8 nm, width wy = 20 nm with
a gate length of Lg = 40 nm (see Methods). It is known21, that in a narrow nanowire waveguide the excitation
threshold is lower than in a wider waveguides, and, therefore, the SW parametric excitation efficiency should be higher. The magnitude of the microwave anisotropy field was fixed at Δ Ba = 50 mT, which corresponds to the
experimentally reachable magnitude of the electric field E = 0.78 V/nm (β =37f J/V m)⋅ 12, while the frequency
fp of this field was varied.
In our simulations the in-plane components of the variable nanowire magnetization (normalized by the static magnetization Ms) were calculated under the center of the excitation gate as functions of the pumping frequency
fp. These curves are shown in Fig. 2(a). It is clear that in the range fp ∈ [4.73, 4.86] GHz the amplitude of the excited
magnetization precession significantly exceeds the thermal fluctuation level. The difference between the x and y components of the variable magnetization, i.e. nonzero precession ellipticity, naturally appears due to the in-plane shape anisotropy of the nanowire, and this ellipticity remains almost constant within frequency range of paramet-ric excitation. Frequency spectrum of the excited magnetization precession contains one dominant peak (Fig. 2(b)), the maximum of which is located exactly at the half of the pumping frequency fp (Fig. 2(d)). This
means that the microwave voltage applied to the excitation gate leads to the parametric excitation of SWs. Note, that the frequency distribution of excited SWs is very narrow–its width (half width at half maximum, HWHM) is
Figure 1. Considered system. A layout of a ferromagnetic nanowire spin wave waveguide grown on a dielectric
equal to 9–13 MHz. This is several times smaller than in the case of SWs of the same frequency excited linearly (i.e. by the in-plane microwave field), when HWHM= 3αG SWf =41MHz. When the amplitude of the mag-netization oscillations becomes larger, smaller additional peaks appear in the frequency spectrum (see curve for
fp = 4.73 GHz in Fig. 2(b)). However, even in that case of higher amplitude of the excited SWs the parametric
excitation process remains stable, which is confirmed by the existence of only one dominant peak in the fre-quency spectrum of the excited SWs.
For a fixed pumping frequency the SW are excited, as expected, only above a certain threshold pumping magnitude ΔΒ th, and above this threshold the SW amplitude increases monotonically (Fig. 2(c)). The threshold
depends on the excitation frequency, mainly due to the frequency dependence of the SW group velocity (see Eq. (2)). In particular, the parametric excitation is absent for fp > 4.86 GHz because at higher frequencies the
threshold becomes larger then the applied pumping amplitude ΔΒa = 50 mT. At the pumping frequencies below
4.73 GHz the parametric excitation is also absent, but for a different reason. For fp < 4.73 GHz half of the pumping
frequency lies below the bottom of the SW spectrum in the nanowire and, therefore no propagating SW can be excited parametrically in this frequency range at all.
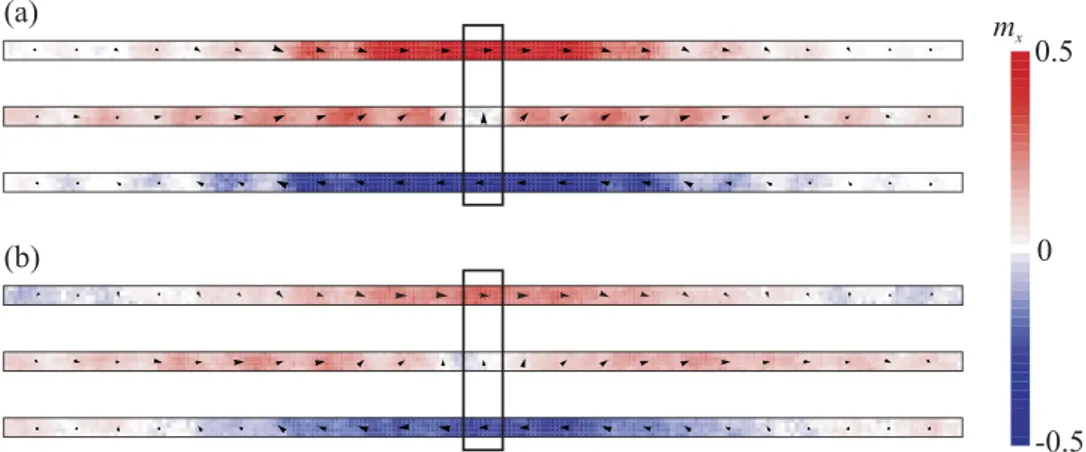
However, when the pumping frequency is larger than fp > 4.73 GHz, the pumping excites propagating SWs
moving along the nanowire in both directions from the excitation gate. This is clearly illustrated by Fig. 3 where three instantaneous magnetization distributions in the nanowire, corresponding to three moments separated by a quarter of a period of the magnetization precession, are presented. It is clear that the maximum of the precession amplitude moves away from the gate region and propagates for a distance that is significantly larger than the gate length. The wave number of the excited SWs depends on the excitation frequency–in the considered geometry of a nanowire with perpendicular static magnetization a higher pumping frequency fp corresponds to a higher SW
wave number k. The shortest SW excited in the considered case at fp = 4.86 GHz has the wave number k ≈ 8 μ m−1.
The determination of the SW wave number for fp = 4.73 GHz is complicated, since the SW propagation length is
comparable to the SW wavelength, so that the propagation maxima and minima of the dynamical magnetization are not clearly distinguishable. However, it should be noted, that, rather unexpectedly, even for this lowest excita-tion frequency, that should correspond to the excitaexcita-tion of a ferromagnetic resonance21, the propagation of SWs having a non-zero wave vector is seen (Fig. 3(a)). This unexpected feature will be explained below.
Note also, that, as always for the parametric excitation in a continuous media, SW wave number depends only on the pumping frequency and, due to the nonlinear frequency shift, on the pumping amplitude (see below), but not on the length of the excitation gate Lg. The propagation length lp = v/Γ of the excited SWs depends on their Figure 2. Amplitude and frequency of the excited spin waves. Normalized in-plane components
=
mx y, Mx y,/Ms of the variable nanowire magnetization under the center of the excitation gate as functions of the pumping frequency for ΔΒ a = 50 mT, wire width wy = 20 nm and gate length Lg = 40 nm (a) and mx as a
function of the pumping amplitude ΔΒ a at fp = 4.8 GHz (c): symbols - micromagnetic simulations, lines -
analytical theory. The frequency spectra of the micromagnetically calculated magnetization precession under the gate region and the position of their maximums as a function of the pumping frequency fp are presented in
wave number–it increases with k, since the SW group velocity v increases with k faster than the SW damping rate Γ (until k< ω γµ0/( 0Ms) /λex, where ω0 is the ferromagnetic resonance frequency. Otherwise the opposite rela-tion takes place).
From Fig. 3 one can also see that the excited SWs are uniform across the nanowire width. This is absolutely natural, since for such a narrow nanowire all the SW modes that are nonuniform across the nanowire width have much higher frequencies fSW, which simply don’t satisfy the parametric resonance condition fSW = fp/2. For much
wider nanowires (hundreds of nanometers in width) the resonant condition could be satisfied for several SW modes having different profiles across the nanowire width. In this case the parametric pumping could excite a nonuniform mode–this depends on the interplay between the SW radiation losses and the coupling with pump-ing (e.g. see an example in ref. 28).
Theory.
In order to find an explanation to the features of the SW excitation process seen in the numerical modeling and to derive an approximate analytical expression for the SW excitation efficiency we developed a theoretical model presented below. We start from the system of modified Bloembergen equations describing the process of parametric excitation of SWs29,30: ∂∂ + ∂ ∂ + Γ = − ⁎− ⁎− | | + | | t v x a1 iVb a0 2 iVb a2 1k i T a( 12 2S a22) ,a1 (1) which describes the temporal and spatial evolution of the envelope amplitudes a1 and a2 of the excited SWs having the carrier wave vectors k and (− k) and frequency ωk = ωp/2, respectively (the second equation of the system
could be obtained by the replacement a1,2 → a2,1 and v → (− v)). Here v and Γ are the SW group velocity and damping rate (which includes both natural damping and nonuniform resonance line broadening due to techno-logical imperfections), bk is the Fourier image of the microwave anisotropy field, V=Vkk=γωM k(Fx −Fky)/(4 )ωk is the efficiency of the parametric interaction, where ˆFk is the Fourier transform of the coordinate-dependent demagnetization tensor21. Characteristics of SWs having the carrier wave vectors k and (− k) are the same, since SW spectrum in the considered perpendicularly magnetized nanowire is reciprocal. Equation (1) contains the so-called nonadiabatic pumping term b2k31 which should be taken into account since the SW wavelength is greater than the pumping localization length.
We also take into account the nonlinear frequency shift T caused by the SW “self-interaction” and the nonlin-ear 4-wave (4-magnon) interaction between the parametrically excited “pairs” of SWs having wave vectors k and (− k), which is described by the Hamiltonian = ∑ k k kS c c c c⁎ ⁎−k k k−, where ck is the SW amplitude (see “S-theory”
in ref. 23). Note, that in bulk samples this 4-magnon interaction between the SW “pairs” is the only important mechanism limiting (or determining) the amplitudes of the parametrically excited SWs. All the other nonlinear interaction processes between the SWs could be disregarded, as in the traditional “S-theory” for bulk magnetic samples (see ref. 23). The validity of this approximation will be confirmed from the comparison between the analytical results of the above presented model and the results of the micromagnetic simulations. The magnitudes of the nonlinear coefficients in the model could be evaluated using the formalism of ref. 32 (see Methods). In the range of relatively long SWs (k1/ ,1/h λex) both nonlinear coefficients could be approximately evaluated as
γ ω
= = − − +
T S Bint M(F0x F0y)/2, where Bint is the modulus of the static internal field in the nanowire.
The threshold of the parametric excitation of SWs could be calculated from Eq. (1) in the linear approxima-tion, setting T = S = 0. Following the method from ref. 30 one can obtain an implicit equation determining the parametric excitation threshold:
Figure 3. Spin wave profiles. Micromagnetic snapshots of the distributions of variable magnetization in
a nanowire near the pumping gate at the moments separated by a time intervals equal to the quarter of the magnetization precession period. A part of the nanowire waveguide of the length equal to 1 μ m is shown around the pumping gate, which is indicated by a black rectangle. The pumping frequency is fp = 4.73 GHz (a) and
shorter SWs having higher eigenfrequencies, it is clear that the frequency range of the parametric excitation is larger for a larger gate size Lg at a fixed pumping amplitude and, naturally, this range increases with the increase
of the pumping amplitude bp. In principle, at a very high bp the nonlinear processes other than those considered
here could take place and could change this tendency. However, this issue lies beyond the scope of our current work.
To calculate the amplitudes of the parametrically excited SWs one needs to find stationary solutions of the system Eq. (1). Note, that at this stage the nonlinear frequency shift T could be disregarded, since the SW spec-trum is continuous, and with the increase of the SW amplitude the SW wave vector changes in such a way, that the resonance condition ωp = 2ωk(|a|) is satisfied. This process, which in not described by the system Eq. (1), will be
explicitly discussed below.
The analytical solution of the system Eq. (1) could be found only in the simplest case, when the parametric pumping is spatially uniform and covers all the magnetic film23,30, while in the general case this system allows only a numerical solution. The analysis of the numerical solutions of Eq. (1) has shown that the amplitude of the para-metrically excited SW could be estimated with reasonable accuracy using the following approximate expression:
| | = | | = | | − | | | | . a a C b V b V S ( ) 2 (3) max max th 1 2 0 2 0, 2 1/4
This approximate expression differs from the exact analytical one, obtained for the case of a spatially uniform pumping, only by the presence of the coefficient C. Here ai max is the maximum value of the SW envelope ampli-tude in the nanowire, which commonly occurs at the boundary of the pumping area (left and right boundaries for
a1 and a2, respectively). Thus, it is the maximum amplitude of a SW propagating from the area of pumping locali-zation. The coefficient C increases from 1 up to C ~ 2 when the radiation losses Γ rad = v/Lg (existing due to the finite
pumping localization and finite SW group velocity) increase in comparison with the intrinsic SW damping Γ . Our simulations showed also that the dependence of the coefficient C on the degree of nonadiabaticity α is suffi-ciently weak to be neglected.
The appearance of the coefficient C in Eq. (3) is related to the spatial localization of the parametric pumping under the gate of the length Lg. In the case of a spatially localized pumping the spatial profiles of the
parametri-cally excited spin waves become nonuniform. Namely, for weakly localized pumping, when Γ Lg/v ≫ 1, SW
pro-files ai(x) are almost uniform within the pumping region except small regions near the pumping area boundaries.
When the pumping becomes more localized (the ratio Γ Lg/v decreases), these boundary regions occupy larger
relative area and finally, for a sufficiently localized pumping, there are no regions with constant SW profiles at all. Nonuniform SW profiles affect both the values of the excitation (V) terms and nonlinear (S) terms in the right-hand-side part of Eq. (1), an interplay of which determines the excited SW amplitude. For a more localized pumping, when the region where a xi( )<ai max, becomes larger, both pumping and nonlinear terms decrease, but the nonlinear S-term decreases faster since it contains three spin wave mode amplitudes contrary to one SW amplitude in the V-term. Consequently, the resulting maximal spin wave mode amplitude amax increases when the
pumping becomes more spatially localized (for a fixed value of the numerator in Eq. (3)). This effect is taken into account by the coefficient C which increases from 1 to roughly 2 with the decrease of the ratio Γ Lg/v, as was found
from numerical simulations of Eq. (1). Note, that this does not mean that a decrease of the gate length Lg leads to
an increase of excited SW amplitudes at given pumping, because the threshold b0,th, which also determines excited SW amplitudes (Eq. (3)), becomes larger for a more localized pumping, as described by Eq. (2), and the increase of the threshold is significantly greater than the variation of the coefficient C.
Let us now discuss the effect of the nonlinear frequency shift (described by the coefficient T) on the process of parametric excitation of SWs. As it was pointed earlier, this frequency shift leads to the change of the SW wave vector with the increase of the SW amplitude. If all the parameters in Eq. (1) are only weakly dependent on the SW wave vector, one can simply neglect the nonlinear shift in Eq. (1) and use the approximate Eq. (3) for evaluation of amplitudes of the excited SWs. In our case, however, this assumption is not correct. Although the parameters
V, Γ, and S are weak functions of the SW wave vector, the SW group velocity v changes significantly with the wave
vector k variation. Note also, that the nonlinear frequency shift coefficient in our case is negative, T < 0, that is related to the perpendicular anisotropy of magnetic nanowire. Thus, with the increase of the SW amplitude the SW spectrum shifts down, and the half of the pumping frequency will now correspond to a higher SW wave vector and, therefore, to a higher value of the SW group velocity. Thus, with the increase of the SW amplitude the radiation losses increase, which leads to the additional limitation of the amplitude of the excited SWs.
To account for this effect rigorously, one needs to insert the dependence v = f(k(|a|)) into Eqs (2, 3) and to obtain a complex implicit equation for the excited SW amplitudes. On the other hand, to obtain an approximate analytical solution one can use an approximate dispersion relation for SWs in an ultrathin nanowire in the form:
ωk≈ω0+ω λ2 ex2 2k , and obtain a simple approximate expression for the SW group velocity in the form: ω λ
≈
expres-sion for Ak, Eq. (9), in the Methods section). The parametric excitation threshold Eq. (2) can be expressed as23
= Γ +
V b2 0,2th 2 C v Lv( / )g2, where Cv∈[1, ]π =f L v(Γ g/ , )α. In our case of a highly nonadiabatic pumping and relatively high radiation losses the coefficient Cv is equal to Cv ≈ 1. Combining these expressions and taking into
account the amplitude dependence of the SW frequency ωk( )a =ωk(0)− T ai2 we find that the increase of the SW amplitude leads to the following increase of the total SW losses in the system: ∆Γ =2 4ω λ2 ex v2C T a Li2/ g2. Solving now Eq. (3) taking into account the explicit power dependence of the SW losses, we finally get
= − + − a C S bV b V T T 2 , (4) i max 2 th 2 2 1/2
where T=(ω λ2 ex v2C C T2| |)/(L Sg2| |). It should be noted, that for a relatively large nonlinear frequency shift T Γ, that is realized in our geometry, the resulting SW amplitude, given by Eq. (4), very weakly depends on the value of the coefficient C, which cannot be found analytically. Thus, in our case we can simply use C = 2, as for the case of a high radiation losses.
Using Eq. (4) we can describe the frequency dependence of the excited SW amplitudes, obtained from the micromagnetic simulations. The quantity calculated from the micromagnetic simulations is the sum of the partial SWs amplitudes at the center of the excitation gate, aΣ = a1+a2. This quantity can be expressed as
=
Σ Σ
a C max a1, where the coefficient CΣ ∈[1, 2]. The value C∑ = 2 corresponds to low radiation losses, when the amplitudes of the forward- and backward-propagating parametrically excited SWs are almost constant within the pumping region. With the increase of the SW group velocity (and, therefore, with the increase of the radiation losses) the value of the coefficient C∑ decreases. The relation between envelope amplitude A∑ and the real mag-netization amplitude Mx,y are given by23,32
= − Σ ± Σ M M a u v a max y x, s 2 2( k k) , (5) where ω ω ω ω = + = − − u A v B A 2 , sign 2 , (6) k k k k k k k k k
and Ak, Bk are the coefficients of the Holstein-Primakoff transformation (see Eqs (9 and 10) in the Methods
section).
The resulting analytical expression for the frequency dependence of the amplitude (mx) of the parametrically
excited SWs gives a good quantitative description of the results of our micromagnetic simulations for C∑ = 1.7 (see Fig. 2(a,c)). Note, that C∑ is the only fitting parameter used, as all the other quantities were calculated from the nanowire geometry and the material parameters. Note also, that if we neglect the effect of the nonlinear frequency shift and use Eq. (3) instead of Eq. (4) the analytically calculated SW amplitudes will be significantly overestimated. Thus, the change of the SW group velocity due to the nonlinear adjustment of the SW wave vector is critically important in the process of parametric excitation of SWs in magnetic nanowires. Also, it is due to this adjustment that we see the propagating SW profiles at the lowest excitation frequency (Fig. 3). The standing ferromagnetic resonance at this frequency could be excited only when the pumping amplitude (and, therefore, the amplitude of the excited variable magnetization) is sufficiently low to produce any evident nonlinear shift of the SW wave vector.
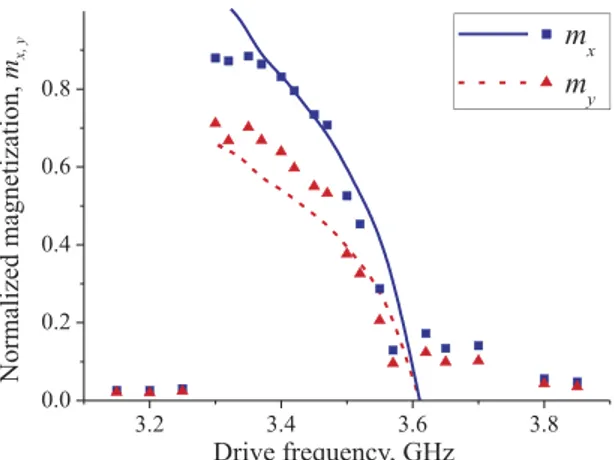
In order to verify the developed analytical theory we performed micromagnetic simulations for a different width of the nanowire (50 nm) and a different gate length (100 nm), setting also the anisotropy constant to
= . × ⊥
K 1 6 10 J/m6 3. This change did not lead to any qualitative difference in the micromagnetic results, and we observed SW excitation in the frequency range fp ∈ [3.3, 3.57] GHz, which corresponds to the following wave
number range of the excited SWs: k ≤ 11 μ m−1. The developed analytical theory gave a good quantitative descrip-tion of the micromagnetic results for C∑ = 1.9 (see Fig. 4). The higher value of the coefficient C∑ for this case then for the first studied geometry (C∑ = 1.7) is natural, since in this case the radiation loses Γrad = v/Lg are smaller due
to larger length Lg of the pumping area.
Finally, let us discuss the issue of stability of the SW parametric excitation. As it follows from the results presented above, the only important nonlinear interactions between the excited SWs are the 4-wave processes responsible for “self-action” (described by the nonlinear coefficient T) and the processes of the interaction between the SW “pairs” (described by the nonlinear coefficient S). All the other 4-wave scattering processes, which could lead to the SW instability, are weak due to quasi-one-dimensional character of our system (nano-wire) and the monotonic character of the of the SW spectrum of the nanowire. The 3-wave processes in our geometry have zero efficiency at all as long as the static magnetization is aligned with one of the symmetry axis of nanowire32. The 2-magnon scattering processes, which could take place due to the defects present in a nanowire, in the studied case of ultrathin magnetic nanowires should be weak, since the characteristic size of the possible defects in the nanowire material (nm) is substantially smaller than the characteristic SW wavelength (100 nm and more). Finally, the non-adiabatic character of the applied parametric pumping fixes not only the sum of phases of the excited SWs, but also the difference of these phases31, which makes the SW excitation process stable with respect to the appearance of magnetization auto-oscillations23.
Discussion
In this work it has been demonstrated that a local microwave variation of the magnetic anisotropy caused by the application of a microwave electric field could excite propagating SWs in an ultrathin ferromagnetic nanowire via
the parametric excitation mechanism. The excited SWs could propagate for distances that are large compared to the size of the excitation gate, could have relatively large amplitudes and narrower spectral linewidth comparing to linearly excited SWs. These properties are very desirable for applications of the excites SWs in the nanos-cale microwave signal processing devices. It is confirmed that, similar the case of a spatially uniform parametric pumping, the amplitudes of the excited SWs are limited by the “phase mechanism” resulting from 4-wave inter-action between the excited SW “pairs”. However, in the case of a spatially localized parametric pumping in a mag-netic nanowire due to a significant dependence of the SW group velocity on the wave vector a nonlinear shift of the SW frequency should be taken into account to obtain a correct estimation of the amplitude of the excites SW.
Methods
Micromagnetic simulations.
Our micromagnetic simulations were performed using the parallel micro-magnetic solver GPMagnet33,34. The length of the nanowire L = 2 μ m was chosen to be sufficiently large to avoid the possible reflections from the far edges of the waveguide. The gate region of the length Lg was placed at thenanowire center. The material parameters of the ferromagnetic waveguide used in our simulations were: satura-tion magnetizasatura-tion Ms = 1.6 × 10⁶ A/m, exchange constant Aex = 2.0 × 10⁻¹¹ J/m, out-of-plane anisotropy
con-stant K⊥ = 1.55 × 10⁶ J/m3, and Gilbert damping constant αG = 0.01, that corresponds to the typical parameters of
CoFeB. Within the excitation gate region the anisotropy field was considered to be time varying:
∆ π
= +
Ba Ba,0 Ba sin[2 f tp ], where Ba,0=2 /K M⊥ s is the static part, whereas fp and ΔΒa are the frequency and the amplitude of the microwave-frequency anisotropy field, respectively. Thermal fluctuations corresponding to the temperature T = 1 K were taken into account.
Calculation of nonlinear coefficients.
A general way to calculate the coefficients of nonlinear SW inter-action in ferromagnetic films is presented in ref. 32. In the notation of ref. 32 the coefficients T and S are the 4-magnon scattering coefficients T ≡ Wkk,kk and ≡S Wk k k k( ), ( )− − . Since the tensor ˆFk is diagonal (in coordinatesystem shown in Fig. 1) all 3-magnon processes have zero efficiency until static magnetization is aligned with one of the symmetry axis of nanowire, so one doesn’t need take into account the renormalization of 4-magnon coeffi-cients due to nonresonant 3-magnon processes. Noting this one can obtain following expressions for the nonlin-ear coefficients in the case of zero external magnetic field
ω ω λ = − + − + T A B k F F 2 (4 ), (7) k k M k ex z k z 2 2 2 2 0 2 ω ω λ = − + − + S A A k F F 2 (4 ), (8) k k M k ex z k z 2 2 2 2 0 2 where γ ω λ = + + + A B k F F 2 (2 ), (9) k int M ex2 2 kx ky ω = − B F F 2 ( ), (10) k M ky kx
Figure 4. Amplitude of excited spin waves. Normalized in-plane components mx,y = Mx,y/Ms of the variable
nanowire magnetization under the center of the excitation gate as functions of the pumping frequency for Δ Ba = 50 mT, wire width wy = 50 nm and gate length Lg = 100 nm. Symbols - micromagnetic simulations, lines -
ω =k2 Ak2−Bk2 is the SW eigenfrequency, λex is the material exchange length and Bint=Ban−µ0M Fs 0z is the static internal field in nanowire. In the range of relatively long SWs (k1/ , 1/h λex) the above expressions reduce to T= = −S γBint−ωM(Fx+Fy)/2
0 0 .
References
1. Fiebig, M. Revival of the magnetoelectric effect. J. Phys. D: Appl. Phys. 38, R123 (2005).
2. Tong, W.-Y., Fang, Y.-W., Cai, J., Gong, Y.-W. & Duan, C.-G. Theoretical studies of all-electric spintronics utilizing multiferroic and magnetoelectric materials. Comput. Mater. Sci. 112, part B, 467 (2015).
3. Weisheit, M. et al. Electric field-induced modification of magnetism in thin-film ferromagnets. Science 315, 349 (2007). 4. Duan, C.-G. et al. Surface magnetoelectric effect in ferromagnetic metal films. Phys. Rev. Lett. 101, 137201 (2008).
5. Endo, M., Kanai, S., Ikeda, S., Matsukura, F. & Ohno, H. Electric-field effects on thickness dependent magnetic anisotropy of sputtered MgO/Co40Fe40B20/Ta structures. Appl. Phys. Lett. 96, 212503 (2010).
6. Tsujikawa, M. & Oda, T. Finite electric field effects in the large perpendicular magnetic anisotropy surface Pt/Fe/Pt(001): A first-principles study. Phys. Rev. Lett. 102, 247203 (2009).
7. Ha, S.-S. et al. Voltage induced magnetic anisotropy change in ultrathin Fe80Co20/MgO junctions with Brillouin light scattering.
Appl. Phys. Lett. 96, 142512 (2010).
8. Shiota, Y. et al. Quantitative evaluation of voltage-induced magnetic anisotropy change by magnetoresistance measurement. Appl.
Phys. Express 4, 043005 (2011).
9. Maruyama, T. et al. Large voltage-induced magnetic anisotropy change in a few atomic layers of iron. Nat. Nanotech. 4, 158 (2009). 10. Nakamura, K. et al. Giant modification of the magnetocrystalline anisotropy in transition-metal monolayers by an external electric
field. Phys. Rev. Lett. 102, 187201 (2009).
11. Nozaki, T. et al. Electric-field-induced ferromagnetic resonance excitation in an ultrathin ferromagnetic metal layer. Nat. Phys. 8, 491 (2012).
12. Zhu, J. et al. Voltage-induced ferromagnetic resonance in magnetic tunnel junctions. Phys. Rev. Lett. 108, 197203 (2012). 13. Shiota, Y. et al. Induction of coherent magnetization switching in a few atomic layers of FeCo using voltage pulses. Nat. Mater. 11,
39 (2012).
14. Wang, W.-G., Li, M., Hageman, S. & Chien, C. L. Electric-field-assisted switching in magnetic tunnel junctions. Nat. Mater. 11, 64 (2012).
15. Nozaki, T. et al. Magnetization switching assisted by high-frequency-voltage-induced ferromagnetic resonance. Appl. Phys. Express
7, 073002 (2014).
16. Schellekens, A., Van den Brink, A., Franken, J. & Swagten, H. J. M. amd Koopmans, B. Electric-field control of domain wall motion in perpendicularly magnetized materials. Nat. Commun. 3, 847 (2012).
17. Bauer, U., Emori, S. & Beach, G. S. D. Voltage-gated modulation of domain wall creep dynamics in an ultrathin metallic ferromagnet.
Appl. Phys. Lett. 101, 172403 (2012).
18. Bernand-Mantel, A. et al. Electric-field control of domain wall nucleation and pinning in a metallic ferromagnet. Appl. Phys. Lett.
102, 122406 (2013).
19. Zhang, X., Zhou, Y., Ezawa, M., Zhao, G. P. & Zhao, W. Magnetic skyrmion transistor: skyrmion motion in a voltage-gated nanotrack. Sci. Rep. 5, 11369 (2015).
20. Shiota, Y. et al. High-output microwave detector using voltage-induced ferromagnetic resonance. Appl. Phys. Lett. 105, 192408 (2014).
21. Verba, R., Tiberkevich, V., Krivorotov, I. & Slavin, A. Parametric excitation of spin waves by voltage-controlled magnetic anisotropy.
Phys. Rev. Applied 1, 044006 (2014).
22. Verba, R., Tyberkevych, V. & Slavin, A. Excitation of propagating spin waves in an in-plane magnetized ferromagnetic strip by voltage-controlled magnetic anisotropy. in Magnetics Conference (INTERMAG) 2015, IEEE, doi:10.1109/INTMAG.2015.7157010. 23. L’vov, V. S. Wave Turbulence Under Parametric Excitation (Springer-Verlag, New York, 1994).
24. Zautkin, V. V., Zakharov, V. E., L’vov, V. S., Musher, S. L. & Starobinets, S. S. Parallel spin-wave pumping in yttrium garnet single crystals. Sov. Phys. JETP 62, 1782 (1972).
25. Zakharov, V., L’vov, V. & Starobinets, S. Spin-wave turbulence beyond the parametric excitation threshold. Sov. Phys. Usp. 18, 896 (1975).
26. Heinrich, B. & Cochran, J. F. Ultrathin metallic magnetic films: magnetic anisotropies and exchange interactions. Adv. in Phys. 42, 523 (1993).
27. Yang, H. X. et al. First-principles investigation of the very large perpendicular magnetic anisotropy at Fe|MgO and Co|MgO interfaces. Phys. Rev. B 84, 054401 (2011).
28. Brächer, T. et al. Mode selective parametric excitation of spin waves in a Ni81Fe19 microstripe. Appl. Phys. Lett. 99, 162501 (2011). 29. Bloembergen, N. Nonlinear optics (Addison-Wesley Pub. Co., 1965).
30. Kalinikos, B. A. & Kostylev, M. P. Parametric amplification of spin wave envelope solitons in ferromagnetic films by parallel pumping. IEEE Trans. Mag. 33, 3445 (1997).
31. Melkov, G. A., Serga, A. A., Tiberkevich, V. S., Kobljanskij, Y. V. & Slavin, A. N. Nonadiabatic interaction of a propagating wave packet with localized parametric pumping. Phys. Rev. E 63, 066607 (2001).
32. Krivosik, P. & Patton, C. E. Hamiltonian formulation of nonlinear spin-wave dynamics: Theory and applications. Phys. Rev. B 82, 184428 (2010).
33. Lopez-Diaz, L. et al. Micromagnetic simulations using graphics processing units. J. Phys. D: Appl. Phys. 45, 323001 (2012). 34. Giordano, A., Finocchio, G., Torres, L., Carpentieri, M. & Azzerboni, B. Semi-implicit integration scheme for
Landau–Lifshitz–Gilbert-Slonczewski equation. J. Appl. Phys. 111, 07D112 (2012).
Acknowledgements
We acknowledge the Center for NanoFerroic Devices (CNFD) and the Nanoelectronics Research Initiative(NRI) for the partial support of this work. The work was also supported in part by the National Science Foundation of the USA (grants Nos. ECCS-1305586, DMR-1015175), by the MTO/MESO grant N66001-11-1-4114 from DARPA, and by contracts from the U.S. Army TARDEC, RDECOM. The work of M.C. and G.F. was supported by the project PRIN2010ECA8P3 from Italian MIUR.
Author Contributions
M.C. and G.F. planned and performed micromagnetic simulations. R.V., V.T. and A.S. developed theoretical model. All authors analyzed the data and co-wrote the paper.