9 - 11 November 2008, Roma, Italy
Estimating projects duration in uncertain environments: Monte Carlo simulations strike
back
Stefania Tattoni
11. Introduction
, Massimiliano M. Schiraldi
(“Tor Vergata” University of Rome, Dept. of Enterprise Engineering, Via del Politecnico, 1 – 00133 Rome, Italy)
Luigi Laura
(“Sapienza” University of Rome, Dept. of Computer Science, Via Ariosto, 25 - 00185 Rome, Italy)
Abstract
PERT (Program Evaluation and Review Technique), developed in the 1950’s, represented the first attempt to incorporate uncertainty in project scheduling. Despite some weaknesses, it is still widely used in project management mostly thanks to the simplicity of its algorithm in operating on activity network diagrams. Today the increasing complexity of projects requires new techniques and the increasing availability of computer power have not brought project simulation into common usage as expected. Although several reviews assert that simulative approach has already superseded PERT when coping with uncertain environment; the reason why it is not diffused is that simulations require a too long computing time. In this paper we show through an algorithm and experimental results that the computational time, historically the major drawback of Monte Carlo simulations, is definitely minimum thanks also to the computational power available nowadays. We present results of an efficient program made of few lines of code and able to compute the completion time of a network activity diagram with 100.000 activities and about 50.000.000 precedence constraints between them.
Keywords
Stochastic networks duration, large scale dataset, PERT, Monte Carlo, simulation, computing time.
Nowadays the globalization and the innovation technology have changed the competitive environment, making the focus on client fundamental, rendering the internal flexibility the most important response to the new threats and opportunities. These reasons have made project management concepts spread to several industries together with the importance of multidisciplinary. In this context, where the turbulence and the shortest time to market rule, manage a project without project management means to not respect a budget or due dates. While on a hand the growing adoption of project management concepts by industries let increase the use of analytical procedures, on the other hand the increasing complexity of projects and uncertainty in estimating activity duration, makes difficult to determine with accuracy projects completion time. PERT was the first technique which considered uncertainty in project networks, although it is currently applied for several kind of projects and it is the most diffused, some weaknesses are hidden in its assumptions, Mac Crimmon & Ryavec (1964) considered them on two separate levels; the level of the individual activities (the mean, standard deviation, and distribution of each activity) and the level of the whole network (the calculation of a network mean and standard deviation). The simulation techniques have proved to be a powerful addition to the project analysis toolbox, because their results are more accurate than ones given by PERT. In literature we have several reviews of simulation applied to stochastic networks and the most important are the following: Monte Carlo method, PERT-path technique and the Conditional Monte Carlo. Monte Carlo solution can be used to solve PERT networks accurately and to gain estimates for quantities not obtainable from the standard approach thanks to the use of the Central Limit Theorem. Conditional Monte Carlo technique add an intermediate step in the Monte Carlo method which consists into reducing networks to derive an equivalent network which can be further analyzed by simulation method. The PERT-path technique, using the same information of PERT allows to analyze the possible evolution of the completion time taking into account all projects activities and not only those belonging to the critical path. Even if it has been demonstrated by more accurate estimates of time completion that these methods are more effective than PERT, do not exist any new consolidated standard. Aim of this paper will be to show that a simple and careful implementation of Monte Carlo simulation requires short computing time.
2. Literature review
An activity network is a directed acyclic network where the arc lengths typically represent times to complete tasks that are part of a larger project. The completion time of all the activities on a j-th path is a random variable
X
j, where j P i i jT
X
. (1)1 Corrisponding author Email addresses: [email protected] (Laura L.), [email protected]t (Schiraldi M.), [email protected]
(Tattoni S.) “Tor Vergata” University of Rome, Dept. of Enterprise Engineering, Via del Politecnico, 1 – 00133 Rome (Italy), ph +39.06.7259.7803
9 - 11 November 2008, Roma, Italy
The network represents the precedence relations among the tasks so that the length of the longest (critical) path through the network is the time to complete the project which can be described also by the aim to find the c.d.f. (cumulative distribution function) of a random variable of the critical path, expressed by the equation:
j m
j
X
T
max
1,2,..., . (2)The solution of this problem has given by solving the following multivariate integral: t x n i i i T j
t
dF
t
F
1...
i
1
,
2
,...,
m
(3) where j P i i jt
x
.Of primary interest for researchers has been the estimations of expected value, of distribution of the project completion time and the probability that a given arc will be on the critical path (arc criticality). In literature the techniques used for evaluating these estimates followed three different approaches: analytic, approximated and simulative.
The analytic approach was based on the assumption that it is easiest to use simple forms of dFi ti and to presuppose special networks in which (3) can be solved dividing it in a series of singlevariate integrals. Martin (1965), studied the case of polynomial arc density functions. Other analytic approaches (Charnes, A., Cooper, W. W., Thompson, G. L., 1964 and Robillard, P., Trahan, M., 1977) focused their attention primarily on the project completion time.
The approximated approach, where the durations of individual activities are normally and independently distributed to involve the manipulation of distribution parameters (Sculli, D., 1983), has the great disadvantage to not evaluate the level of the estimates approximations of the single activities even if Clark C. E. (1960) has approximated the function (2).
Van Slyke (1963) was one of the first researchers to use Monte Carlo simulation to evaluate the project completion time and arc criticalities. Simulative approach is the most diffused in literature and it is becoming the approved method (at least by researchers) for stochastic network analysis. The PRAM Guide (Simon et al, 1997) says that “The PERT technique has been superseded by the more powerful Monte Carlo simulation modeling supported by computer-based tools, and PERT is no longer considered to be a suitable risk analysis technique”.
Among these different approaches the last one is what gives the best results and on which the researchers have written more.
After straightforward simulation used by Van Slyke in 1963, recent research has been focused on improving the efficiency (both statistical and computational) of the simulation estimates. Burt and Garman (1971) use the idea of conditional sampling to reduce statistical variation when each path in the network has an arc unique on it. Dodin (1985) exploits special structure to simplify networks, also Fatemi Ghomi, S. M. T. and Rabbani, M., (2003) consider, from structural viewpoint, a mechanism based on graph theory which changes structure of network to series–parallel network with contraction of some arcs.
Nowadays a new method is going to be used: the PERT-path technique, Mummolo, (1997) and Potrandolfo (2000), based on the idea of project evolution, defined as a sequence of states (path) with the dates of transition between states and assuming that project activities are characterized by stochastic independence. In every paper based on simulation approach, it is discussed the estimate of completion time and the results are always better than the ones given by the traditional PERT technique; however until now the weakness of the simulation applied to the stochastic networks was the computing time required to generate random variables and statistics tests on the networks (Van Slyke, 1963).
This paper wants to show that simulative techniques can become a standard method used by project managers and analysts because it is simple to use and requires few seconds. In order to demonstrate this, results of 10.000 run, realized by a program able to do Monte Carlo simulations on networks with 100.000 activities about 50.000.000 edges, will be given.
However, there is an important flaw which cannot be considered in this work: the actions taken by the project manager to recover any project slippage are missed out of the model entirely (Williams, T. 2003).
3. Computing the simulations
In this section we describe a straightforward implementation of the Monte Carlo simulations; we will consider an
activity on node (AON) network diagram; each activity (i.e., each node) has an associated probability distribution
function. Note that if we want to deal with an activity on arc (AOA) network diagram the algorithm proposed, it can be easily adapted. The simulation can be divided into three steps:
1. Computing a Topological Order of the Network Diagram.
2. Computing the duration of each activity from the associated probability distribution function. 3. Computing the overall completion time.
Before detailing each of the above steps, it is important to note that the first one is a preprocessing step that needs to be computed once for each network diagram, while the second and third steps are the ones to be repeated at will (in
9 - 11 November 2008, Roma, Italy
all the experiments described in this paper, unless otherwise stated, we ran 10.000 simulations on each network diagram).
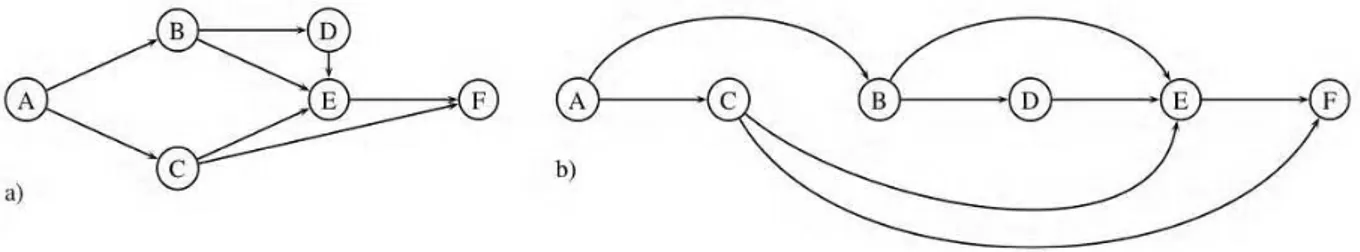
Step 1: computing a Topological Order of the Network Diagram. In Figure 1 it is possible to see a general
directed acyclic graph (a) and its topological order (b): we recall that a topological order of a graph is an ordering of the nodes in such a way that no node has an outgoing edge to a node that precede it. For more details on the computation of a topological order see the book of Cormen et al. (2001); if we denote with N the number of nodes (activities), and with M the number of edges (precedence constraints), the computational cost of this step is O(N+M).
Figure 1: a general directed acyclic graph (a) and its topological order (b)
Step 2: computing the duration of each activity from the associated probability distribution function. In this
step, for each activity (node), we generate a random value according to the parameters of the associated probability distribution function. We considered uniform, triangular, beta, gaussian and exponential distributions. That it is important to separate this step from the next one in order to exploit the locality principle in the code. The computational cost of this step is O(N (cost of random number generation)).
Step 3: computing the overall completion time. From the previous steps we achieved that 1) the nodes are sorted
in such a way there is no edge from a node to one of its predecessors, and 2) we computed the duration (i.e. we generated random values according to the associated distributions) of each activity. Now, to compute the overall completion time we simply need to compute, for each node (ordered by the topological order), which node amongst its predecessors is the latest ending one. The computational cost of this step is O(N+M).
In order to show that Monte Carlo simulations are nowadays a practical tool to estimate the overall completion time of a project, we implemented the above algorithms. We wrote the program in the Java programming language, which has the advantage of being easily portable between several operating systems and computer architectures. We used the Java Statistical Classes (JSC, freely available from the web address http://www.jsc.nildram.co.uk/) to generate random numbers according to several probability distributions. We run all our experiment on a normal notebook, an Apple MacBook Pro, with a 2.4 Ghz Intel Core Duo processor and 4Gb RAM. The operating system is MAC OS X Leopard (10.5.4). The code we developed is freely available, under the GPL license, from the web address http://impianti.ing.uniroma2.it/stefaniatattoni/ .
4. Experimental results
In this section we describe the experimental results. Since it is well known that the Monte Carlo simulation approach outperforms the PERT, here we focus only on the computational time that, historically, since the work of Van Sylke (1963) has been described as the major drawback of the Monte Carlo simulations. More specifically, we wants to emphasize that, with the computational power available nowadays, the Monte Carlo simulations are definitely a practical approach: we were able to compute, with a program made of few lines of (carefully designed) code, the latest completion time of a network activity diagram with 100.000 activities (nodes) and about 50.000.000 precedence constraints (edges) between them in about half a second on a common notebook; we can run more than 100 iterations per minute of a such huge network. If we move to more reasonably sized network diagrams, it took 15 seconds to compute 10.000 different simulations on a network made of 1.000 nodes and about 50.000 edges. We did not even exploit the dual core of the processor (i.e. we could halve the computation time by simply running two parallel experiments, one on each core). It is clear that, with this computation times, it is not even worth trying to design sophisticated approaches, like the one proposed by Burt and Garman (1971); note that also the PERT-path technique, of Mummolo (1997) and Potrandolfo (2000), is superseded by Monte Carlo simulations both in the accuracy of the results and in the computational time needed; furthermore the PERT-path technique scale with a factor n!, that makes it unfeasible for medium to large network diagrams.
9 - 11 November 2008, Roma, Italy
Figure 2: computational time (seconds) versus the number of nodes (x-axis).
In Figure 2 we plot the computational time as a function of the number of nodes, which varies from 1.000 to 10.000; the average outdegree (i.e. the number of outgoing edges) was 50, and therefore the number of edges ranged from 50.000 to 500.000. We recall that each point represents the time of 10.000 iterations on the same network diagram. It is interesting to notice that the shape of the plot is definitely linear. This is not the case of the plot shown in Figure 3, where the number of edges ranges from 1.000 to 10.000 with a constant number of nodes (2000); this is obtained by varying the average outdegree (from 10 to 100). Here the computational cost is almost constant. Together, these plots show that, in these experiments, the dominant cost is the random number generation, that is linear in the number of the nodes, and this explain the linear shape of Figure 2 and the (almost) constant aspect of Figure 3, where the number of nodes is fixed.
Figure 3: computational time (seconds) versus the number of edges (x-axis).
5. Conclusions
In this paper we showed that the Monte Carlo simulation approach, that is well known to be more accurate than PERT since the work of Van Sylke (1963), is nowadays no more a computationally “uncomfortable” technique: we showed that, with a simple and carefully written program, we are able to deal with massive scale networks (100k nodes, 50M edges) in less than a second on a normal notebook, and few seconds are sufficient to simulate 10 thousand times a large scale network (1k nodes, 50k edges). This confirms that Monte Carlo simulations now supersede other approaches like PERT-path technique, introduced by Mummolo (1997) and Potrandolfo (2000), and needs no sophisticated improvements, like the one proposed by Burt and Garman (1971), to be a practical and useful tool in project management.
9 - 11 November 2008, Roma, Italy
References
Burt, J. M., Garman, M. B., (1971), “Conditional Monte Carlo: a simulation technique for stochastic network analysis”, Management Science, Vol.18, No.8, pp.207-217.
Charnes, A., Cooper, W. W., Thompson, G. L., (1964), "Critical Path Analyses Via Chance Constrained and Stochastic Programming", Operations Research, Vol.12, pp.460-470.
Clark, C. E., (1961), "The Greatest of a Finite Set of Random Variables", Operations Research, Vol.9, No.2, pp.145-162.
Cormen, T. H., Leiserson, C.E., Rivest, R.L., and Stein, C., (2001), “Introduction to Algorithms” (second edition), MIT press.
Dodin, B. M., Elmaghraby, S. E., (1985), “Approximating the criticality indices of the activities in the PERT network”, Management Science, Vol.31, pp.207-223.
Fatemi Ghomi, S. M. T., Rabbani, M., (2003), “A new structural mechanism for reducibility of stochastic PERT networks”, European Journal of Operational Research, Vol.145, pp.394–402.
Mac Crimmon, C. A., Ryavec, K. R., (1964), "An Analytical Study of the PERT Assumptions”, Operations Research, Vol.12, No.1, pp.16-37.
Martin, J. J., (1965), "Distribution of the Time Through a Directed Acyclic Network", Operations Research, Vol.13, pp.46-66.
Mummolo, G., (1997), “Measuring uncertainty and criticality in network planning by PERT-path technique”, International Journal of Project Management, Vol.15, No.6, pp.377-387.
Pontrandolfo, P., (2000), “Project duration in stochastic networks by PERT-path technique”, International Journal of Project Management, Vol.18, pp.215-222.
Robillard, P., Trahan, M., (1977), “The Completion Time of PERT Networks”, Operations Research, Vol.25, No.1, pp.15-29.
Sculli, D., (1983), “The Completion Time of PERT Networks”, Journal of Operational Research Society, Vol.34, No.2, pp.155-158.
Van Slyke, R. M., (1963), “Monte Carlo Methods and PERT Problem”, Operations Research, Vol.11, No.5, pp.839-860.
Williams, T., (2003), “Why Monte-Carlo Simulations of Project Networks are Wrong”, Strathclyde Business School, Scotland, Glasgow.