University of Naples Federico II
Department of Civil, Architectural and
Environmental Engineering
PhD in Civil Systems Engineering
XXXI Cycle
Urban Coastal Systems and Coastal Flooding
A GIS-based tool for planning climate-sensitive cities
PhD candidate
Supervisor
Ing. Maria Rosa Tremiterra
Prof. Arch. Carmela Gargiulo
PhD Program Director
Prof. Ing. Andrea Papola
December 2018
To Who struggle every day to do what they believe in, To "Strangers" who gave me confidence and self-esteem, To Who sincerely believed and believe in me, To Eyes of me who know.
Table of contents
Section 1. The Research Project
1.1 Executive summary ... 9
1.2 Dissertation structure ... 11
References ... 12
Section 2. Coastal Cities and Coastal Floodings: a literature review 2.1 Introduction ... 13
2.2 Methodology of the literature review ... 16
2.3 Results and discussion ... 19
2.3.1 Analysis of indices’ parameters ... 21
2.3.2 Analysis of weighting and aggregation methods of vulnerability indices ... 26
2.3.3 Analysis of territorial scale of vulnerability indices ... 28
2.4 Conclusions ... 29
References ... 30
Section 3. Coastal Cities and Adaptation: strategies, plans and actions 3.1 Introduction ... 35
3.2 Methodology of case study analysis ... 36
3.3 Analysis of Adaptation Plans ... 37
3.3.1 New York ... 38 3.3.3 New Orleans ... 44 3.3.3 Boston ... 47 3.3.4 San Francisco ... 55 3.3.5 Rotterdam ... 57 3.3.6 Copenaghen ... 62
3.4 Results and discussion ... 64
3.5 Conclusions ... 70
References ... 72
Section 4. Methodology 4.1 Introduction ... 75
4.2 Construction of the Coastal Resilience Index ... 76
4.2.1 Definition of the Coastal Resilience Index... 76
4.2.2 Selection of urban indicators ... 77
4.2.3 Normalization techniques for the data ... 79
4.2.4 Aggregation and Weighting method of the CoRI ... 81
4.3 Definition of Urban Coastal Units ... 86
4.4 Definition of Classes of Urban Adaptation Actions ... 90
4.5 Definition of the GIS-based tool framework ... 94
4.6 Conclusions ... 96
Section 5. Results and Discussion
5.1 Introduction ... 103
5.2 Selection of the study area and collection of the relative data ... 103
5.2.1 Naples and the forecasted rising sea level ... 103
5.2.2 Description of the selected study area ... 110
5.3 Application of the GIS-based tool ... 112
5.3.1 Coastal Resilience Index ... 113
5.3.2 Urban Coastal Units ... 120
5.3.3 Urban Adaptation Actions ... 124
5.4 Discussion ... 128
5.5 Conclusions ... 130
References ... 131
Section 6. Conclusions 6.1 Conclusions ... 133
6.2 Limitations and further developments ... 135
List of Figures
Figure 1. Study areas of Resilience Neighbourhoods initiative 40
Figure 2. The Demonstration projects described by the Urban Water Plan 45
Figure 3. Focus Areas of the Boston strategy 51
Figure 4. Scheme of the inner-dike and outer-dike areas in Rotterdam 58
Figure 5. Six types of urban areas identified in the Rotterdam Strategy 62
Figure 6. Six types of urban areas identified in the Rotterdam Strategy 63
Figure 7. Relationship between distance from coastline and CoRI 81
Figure 8. Relationship between urban permeable surface and CoRI 81
Figure 9. Relationship between slope and CoRI 81
Figure 10. AHP pairwise positive reciprocal comparison matrix 82
Figure 11. Difference between the resolution of the Corine Land Cover (1) and the Urban
Atlas (2) 88
Figure 12. Scheme of the aggregation method for UCU definition 91
Figure 13. Relationships between urban subsystems' elements and Land Use, Land-Use
Intensity and Urban Form 92
Figure 14. Relationship among, CoRI levels, UCU and Urban Adaptation Actions 94
Figure 15. Design workflow of the GIS-based tool 96
Figure 16. Hypothesis of the coastline variations (dashed line) for the area between Parthenope and Neapolis in the period before the IV century BC at the late ancient age
(V-VI century AD) 105
Figure 17. Low Elevation Coastal Zones in Naples 106
Figure 18. Floodplains based on the studies by Kopp et al. (2014), Lambeck et al. (2011)
and Jevrejeva et al. (2016) 108
Figure 19. Map of the 100-years floodplain considering a 1-m sea level rise 109
Figure 20. Neighbourhoods of the study area 111
Figure 21. CoRI model tool in Model Builder 114
Figure 22. Interface of the model tool for calculating the G1 indicator 115
Figure 23. Maps of the CoRI's indicators 117
Figure 24. Map of the Coastal Resilience Index 119
Figure 25. Interface of the model tool for pre-processing Census Units 121
Figure 26. UCU model tool in Model Builder 121
Figure 27. Parameters for the identification of the Urban Coastal Units 122
Figure 30. Articulation of the study area in Urban Adaptation Actions classes 125
List of Tables
Table 1. Vulnerability indices selected for the review 18
Table 2. Studies of the coastal vulnerability indices categorized by vulnerability approach
and hazard driver 19
Table 3. Vulnerability indices categorized according to weighting and aggregation method 27
Table 4. Classification of vulnerability indices for territorial level 28
Table 5. Data collection of the analysed case studies 38
Table 6. Collection of layers, strategies and initiatives defined by the Boston strategy 48
Table 7. Urban characteristics introduced in the analysed adaptation strategies 65
Table 8. Adaptation measures classified for urban coastal subsystems 68
Table 9. Adaptation measures for types of urban coastal areas 70
Table 10. Selected urban characteristics 77
Table 11. Categorical classes for the varaibles of the urban characteristics 79
Table 12. Scale for pairwise comparisons 83
Table 13. Composition of the experts' panel 84
Table 14. CoRI indicators' weights 85
Table 15. The 20 classes provided by the Urban Atlas 89
Table 16. Benchmark values of the Land-Use Intensity indicators 90
Table 17. Connections between adaptation approaches and relationships among urban
subsystems 92
Table 18. Land area and LECZs' percentage distribution for neighbourhoods with LECZs 107
Table 19. Compilation of recent projections for sea level at 2100 (in m) for the RCP8.5 107
Table 20. Model parameters for mapping Coastal Resilience Index 115
Table 21. Model parameters for mapping Urban Coastal Units 120
Table 22. Model parameters for mapping Urban Adaptation Actions 125
Table 23. Percentage distribution of the Urban Adaptation Actions classes for Urban
Coastal Units 126
Table 24. Abacus of the Urban Adaptation Actions (in red the urban actions provided for
Section 1.
Executive summary
1.1 Executive summary
Climate change is one of the main future global challenges and in this context cities play a key role. If, on the one hand, cities cause climate change, then the other hand, they are the places where the impacts of climate change principally appear and affect the quality of life of its inhabitants.
In 2013, the "EU Strategy in adaptation to climate change" adopted by the European Commission (2013a) highlighted the importance of adaptation to climate impacts and has supported it through the promotion of initiatives on urban scale, including the Covenant of Mayors for Climate and Energy. In particular, among several topics, EU Strategy paid attention to the issue of the protection and adaptation of coastal areas. In fact, these areas are characterized by a higher concentration of buildings and people in comparison to inland areas. Therefore, these characteristics make coastal cities more vulnerable to the impacts of climate change. In particular, one of the forecasted impacts of climate change in these areas is the increase of coastal floods due to rising sea level and storm surges.
According to the Staff Working Document (SWD), named "Climate change adaptation, marine and coastal issues, attached to the EU Strategy", no-adaptation of coastal areas could cost an average of €25 billion per year to the European Union (European Commission, 2013b). Therefore, the implementation of strategies and actions for the adaptation of urban areas to the impacts of coastal flooding is essential for guaranteeing the liveability of coastal communities.
In this context, urban planning plays a key role in urban adaptation. However, even though the interest in this topic is increasing, operative support and tools for planning urban adaptation for cities are in short supply, especially for coastal cities. In light of this, it seems necessary to focus attention on the definition of new tools that can respond to the needs of urban planning. Moreover, the adoption of new technologies and the availability of new free data sources in urban planning can enhance the opportunity to support decision-making processes.
From the literature review, it arises that urban adaptation has been mainly based on the concept of vulnerability, so far. Indeed, several vulnerability indices have been developed for supporting decision makers in the adaptation of coastal areas to coastal floods, especially on the territorial level. However, the vulnerability concept concerns specific territorial and urban aspects, mainly geomorphological and social ones. Therefore, the use of vulnerability indices could not provide valid support for the definition of urban adaptation measures to implement in a coastal area from an urban planning perspective.
Maria Rosa Tremiterra
PhD thesis
10
Even the analysis of the urban practices (i.e. adaptation strategies/plans) highlights that a sectoral approach has been used for the definition of urban adaptation measures on the urban level. Indeed, due to the adoption of this approach, urban adaptation measures mainly refer to the physical features (buildings, infrastructure, etc.) of urban coastal areas.
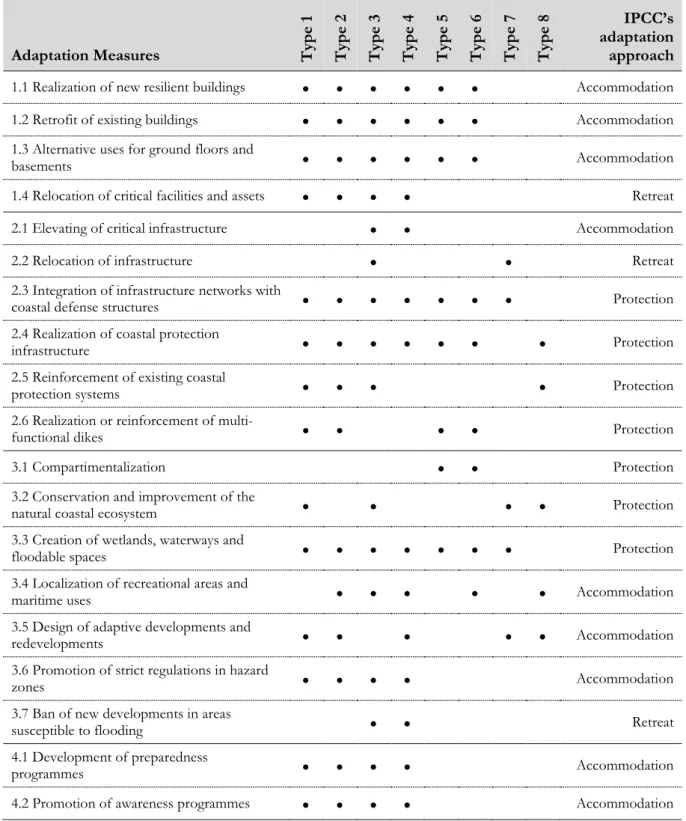
Based on these observations, the purpose of this research work has been to the develop a new decision support tool for increasing resilience of coastal cities. In particular, by using the main technological innovations applied to urban planning (in particular, the Geographic Information Systems), this tool aims to support the decision-making process through the definition of the urban measures for reducing the impacts of coastal flooding due to rising sea levels and storm surges. From an urban planning perspective, it was necessary to adopt a holistic-system approach. Therefore, according to McLoughlin (1969), the coastal city was interpreted as a system that is composed of four subsystems: socio-economic, physical, functional and geomorphological. For what concerns the development of the GIS-based tool, a four-phase methodology was defined. The first step was the definition and development of a new composite index for evaluating “urban coastal resilience” on the local level, named Coastal Resilience Index (or CoRI). It is the weighted linear combination of twelve urban variables, which were defined according to the holistic-system approach. Furthermore, in order to calculate the variables' weights, the Analytic Hierarchy Process (AHP), supported by the Delphi Method, was used. In particular, from the definition of the CoRI, it is highlighted that the geomorphological, physical and functional indicators play an important role in the definition of the composite index, while socio-economic variables influence the overall evaluation less than other ones. In the second step, since the urban adaptation measures should be defined in relation to physical and functional characteristics of the urban context, a classification of urban coastal areas was introduced, by specifying Urban Coastal Units (UCUs). According to this classification, the identified urban coastal typologies are six: Compact Urban Areas (e.g. historic centres), Mono-functional and Facility Urban Areas (e.g. harbours), Medium and low-density Residential Areas, Tourist Facility Areas, Potential Development Areas (e.g. brownfields), Natural Coastal Areas (e.g. wetlands). Considering the CoRI levels and the UCU classification, in the third phase, the four classes of Urban Adaptation Actions have been defined. Starting from the coastal adaptation approaches defined by the IPCC (Nicholls et al., 2007), a matrix that puts in relation the Urban Adaptation Actions classes with UCUs and CoRI levels has been developed. In particular, the definition of this matrix is based on a specific principle: “the higher CoRI the fewer are the Urban Adaptation Actions, and vice versa”. In relation to these three main phases and considering the potentialities of GIS applications in urban planning, in the last phase, a design workflow for developing the GIS-based tool was defined.
Urban Coastal Systems and Coastal Flooding
A GIS-based tool for planning climate-sensitive cities
Based on this workflow, the GIS-based tool was implemented and applied to a study area in the city of Naples. In particular, the identification of the potential coastal floodplains of Naples was useful for selecting the study area, localized in the eastern part of the city. Hence, the data input of the area chosen for the tool's implementation were collected. According to the methodology, the GIS-based tool was developed in three parts. In the first part, the Coastal Resilience Index Tools toolbox was implemented for mapping the CoRI of the study area. After that, the Urban Coastal Units Tools toolbox was constructed for the classification of the study area in UCUs. Finally, the CoRI and UCUs’ maps were used for identifying the four classes of Urban Adaptation Actions by the Urban Adaptation Actions Tools toolbox. From the application of the tool to the study area, the main findings were the following ones. About the CoRI map, the study area is characterized by the presence of urban areas with medium-low resilience levels (61% of the study area) and by the absence of urban areas with high resilience levels. About the UCU map, a high physical and functional complexity of the urban area and the absence of natural areas (or UCU 6) are noted. Regarding the Urban Adaptation Actions map, due to the absence of urban areas characterized by high resilience levels, all the UCUs need to enhance their resilience level through the implementation of fitting urban measures. In particular, in the majority of the area (about 61%), urban transformations should be addressed towards the realization/improvement of protection infrastructure systems, the use of resilient design standards at building scale and the reduction of land-use intensity through the delocalization of critical facilities in the proximity of the coastline. Finally, thanks to the use of open data sources, the developed tool could also be used in other urban coastal contexts. Furthermore, decision-makers could use it for both monitoring the resilience status of urban coastal areas, but also for programming and monetizing future urban transformations and evaluating the synergies among the different interventions on the territory in order to minimize the use of (economic) resources for their implementation.
1.2 Dissertation structure
The dissertation is structured into five sections. The first part provides a review of the main researches on this topic and, specifically, on the tools developed for urban adaptation and the analysis of the main urban adaptation measures, which are possible to implement in coastal cities to reduce the impacts of coastal flooding. In particular, Section 2 provides a review of the main coastal vulnerability indices in order to investigate which urban factors affect the response action of cities to coastal flooding and which are the main research gaps from an urban planning perspective. In order to study the relationships between urban coastal characteristics and the adaptation measures in depth, Section 3 illustrates the most innovative adaptation strategies/plans provided by six coastal cities. It also provides a framework on how urban adaptation measures are
Maria Rosa Tremiterra
PhD thesis
12
defined in relation to the urban characteristics of the coastal area where they should be implemented.
Based on the findings from the literature review and the analysis of urban adaptation strategies/plans, Section 4 introduces the research aim. In particular, in the section, the methodology developed for the development of the tool is illustrated. As such, the methodology is articulated into four phases: (1) definition of a new composite index for measuring the urban resilience of coastal cities; (2) classification of urban coastal areas in relation to their physical and functional characteristics; (3) definition of classes of urban adaptation measures; and, (4) definition of a design workflow for the implementation of the GIS-based tool.
In Section 5, the defined methodology is used to develop the GIS-based tool. In particular, the tool is applied to a coastal zone in the city of Naples (Italy). Hence, the obtained results are discussed in light of both the direct knowledge of the study area, as well as the developed methodology and the technical limitations of the developed tool.
Finally, Section 6 illustrates a summary of the main results obtained and provides some concluding remarks about the research works. Furthermore, the section highlights also the main limitations of the research work and introduces some potential directions for future research developments. Finally, Section 6 illustrates a summary of the main results obtained and provides some concluding remarks about this research. Furthermore, the section highlights the main limitations of the research work and introduces some potential directions for future research developments.
References
European Commission (2013a). An EU Strategy on adaptation to climate change (COM/2013/0216 final).
Retrieved from https://eur-lex.europa.eu/legal-content/EN/TXT/?uri=CELEX:52013DC0216 (Last Access 15th October 2018)
European Commission (2013b). Commission Staff Working Document. Climate change adaptation, coastal and marine
issues (SWD(2013) 133 final). Retrieved from
https://ec.europa.eu/clima/sites/clima/files/adaptation/what/docs/swd_2013_133_en.pdf (Last Access 15th October 2018)
McLoughlin, J.B. (1969). Urban and regional planning; a systems approach, New York, USA: Praeger. Retrieved
from http://documents.irevues.inist.fr/handle/2042/30156 (Last Access 15th October 2018)
Nicholls, R.J., Wong, P.P., Burkett, V.R., Codignotto, J.O., Hay, J.E., McLean, R.F., …, & Woodroffe, C.D. (2007). Coastal systems and low-lying areas. Climate change 2007: impacts, adaptation and vulnerability. In M.L. Parry, O.F. Canziani, J.P. Palutikof, P.J. van der Linden & C.E. Hanson (Eds.), Contribution of working group II to the fourth assessment report of the intergovernmental panel on climate change (pp.315-356). Cambridge, UK:
Cambridge University Press. Retrieved from
https://ro.uow.edu.au/cgi/viewcontent.cgi?referer=http://scholar.google.it/&httpsredir=1&article=119 2&context=scipapers (Last Access 12th September 2018)
Section 2.
Coastal Cities and Coastal Flooding:
a literature review
2.1 Introduction
Climate change is considered the major global challenge of this century. It is assuming an increasingly key role both at academic and institutional level. As highlighted in the last thirty years by the Intergovernmental Panel on Climate Change (IPCC), the increase of GHG emissions is causing a heating of the climate system with evident consequences on people, the environment, economic activities and on cities. In the last report on climate change, the IPCC developed four climate scenarios - the Representative Concentration Pathways (RCPs) - that are RCP2.6, RCP4.5, RCP6 and RCP8.5. Starting from the evaluation of a wide range of scientific and socio-economic data, such as population growth, GDP, land use, energy sources, etc., these scenarios identify GHG concentration trajectories and the future climate variability. However, their goal is not to “predict the future”, but to better understand uncertainties and alternative futures in order to take into account a range of possible effective decisions for a better management of climate impacts on Earth and human systems (Stocker et al., 2013). According to the four RCPs, it is possible to articulate the main climate variability into three main phenomena that are:
- increase of the global mean temperature that could vary in ranges of 0.3-1.7° C (RCP2.6) and 2.6-4.8° C (RCP8.5) by 2100;
- precipitation variability through an increase of annual mean precipitation at the high latitudes and equatorial areas and a decrease at mid-latitude and subtropical dry regions, and more intensity and frequency of extreme precipitation events at the mid-latitude lands; - rising sea levels in ranges of 0.26-0.55 m for RCP2.6 until 0.52-0.98 m for RCP8.5.
In this context, cities play a key role for climate action. Indeed, cities can be considered the most blameworthy with regards to climate change, since they emit 75% of all carbon dioxide from energy use (Edenhofer et al., 2014), that is one of the drivers of climate change. At the same time, due to the climate variability, extreme climate events are more frequent and hit mainly urbanized areas (Bai et al., 2018). However, thanks to the high concentration of human and economic capitals, cities represent the places where to organize a more effective answer for fighting climate change (Kousky & Schneider, 2003; Rosenzweig et al., 2010; Reckien et al., 2018).
Therefore, researchers and urban planners have started to increase their interest in the analysis of climate change and its impact on the city. In particular, the fight against climate change has been tackled in accordance with two strategies: mitigation1, which is focused on the climate change
1The IPCC defines “mitigation” (of climate change) as “a human intervention to reduce the sources or enhance the sinks of greenhouse gases (GHGs)”, and “[human interventions] to reduce the sources of other substances which may contribute directly
Maria Rosa Tremiterra
PhD thesis
14
drivers, and adaptation2, which concerns the impacts of climate change. In the beginning, urban
studies were addressed to the first strategy. Indeed, also thanks to the pushing effect of the Rio Agreements (1992) and the Kyoto Protocol (1997), urban studies were mainly focused on the analysis of relationships between urban characteristics and drivers of global GHG emissions in order to identify the most suitable urban solutions to implement.
Nevertheless, when it was clear that despite mitigation the impacts of climate change would have increased due to delayed effects of the preceding GHG emissions, researchers also started to analyse the relationships between urban characteristics and climate impacts on the city according to the adaptation concept. In particular, urban planning research has focused mainly on the relationship between urbanized areas and increases in temperature at local level (urban heat island), as highlighted by the several reviews of the topic (e.g. Berardi et al., 2014; Lo & Quattrochi, 2003), as well as the impacts of increased intensity and frequency of precipitation in cities (Huong & Pathirana, 2013).
Instead, the effects of rising sea levels and, in general, coastal flooding in urban areas have not been deeply investigated thus far. In comparison to the other climate effects, coastal flooding represents a serious risk for cities (Conticelli & Tondelli, 2018). Major cities, indeed, are settled on low-lying coastal areas (Nicholls, 2004) and about two-thirds of the world’s major cities are located in these zones (McGranahan et al., 2007). Because of their high accessibility and the presence of several resources, besides high population density, these areas are characterized also by a high concentration of socio-economic activities. According to some studies (i.e. Jongman et al., 2012; Neumann et al., 2015), it estimates that population and economic activities in these areas will go on to increase in the future. In light of this, because of these factors, in the future these areas are particularly threatened by forthcoming coastal flooding due to both the forecasted rise in sea levels, as well as storm surges. While coastal flooding due to rising sea levels may cause permanent land losses, storm surges can cause more damage in low-lying areas (Kaiser, 2006). Moreover, the forecatsed rise in sea levels will contribute to increase the coastal flooding impacts due to storm surges (Wahl, 2007). Nicholls (2004) estimates that the number of people who will experience flooding will increase 6 times and 14 times given a 0.5- and 1.0-m rise in global levels, respectively. In this sense, adaptation planning of coastal cities for reducing externalities due to coastal flooding gains a strategic meaning for the future liveability and quality of life in these zones (Hunt & Watkiss,
or indirectly to limiting climate change, including, for example, the reduction of particulate matter emissions that can directly alter is the radiation balance (e.g., black carbon) or measures that control emissions of carbon monoxide, nitrogen oxides, Volatile Organic Compounds and other pollutants that can alter the concentration of tropospheric ozone which has an indirect effect on the climate”.
2 According to IPCC (2014), “adaptation” is “the process of adjustment to actual or expected climate and its effects. In human systems, adaptation seeks to moderate or avoid harm or exploit beneficial opportunities. In some natural systems, human intervention may facilitate adjustment to expected climate and its effects”.
Urban Coastal Systems and Coastal Flooding
A GIS-based tool for planning climate-sensitive cities
2011). However, as highlighted by Hurlimann et al. (2014), urban planning has yet to face a more complex challenge for the adaptation of urban coastal areas since its aim will be to take into account the urban needs of growth, equity and sustainability despite a lack of habitable land.
Until now, the literature concerning the urban adaptation to coastal flooding has been interpreted from an economic point of view by evaluating the convenience of limited adaptation options (including protection infrastructure, land use changes or retreatment) (Hinkel & Klein, 2007; Nicholls et al., 2007; Vafeidis et al., 2008). Over the last thirty years, several indices were developed to assess the vulnerability of coastal systems to natural hazards, including coastal flooding. Indeed, the use of vulnerability indices is one of the possible “means” for understanding possible risks and defining the relative adaptation strategies and measures (Carter et al., 2015).
According to Füssel (2007), there are two main approaches for the development of adaptation to climate change impacts and they are based on the concepts of hazard and vulnerability. On one hand, the adaptation developed according to the hazard-based approach is mainly focused on the use of climate models and does not consider non-climatic factors, in particular social and economic aspects. The vulnerability-based approach, indeed, has a strong focus on the social factors and it can be useful in absence of reliable impact projections (Füssel, 2007). In relation to their characteristics, these two approaches can be considered complementary, even if the most common approach used for the urban adaptation is the vulnerability-based one, which takes into account several factors for reducing the climate risks. In order to face the climate challenge in a more effective way, in recent years the “resilience” concept has been associated to adaptation (Leichenko, 2011; Carter et al., 2015). Although the use of the term resilience has increased, the description of what it means is often lacking. Resilience can be defined as “the capacity of social, economic and environmental systems to cope with a hazardous event or trend or disturbance, responding or reorganizing in ways that maintain their essential function, identity and structure, while also maintaining the capacity for adaptation, learning and transformation” (Mach et al., 2014). According to Joakim et al. (2015), resilience has several points of contact with vulnerability and both can be considered useful for framing adaptation. In relation with coastal cities, their adaptation is still based on the vulnerability concept and its assessment of these areas. In this way, coastal vulnerability assessments enable one to identify which vulnerability factors influence adaptation response. With regards to resilience, this concept is mainly taken into account for the identification of adaptation solutions (see Section 3).
With regard to the vulnerability assessment, several tools were developed, including Decision Support Systems (DIVA by DINAS COAST Consortium, 2006), spatial mappings, etc. In particular, among the vulnerability assessment tools, the vulnerability indicators and indices are the most widely used. As highlighted by some authors (i.e. McLaughlin & Cooper, 2010), vulnerability
Maria Rosa Tremiterra
PhD thesis
16
indices aim to simplify a number of complex and interacting parameters to a synthetic form that is more readily understood. Therefore, vulnerability indices have a great utility as management tools. In particular, the parameters defined by each index allows one to identify which characteristics affect mainly the “coastal vulnerability”. However, vulnerability indices have a restricted use in urban planning due both to their purpose not always being suitable with the urban practice, but also for the territorial scale to which they refer. In this sense, as well as providing an interesting picture of how the "coastal vulnerability" topic has evolved, the analysis of these indices represents an interesting knowledge basis for developing new decision-making tools in urban planning in order to support the adaptation of urban coastal areas to storm-surge flooding events.
In this sense, starting from the complexity of urban coastal systems and the uncertainty of future climate impacts, this section provides a review of the main coastal vulnerability indices in order to investigate which urban factors affect the response action of cities to coastal flooding and which are the main research gaps from an urban planning perspective.
This section is structured as follows: paragraph 2.2 presents the methodology used for the review; paragraph 2.3 describes the analysis conducted on the selected studies according to the methodology; finally, paragraph 2.4 illustrates the main findings of the literature review and lists the main research gaps of the topic in the field of urban planning.
2.2 Methodology of the literature review
Nowadays, in the literature several studies are focused on the definition of methodologies and tools for assessing the coastal vulnerability. An interesting review about it can be find in Nguyen et al. (2016). Despite the high amount of indices in the literature, there seems to be no comprehensive vision of which urban factors can affect the vulnerability and, therefore, the response capacity of urban coastal systems in case of coastal flooding. In order to understand this topic more deeply, it is necessary to take into account the complexity of urban coastal systems. Indeed, coastal cities are characterized by the complexity and dynamism of both urban systems (Batty, 2008; Papa, 2009) and coastal systems (Balica et al., 2012; Hopkins et al., 2011; Nicholls et al., 2007). In general, due to their numerous interactions (including, land-sea interaction) and overlapping scales, coastal zones can be considered examples of stressed complex systems. In particular, since urban areas settled along coastline produce an abnormal burden on the surroundings natural systems, the study of these areas on a local scale could offer “an experimental microcosm” for the development of methods for improving sustainability in strongly open systems (Hopkins et al., 2011), among which it is also possible to consider coastal cities.
Urban Coastal Systems and Coastal Flooding
A GIS-based tool for planning climate-sensitive cities
Therefore, adopting an urban system perspective for the study of coastal cities could allow the consideration for not only its double nature system, but also all those elements that influence this system and continue to operate it even if subjected to shocks or stresses (da Silva et al., 2012). Based on these considerations, this review combines the developed vulnerability indices in order to investigate which are the most relevant coastal characteristics that can have implications on an urban scale. Using a holistic-system approach, in the review the characteristics of each coastal vulnerability index were classified into four categories that are: (i) socio-economic characteristics; (ii) physical characteristics; (iii) functional characteristics; and, (iv) geomorphological characteristics. Such classification is inspired by the General System Theory by von Bertalanffy (1969) applied to the study of urban phenomena (Gargiulo & Papa, 1993). In particular, each group of characteristics reflect one of the four urban subsystems, which composes the overall urban subsystem (Papa, 2009): socio-economic-subsystem; physical subsystem; functional subsystem; and, geomorphological subsystem. In particular, socio-economic characteristics refer to inhabitants and people that conduct activities in the area including all the factors that describe both social and economic aspects of the system.
The second category of physical characteristics include all the elements that compose the built environment (buildings, open spaces, etc.) which are accommodated in order to host all the different types of human activities. Functional characteristics refer to those variables that describe the type, the scale and the localization of urban activities on the territory in order to also guarantee their accessibility. Finally, the last category –geomorphological characteristics – includes all the factors that allow describing geographic aspects of the system.
In this review, according to this approach, the most widespread and used vulnerability indices for coastal areas were analysed. In particular, starting from a research on the Scopus database, several vulnerability indices were detected. The majority of these indices represent an adaptation of already existing vulnerability indices. Those indices are applied and/or adapted to different territorial contexts in comparison with the original application. Therefore, this review is focused on the analysis of a selection among the detected vulnerability indices. In detail, they were chosen among ones that are the main references used for the development of other vulnerability indices in the literature (Table 1).
After their selection, each index was analysed according to the following criteria: (i) analysis of indices’ parameters according to the aforementioned approach; (ii) analysis of the weighting and aggregation method of parameters; and, (iii) analysis of the territorial scale of interest. Since this study is focused on analysing the relationships between coastal cities and coastal flooding, the analysed coastal vulnerability indices have been further classified with respect to the vulnerability approach and according to the hazard driver of coastal flooding.
Maria Rosa Tremiterra
PhD thesis
18
Index Name Authors
Coastal Vulnerability Index (CVI) Gornitz et al., 1991
Sensitivity Index (SI) Shaw et al., 1998
Coastal Vulnerability Index (CVI) Thieler & Hammar-Klose, 1999
N.A. Wu et al., 2002
Social Vulnerability Index (SoVI) Cutter et al., 2003
Place Vulnerability Index (PVI) Boruff et al., 2005
N.A. Kleinosky et al., 2007
N.A. Preston et al., 2008
Coastal Sensitivity Index (CSI) Abuodha & Woodroffe, 2010 Coastal Vulnerability Index (CVI) McLaughlin & Cooper, 2010
N.A. Tate et al., 2010
Coastal Vulnerability Index (CVI) Li & Li, 2011 Coastal City Flood Vulnerability Index (CFFVI) Balica et al., 2012 Coastal Sensitivity Index (CSI) Karymbalis et al., 2012 Social Vulnerability Index (SoVI) Guillard-Gonclaves et al., 2014 Socio-Environmental Vulnerability Index for a Coastal Areas (SEVICA) Zanetti et al., 2016
Table 1. Vulnerability indices selected for the review
Moreover, this study is dealt with from an urban planning perspective. Hence, in this review the climate variables taken into account in the vulnerability indices have been excluded from the analysis.
According to Wu et al. (2002) and Zanetti et al. (2016), it is possible to distinguish three main approaches to vulnerability. The first one – named geophysical-vulnerability approach - identifies vulnerability with the exposure to a hazard. Therefore, vulnerability is assessed by the measurement of physical and geomorphological variables, (e.g. proximity to the source of hazard, incident frequency/probability, magnitude, etc.).
The second perspective – named social-vulnerability approach - is focused on potential coping ability of individuals and communities. In this case, social features assume a key role in the definition of vulnerability. Finally, based on the model by Cutter et al. (2000), the last approach integrates the previous ones. It is known as place-vulnerability (or socio-environmental) approach and considers both geomorphological and social characteristics that can influence the vulnerability of a geographic context. A further interpretation based on this last approach is the concept of "contextual vulnerability" by O'Brien et al. (2007), and takes into account not only the biophysical and socio-economic conditions but also the political and institutional ones, in the context of where to operate.
Urban Coastal Systems and Coastal Flooding
A GIS-based tool for planning climate-sensitive cities
Since the analysed indices do not consider the same coastal hazard, another classification of studies is introduced. In general, it is possible to distinguish coastal flooding in relation to two main drivers, storm surges that are episodic inundation events, and rising sea levels that can cause a permanent inundation of coastal areas. Actually, these drivers are interconnected since the forecasted rising sea levels inevitably increase the frequency and intensity of storm surges, and, consequently, of coastal flooding. In light of this, the selected indices are classified into three groups, referring to coastal flooding due to (i) sea-level rise, (ii) storm surges and (iii) both drivers.
In Table 2, the analysed indices are classified according the three vulnerability approaches and the hazard drivers of coastal flooding.
Hazard Driver Sea-Level Rise Storm Surges Sea-Level Rise and Storm Surges Vulnerability
Approach
Geophysical
Karymbalis et al., 2012 Gornitz et al., 1991
Shaw et al., 1998 Thieler & Hammar-Klose,
1999
Abuodha & Woodroffe, 2010 Social Cutter et al., 2003 Guillard-Gonçalves et al., 2014 Tate et al., 2010 Socio-environmental
Zanetti et al., 2016 Li & Li, 2011 Wu et al., 2002 Boruff et al., 2005 Kleinosky et al., 2007
Preston et al., 2008 McLaughlin & Cooper,
2010 Balica et al., 2012
Table 2. Studies of the coastal vulnerability indices categorized by vulnerability approach and hazard driver
2.3 Results and discussion
Before describing the review results carried out on the coastal vulnerability indices, it is useful to highlight how the analysed studies define the vulnerability concept, and which definition of vulnerability they adopt. The definition of vulnerability, indeed, has meaningful implications for the structure of the indices. Therefore, it is necessary to understand this aspect more deeply.
Maria Rosa Tremiterra
PhD thesis
20
An interesting analysis can be carried out starting from the three vulnerability approaches aforementioned. In particular, in relation to the geophysical approach, it is noted that the concept of sensitivity is replaced by one of vulnerability in some cases (i.e. Abuodha & Woodroffe, 2010; Karymbalis et al., 2012; Shaw et al., 1998). Sensitivity specifically refers to the susceptibility of coastal areas to seaward hazards, in particular to the action of rising sea levels. The use of the sensitivity concept is useful in distinguishing the aim of the index, since vulnerability-based assessments concern the socio-economic factors of coastal areas, while sensitivity-based ones on the geophysical ones (Abuodha & Woodroffe, 2010). Other researches (i.e. Gornitz et al., 1991; Thieler & Hammar-Klose, 1999) do not consider a specific vulnerability concept, even if vulnerability assessment can be related to the identification of coastal areas at risk to future sea-level changes.
With regard to the socio-vulnerability approach, Cutter et al. (2003) examined it in depth. In particular, they define the social vulnerability as “a multidimensional concept that helps to identify those characteristics and experiences of communities (and individuals) that enable them to respond to and recover from environmental hazards”. According to this definition, since the definition of social vulnerability is
independent from the geography of areas and from the type of hazard, it was applied for different purposes and to different territorial contexts, including coastal areas (i.e. Guillard-Gonçalves et al., 2014; Tate et al., 2010).
Regarding the approach based on the socio-economic vulnerability, with the exception of the studies by Wu et al. (2002) and Zanetti et al. (2016), the analysed research focus their attention on the definition of coastal vulnerability with respect to specific hazards (for example, storms, climate change, etc.). Such a definition, indeed, provides a sound conceptual reference for the construction of the vulnerability indices of coastal areas. In particular, Preston et al. (2008) introduces a definition of coastal vulnerability to climate change. In detail, it is defined as a function of changes in sea levels combined with the inherent variability of dynamic coastlines caused by tidal ranges and weather patterns. In particular, according to IPCC’s 2001 definition (McCarthy et al., 2001), the coastal vulnerability model is characterized by three factors, exposure, sensitivity, and adaptive capacity.
While exposure is driven by interactions between the climate system and the coastal topography, sensitivity is a function of assets and infrastructure within the area. Finally, adaptive capacity depends on material and social capitals. In addition, Kleinosky et al. (2007) adopt the same definition and state that assessing vulnerability means exterminating a “system” under stress and its ability to respond to such stress. Balica et al. (2012) also consider a systemic approach. In particular, in their study vulnerability is defined as “the extent of harm” and is a function not only of exposure but also of susceptibility and resilience in comparison to the IPCC’s definition.
Urban Coastal Systems and Coastal Flooding
A GIS-based tool for planning climate-sensitive cities
McLaughlin & Cooper (2010) define coastal vulnerability as a function of three components that are coastal characteristics, coastal forcing and socio-economic factors. In particular, coastal characteristics represent the physical nature of the coast, while coastal forcing expresses the frequency and magnitude of perturbation. Finally, the last component refers to the degree of impact on human activities due to coastal morphological changes. Concerning storm surges, Li & Li (2011) propose a definition of coastal vulnerability as the “capacity to be wounded”; the degree to which a
system is likely to experience harm due to exposure to storm surges. From this definition, it arises that the study assumes a systemic approach to the vulnerability assessment, taking into account five components: socio-economic, land use, eco-environmental, coastal construction and disaster-bearing capability.
As aforementioned, Wu et al. (2002) and Zanetti et al. (2016) do not consider a specific definition of vulnerability. However, they state to adopt a socio-environmental-vulnerability approach. In particular, while Zanetti et al. (2016) try to provide an integrated perspective to vulnerability studies in relation to rising sea levels, Wu et al. (2002) combine physical and social vulnerability for understanding how the overall vulnerability of a coastal area may change in relation to the future coastal flooding intensified by climate change.
2.3.1 Analysis of indices’ parameters
According to the aforementioned approach, characteristics that vulnerability indices take into account can be articulated into four categories - socio-economic, physical, functional and geomorphological.
Socio-economic characteristics
Except for geophysical vulnerability indices, in general, coastal vulnerability indices take into account socio-economic characteristics of coastal communities. As aforementioned, for a long time, the vulnerability assessment has been interpreted from a socio-economic perspective. Despite the vulnerability indices currently being developed by adopting a greater integration between geophysical and social components of coastal areas, socio-economic characteristics are numerous and they play a key role in the definition of vulnerability indices.
The basic parameters for measuring the socio-economic characteristics of coastal areas are total population (i.e. Balica et al., 2012; McLaughlin & Cooper, 2010; Wu et al., 2002) and population density (i.e. Li & Li, 2011; Preston et al., 2008). In particular, according to Zanetti et al. (2016), a higher population density corresponds to a higher level of vulnerability in the area. High population density, naturally, complicates evacuation during a hazard (Cutter et al., 2003). A similar parameter to population density is future population growth. Measuring population growth enables the
Maria Rosa Tremiterra
PhD thesis
22
consideration and magnitude of future challenges for coastal management and hazard mitigation (Preston et al., 2008). However, the most common socio-economic characteristics that vulnerability indices take into account refer to other population structure features, in particular, age, ethnicity, education and gender.
The analysed study considers the population age as a characteristic that highly influences the vulnerability of coastal areas. According to Cutter et al., (2003), young and old people may have mobility issues during a hazardous event and may affect the movement of other people out of harm's way. However, even if children and elders are considered the most vulnerable part in a population, the researchers do not agree on which are the most exposed age groups to hazard. In detail, the vulnerable elderly population varies between over 60 (Wu et al., 2002; Zanetti et al., 2016) and over 65 (Balica et al., 2012; Boruff et al., 2005; Cutter et al., 2003; Guillard-Gonçalves et al., 2014) years old, while the young population varies between under 5 (Boruff et al., 2005; Cutter et al., 2003; Zanetti et al., 2016) and under 12 years (Balica et al., 2012; Preston at al., 2008) until 18 years (Wu et al., 2002). Sometimes, in some studies (e.g. Kleinosky et al., 2007), the elderly population is associated or identified with people with disabilities or special needs, since this population category may find particular difficulties during disasters, especially during recovery. The presence of different races may negatively influence the vulnerability of a community because there are language and cultural barriers that reduce the effectiveness of awareness-and-preparedness policies to disaster, especially if these people live in areas at-risk (Cutter et al., 2003). However, according to some studies (i.e. Boruff et al., 2005; Cutter et al., 2003; Kleinosky et al., 2007) the age composition of a population affects the vulnerability of an area more than its ethnicity composition. The opportunity of preparing and informing people is strictly linked to their education level. If population is characterized by a high education level, it has more capacity to understand warning information and access to recovery information. In several studies (i.e. Boruff et al., 2005; Cutter et al., 2003; Guillard-Gonçalves et al., 2014) it arises that education levels do not seem to meaningfully influence the vulnerability levels of territory. On the other hand, Tate et al. (2010) highlight that education level is a factor that can positively influence the reduction of vulnerability levels. In some studies, another characteristic that can influence the vulnerability of a community is gender. In particular, this characteristic is taken into account in terms of gender differences among men and women. The female population, indeed, is considered more vulnerable than the male one. Despite being more responsible, especially in the family care, women tend to have lower incomes. However, not all studies agree on how and if such a characteristic can influence vulnerability assessment. In addition, while Guillard-Gonçalves et al. (2014) highlight that the female population influences vulnerability and is positively correlated to it, according to Cutter et al. (2003) it does not appear to be particularly significant.
Urban Coastal Systems and Coastal Flooding
A GIS-based tool for planning climate-sensitive cities
In addition to the characteristics of population structure, coastal vulnerability indices also pay particular attention to the economic characteristics of communities. In particular, considering the parameters of the analysed indices, it is possible to distinguish three types of characteristics: income, community wealth, and employment. The indices adopt several parameters for measuring the population income. Some of them refer to the ownership of a home (Preston et al., 2008) or its rent (Wu et al., 2002). They also consider the dependence of people to social services for survival (including, Cutter et al., 2003; Guillard-Gonçalves et al., 2014; Preston et al., 2008; Tate et al., 2010), as well as the population income (Cutter et al., 2003; Li & Li, 2011; Zanetti et al., 2016). As highlighted by Cutter et al. (2003) and Guillard-Conclaves et al. (2014), personal wealth negatively affects the overall vulnerability since it enables communities to better cope and recover from losses. Concerning the wealth characteristic, it refers to the gross value generated by economic activities that are located on the territory. It is mainly measured as output value per capita of a specific economic activity (i.e. agriculture, industry, commerce, etc.) (Li & Li, 2011; Preston et al., 2008). In particular, the most vulnerable economic activity in the case of natural hazards is agriculture, since it is strictly correlated to climate conditions (Cutter et al., 2003). Finally, employment (or occupation) is considered an important component of vulnerability in literature. In particular, as highlighted by Cutter et al. (2003) and Guillard-Concalves et al. (2014), even if these studies consider both percentages of the unemployed and employed within a population, the employed population is considered as the parameter, which principally affect vulnerability of a community, in particular, slowing the recovery phase from a disaster.
Physical characteristics
Among the analysed indices, physical characteristics of coastal areas are not always taken into consideration. In particular, considering the three approaches to vulnerability, indices based on social and socio-environmental vulnerability are much more focused on these aspects, while physical characteristics are completely absent in the definition of geophysical vulnerability (and sensitivity) indices. According to Preston et al. (2008), a great accumulation of buildings, infrastructure and wealth in close proximity to coastline corresponds to a greater risk of being affected by future seawards hazards, including coastal flooding. In this sense, a first characterization is to distinguish urban areas from rural areas. Some vulnerability indices introduce a land use variable that enables the identification of urbanized zones (i.e. McLaughlin & Cooper, 2010; Preston et al., 2008; Wu et al., 2002).
In order to measure the degree of urbanization, specific variables are considered in some pieces of research. For example, some vulnerability indices take into account the concentration (including Boruff et al., 2005; Wu et al., 2011) and the quality of housing units (Cutter et al., 2003;
Guillard-Maria Rosa Tremiterra
PhD thesis
24
Concalves et al., 2014; Tate et al., 2010) as variables. In particular, a lower housing quality corresponds to a higher vulnerability of analysed areas. Li & Li (2011) and Preston et al. (2008) introduce also road density as a physical variable that is associated with a greater degree of urbanization degree in coastal regions.
Besides the degree of urbanization in coastal areas, some of the analysed studies also consider the coastal protection degree provided by the presence of specific infrastructure. In particular, Li & Li (2011) identify specific variables that refer to tide-prevention engineering structures, including seawalls. Besides the presence of flood protection infrastructure along the coastline, Balica et al. (2012) introduce the density of drainage canals considering that a higher drainage density and presence of coastal protection infrastructure reduce the vulnerability of coastal areas.
Functional characteristics
As for the physical characteristics, also the functional ones are mainly considered by social and social-environmental vulnerability indices. In particular, from the analysis of vulnerability indices, it is possible to identify three main functional characteristics: the first one refers to land use type, the second one to the transport network, and the last one to the presence of critical facilities and public utilities in the area.
Concerning the land use type, many of the analysed studies shows that vulnerability assumes a different degree in relation to the activities established in the area. The analysis of the land use is based on an economic evaluation, since the damage to an economic activity can influence the economy of a community. In general, since several land-use types characterize cities, they represent the most vulnerable areas of coastal zones. In particular, according to Cutter et al. (2003) and Boruff et al. (2005), a higher presence of commercial establishments increases the social vulnerability, while Zanetti et al. (2016) consider industrial areas as the most vulnerable land-use type. Another aspect that can be linked to the land use of a coastal area is the presence of areas, especially natural ones, subjected to specific protection conditions that can increase coastal vulnerability at regional level (McLaughlin & Cooper, 2010; Preston et al., 2008).
Another characteristic that influence the coastal vulnerability is the presence of transport infrastructures. In detail, roads and railways can be considered as vital lines of communication and the main medium transport in a coastal area (Cutter et al., 2003; McLaughlin & Cooper, 2010). Therefore, transport infrastructure should be well located, in relation to its proximity to the coastline, to ensure that the right localization of this infrastructure allows an at-risk area to function even in the event of flooding and, thus, to reduce its vulnerability levels.
With regard to the last characteristic, some vulnerability indices also pay attention to the presence of specific urban functions on the territory. In particular, a high concentration of critical facilities
Urban Coastal Systems and Coastal Flooding
A GIS-based tool for planning climate-sensitive cities
and public utilities increases vulnerability levels in the area where these functions are localized. In particular, vulnerability indices take into account critical facilities that are useful for the emergency management. For example, Cutter et al. (2003), Guillard-Gonçalves et al. (2014) and Tate et al. (2010) identify only one type of critical facility, which is medical services, while Kleinosky et al. (2007) consider more categories of facilities (schools, fire and rescue stations, solid waste facilities, water treatment facilities, etc.). Besides these facilities, McLaughlin & Cooper (2010) impose cultural heritage as a factor that can affect negatively vulnerability levels in a coastal areas. However, unlike other facilities mentioned above, cultural heritage assumes an economic value that can be lost in the case of a coastal hazard.
Geomorphological characteristics
As well as socio-economic, geophysical characteristics are also a relevant component in the development of the coastal vulnerability indices. As aforementioned, for a long time coastal vulnerability has been quantified through variables related to the geophysical and geomorphological aspects of coastal areas and aggregated to climatic variables that measured the frequency and magnitude of a specific coastal hazard. However, since this analysis is carried out from an urban planning perspective, in these paragraphs the main geomorphological characteristics introduced in the geophysical and socio-environmental vulnerabilities indices will be analysed.
In most of the analysed indices, it is noted that geometric characteristics of coastal areas take on particular importance. Indeed, even though Gornitz et al. (1991) introduced the relief (or coastal elevation), subsequently this parameter has been replaced by the coastal slope, which is one of the most frequent parameters in the analysed indices, including Abuodha & Woodroffe, (2010), Karymbalis et al. (2012), Thieler & Hammar-Klose (1999) for the geophysical vulnerability indices, and Balica et al. (2012), Preston et al. (2008) and Zanetti et al. (2016) for the socio-environmental ones. In particular, all the studies agree that the lower the coastal slope is, the greater its vulnerability. However, they do not agree on the definition of specific reference values (or of a function) for measuring vulnerability in relation to this parameter. Furthermore, these considerations are also applicable to the elevation parameter.
An important role is also assumed by the coastal geomorphological and morphodynamic characteristics. In particular, unlike the socio-environmental vulnerability indices, sensitivity indices always take into account geomorphology. Since geomorphology is measured as a qualitative variable, all the researchers, except Shaw et al. (1998), agree that beaches are more vulnerable than rocky and cliffed coasts. Some indices also take into account the shoreline orientation (Abuodha & Woodroffe, 2010; McLaughlin & Cooper, 2010), while only sensitivity indices consider the shoreline change parameter that assumes values in a range from -1,0 (e.g. Shaw et al., 1998) to -2,0
Maria Rosa Tremiterra
PhD thesis
26
m/year (e.g. Abuodha & Woodroffe, 2010; Gornitz et al, 1991) of coastal erosion for high vulnerability. Furthermore, Gornitz et al. (1991) and Balica et al. (2012) identify two other parameters in relation to coastal morphodynamic characteristics related to shoreline vertical movement and soil subsidence respectively. Concerning the rock type, it refers to the geological characteristics of the coast and represents an important parameter for both sensitivity and vulnerability indices. As for the geomorphology, it is also expressed as a qualitative variable and the majority of analysed studies (i.e. Gornitz et al., 1991) agree that the most vulnerable kind of geological stratification is composed of fine unconsolidated sediments.
It is interesting to note that the socio-environmental vulnerability indices have introduced new parameters in comparison to the sensitivity indices. One of these is the distance to the coastline. In particular, a buffer distance from the coastline is set to identify the most vulnerable areas. This buffer is 500 m as a reference value for coastal vulnerability at the regional scale (McLaughlin & Cooper, 2010) and 10 m as a reference value at the local scale (Zanetti et al., 2016). Another parameter concerns the presence of rivers along the coastal area. In particular, the presence of water bodies can increase the vulnerability of coastal areas. In particular, McLaughlin & Cooper (2010) evaluate this aspect by adopting a dichotomous variable (absence/presence), while Zanetti et al. (2016) defines a reference value equal to a distance not over 10 m.
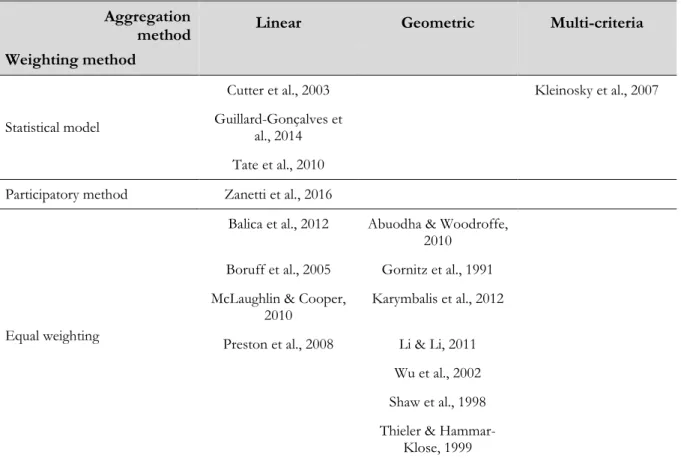
2.3.2 Analysis of weighting and aggregation methods of vulnerability indices
In relation to their theoretical framework, each vulnerability index adopts an aggregated and weighted method.
With regards to the weighting methods, they express the contribution and the relative importance of individual indicators/parameters in a system (Nguyen at al., 2016). One of the weighting techniques is to give the same weight to all the variables (equal weighting). It can be used if there is
an insufficient knowledge of the relationships among the variables. Applying this method, indeed, could generate an unbalanced structure in the composite index (JRC, 2008). Other techniques are derived from statistical models (e.g. factor analysis) or from participatory methods (e.g. Budget Allocation
Process or BAP). In particular, participatory methods are the most common since they are easy to carry out (Parker, 1991). One of the main used methods is the Analytic Hierarchy Process (AHP), a multi-attribute decision-making method developed by Thomas Saaty (1987). For each weighting method, it is possible to associate the most suitable aggregation method. In particular, there are three kinds of aggregation methods (JRC, 2008):
- linear aggregation: it is useful when all the indicators have the same measurement unit and it
Urban Coastal Systems and Coastal Flooding
A GIS-based tool for planning climate-sensitive cities
- geometric aggregation: it is used when the modeller wants “some degree of
non-compensability” (JRC, 2008) between indicators because this type of aggregation compensability is lower than the linear aggregation;
- the multi-criteria approach: it is a non-compensatory method and it permits a consideration of
the advantages (or disadvantages) for each indicator.
Generally, the linear method matches with all the weighting methods. While on the other hand, geometric methods cannot be used with some statistical models, such as the “benefit of the doubt” (BOD) approach. In the same way, the multi-criteria approach does not support the same weighting methods supported by the geometric method and, furthermore, some participatory methods, such as the AHP.
According to the aforementioned weighting and aggregation methods, analysed vulnerability indices were categorized as shown in Table 3. From their analysis, it highlights that the majority of them are aggregated using the geometric method, while socio-environmental ones use mainly an equal-weighted linear combination.
Aggregation
method Linear Geometric Multi-criteria
Weighting method Statistical model
Cutter et al., 2003 Kleinosky et al., 2007 Guillard-Gonçalves et
al., 2014 Tate et al., 2010 Participatory method Zanetti et al., 2016
Equal weighting
Balica et al., 2012 Abuodha & Woodroffe, 2010
Boruff et al., 2005 Gornitz et al., 1991 McLaughlin & Cooper,
2010 Karymbalis et al., 2012 Preston et al., 2008 Li & Li, 2011
Wu et al., 2002 Shaw et al., 1998 Thieler &
Hammar-Klose, 1999
Table 3. Vulnerability indices categorized according to weighting and aggregation method
On the contrary, the vulnerability indices provided by Kleinosky et al. (2007) and Zanetti et al. (2016) use different techniques in comparison to the other socio-environmental indices. Indeed, while Kleinosky et al. (2007) introduce the Pareto ranking technique for guaranteeing a correct
Maria Rosa Tremiterra
PhD thesis
28
combination of components obtained by PCA, Zanetti et al. (2016) combine parameters by using the weighted linear combination.
Finally, social vulnerability indices are developed by using statistical methods and, in particular, the Principal Component Analysis. The employment of this method can be explained by considering that such method warrant a reduction of several variables that are taken into account by social vulnerability indices (Beccari et al., 2016).
2.3.3 Analysis of territorial scale of vulnerability indices
In relation to the territorial scale, the analysed vulnerability indices can refer to four levels: regional, urban, local and, multiple (Table 4). From their analysis, it is noted that the majority of coastal vulnerability indices have been mainly developed for their application on a regional scale. In particular, Gornitz et al. (1991) develop their index to be applied at regional level, specifically, to the US Atlantic coast. Kleinosky et al. (2007), Karymbalis et al. (2012), Li & Li (2011), Shaw et al. (1998), Tate et al. (2010), and Thieler & Hammar-Klose (1999) conduct a similar application to Gornitz et al.'s research. In particular, Kleinosky et al. (2007) and Li & Li (2011) extend their vulnerability assessments to the whole coastal region, also taking into account the inland areas that are adjacent to the coastline. Abouodha & Woodroffe (2010) specify that their index is applied to a coastal area mapped as cells with a dimension of 1.5x1.5 km.
Territorial level
Regional Urban Local Multiple
Gornitz et al., 1991 Balica et al., 2012 Guillard-Gonçalves et al.,
2014 McLaughlin & Cooper, 2010
Shaw et al., 1998 Zanetti et al., 2016
Thieler & Hammar-Klose, 1999
Abuodha & Woodroffe, 2010 Karymbalis et al. (2012) Cutter et al., 2003 Tate et al., 2010 Li & Li, 2011 Wu et al., 2002 Boruff et al., 2005 Kleinosky et al., 2007 Preston et al., 2008
Urban Coastal Systems and Coastal Flooding
A GIS-based tool for planning climate-sensitive cities
Instead, at the same scale, Preston et al. (2008) use data of census districts for measuring their index. In the same way, Boruff et al. (2005) and Cutter et al. (2003) apply their vulnerability indices to each of the US counties, while Wu et al. (2002) conduct their evaluation on a county.
However, there are also indices that refer to more detailed territorial scales. Balica et al. (2012) have developed one of these indices to be applied at urban level, while Zanetti et al. (2016) have constructed another index for applications on a local scale. Guillard-Gonçalves et al. (2014) have also developed a local-scale index. Even if their index is applied to the metropolitan area of Lisbon, it is measured for each sub-urban district of the metropolitan area. Finally, among the analysed indices, Mc Laughlin & Cooper (2010) have developed the only multi-level one. In particular, starting from the analysis of each vulnerability characteristics, they define three forms of the same index to apply at national, regional and local levels.
2.4 Conclusions
The aim of the literature review described in this section was to identify the main characteristics of a urban coastal system that can influence its ability to respond during a coastal flooding event. In particular, in order to identify these characteristics, the main coastal vulnerability indices developed in the literature were analysed in relation to two of the main drivers of coastal flooding: rising sea levels and storm surges. Vulnerability indices, indeed, represent the most widespread "tools" for assessing vulnerability to natural hazards and climate change impacts. In particular, by adopting a holistic-system approach for analysing the selected indices, the review showed that the majority of them have developed considering the socio-economic and geomorphological factors as main features. The concept of coastal vulnerability, indeed, can be considered as the result of an integration between two other concepts of vulnerability, the sensitivity and the social vulnerability, which mainly take into account respectively geophysical and socio-economic aspects of coastal areas. However, even if vulnerability indices are based on the integration of socio-economic and geomorphological characteristics, they do not always include in their framework other relevant urban characteristics, such as physical and functional ones, which may affect vulnerability levels of the area. The territorial scale of reference of the indices could explain it. Most of indices, indeed, are developed to be applied to a lower scale than the urban or local one. Therefore, some characteristics, including physical and functional ones, may not be very relevant for vulnerability assessment of coastal regions to coastal flooding.
In this sense, from an urban planning perspective it is noted that not only little attention has been given to the study of how to assess vulnerability of coastal cities, but also that the vulnerability indices on a local scale have been defined ignoring the most meaningful characteristics of urban coastal systems (e.g. Zanetti et al. (2016) defines a socio-environmental vulnerability index that