6.
EVALUATION OF SEISMIC DEMAND ON REBARS
In order to evaluate the effective seismic ductility demand on steel reinforcements, non linear Incremental Dynamic Analyses (IDAs) were executed on the fiber models of each designed r.c. case study, elaborated according to the indications already presented in Chapter 4.
The natural time histories selected for the maximization of the seismic demand on each structure as widely discussed in Chapter 5, both in terms of dissipated energy and global displacement (deformation), were adopted as seismic inputs for the analyses.
The modified hardening slip model, based on the formulation proposed by Braga et al. [70] and further improved in order to include the hardening effects (Chapter 3), was adopted as constitutive law for steel reinforcements; this choice leaded to the necessity of elaborating a specific mechanical model for the rebar able to provide reliable values of deformations: according to what already presented in Chapters 3 and 4 in fact, IDAs correctly furnished the axial stress histories on rebars, but the results in terms of strains were affected by the plastic hinge length (adopted for the implementation in the software) and consequently needed further elaborations. The detailed investigation of the global structural behaviour of the buildings, executed following the indications prescribed by actual European and Italian standards [1, 7], allowed the individuation of the most significative ductile and brittle mechanisms and, above all, the selection of the elements to analyze in terms of bars’ deformations.
The evaluation of the effective seismic demand on steel reinforcing bars, expressed in terms of both strain and density of dissipated energy (total and per cycle), leaded to the elaboration of a preliminary protocol for the execution of experimental Low-Cycle Fatigue (LCF) tests on specimens, aiming to the definition of a common methodology for the assessment of the effective seismic behaviour of rebars and to provide useful indications for the production control of steel reinforcements.
6.1
Structural assessment of case studies
According to Delgado et al. [91] the use of non linear dynamic analyses allowed an accurate investigation of the structural behaviour of r.c. buildings, especially if compared to the results provided by non linear static analysis; this last one, in fact, generally furnished good results and a correct estimation of the effective global behaviour of the building only if the first vibration mode was predominant respect to the other ones and the distribution of applied loads corresponded to the one selected for the analysis, defined according to actual standards and literature. Mpampatsikos et al. [92] evidenced that the above mentioned problems did not exist in the case of non linear dynamic analyses, able to provide a good evaluation of the real structural behaviour of the buildings.
The r.c. case studies designed as already presented in Chapter 2 were consequently subjected to IDAs using 3 different natural accelerograms opportunely selected for maximizing the seismic demand in terms of both displacement and energy dissipation, following the procedure presented in Chapter
4; an additional accelerogram with lower value of the Park & Ang damage index was also considered in order to provide a comparison with the other cases. Both the horizontal and the vertical components of accelerograms were considered. All the time histories were scaled to obtain a common maximum acceleration equal to 1.0g and IDAs were executed for increasing level of p.g.a. until the reaching of the structural collapse, with p.g.a increment equal to 0.05g.
In the case of classical linear procedures, used as design methodology for the case studies presented in Chapter 4, the capacity of the structure was evaluated considering the structural dynamic demand in terms of internal forces coming from the analyses; the structural safety was checked at the member section level by comparing the demand with its corresponding available capacity (Eurocode 8 [1], Paulay and Priesley [5]). In the case of non linear analyses, both static and dynamic, the structural safety of the building was checked comparing the capacity of the structure, evaluated in terms of strenght or deformation respectively for brittle and ductile elements (or mechanisms), with the corresponding demand due to seismic events, opportunely derived from the analyses.
The ductile mechanisms were assessed at the member level, evaluating the chord rotation demand and the corresponding capacity at the ends of each structural element (both beams and columns); according to Mpampatsikos et al. [92], the chord rotation was defined as the angle between the chord connecting the considered end section of the member to the one in which the bending moment was equal to zero, and the tangent to the member axis at the end section (figure 6.1). The brittle elements/mechanisms were assessed evaluating their strenght capacity, to be compared to the strenght demand due to seismic loading action.
Figure 6. 1: Definition of chord rotation for columns and beams.
According to actual standards for constructions [1, 7], the capacity of reinforced concrete elements towards seismic action was evaluated through the definition of chord rotation (at yielding and ultimate conditions) and shear strenght, respectively for ductile (beams and column in flexure, with or without axial force) and brittle elements (shear in beams and columns).
In particular, the capacity of r.c. structural members at Damage Limitation limit state (DL), expressed in terms of chord rotation at yielding θy, was evaluated using the expression A.10b presented in the Annex A of Eurocode 8 [93], as reported in equation 6.1: 13 . 0 5 . 1 1 0013 . 0 3 c y bL y V v V y y f f d L h z a L ϕ ϕ θ + + + + = (6.1) Shear span Ls=M/V Chord rotation θ2 θ1 θ θ1 θ2 θ2 θ θ1 + =
Being: ϕy the yielding curvature of the element’s section, avz is the tension shift of the bending moment diagram, with z defined as the length of the internal level arm and av equal to zero if no shear cracking was expected before flexural yielding, h the height of the section, Lv the shear length, fy and fc respectively the strenght of steel reinforcement and concrete and dbL the mean diameter of longitudinal rebars. The value of total chord rotation capacity (considering both the elastic and the inelastic part) at ultimate (Near Collapse, NC) limit state was evaluated with the expression 6.2 [93]: ) 25 . 1 ( 25 ; 9 min ) ; 01 . 0 max( ) ; 01 . 0 max( ) 3 . 0 ( 016 . 0 1 100 35 . 0 225 . 0 ' d c yw sx f f v c el um h L f ρ αρ ν ω ω γ θ ⋅ ⋅ ⋅ = (6.2) In which γel was equal to 1.5 or 1.0 respectively for primary and secondary elements, ν the compression stress normalized to fc, ω and ω’ the mechanical reinforcement ratios of the tension and compression longitudinal reinforcement, α the confinement effectiveness factor, ρsx the ratio of transverse steel parallel to the direction of loading, ρd the steel ratio of diagonal reinforcement (if present), fyw and fc the strenght of stirrup and concrete respectively.
Expressions 6.1 and 6.2 evidenced the relationship between the deformation capacity of ductile mechanisms and the geometrical and mechanical properties of the elements themselves; in particular, the dependence of chord rotation from the shear span length (Lv) underlined the strong influence of the seismic input: Lv was defined as the ratio between bending moment demand and shear demand and, moreover, the curvature ϕy was related to the amount of axial load. Mpampatsikos et al. [92] in particular, evidenced that the adoption of a simplified expression for the evaluation of the shear span length (assumed to be equal to half the member span length) generally provided good results in the prediction of the effective capacity of ductile r.c. elements, consequently reducing the computational effort and simplifying the safety assessment of the whole building.
For what concerns brittle elements/mechanisms, they were assessed at the section level, through the evaluation of the effective shear demand and of the corresponding capacity at the two ends of each structural member. According to Eurocode 8 [1, 93] both the “static” and the “cyclic” shear capacity of elements was taken into account, since the effects of the inelastic response in the assessment of the shear capacity was necessarily taken into account decreasing the shear strenght with the progressive increase of the cyclic inelastic deformations. The “static” shear static strenght was evaluated according to Eurocode 2 [6]:
[
]
(
)
(
cot cot)
/(
1 cot)
sin cot cot ; min 2 1 max , , max , , θ α θ υ α α α θ + + = + = = cd w cw Rd ywd sw s Rd Rd s Rd Rd f z b V f z s A V V V V (6.3)
Being VRd the design shear resistance for the selected element, VRd,S the shear resistance due to steel stirrups, VRd,C the shear resistance due to compression strut, αthe angle between shear reinforcement and the beam axis perpendicular to the shear force, θ the angle between the concrete compression strut and the beam
axis perpendicular to the shear force, bw the minimum width between tension and compression chords, z the inner lever arm, Asw the cross-sectional area of the shear reinforcement, s the spacing of the stirrups, fywd the design yield strength of the shear reinforcement, ν1 a strength reduction factor for concrete cracked in shear and αcw a coefficient taking account the stress condition in the compression chord.
The cyclic shear resistance VR was also evaluated at ultimate limit state (NC), according to the formula presented in the Annex A of Eurocode 8 (expression A.12 of EN 1998-3:2005 [93]): + − ⋅ − + − ⋅ = ∆ w c c v tot pl c c v R V A f h L f A N L x h V ; 5 min 16 . 0 1 ) 100 ; 5 . 0 max( 16 . 0 )) ; 5 min( 05 . 0 1 ( ) 55 . 0 ; min( 1 el
ρ
µ
γ
(6.4)In which: Vw =ρwbwzfywwas the contribution of transverse reinforcement to shear resistance for cross sections with rectangular web, bw the width of the web, ρtot the total longitudinal reinforcement ratio, x the compressive zone depth and γel a coefficient equal to 1.15 or 1.0 respectively for primary and secondary elements. Each of the designed reinforced concrete buildings was deeply analyzed in order to understand its behaviour under increasing levels of seismic action, individuating the critical aspects and the most significative problems in relation to the expected structural behaviour as foreseen during the design approach. IDAs were executed considering the combined horizontal and vertical components of time histories; table 6.1 shows the accelerograms used for non linear dynamic analyses; as visible, three natural time histories characterized by high values of the Park & Ang damage indexes were selected, as well as the Umbro Marchigiano accelerogram, adopted in order to evaluate the differences of the obtained results. The global assessment of the buildings was executed comparing the seismic demand directly evaluated from IDAs, in terms of chord rotation or shear force respectively for ductile and brittle elements, with the corresponding capacity, evaluated as presented in the equations from 6.1 to 6.4. Moreover, the overcoming of the interstorey drift limit for Collapse Prevention (CP) limit was considered; the limit was fixed according to the indications provided by American Standard [2] up to 4.0% (case of reinforced concrete frames).
Table 6. 1: Selected time histories for non linear dynamic analyses.
Building Time histories
Residential HDC Montenegro x+z Erzincan x+z Campano Lucano x+z Umbro Marchigiano x+z
Residential LDC Montenegro x+z Erzincan x+z Campano Lucano x+z Umbro Marchigiano x+z
Commercial Montenegro y+z Erzincan x+z Campano Lucano y+z Umbro Marchigiano x+z
6.1.1 Residential building in High Ductility Class
The global structural behaviour of the residential building in HDC for increasing levels of seismic action is summarized in the figure 6.2. IDAs using Campano Lucano and Umbro Marchigiano natural time histories were executed until a maximum level of p.g.a. equal to 0.60 g, corresponding to a maximum top displacement respectively equal to 477 and 290 mm; in the case of Erzincan accelerogram, the analysis reached a maximum p.g.a. of 0.45 g, corresponding to a top displacement of about 870 mm and, finally, considering Montenegro time history, a maximum displacement equal to 559 mm was obtained for a p.g.a. equal to 0.45g. The values of the top displacement and of the shear base for the different p.g.a. increments are summarized in the table 6.2.
The limit of the maximum interstorey drift (4.0%, according to FEMA 356 [2]) was reached in correspondence of the third floor, for a p.g.a. equal to 0.30g for Erzincan and Campano Lucano time histories, and for p.g.a. equal to 0.35g for Montenegro accelerogram (even if at 0.35g the interstorey drift was already equal to 3.59%), as presented in the figure 6.3.
As visible, Umbro Marchigiano ground motion, characterized by lower values of the Park & Ang damage index, generally generated lower values of displacements (figure 6.3) and for a p.g.a. equal to 0.60g the maximum interstorey drift reached was equal to 3.77%, again in correspondence of the 3rd floor (table 6.3).
Figure 6. 2: Capacity curves obtained for the different time histories.
Table 6. 2: Top displacement and base shear for different time histories and increasing levels of p.g.a.
p.g.a. Campano Lucano Erzincan Montenegro Umbro Marchigiano
[g] Disp. Base Shear Disp. Base Shear Disp. Base Shear Disp. Base Shear
[mm] [kN] [mm] [kN] [mm] [kN] [mm] [kN] 0,00 0,0 0,00 0,0 0 0,0 0 0,0 0 0,05 15,2 772 16,1 944 10,3 642 12,0 661 0,10 53,0 1700 44,2 1726 29,7 1337 35,5 1345 0,15 125,5 2738 87,7 2432 77,2 2187 81,8 2151 0,20 242,1 3127 146,0 2961 122,9 2938 113,8 2276 0 500 1000 1500 2000 2500 3000 3500 4000 0 100 200 300 400 500 600 B a s e S h e a r [M P a ] Top displacement [mm] IDA Erzincan IDA Montenegro IDA Umbro Marchigiano IDA Campano Lucano
0,25 256,4 3125 215,1 3310 189,5 3350 127,3 2444 0,30 294,2 2995 294,6 3477 267,2 3584 136,4 2914 0,35 296,8 3011 394,1 3462 354,9 3682 142,6 3192 0,40 317,7 3087 526,6 3474 455,8 3615 176,2 3346 0,45 322,3 3158 870,3 3569 558,7 3607 211,3 3448 0,50 324,7 3429 - - - - 243,9 3519 0,55 384,3 3575 - - - - 273,3 3574 0,60 476,9 3562 - - - - 290,4 3684
Table 6. 3: Values of the interstorey drift for p.g.a. equal to 0.30g.
Height [m] Erzincan Campano Lucano Montenegro Umbro Marchigiano
0,30g 0,30g 0,30g 0,60g 1st floor – 2.5 m 1,47% 1,55% 1,12% 1,90% 2nd floor – 5.5 m 2,05% 2,36% 1,85% 2,50% 3rd floor – 8.5 m 4,12% 4,63% 3,59% 3,77% 4th floor – 11.5 m 2,88% 2,78% 2,29% 1,80% 5th floor – 14.5m 0,80% 1,04% 0,82% 0,91%
Figure 6. 3: Interstorey drift profiles for the different time histories and for p.g.a. equal to 0.30g. No shear mechanisms (i.e. overcoming of the maximum shear strenght in beams and columns) were individuated; on the other hand, ductile mechanisms were revealed in both beams and columns.
First yielding in the columns of the first floor generally activated for p.g.a. equal to 0.20 g or 0.25g (Campano Lucano, Erzincan and Montenegro time histories). For p.g.a. equal to 0.30g, in general, the majority of beams’ end sections in correspondence of the 1st and of the 2nd floor reached the yielding limit of the chord rotation for all the three accelerograms considered.
In the case of Campano Lucano earthquake, for p.g.a. equal to 0.20g all the columns of the 1st floor and several beams section of the 1st, 2nd and 3rd floor got the yielding point, as visible from figure 6.5, in which the filled red circles and the
0 2 4 6 8 10 12 14 16 0,0% 1,0% 2,0% 3,0% 4,0% 5,0% H e ig th [ m ] Interstorey drift [%] 0.30g, Erzincan 0.30g, Montenegro 0.30g, Umbro 0.30g, Campano Lucano
filled blue squares indicated the overcoming of the yielding chord rotation capacity respectively for p.g.a. equal to 0.20 and 0.25g. For p.g.a. equal to 0.45g the ultimate rotation limit was reached by several columns of the 3rd floor.
A situation similar to the one already presented was individuated also in the cases of Montenegro and Erzincan time histories. For Montenegro accelerogram (figure 6.6) first plastic hinges in correspondence of the base of the columns of the first floor and of the end sections of beams of the 2nd and 3rd levels developed for p.g.a. equal to 0.20g (filled red circles), while for p.g.a. of 0.25g (blue filled squares) all the critical sections of beams of the 2nd and 3rd floors got the yielding chord rotation. For p.g.a. of 0.40g some base sections of the 1st and 3rd floor columns over passed the ultimate chord rotation (red line), while for 0.45g also in the ends of some beams elements of the third floor the ultimate ductile limit for rotation was reached (red cross).
The progressive evolution of the structural behaviour of the building under Erzincan natural accelerogram is presented in the figure 6.7; the situation was similar to the one obtained from Montenegro and Campano Lucano time histories, with the full plasticization of beams’ end sections of the first, second and third floor for p.g.a. between 0.20g and 0.30g. Also in this case, for p.g.a. equal to 0.35-0.40g all the end sections of the columns of the 3rd floor reached the ultimate rotation.
Figures from 6.5 to 6.7 evidenced a relatively uniform distribution of the development of plastic hinges, generally involving beams of the first three levels and columns of the first and third floor. In particular, as already shown by figure 6.3, the overcoming of the interstorey drift limit (usually for p.g.a. of about 0.30-0.35g) was strictly connected to the reaching of the ultimate rotation of columns of the 3rd floor. Probably the fact that the maximum interstorey drift was reached in correspondence of the 3rd floor was the consequence of reduced section of columns’ elements (equal to 50x50 cm2 respect to the 70x50 cm2 of the first floor and to the 60x50 cm2 of the second one). Finally, no (or few) plastic hinges developed in correspondence of beams and columns of the 4th and 5th floors, underlining that the collapse mechanisms generally did not involve the higher levels of the building.
Figure 6. 4: Numbering of beam and column elements for residential building in HDC.
400 600 600 400 400 600 600 400 400 600 600 400 6000 3 0 0 3 0 0 3 0 0 3 0 0 1 4 5 0 2 5 0 1000 1001 1002 1003 1004 1005 1006 1007 1008 1009 1010 1011 2000 2001 2002 2003 2004 2005 2006 2007 2008 2009 2010 2011 3000 3001 3002 3003 3004 3005 3006 3007 3008 3009 3010 3011 4000 4001 4002 4003 4004 4005 4006 4007 4008 4009 4010 4011 5000 5001 5002 5003 5004 5005 5006 5007 5008 5009 5010 5011 509 110 210 310 410 510 111 211 311 411 511 112 212 312 412 512 100 200 300 400 500 101 201 301 401 501 102 202 302 402 502 103 203 303 403 503 104 204 304 404 504 105 205 305 405 505 106 206 306 406 506 107 207 307 407 507 108 208 308 408 508 109 209 309 409
Figure 6. 5: Progressive evolution of the structural behaviour of residential building in HDC for Campano earthquake.
Figure 6. 6: Progressive evolution of the structural behaviour of residential building in HDC for Montenegro earthquake.
Figure 6. 7: Progressive evolution of the structural behaviour of residential building in HDC for Erzincan earthquake. 400 600 600 400 400 600 600 400 400 600 600 400 6000 3 0 0 3 0 0 3 0 0 3 0 0 1 4 5 0 2 5 0 1000 1001 1002 1003 1004 1005 1006 1007 1008 1009 1010 1011 2000 2001 2002 2003 2004 2005 2006 2007 2008 2009 2010 2011 3000 3001 3002 3003 3004 3005 3006 3007 3008 3009 3010 3011 4000 4001 4002 4003 4004 4005 4006 4007 4008 4009 4010 4011 5000 5001 5002 5003 5004 5005 5006 5007 5008 5009 5010 5011 0.20 g 0.25 g 0.30 g 0.35 g 0.40 g 0.15 g 0.45 g ultimate rotation 0.50 g ultimate rotation 0.40 g ultimate rotation 0.35 g ultimate rotation 0.30 g ultimate rotation 400 600 600 400 400 600 600 400 400 600 600 400 6000 3 0 0 3 0 0 3 0 0 3 0 0 1 4 5 0 2 5 0 1000 1001 1002 1003 1004 1005 1006 1007 1008 1009 1010 1011 2000 2001 2002 2003 2004 2005 2006 2007 2008 2009 2010 2011 3000 3001 3002 3003 3004 3005 3006 3007 3008 3009 3010 3011 4000 4001 4002 4003 4004 4005 4006 4007 4008 4009 4010 4011 5000 5001 5002 5003 5004 5005 5006 5007 5008 5009 5010 5011 0.20 g 0.25 g 0.30 g 0.35 g 0.40 g 0.15 g 0.45 g ultimate rotation 0.50 g ultimate rotation 0.40 g ultimate rotation 0.35 g ultimate rotation 0.30 g ultimate rotation 400 600 600 400 400 600 600 400 400 600 600 400 6000 3 0 0 3 0 0 3 0 0 3 0 0 1 4 5 0 2 5 0 1000 1001 1002 1003 1004 1005 1006 1007 1008 1009 1010 1011 2000 2001 2002 2003 2004 2005 2006 2007 2008 2009 2010 2011 3000 3001 3002 3003 3004 3005 3006 3007 3008 3009 3010 3011 4000 4001 4002 4003 4004 4005 4006 4007 4008 4009 4010 4011 5000 5001 5002 5003 5004 5005 5006 5007 5008 5009 5010 5011 0.20 g 0.25 g 0.30 g 0.35 g
0.15 g 0.30 g ultimate rotation 0.45 g ultimate rotation
0.50 g ultimate rotation
0.40 g ultimate rotation 0.35 g ultimate rotation
6.1.2 Commercial building in High Ductility Class
The global structural behaviour of commercial building in HDC, in terms of capacity curves (top displacement – base shear) for the different natural time histories considered is summarized in the figure 6.8, while in the table 6.4 the values obtained for displacement and total base shear are presented.
Figure 6. 8: Capacity curves obtained for the different time histories.
Table 6. 4: Top displacement and base shear for different time histories and increasing levels of p.g.a.
p.g.a. Campano Lucano Erzincan Montenegro Umbro Marchigiano
[g] Disp. Base Shear Disp. Base Shear Disp. Base Shear Disp. Base Shear
[mm] [kN] [mm] [kN] [mm] [kN] [mm] [kN] 0 0 0 0 0 0 0 0 0 0,05 31,0 634 34,6 720 34,6 665,7 28,8 590 0,10 67,7 1029 91,5 1295 90,9 1293,0 42,3 837 0,15 120,1 1498 161,1 1621 159,0 1632,3 75,5 1163 0,20 198,3 1737 244,2 1857 248,2 1803,2 108,3 1364 0,25 262,5 1852 331,7 1964 337,6 1887,6 139,5 1455 0,30 286,8 1937 422,8 2042 417,5 1886,9 164,3 1549 0,35 307,3 1967 524,3 2059 475,7 1897,3 180,5 1679 0,40 357,2 2004 637,4 1916 502,6 1949,2 188,9 1771 0,45 404,0 1992 660,4 1923 - - 206,4 1837 0,50 445,1 2042 791,7 1980 - - 237,7 1884 0,55 476,3 2077 - - - - 269,9 1915 0,60 488,1 2079 - - - - 303,0 1939
IDAs were executed until a p.g.a. equal to 0.60g in the cases of Campano Lucano and Umbro Marchigiano earthquakes, while using Erzincan and Montenegro time histories non linear analyses were limited to 0.50 and 0.40g, since higher displacements were obtained for lower levels of seismic action (table 6.4). The
0 500 1000 1500 2000 2500 0 100 200 300 400 500 600 700 B a s e S h e a r [M P a ] Top displacement [mm] IDA Montenegro IDA Campano Lucano IDA Erzincan IDA Umbro Marchigiano
interstorey drift profiles obtained from analyses are presented in the figure 6.9 and in table 6.6: as visible, the limit of 4.0% (FEMA 356) was reached for different levels of p.g.a., respectively equal to 0.35g for Erzincan time history (2nd floor), 0.50g for Montenegro time history (1st floor) and 0.60g for Campano Lucano accelerogram (1st floor); once again, the displacements obtained from Umbro Marchigiano for the same levels of p.g.a. were lower than the other ones.
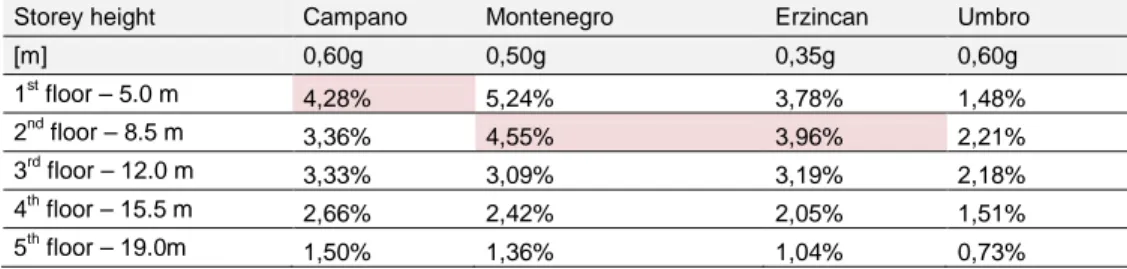
Figure 6. 9: Interstorey drift profiles for the different time histories and for different levels of p.g.a. Table 6. 5: Values of the interstorey drift for the considered time histories and different p.g.a levels.
Storey height Campano Montenegro Erzincan Umbro
[m] 0,60g 0,50g 0,35g 0,60g 1st floor – 5.0 m 4,28% 5,24% 3,78% 1,48% 2nd floor – 8.5 m 3,36% 4,55% 3,96% 2,21% 3rd floor – 12.0 m 3,33% 3,09% 3,19% 2,18% 4th floor – 15.5 m 2,66% 2,42% 2,05% 1,51% 5th floor – 19.0m 1,50% 1,36% 1,04% 0,73%
As well as in the case of residential building in HDC, no shear mechanisms were individuated, according to the capacity design methodology adopted; on the other hand, ductile mechanisms were revealed in both beams and columns, and several elements reached not only the yielding but also the ultimate chord rotation.
First yielding in the columns of the first floor generally activated for p.g.a. equal to 0.15 g (Erzincan and Montenegro time histories) or 0.20g (Campano Lucano earthquake); for p.g.a. equal to 0.20g or 0.25g all the base sections of the 1st floor columns were already yielded (respectively in the case of Erzincan and Montenegro or Campano Lucano earthquakes). The yielding chord rotation θy was reached by the end sections of beams of the 1st or 2nd floors for very low values of p.g.a., respectively equal to 0.15g for Erzincan and Montenegro time histories and 0.20g for Campano Lucano.
In the case of Campano Lucano earthquake (figure 6.11) plastic hinges were already developed in all the critical sections of the 1st and 2nd floor for p.g.a. equal to 0.20g, while at 0.25g all the beams of the 3rd floor reached their yielding point as
0 2 4 6 8 10 12 14 16 18 20 0,0% 1,0% 2,0% 3,0% 4,0% 5,0% 6,0% S to re y h e ig th [ m ] Interstorey drift [%] Campano Lucano 0.60g Umbro Marchigiano 0.60g Erzincan 0.35g Montenegro 0.50g
well as columns’ base sections. In four columns of the first floor the ultimate chord rotation was over passed for a p.g.a. level equal to 0.50g.
Figure 6. 10: Numbering of beam and column elements for commercial building in HDC.
Figure 6. 11: Progressive evolution of the structural behaviour of commercial building in HDC for Campano earthquake.
The situation coming from analyses with Montenegro time history was a little more complicated (figure 6.12): all the beams of the first, second and third floors already reached their critical yielding point for p.g.a. equal to 0.25g, and in particular, for 0.15 - 0.20g all the beams of the first two floors overpassed their corresponding yielding chord rotation. Moreover, at 0.20g also all the columns’ base sections were completely yielded. As regards the reaching of the ultimate chord rotation, two columns’ base sections reached their collapse limit for 0.40g and about all the other ones overcame θu for a p.g.a. equal to 0.50g, in agreement to what evidenced by the interstorey drift profiles (table 6.5).
A similar situation was obtained also from IDA executed considering Erzincan time history (figure 6.13), even if in this case several columns’ base sections reached the ultimate limit for chord rotation for lower values of p.g.a. (equal to 0.30g) and also in beam elements of the 2nd and 3rd floors, for p.g.a. equal to 0.35g, the ultimate rotation was reached.
According to what already presented and to the figures from 6.11 to 6.13, considerations similar to the ones argued for residential building in HDC were made. For each one of the three considered natural time histories, a global uniform
400 400 500 500 600 500 3 5 0 3 5 0 3 5 0 3 5 0 5 0 0 500 1000 1001 1002 1003 1004 1005 1006 2000 2001 2002 2003 2004 2005 2006 3000 3001 3002 3003 3004 3005 3006 4000 4001 4002 4003 4004 4005 4006 5000 5001 5002 5003 5004 5005 5006 1 9 0 0 100 200 300 400 500 101 201 301 401 501 102 202 302 402 502 103 203 303 403 503 104 204 304 404 504 105 205 305 405 505 106 206 306 406 506 107 207 307 407 507 3400 400 400 500 500 600 500 3 5 0 3 5 0 3 5 0 3 5 0 5 0 0 500 1000 1001 1002 1003 1004 1005 1006 2000 2001 2002 2003 2004 2005 2006 3000 3001 3002 3003 3004 3005 3006 4000 4001 4002 4003 4004 4005 4006 5000 5001 5002 5003 5004 5005 5006 0.20 g 0.25 g 0.30 g 0.60 g ultimate rotation 1 9 0 0 0.15 g
distribution of plastic hinges in the beams of the first three floors, for increasing levels of p.g.a., was found; moreover, in general, yielding rotations developed in beams for lower values of the p.g.a. causing the yielding of columns’ end sections, according to the capacity design approach. No (or, at the worst, few) plastic hinges developed in correspondence of beams and columns of the 4th and 5th floors, underlining that the collapse mechanisms generally did not involve the higher levels of the building, as already found for the other considered r.c. case study.
Figure 6. 12: Progressive evolution of the structural behaviour of commercial building in HDC for Montenegro earthquake.
Figure 6. 13: Progressive evolution of the structural behaviour of commercial building in HDC for Erzincan earthquake. 400 400 500 500 600 500 3 5 0 3 5 0 3 5 0 3 5 0 5 0 0 500 1000 1001 1002 1003 1004 1005 1006 2000 2001 2002 2003 2004 2005 2006 3000 3001 3002 3003 3004 3005 3006 4000 4001 4002 4003 4004 4005 4006 5000 5001 5002 5003 5004 5005 5006 0.15 g 0.20 g 0.25 g 0.30 g 0.45 g ultimate rotation 0.50 g ultimate rotation 1 9 0 0 0.40 g ultimate rotation 400 400 500 500 600 500 3 5 0 3 5 0 3 5 0 3 5 0 5 0 0 500 1000 1001 1002 1003 1004 1005 1006 2000 2001 2002 2003 2004 2005 2006 3000 3001 3002 3003 3004 3005 3006 4000 4001 4002 4003 4004 4005 4006 5000 5001 5002 5003 5004 5005 5006 0.15 g 0.20 g 0.25 g 0.30 g 0.30 g ultimate rotation 1 9 0 0 0.45 g ultimate rotation 0.50 g ultimate rotation 0.40 g ultimate rotation 0.35 g ultimate rotation
6.1.3 Office building in High Ductility Class
The global structural behaviour of office building in HDC, in terms of capacity curves for the different natural time histories considered is summarized in the figure 6.14, while in the table 6.6 the values obtained for displacement and total base shear are presented. IDAs were limited to a p.g.a. respectively equal to 0.55g and 0.60g for Campano Lucano and Umbro Marchigiano time histories, while in the case of Erzincan and Montenegro earthquakes maximum levels of p.g.a. up to 0.35g and 0.50g were reached. Table 6.6 shows the levels of top displacements and base shear obtained.
Figure 6. 14: Capacity curves obtained for the different time histories and from pushover analysis. Table 6. 6: Top displacement and base shear for different time histories and increasing levels of p.g.a.
p.g.a. Campano Lucano Erzincan Montenegro Umbro Marchigiano
[g] Disp. Base Shear Disp. Base Shear Disp. Base Shear Disp. Base Shear
[mm] [kN] [mm] [kN] [mm] [kN] [mm] [kN] 0 0 0 0 0 0 0 0 0 0,05 34,0 1643 38,8 1968 37,2 1871 23,9 1317 0,10 68,9 2747 91,0 3533 99,6 3615 49,3 2276 0,15 110,3 3958 153,3 4404 159,5 4500 80,3 3072 0,20 187,0 4705 226,4 5027 241,0 4891 112,3 3645 0,25 268,4 4964 311,9 5302 325,3 5094 143,8 3950 0,30 297,1 5198 402,9 5358 400,1 5007 170,8 4194 0,35 309,2 5325 504,1 5342 453,1 5183 190,3 4547 0,40 330,5 5414 - - 473,2 5274 202,7 4819 0,45 376,7 5445 - - 335,0 5267 206,5 5003 0,50 416,3 5411 - - 546,0 5363 225,4 5117 0,55 443,7 5428 - - - - 255,0 5198 0,60 - - - 285,3 5255 0 1000 2000 3000 4000 5000 6000 0 100 200 300 400 500 600 B a s e S h e a r [M P a ] Top displacement [mm] IDA Campano Lucano IDA Montenegro IDA Umbro IDA Erzincan
Figure 6.15 presents the interstorey drift profiles obtained from the different natural time histories adopted in the analyses, while table 6.7 directly presents the values obtained from IDAs. As visible, the interstorey drift limit (4.0% according to FEMA 356) was reached for p.g.a. respectively equal to 0.55g, 0.40g and 0.40g in the case of Campano Lucano, Montenegro and Erzincan earthquakes, generally in correspondence of the 1st floor.
Table 6. 7: Values of the interstorey drift for the considered time histories and different p.g.a levels.
Storey height Campano Montenegro Erzincan Umbro
[m] 0,55g 0,40g 0,40g 0,60g 1st floor – 5.0 m 4,44% 4,15% 4,16% 1,21% 2nd floor – 8.5 m 2,80% 2,85% 3,49% 1,87% 3rd floor – 12.0 m 3,79% 3,84% 3,89% 2,34% 4th floor – 15.5 m 2,71% 3,23% 2,63% 1,74% 5th floor – 19.0m 1,17% 1,36% 1,19% 0,84%
Figure 6. 15: Interstorey drift profiles for the different time histories and levels of p.g.a. As well as in the case of other buildings in HDC, no shear mechanisms were individuated, according to the capacity design methodology adopted; on the other hand, ductile mechanisms were revealed in both beams and columns, and several elements reached not only the yielding but also the ultimate chord rotation.
Considering the behaviour of the office building under Campano Lucano time history (figure 6.16), for a p.g.a. equal to 0.20g first yielding rotations in columns of the first floor and in beams of the first and second floors developed; the whole plasticization of end sections was generally reached for p.g.a. of 0.25g (1st and 2nd floor), while in correspondence of the 3rd floor, several sections overpassed the yielding chord rotation limit for p.g.a. equal to 0.30g. As regards the reaching of the ultimate chord rotation, several base sections of the 1st floor columns collapsed for p.g.a. between 0.40g and 0.50g. At p.g.a. equal to 0.55g, the majority of colums of the first floor (except columns from n°106 to 111) reached the limit rotation θu. Considering the results provided by IDA executed with Erzincan natural accelerogram, in several beams’ end sections of the 1st, 2nd and 3rd floor plastic
0 2 4 6 8 10 12 14 16 18 20 0,0% 1,0% 2,0% 3,0% 4,0% 5,0% S to re y h e ig th [m ] Interstorey drift [%] Campano Lucano 0.55g Umbro Marchigiano 0.60g Erzincan 0.40g Montenegro 0.40g
hinges developed for a p.g.a. level equal to 0.15g and in general, for p.g.a. equal to 0.25g all the sections were completely yielded (1st, 2nd and 3rd floor, see figure 6.17). As regards columns, several of the base sections of the 1st floor developed plastic hinges for p.g.a. equal to 0.15g, and all of them were yielded at 0.20g; moreover, for p.g.a. equal to 0.30-0.35g many columns reached their ultimate chord rotation limit.
Figure 6. 16: Progressive evolution of the structural behaviour of office building in HDC for Campano earthquake.
Figure 6. 17: Progressive evolution of the structural behaviour of office building in HDC for Erzincan earthquake.
A very similar situation was also evidenced by the results coming from IDA with Montenegro natural time history (figure 6.18), in which the majority of beams’ and columns’ end sections were completely yielded for a p.g.a. level equal to 0.25g, with first yielding in correspondence of 0.15g. Also in this case, for p.g.a. equal to 0.30-0.35g several columns of the first floor developed ultimate chord rotation. As visible from the figures 6.16-6.18, as well as already presented for the other case study buildings in HDC, a uniform distribution of plastic hinges developed for p.g.a. levels in the range 0.20-0.30g, involving only the first three floors and non including the higher storeys of the buildings. Moreover, even if no shear brittle mechanisms were evidenced, in some cases (Erzincan and Montenegro time histories) ultimate chord rotations developed before in the columns’ sections than in beams’ ones, not in agreement with what imposed according to the capacity design approach. 3 5 0 3 5 0 3 5 0 3 5 0 5 0 0 600 700 500 500 700 700 500 500 700 700 500 500 700 700 500 500 700 600 10800 1000 1001 1002 1003 1004 1005 1006 1007 1008 1009 1010 1011 2000 2001 2002 2003 2004 2005 2006 2007 2008 2009 2010 2011 3000 3001 3002 3003 3004 3005 3006 3007 3008 3009 3010 3011 4000 4001 4002 4003 4004 4005 4006 4007 4008 4009 4010 4011 5000 5001 5002 5003 5004 5005 5006 5007 5008 5009 5010 5011 1012 2012 3012 4012 5012 1013 2013 3013 4013 5013 1014 2014 3014 4014 5014 1015 2015 3015 4015 5015 1016 2016 3016 4016 5016 1017 2017 3017 4017 5017 0.20 g 0.30 g 0.45 g - Ultimate rotation 0.35 g 0.40 g 0.25 g 0.50 g - Ultimate rotation 0.40 g - Ultimate rotation 0.15 g 0.30 g - Ultimate rotation 0.35 g - Ultimate rotation
1 9 0 0 3 5 0 3 5 0 3 5 0 3 5 0 5 0 0 600 700 500 500 700 700 500 500 700 700 500 500 700 700 500 500 700 600 10800 1000 1001 1002 1003 1004 1005 1006 1007 1008 1009 1010 1011 2000 2001 2002 2003 2004 2005 2006 2007 2008 2009 2010 2011 3000 3001 3002 3003 3004 3005 3006 3007 3008 3009 3010 3011 4000 4001 4002 4003 4004 4005 4006 4007 4008 4009 4010 4011 5000 5001 5002 5003 5004 5005 5006 5007 5008 5009 5010 5011 1012 2012 3012 4012 5012 1013 2013 3013 4013 5013 1014 2014 3014 4014 5014 1015 2015 3015 4015 5015 1016 2016 3016 4016 5016 1017 2017 3017 4017 5017 1 9 0 0 0.20 g 0.30 g 0.45 g - Ultimate rotation 0.35 g 0.40 g 0.25 g 0.50 g - Ultimate rotation 0.40 g - Ultimate rotation 0.15 g 0.30 g - Ultimate rotation 0.35 g - Ultimate rotation
Figure 6. 18: Progressive evolution of the structural behaviour of office building in HDC for Montenegro earthquake.
6.1.4 Residential building in Low Ductility Class
The results of Incremental Dynamic Analyses on residential building in Low Ductility Class (LDC) evidenced a different behaviour respect to what already presented for the other case studies. Figure 6.19 shows the top displacement-base shear curves obtained from the four natural time histories selected, while the corresponding values are presented in the table 6.8.
IDAs were executed until a maximum p.g.a. equal to 0.40g for Erzincan and Montenegro time histories, while Campano Lucano and Umbro Marchigiano earthquakes were analyzed respectively until a p.g.a. equal to 0.60g and 0.55 was reached; the results evidenced, once again, the lower displacements induced by Umbro Marchigiano earthquakes and a comparable behaviour in the cases of the other seismic inputs, whose analysis was stopped in correspondence of a top displacement varying between 500 and 570 mm.
Figure 6. 19: Capacity curves obtained for the different time histories and from pushover analysis. As regards the evaluation of the interstorey drift profiles (figure 6.20, table 6.9), the maximum interstorey drift (4.0%, according to FEMA 356) was generally reached in correspondence of the 2nd floor for a p.g.a. equal to 0.35g (Montenegro and Erzincan earthquakes) or 0.55g (Campano Lucano time history). In the case of Umbro Marchigiano accelerogram, at 0.60g the interstorey drift limit was not yet overpassed. 3 5 0 3 5 0 3 5 0 3 5 0 5 0 0 600 700 500 500 700 700 500 500 700 700 500 500 700 700 500 500 700 600 10800 1000 1001 1002 1003 1004 1005 1006 1007 1008 1009 1010 1011 2000 2001 2002 2003 2004 2005 2006 2007 2008 2009 2010 2011 3000 3001 3002 3003 3004 3005 3006 3007 3008 3009 3010 3011 4000 4001 4002 4003 4004 4005 4006 4007 4008 4009 4010 4011 5000 5001 5002 5003 5004 5005 5006 5007 5008 5009 5010 5011 1012 2012 3012 4012 5012 1013 2013 3013 4013 5013 1014 2014 3014 4014 5014 1015 2015 3015 4015 5015 1016 2016 3016 4016 5016 1017 2017 3017 4017 5017 1 9 0 0 0.20 g 0.30 g 0.45 g - Ultimate rotation 0.35 g 0.40 g 0.25 g 0.50 g - Ultimate rotation 0.40 g - Ultimate rotation 0.15 g 0.30 g - Ultimate rotation 0.35 g - Ultimate rotation
0 500 1000 1500 2000 2500 3000 3500 4000 0 100 200 300 400 500 600 B a s e S h e a r [k N ] Top displacement [mm] IDA Campano Lucano IDA Erzincan IDA Montenegro IDA Umbro Marchigiano
Table 6. 8: Top displacement and base shear for different time histories and increasing levels of p.g.a.
p.g.a. Campano Lucano Erzincan Montenegro Umbro Marchigiano
[g] Disp. Base Shear Disp. Base Shear Disp. Base Shear Disp. Base Shear
[mm] [kN] [mm] [kN] [mm] [kN] [mm] [kN] 0,00 0 0 0 0 0 0 0 0 0,05 21,3 851 20,8 963 13,4 710 16,0 734 0,10 76,6 2019 57,6 1757 51,5 1582 54,8 1587 0,15 189,2 2690 109,1 2459 94,2 2359 85,3 1868 0,20 225,2 2816 175,3 2914 153,9 2903 99,3 2059 0,25 258,0 2769 263,7 3070 230,9 3138 108,5 2492 0,30 288,3 2830 351,9 3071 315,3 3139 134,2 2754 0,35 304,1 2937 443,5 3079 408,2 2995 168,6 2898 0,40 318,7 2969 568,1 3138 506,0 3157 201,2 2979 0,45 335,2 3074 - - - - 232,0 3022 0,50 354,2 3252 - - - - 246,7 3127 0,55 468,7 3407 - - - - 257,7 3263 0,60 528,3 3148 - - - -
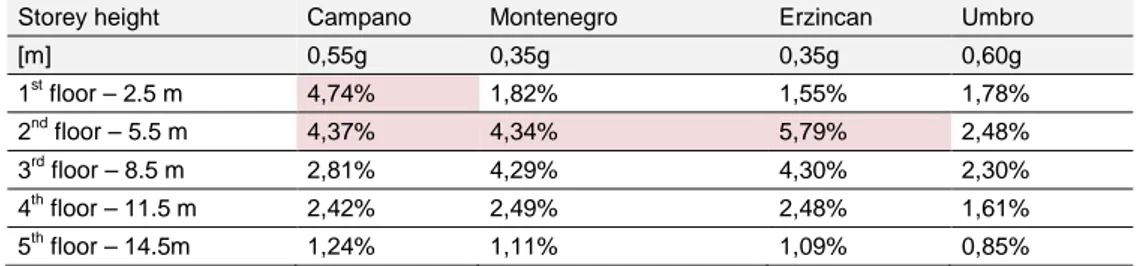
Table 6. 9: Values of the interstorey drift for the considered time histories and p.g.a levels.
Storey height Campano Montenegro Erzincan Umbro
[m] 0,55g 0,35g 0,35g 0,60g 1st floor – 2.5 m 4,74% 1,82% 1,55% 1,78% 2nd floor – 5.5 m 4,37% 4,34% 5,79% 2,48% 3rd floor – 8.5 m 2,81% 4,29% 4,30% 2,30% 4th floor – 11.5 m 2,42% 2,49% 2,48% 1,61% 5th floor – 14.5m 1,24% 1,11% 1,09% 0,85%
Figure 6. 20: Interstorey drift profiles for the different time histories and levels of p.g.a.
0,00 2,00 4,00 6,00 8,00 10,00 12,00 14,00 16,00 0,0% 1,0% 2,0% 3,0% 4,0% 5,0% 6,0% 7,0% S to re y h e ig th [ m ] Interstorey drift [%] Campano Lucano 0.55g Umbro Marchigiano 0.60g Erzincan 0.35g Montenegro 0.35g
Differently from what evidenced by the non linear analysis of building in HDC, in this case some brittle shear mechanisms were individuated in both beams and columns, as presented in the figures 6.21-6.23, respectively for Campano Lucano, Montenegro and Erzincan time histories.
Figure 6. 21: Development of shear mechanisms in beams and columns for increasing levels of p.g.a. (Campano Lucano).
Figure 6. 22: Development of brittle shear mechanisms in beams and columns for increasing levels of p.g.a. (Montenegro).
Figure 6. 23: Development of brittle shear mechanisms in beams and columns for increasing levels of p.g.a. (Erzincan).
As visible from figure 6.21, in the case of Campano Lucano time history, the first shear failures in the columns of the 1st floor happened for p.g.a. equal to 0.20g; for higher levels of p.g.a. (about 0.50g) also several other columns of the 1st floor were involved in brittle shear mechanisms. Only in two sections of the 1st level, beams overpassed their shear strength (both static and cyclic).
400 600 600 400 400 600 600 400 400 600 600 400 6000 3 0 0 3 0 0 3 0 0 3 0 0 1 4 5 0 2 5 0 1000 1001 1002 1003 1004 1005 1006 1007 1008 1009 1010 1011 2000 2001 2002 2003 2004 2005 2006 2007 2008 2009 2010 2011 3000 3001 3002 3003 3004 3005 3006 3007 3008 3009 3010 3011 4000 4001 4002 4003 4004 4005 4006 4007 4008 4009 4010 4011 5000 5001 5002 5003 5004 5005 5006 5007 5008 5009 5010 5011 0.20 g 0.25 g 0.30 g 0.35 g 0.40 g 0.45 g 0.50 g 400 600 600 400 400 600 600 400 400 600 600 400 6000 3 0 0 3 0 0 3 0 0 3 0 0 1 4 5 0 2 5 0 1000 1001 1002 1003 1004 1005 1006 1007 1008 1009 1010 1011 2000 2001 2002 2003 2004 2005 2006 2007 2008 2009 2010 2011 3000 3001 3002 3003 3004 3005 3006 3007 3008 3009 3010 3011 4000 4001 4002 4003 4004 4005 4006 4007 4008 4009 4010 4011 5000 5001 5002 5003 5004 5005 5006 5007 5008 5009 5010 5011 0.20 g 0.25 g 0.30 g 0.35 g 0.40 g 0.45 g 0.50 g 400 600 600 400 400 600 600 400 400 600 600 400 6000 3 0 0 3 0 0 3 0 0 3 0 0 1 4 5 0 2 5 0 1000 1001 1002 1003 1004 1005 1006 1007 1008 1009 1010 1011 2000 2001 2002 2003 2004 2005 2006 2007 2008 2009 2010 2011 3000 3001 3002 3003 3004 3005 3006 3007 3008 3009 3010 3011 4000 4001 4002 4003 4004 4005 4006 4007 4008 4009 4010 4011 5000 5001 5002 5003 5004 5005 5006 5007 5008 5009 5010 5011 0.20 g 0.25 g 0.30 g 0.35 g 0.40 g 0.45 g 0.50 g
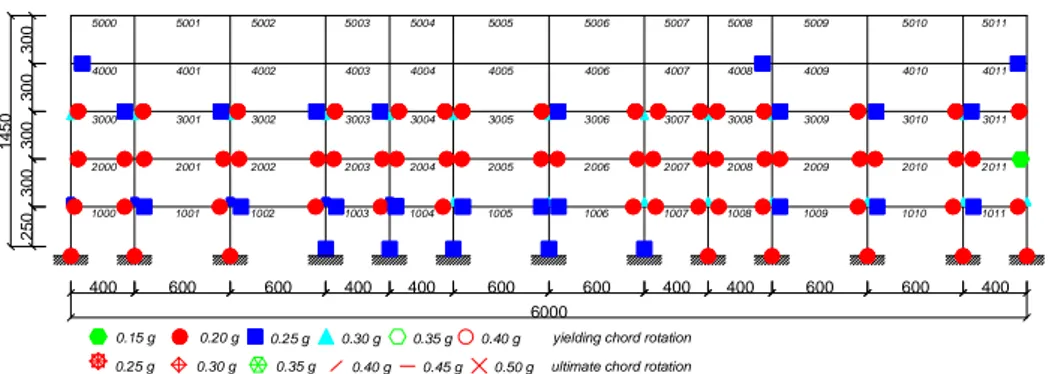
On the other hand, the results of analyses with Erzincan and Montenegro time histories evidenced shear mechanisms in both beams and columns of the 1st floor, for p.g.a. levels generally varying between 0.25g and 0.40g (columns) and between 0.35g and 0.45g (beams), as visible from figures 6.22 and 6.23.
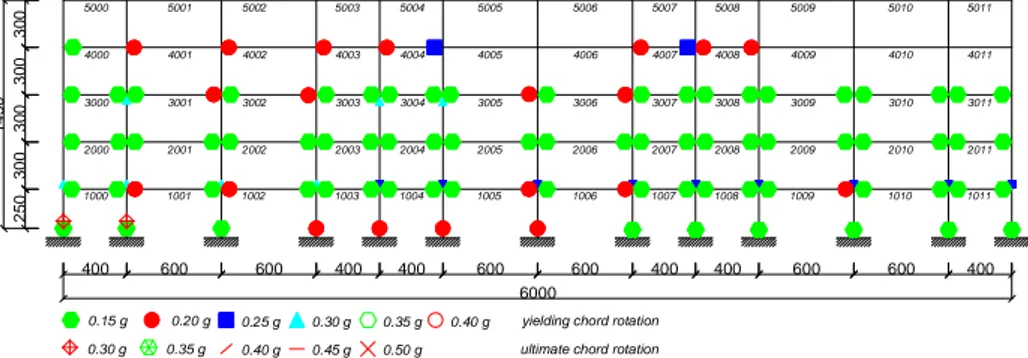
Considering, on the other hand, the development of ductile mechanisms in beams and columns, figure 6.24 shows the results obtained from the analyses executed with Campano Lucano time history. As visible, the first yielding rotations developed in beams and columns of the 1st floor for p.g.a. equal to 0.15g; moreover, for p.g.a. equal to 0.20g all the beams’ end sections (1st, 2nd and 3rd floor) and all the columns’ base sections (1st floor) already developed plastic hinges. The ultimate chord rotation was reached in correspondence of the base section of columns of the first level (n°100 and 101) for p.g.a. equal to 0.30 (figure 6.24). Figures 6.25 and 6.26 show the behaviour of ductile elements for increasing levels of p.g.a. for Montenegro and Erzincan time histories, respectively. As visible, once again, beams’ end sections and columns’ base sections generally developed rotations higher than the yielding chord rotation (defined according to equation 6.1) for p.g.a. levels between 0.20g and 0.35g, while ultimate chord rotations usually took place for p.g.a. higher than 0.30g, in correspondence of the base of the columns of the 1st floor.
The results already presented evidenced a different behaviour between residential building in HDC and LDC; in particular, in the case of low ductility class structures, brittle shear mechanisms developed in both beams and columns for moderate values of the p.g.a., differently from what foreseen during the design phase according to the capacity design approach. Moreover, as well as in the case of HDC, despite a uniform distribution of plastic hinges among the elements of the first three levels (both beams and columns), the higher floors were not directly involved in the structural collapse mechanisms.
Figure 6. 24: Progressive evolution of the structural behaviour of residential building in LDC for Campano earthquake. 400 600 600 400 400 600 600 400 400 600 600 400 6000 3 0 0 3 0 0 3 0 0 3 0 0 1 4 5 0 2 5 0 1000 1001 1002 1003 1004 1005 1006 1007 1008 1009 1010 1011 2000 2001 2002 2003 2004 2005 2006 2007 2008 2009 2010 2011 3000 3001 3002 3003 3004 3005 3006 3007 3008 3009 3010 3011 4000 4001 4002 4003 4004 4005 4006 4007 4008 4009 4010 4011 5000 5001 5002 5003 5004 5005 5006 5007 5008 5009 5010 5011 0.20 g 0.25 g 0.30 g 0.35 g 0.40 g 0.15 g 0.30 g 0.35 g 0.40 g 0.45 g 0.50 g
yielding chord rotation ultimate chord rotation
Figure 6. 25: Progressive evolution of the structural behaviour of residential building in LDC for Montenegro earthquake.
Figure 6. 26: Progressive evolution of the structural behaviour of residential building in LDC for Erzincan earthquake.
6.2
Evaluation of the ductility demand on steel rebars
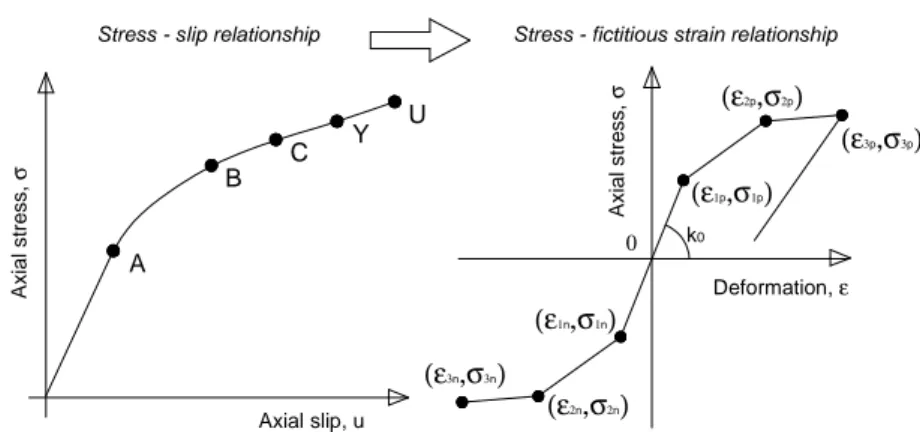
6.2.1 General information and methodology adopted
According to what already presented in Chapter 3, the modified hardening slip model, opportunely derived in order to include the relative bond slip phenomena between steel reinforcements and surrounding concrete, was used as constitutive law for rebars in the models of r.c. case studies. In particular, an axial stress-slip (
u
−
σ
) law was preliminarily derived; then, the shift to an axial stress-strain relationship (σ
−
ε
) was executed through the use of simple practical considerations and adopting the plastic hinge formulation proposed by Panagiotakos and Fardis [78], as briefly summarized in the figure 6.27. The results coming from the Incremental Dynamic Analyses with the natural accelerograms opportunely selected to maximize the seismic response of each structure, provided, at steel fiber level, a stress - fictitious strain (σ−ε*) history; according to the modified hardening slip model in fact, the stresses coming from the analyses coincided with the effective strength on bars due to earthquakes, while the strains were affected by the plastic hinge length, defined, as already presented, according to the formulation provided by Panagiotakos and Fardis [78].400 600 600 400 400 600 600 400 400 600 600 400 6000 3 0 0 3 0 0 3 0 0 3 0 0 1 4 5 0 2 5 0 1000 1001 1002 1003 1004 1005 1006 1007 1008 1009 1010 1011 2000 2001 2002 2003 2004 2005 2006 2007 2008 2009 2010 2011 3000 3001 3002 3003 3004 3005 3006 3007 3008 3009 3010 3011 4000 4001 4002 4003 4004 4005 4006 4007 4008 4009 4010 4011 5000 5001 5002 5003 5004 5005 5006 5007 5008 5009 5010 5011 0.20 g 0.25 g 0.30 g 0.35 g 0.40 g 0.15 g 0.30 g 0.35 g 0.40 g 0.45 g 0.50 g
yielding chord rotation ultimate chord rotation 0.25 g 400 600 600 400 400 600 600 400 400 600 600 400 6000 3 0 0 3 0 0 3 0 0 3 0 0 1 4 5 0 2 5 0 1000 1001 1002 1003 1004 1005 1006 1007 1008 1009 1010 1011 2000 2001 2002 2003 2004 2005 2006 2007 2008 2009 2010 2011 3000 3001 3002 3003 3004 3005 3006 3007 3008 3009 3010 3011 4000 4001 4002 4003 4004 4005 4006 4007 4008 4009 4010 4011 5000 5001 5002 5003 5004 5005 5006 5007 5008 5009 5010 5011 0.20 g 0.25 g 0.30 g 0.35 g 0.40 g 0.15 g 0.30 g 0.35 g 0.40 g 0.45 g 0.50 g
yielding chord rotation ultimate chord rotation 0.25 g
Figure 6. 27: Modified slip model: shift from axial stress-slip law to trilinear hysteretic stress-fictitious strain relationship.
In order to individuate and evaluate the effective seismic ductility demand on steel reinforcements, in terms of both deformation and energy dissipation, an opportune simplified model for the steel bar was elaborated, once again using OpenSees software; the real strains were individuated subjecting the reinforcements to the effective stress history directly derived from the execution of Incremental Dynamic Analyses on plane frame models.
The choice of the model to be used for representing the effective mechanical behaviour of the reinforcements took into consideration all the information presented in the current literature about the structural performance of rebars under low-cycle fatigue, already summarized in Chapter 3. Significative aspects such as Bauschinger effect, hardening phenomena and buckling due to compression axial load were accurately considered. Moreover, the stress histories derived from numerical analyses already took into account the relative bond slip phenomena between steel reinforcements and surrounding concrete, that were not consequently directly introduced in the mechanical model of the bar.
The Menegotto-Pinto model [25], deeply described in Chapter 3, was used for the representation of the effective deformations induced by seismic events, since able to reproduce the cyclic behaviour of reinforcements including Baushinger effect and hardening phenomena, as simply schematized by the figure 6.28.
The Menegotto-Pinto constitutive law was already implemented in OpenSees [75] (Steel02 material, figure 6.29); several parameters were introduced in order to control the transition from the elastic to the hardening branch (R0, cR1, cR2), to include hardening phenomena (a1, a2, a3, a4) and strain hardening ratio (b). The calibration of the above mentioned parameter was executed on the base of the results coming from experimental Low-Cycle Fatigue (LCF) tests presented in Chapter 2; a short description of the results of the calibration process is presented in the following paragraph.
A x ia l s tr e s s , σ Deformation, ε (ε1p,σ1p) (ε2p,σ2p) (ε3p,σ3p) (ε1n,σ1n) (ε2n,σ2n) (ε3n,σ3n) 0 k0 A x ia l s tr e s s , σ Axial slip, u A B C Y U
a) b)
Figure 6. 28: a) Simplified scheme of the Giuffrè-Menegotto-Pinto law (1974), b) modification of the parameter R.
Figure 6. 29: Formulation of the Steel02 material in OpenSees (Mazzoni et al. 2007).
6.2.2 Calibration of the Menegotto-Pinto model
A simple model was elaborated using OpenSees software for representing the effective cyclic behaviour of steel reinforcements under reversal tension-compression cycles. A zero-length element model [75] was used; the mechanical properties selected for the material constitutive law were defined according to the mean values obtained from the experimental tests executed on the corresponding steel reinforcements. Steel02 material model (following the Giuffrè-Menegotto-Pinto law) was opportunely calibrated, providing the most correct values of the already listed parameters.
The simplified model of the steel reinforcing bar was subjected to tension-compression cycles with the same level of imposed strain, in agreement to the mechanical LCF tests executed on the specimens, as presented in Chapter 2. The experimental LCF tests generally showed buckling of reinforcements after the first one/two cycles in compression and, moreover, the progressive deterioration of the rebar leaded to the decrease of strenght, until failure occurred. Obviously, the
A (ε0², σ0²) B (εr², σr²) (εr', σr') (ε 0', σ0') εy E0 Eh S te e l S tr e s s σ s Steel Strain εs (ε0, σ0) (εr2, σr2) (εr1, σr1) (εr3, σr3) (εr4, σr4) σ ε σ0 ε0 R-R 2 R-R 1 0 0.002 0.004 0.006 0.008 20 40 60 fy 80 Strain S te s s [ k s i] R0=20 R0=10 Ep Es
calibration of the simplified zero-length element model was executed considering only the first cycle and the degradation phenomena were not directly taken into account.
As an example, table 6.10 shows the mean values of the mechanical properties of materials coming from experimental tensile tests on steel bars B450C (TempCore process, producer 1, plant 3) diameter 16 mm, and on steel bars B500B (TempCore process, producer 1, plant 1) diameter 16 mm under LCF action with different levels of imposed deformation and free length of the specimen equal to 6φ (High Ductility Class).
The results of LCF tests on the same specimens are briefly presented in the table 6.11, in terms of dissipated energy density, maximum and minimum stress and deformation obtained.
Table 6. 10: Mechanical characteristics of steel bars B450C, 16 mm (prod.1. 3) and B500B, 16 mm (prod.1. 1), TempCore. Steel grade/diameter/ process/rib/producer Spec. D A Rm Re Rm/Re A Agt [n°] [mm] [mm2] [MPa] [MPa] [-] [%] [%] B450C-16-TEMP-R Prod. 1.3 1 16,16 205,00 615,41 517,78 1,19 25,38 13,76 2 16,18 205,71 610,42 507,42 1,20 25,13 14,96 3 16,18 205,59 613,65 516,30 1,19 - 11,96 B500B-16-TEMP-R Prod. 1.1 1 15,93 199,30 671,40 596,58 1,13 21,88 8,07 2 15,89 198,26 670,97 592,79 1,13 22,50 8,07 3 15,74 194,63 665,33 582,67 1,14 22,38 9,26
Table 6. 11: Mechanical characteristics of steel bars B450C diameter 16 mm (producer 1, plant 3), TempCore process.
Steel grade/diameter/ process/rib/producer
φ L0 f Max ε Min ε Max σ Min σ Energy density/1 cycle
mm mm Hz % % MPa MPa] MPa
B450C-16-TEMP-R Pr. 1.3 16 96 2 1,84% -1,86% 529,96 -528,54 29,94
B500B-16-TEMP-R Pr. 1.1 16 96 2 1,93% -1,96% 561,31 -546,47 30,08
In the figure 6.30 the comparison between the results provided by the numerical model and the experimental LCF tests is presented, considering an imposed deformation varying between 1.85% and 1.93%. For the Steel02 material model, the values adopted for R0, cR1 and cR2 were respectively equal to 20, 0.925 and 0.15 (suggested values, according to [75]).
The percentage errors between numerical and experimental results are reported in the tables 6.12 and 6.12; in general the differences in terms energy dissipation were lower than 5%.
a) b)
Figure 6. 30: Formulation of the Steel02 material in OpenSees (Mazzoni et al. 2007) for imposed deformations around 2.2%.
Table 6. 12: Comparison between experimental LCF test results and results coming from the numerical model of the bar for steel grade B450C, diameter 16 mm, TempCore process (producer 1, plant 3).
B450C-16-TEMP-R Prod. 1.3
Spec. φ L0 f Max ε Min ε Max σ Min σ Energy density/1 cycle
[-] mm mm Hz % % MPa MPa MPa
Experimental
1 16 96 2 1,84% -1,86% 530,0 -528,5 29,9
Numerical model 1,85% -1,85% 517,6 -517,6 29,5
Error [%] - - - - 0,34% 0,60% 2,40% 2,11% 1,61%
Table 6. 13: Comparison between experimental LCF test results and results coming from the numerical model of the bar for steel grade B500B, diameter 16 mm, TempCore process (producer 1, plant 1).
B500B-16-TEMP-R Prod. 1.1
Spec. φ L0 f Max ε Min ε Max σ Min σ Energy density/1 cycle
- mm mm Hz % % MPa MPa MPa
Experimental test
1 16 96 2 1,93% -1,96% 561,3 -546,5 30,1
Numerical model 1,93% -1,93% 582,0 -582,5 31,5
Error [%] - - - - 0,21% 1,38% 3,55% 6,18% 4,47%
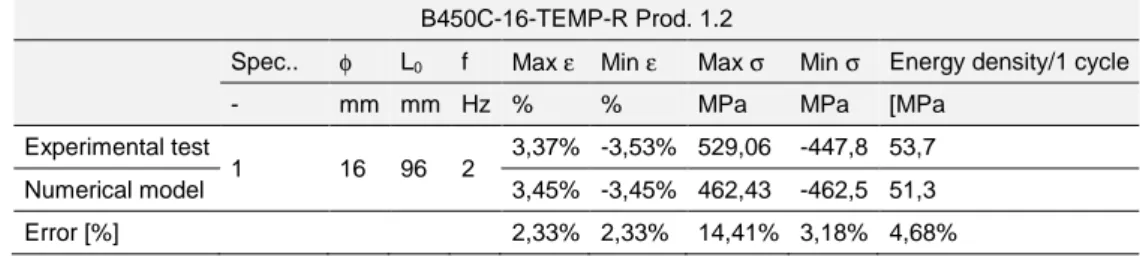
A similar situation was obtained also from the comparison between the experimental and the numerical results on steel bars B500B, diameter 16 mm (TempCore process, producer 2) for higher level of imposed deformation, as presented in the figure 6.31.
In the figure 6.31 the comparison between the results provided by the numerical model and the experimental LCF tests is presented, considering an imposed deformation of about 3.5%. For the Steel02 material model, the values were adopted for R0, cR1 and cR2 were respectively equal to 20, 0.925 and 0.15. The percentage errors between numerical and experimental results are reported in the tables 6.15 and 6.16; in general the differences in terms energy dissipation were lower than 5%. -600 -400 -200 0 200 400 600 -2,50% -1,50% -0,50% 0,50% 1,50% 2,50% S tr e s s [ M P a ] Strain [%] Numerical model Experimental test -600 -400 -200 0 200 400 600 -2,50% -1,50% -0,50% 0,50% 1,50% 2,50% S tr e s s [ M P a ] Strain [%] Experimental test numerical model