2 Introducing Social Network concepts
In this section we will introduce the basic concepts behind social networks1. We will start with social network analysis, focusing on the
main concepts we used to model the mobile social platform. We will then introduce the concept of social network website, and the mobile usage patterns of our interest.
Last, but not least, we will introduce the REST application model and some of the most common protocols, formats and APIs (Application Programming Interface) used in this work.
2.1 Social Network Analysis
A social network is “a set of people or groups each of which has
connections of some kind to some or all of the others” [1]. People or
groups are called “actors” and the connections “ties”. The definition of actors and ties depends on the questions of interest. In our study an actor is a social platform user. Ties will be the interactions mediated by the social platform.
Networks necessarily consists of a finite set of actors. This can be due to nature of the research study or, mainly, to analytical requirements. This poses the problem of sampling a group representative of the 1 The introduction to social network analysis has been taken from [1] and [2].
population which is object of the investigation and the problem of setting the constraints of this sample.
Many proposals have been made to solve these problems. To specify boundaries in social network studies two different approaches were proposed: the realist approach, where subjects have some kind of shared knowledge of the network as a social entity, and the nominalist
approach, where boundaries are defined by the research aim.
When the boundaries cannot be defined at the beginning, one technique commonly used is the snowball sampling. In snowball sampling the first step is to choose a small number of actors among the set of the potential ones. The second step consists in each selected actor to report on the actors to whom it has a link, according to the relation under study. The first actor is called ego and the actors chosen from him constitute the “first-order zone” of the network. The same process can be iterated on each actor lying in the first-order zone and so on. For every k step we will have a “k-th order zone”.
The fundamental problem is that whatever be the sampling procedure there is always the risk to alter or loose relations inside the considered group.
An important distinction is often made in literature between “complete
network built on the basis of an ego, like we have seen in the snowball sampling. The entire network is referred by the ego as every relation is reported by him. A complete network instead is built on a sample of nodes from a population, with any relation considered for every node composing the network.
In Social Network Analysis (SNA) the graph theory plays a central role. Actors may be represented by nodes and the connections, or relations, are represented by linkages between nodes, with the set of relations potentially infinite.
In SNA the object of observation are the relations between actors and their structure instead of the actors themselves. Two types of variables can be studied: structural variables, which are the most important in SNA because they represent the different kinds of ties between social actors, and composition variables, which can be seen as actors' attributes.
There are two different interdependent perspectives from which social networks can be observed: the graph theory and the algebraic theory of semi-groups. Both share the notion of relation:
Definition 1: A relation R over the sets X1, …, Xk is a subset of
For the sake of simplicity we will consider only the simplest form of network, a binary network, on the set of actors X.
We can represent a social network in three different ways. The first is a list of all the elements taken from the set of actors and the list of the pairs of elements linked by a social relationship:
T a ble 1 : T w o relatio ns o n t h e sa m e set X
The same relationships and set can be represented in a second way using the graph theory. Every actor is represented by a vertex of the graph while each pair in a relation can be represented by an edge:
The third description has the form of a matrix:
A={x1, x2,x2, x1,x2,x3,x3, x4,x4, x1} B={x1, x2,x2,x3, x3, x4,x4, x1}
X={x1,x2, x3, x4}
x1 x2 x3 x4
x1 0 1 0 0 x2 1 0 1 0 x3 0 0 0 1 x4 1 0 0 0
T a ble 2 : Matrix re prese n t a tio n of t he relatio ns hip A
There are other kinds of networks. One of these are “valued
networks”, characterized by a relation R assuming possible values
different from 0 and 1. The most general binary case is that of a multiple valued network:
Definition 2: Let X represent a set of n social units, and let
vki , j be the value of the Rk relation from unit i to unit j in
X. Rk can be considered as:
a) a valued directed graph where nodes are the elements of X and edges of type k, with value vki , j , directed from node i to
node j;
b) a valued relation, assigning vki , j to the ordered pair i , j; c) an n×n matrix, where entry i , j assumes the value vki , j.
Even if it would be possible to consider relations with arity more than 2 binary relations include the vast majority of the proposed and applied models in the social networking literature.
Both the graph representation and the matrix representation are useful to study social networks and give use the ability to construct graph theory based models and algebraic models respectively. Recently new models have been developed to study the evolution of a social network over time. Models that constitute the field of Dynamic Network Analysis (DNA).
In the following we will only consider graph based models. 2.1.1 Graph representation of social networks
Being a mathematical theory, graph theory gives social network analysis a tool to quantify and measure properties of a network. Graphs are one of the clearest way to represent and detect the structure arising from relations connecting different actors in a social group and they also provide an immediate interface to find and understand the way individuals are connected in the network.
First of all we have to define the kind of relations we are interested in to study.
We will investigate only binary relations, so we will look at only a couple of individuals a time. We will not consider reflexives relations. Finally we will consider directed and undirected relations. In analysing an undirected relation we will use a graph to represent it. Otherwise, if the relation is a directed one we will use a directed graph (a di-graph).
More formally speaking, in a graph there is no difference between the lines lk=ni,nj and lh=nj,ni between two nodes ni and nj. This
implies in turn that any undirected relation is also a symmetric relation (e.g.: “colleague of”).
In a di-graph, instead, there is difference between lk and lh. A
di-graph, in fact, consists of a set of nodes and a set of directed lines between the nodes. Every couple of connected nodes is an ordered couple.
We will indicate that the edge lk is directed from the node ni to the
node nj by writing lk=〈ni,nj〉. We can refer to ni as the sender and
to nj as the receiver. Hence, in a di-graph, lk≠lh.
Another important and straightforward concept is that of a subgraph. A graph Gs is a subgraph of a graph G if the nodes of Gs are a
subset of the nodes of G and the edges of Gs are a subset of the
edges of G.
Some subgraphs are so important in social network analysis to deserve a name. This is the case of dyads and triads. A dyad consists of a pair of nodes and the edges connecting them. A triad consists of a triple of nodes and the edges connecting them. Dyads and triads are important because they are particular cases of node-generated subgraphs.
The last concept to introduce is that of a clique. A clique is the
maximal complete subgraph composed by at least three nodes. It is
complete in the sense that each node in the clique is adjacent to all the other ones in the clique and maximal in that there are no nodes not included in the clique which are also adjacent to all the nodes in the clique. This definition of clique is usually referred to as a maximal clique and it represents the most restrictive cohesive subgroup using graph theory.
Cohesive subgroups are important because its members are supposed to “share information, have homogeneity of thought, identity, beliefs,
behaviour, food habits and illnesses”2.
Other kinds of cohesive subgroups have been investigated for graphs and di-graphs but we will not treat them here.
2 See Sergiy Butenko, Clique Relaxation Models of Clusters in Networks, available at http://ie.tamu.edu/people/faculty/butenko/yalta/slides/Butenko.pdf
2.1.2 Quantitative indexes
We are now able to introduce the main quantitative indexes we can find in a network using the graph theory.
Let it be g the number of vertices and L the number of edges in the graph.
The first index is the nodal degree. In a graph, the nodal degree of a node n is the number of edges incident with n. The mean nodal degree of a graph G is defined as d=2L /g and represents the mean number of edges incident with each node. In di-graphs we have to distinguish between the in-degree, the number of lines in which the node is the receiver, and the out-degree, the number of lines in which the node is the sender. While the in-degree and the out-degree differs in general node by node, their mean values are equals:
di=do=L / g
where di is the mean in-degree and do is the out-degree.
The nodal degree gives information on how many ties each actor has. In di-graphs we can see if the actor is mostly a sender or a receiver in the relation.
Nodal degree is also important in identifying the most central units in a network or, in social network analysis terms, the centrality and
prestige of them. Centrality is used in graphs while prestige is used in di-graphs. We can define two different types of prestige: influence and support. The first is defined on outgoing edges, the latter in ongoing ones.
There are many definition of centrality, but we will consider the most simple and straightforward definitions. The absolute centrality may be defined as:
cDni=degni
where degni is the degree of the node ni. To be of some use, this
value should be normalized in a way where a value of 0 will be the smallest value of centrality and 1 the highest possible one3. We can
then define the relative degree centrality as:
CDni=cDni g−1
where g−1 represents the highest degree possible in a network with
g nodes. The same centrality measure can be used as a measure of prestige distinguishing influence, where we will consider the out degree, and support, where we will consider the in degree.
Other measures of centrality are defined on the basis of the closeness or on the betweenness of an actor to other ones in the network. It is also possible to define an index of network centralization.
For what concerns the mean degree it can be read as a first index of connectivity in the network: the highest the value, the highest the connectivity.
As centrality relates to nodes, the density index is related to edges. The density gives us a measure of how much lines exist in the network:
= L
[gg−1/2]
where the denominator is the maximum possible number of edges in the graph. For di-graphs we have a similar definition:
d= L gg−1
Density gives us an immediate idea of how much the actors in the network are connected to each other: the higher the density the more the actors are connected to each other.
Another important index is the diameter: the maximum geodesic distance between any pair of nodes. The geodesic distance between two nodes is defined as the shortest path between them. The problem is that the diameter can be calculated only if the graph representing the network is connected. Otherwise the diameter value is not defined. To overcome this problem, other less restrictive definitions of diameter have been proposed so that they may be computed on not connected graphs (or di-graphs). An example of such an index is the mean geodesic value, calculated using only reachable pairs of nodes. Whatever the definition used the diameter gives us a gist of how much a graph is dispersive: the higher the diameter the more the graph is dispersive.
Another important notion is that of structural balance: a group is structurally balanced if, considering the actors ni and nj, if they like4
each other they both like and dislike the same other people and if they dislike the each other, they disagree on liking evaluations of all other people.
4 Like means that the relation under study between the actors is associated with a positive meaning. At the same time, dislike will be associated with a negative meaning, according to the relation itself.
In general the whole graph is hard to be structurally balanced. Anyway we can find balanced sub graphs in it. We will refer to these balanced subgraphs as clusters.
A different notion of cluster is given in [3] by Watts and Strogatz. They propose a “Clustering coefficient” as a good measure if a network is to be considered a small world5 or not. The clustering
coefficient is defined as follows: “suppose that a vertex v has kv
neighbours; then at most kvkv−1/2 edges can exist between them.
Let Cv denote the fraction of these allowable edges that actually
exist. Define C as the average of Cv over all v.”
In the same article, Watts and Strogatz show that if a network is higly clustered, it has the characteristics of a small world network. Many researches are aimed at discovering if the web is a small world or not and this index is a valid resource to investigate the subject.
This concludes our overview of social network analysis and graph theory modelling. Before introducing social network websites we would like to show two interesting findings of social network analysis
5 In 1967, Stanely Milgram, a researcher at MIT, conducted a set of experiments in the U.S. to learn more about the probability that two randomly selected people would know each other. Results shown that people in the United States were separeted by about six people on average. This conclusion is commonly referred to as “six degrees of separation”. Further details on the small world phenomenon can be found at http://en.wikipedia.org/wiki/Small_world_phenomenon.
in the so called blogosphere6 and on the behaviour of users inside
networks.
In [4], Ackland proposes a distinction between two types of blogs:
authorities and hubs. Authorities are “highly-referenced pages on a particular topic” while hubs are “pages that point to the authorities (and thus confer authority)”. Hubs and authorities are mutually related
in that a good hub points to many good authorities and, vice versa, a good authority is pointed to by many good hubs.
For what concerns users behaviour, in [5] Adamic and Adar found that reaching a person in a network is easier when the network is hierarchically organized and well defined and its structure is well known to each member of the network.
It is also interesting the study conducted by Licoppe and Smoreda in [6] on the relation between social networks and technology. One of the most interesting result of the research is that most recent media are often centred on the phatic7 function of communication, especially in
instant messaging like media. The authors also propose that there is the risk that the ties with friends may “become institutionalized in the
form of expectations and mutual obligations to be constantly available electronically”.
6 The community of all the web logs existing on the internet.
7 An expression whose only function is to perform a social task. The term was coined by the anthropologist Bronislaw Malinowsky.
Now that we have established a background on the theories on social networks we can introduce the concept of social network website.
2.2 Social Network Websites
According to Boyd and Ellison [7] social network websites are
“web-based services that allow individuals to (1) construct a public or semi-public profile within a bounded system, (2) articulate a list of other users with whom they share a connection, and (3) view and traverse their list of connections and those made by others within the system”.
In other words, a social network website offers three basic services: profile building, connections with other users listing, connections traversing and viewing.
A social network website focuses in making visible the social network the user is embedded in. While it is still possible to use social network services to establish a relationship with people that otherwise one could never have been met, this is not always the case. On many social network websites users are mainly interested in communicating with people they already know. A typical example of a system where this usage pattern is prevalent is Facebook.
A social network website user must have a profile. The profile collects basic information about the user (age, country, contact information), its likings, a short description of itself and so on. Social network
websites differentiates on the basis of what the user can include in its profile, but all have a list of the connections the profile owner has with other users in the system. This list may be public or not, depending on user preferences and service provider.
After the profile submission, the user starts searching for connections in the social network website. Some sites try to suggest relationships on the basis of what the user typed in its profile. A good example of this is Facebook, that searches for people that made the same school of the user or that affirm to be in the same firm of the profile owner. Most social network websites ask the other side of the relationship to confirm the relationship itself, while some do not.
The most successful social network websites offer messaging like services. These messages can be private messages, intended to be read by the profile owner only, or can be public, letting all user profile visitors to read them. This second kind of messages is sometimes referred to as “comments”.
Most popular social network sites offer video and photo sharing, RSS aggregation, personal blog embedding and other means of integration with third party offered web services. The most interesting feature some social network sites offer to respond to a social network service user needs of novelty is to provide third party software developers a
software platform on which developing their own extensions. We will recall this feature when we will talk about Facebook.
A last important thing to note is how users interpret the “friend” facilities in social network websites. Golder, Wilkinson and Huberman[8] have shown how messaging interactions are much near to the concept of friend than friend links because of the sender investment of time and energy. They also proposed messaging as a measure of user activity. Friend links can have different meanings. Users may wish to add friends just for fun, to show others how much they are social if this is not in contrast with the social network social norms or for any other reason. What seems to be true is that, generally speaking, enlisted friends in a social networking website user profile does not necessarily assume the same meaning we give in the “real” life.
2.3 Mobile social networks
Mobile social network services (MSNS) differ from social network websites in the supporting device: a mobile device. This difference has relevant impact on what services to provide and how to the final user. The most important device in considering mobile social network services is the mobile phone, especially the so called smartphones.
There is not a standard industry definition of smartphone. The idea is that a smartphone is a mobile phone capable of internet access, installing and running third party applications, it has an identifiable operating system and a default set of applications that range from a complete personal organizer to an email client.
Some smartphones also differentiate from common mobile phones for their user interface : extended keyboard, touch screen, camera to grab videos or pictures and so on.
The class of smartphones we are interested in are all those capable of accessing the Internet and running J2ME applications. These are the minimal relevant characteristics considered in our classification of smartphones since these are the minimal requirements needed to run the social network service client we will develop.
Now that we have defined what a smartphone is, we can focus on mobile social network services. In a recent paper [9], Humphreys conducted a year-long qualitative study on Dodgeball, a mobile service that distributes location-based information of users to allow them to meet up easily within city. The study was based on a sample of Dodgeball early adopters and was focused on “the nature of
interactions that develop around a MSNS” and “how these interactions change the way users think about and experience public spaces”.
Humphreys observed that her informants “represented a narrower
demographic than social network site users” and did not find anything
relevant about MSNS to be widely adopted by common users or if current Dodgeball user will continue to use it.
Anyway she reports on interesting findings on the nature of interactions. All interactions between Dodgeball users are enacted through text messages. Users can notify friends of their current position in the city by means of check-in messages (messages stating where the user is at the moment, like “@Boe's”).
Dodgeball users used check-ins to accomplish “coordinative,
performative and cataloguing” purposes. Having observed the success
of check-ins Humpreys suggests that the future MSNS “might
integrate social and spatial cataloguing functionalities into their designs”.
Finally, she also noticed that the mean size of the social network in Dodgeball was 40 friends, ranging from 1 to 149. Really small compared to the mean size in social network sites, which typically run two orders of magnitude higher.
Existing social network websites propose to their user base mobile services. We may not consider them as mobile social networks since
they act merely as mobile clients to social network websites and does not provide a set of functionalities tailored to mobile only users.
2.4 Factors affecting the adoption of mobile data
services
Mobile Data Services (MDS) are “all non-voice value-adding services
accessible through mobile networks that are designated to augment end-user experience with mobility and enrich mobile business models for operators, service providers and other industry constituents”[10].
Typical examples include m-commerce, mobile stock trading or mobile web browsing.
While the development of mobile data services has been intensive their adoption rate has not been as good as expected. The third generation telephony has come with the promise of being the technology that will create new business opportunities and generate revenues from mobile services.
Carlsson et al. [11] investigated on the relationship occurring between technologies and service adoption from the perspective of technology acceptance in Finland. To conduct their empirical study they used the Technology Acceptance Model (TAM) slightly modifying it.
According to TAM, when users are presented with a new software two factors influence their decision about how and when they will use it:
● Perceived usefulness: “the degree to which a person believes
that using a particular system would enhance his or her job performance”; [12]
● Perceived ease of use: “the degree to which a person believes
that using a particular system would be free from effort”. [12]
Carlsson added the enjoyment and new possibilities factor, which takes into account MDS like ring tones, icons, wallpapers and games and considered the adoption of mobile data services to involve “both
the acceptance of new, service enabling mobile phones and the acceptance and use of the services ”.
Phone types have been classified in GSM (51% of the total8), WAP
(12,7%) and Advanced Phones, which includes GPRS, MMS capabilities and smartphones (36,3%). For services, four classes have been considered: Communication (SMS, Mobile email and MMS), Entertainment (Icons and logos, wallpapers, games...), Reservations and Purchases (Payment, Ticket reservations, Shopping...) and Information (News and Weather, Search services, Internet browsing...).
The most regularly used services, without considering the phone type, is SMS (91.6%), followed by search services (35.5%) and ring tones (17.0%). News and weather get a 9.7% of regular use.
Things change, except for SMS, if we consider the use of mobile services according to technology9. The more advanced the phone in
use the more MDS are used. Some service use though is independent from the technology, like SMS or search services.
Interesting to note is the use of news and weather on advanced phones (39.7% against 16.6% on basic GSM phones) and mobile email (37.4% against 11.3%). Icons and logos and ring tones services were being used by about the 72% of respondents.
For what concerns usage patterns of MDS, an interesting model for studying the factors affecting them has been proposed by Bina, Karaiskos and Giaglis [10]. They reintroduced the Triandis theory of explaining human behaviour to develop a model to understand “the
‘why’ behind the decision to use MDS or not”.
Triandis [13] proposed to separate affective from cognitive components of attitude. Behaviour can be determined from habit, facilitating conditions and intention, the latter being predicted from social factors and cognitive and affective evaluation of an act.
These terms were defined by Triandis[10] this way:
● Affect consists of “the feelings of joy, elation, or pleasure, or
depression, disgust, displeasure, or hate associated by an individual with a particular act ”;
● Social Factors are defined as “an individual’s internalization of
the reference group’s subjective culture and specific interpersonal agreements that the individual has made with others, in specific social situations ”.
● Perceived consequences reflect “the certainty that a behaviour
is having some consequences with value to the performer ”. An
high perceived value of the consequences of a behaviour will result in an incentive to perform the act.
● Habit is “a behaviour that is or has become automatic in a
given situation ”. The more the frequency of a behaviour the
more the higher the influence of habit to predict the behaviour.
● Facilitating Conditions groups “the objective factors, out there
in the environment, that several judges or observers can agree make an act easy or hard to do ”.
The Behaviour is the outcome of intentions, habit and facilitating conditions.
To apply the model to MDS Bina, Karaiskos and Giaglis “combined
extant knowledge on the unique features of MDS with the original conceptualizations offered by Triandis to inform an updated set of factors determining individual behaviour towards MDS ”[10]. The
behaviour under study is the decision to use MDS or not.
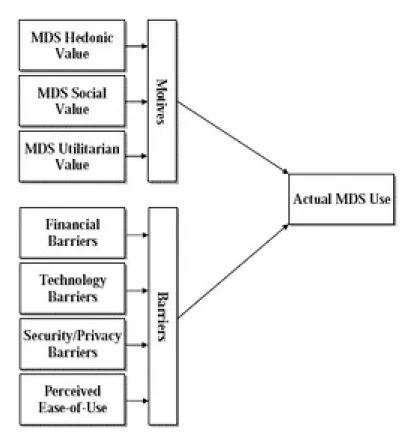
They identified a set of concepts and divided them into those having a positive effect (motives) and those having a negative effect (barriers). The resulting model is shown in figure 1.
The MDS Hedonic Value can be associated with affect. Entertainment services or new ways to perform conventional tasks (live video calls) are two examples of how MDS produce affective reactions from users. The MDS social value maps the social factors of the Triandis model. This is justified with the fact that individuals seek innovations as a way to achieve social differentiation and uniqueness.
The MDS Utilitarian Value maps the notion of perceived consequences.
Financial Barriers have to be ascribed to “confusing billing schemes and hidden costs due to the dependency on versatile network connections reliant on signal strength”[10].
Technology Barriers takes into account lack of signal coverage, lack of reliability or network downtime, just to cite some examples.
Figure 2 : Model for st u d yi n g t h e MDS u s a g e p a tter ns p ro posed b y Bin a, Kar aiskos a n d
Security and Privacy barriers refers to user being concerned about privacy and security issues in using MDS.
Perceived ease of use reflects “the degree to which a person believes
that using a particular system would be free of effort”. It takes into
account ease of use of both using MDS and operating devices.
Applying the model to a survey conducted in Greece gave interesting empirical results. MDS users see MDS capable of enhancing utilitarian and hedonic aspects of their lives while the most important barriers to the adoption of MDS are privacy/security and financial concerns.
Other findings have been made on what makes some services appealing or what are the most relevant barriers. MDS where split in 4 service categories: mobile commerce, communication, information and entertainment services. People in the survey have instead been divided in users and non users of each service category.
It results that m-commerce users are attracted by utilitarian and social value while non users find financial barriers as the strongest barrier in adopting it.
For what concerns communication services, users receive hedonic and utilitarian value while ease of use and financial barriers hinder non users.
Information and Entertainment services users receive value from all the three value dimensions while financial barriers inhibits again non users for information services.
The final consideration is that “the adoption and usage of MDS is
dependent on the value-for money dimension of respective consumer offerings that is further shaped by the experiential nature of MDS”[10].
2.5 REST Design Pattern
REST10 is “an architectural style11 for distributed hypermedia
systems”[14]. The REST architectural style may be viewed as the composition of serveral architectural styles, with the respective constraints:
● Client-Server: with the result of improving UI portability, server
simplification and the enabling of multiple organizational domains. Furthermore, the client and server components may evolve separately if the interface does not change;
● Stateless: poses the constraint of a stateless interaction between
client and server components. This degrades the efficiency since the client has to specify its state for each interaction, but 10 Representational State Transfer.
11An architectural style is “a coordinated set of architectural constraints that restricts the roles
and features of architectural elements, and the allowed relationships among those elements, within any architecture that conforms to that style” [14].
simplify the server and improves scalability (no session state is stored on the server) and reliability (it's easier to recover from failures).
● Caching: previous responses may be reused in response to
identical requests. This degrades reliability (cached data may be different from those retrieved by sending a request to the server) but improves scalability and efficiency and reduces the average latency.
● Uniform interface: add the constraint of components having an
uniform interface between them. This improves the visibility12,
decouples services from their implementation and grants independent evolvability.
● Layered System: each component cannot see beyond the
immediate layer with which it is interacting. Though layered systems add overhead and latency they allow for load balancing, improve scalability and simplify clients.
● Code on demand: allows client functionality to be extended by
downloading and executing code in the form of applets or scripts . This simplifies clients, improves extensibility tough reduces visibility.
12 Here visibility is “the ability of a component to monitor or mediate the interaction between
REST poses emphasis on an uniform interface between components. In order to obtain it five interface constraints are defined:
1. Identification of resources by one resource identifier mechanism;
2. Manipulation of resources through the exchange of representations;
3. Exchanges occur in self descriptive messages; 4. Access methods mean the same for all resources. 5. Hypertext as the engine of the application state.
Resource is the key abstraction of REST. A resource R is “a
temporally varying membership function MRt which for time t
maps to a set of entities, or values, which are equivalent”[14]. The
elements in the set may be resource representations or resource names. Resources may be static or dynamic: static resources always corresponds to the same value set while dynamic ones corresponds to values sets that varies with time. What must be static is the resource semantics.
Every resource has an identifier which must be unique and refer to a single resource. Interactions with resources occur by using a uniform interface.
Resource representations allows to manipulate the resources themselves. This means that we do not act directly on the resource, but on one of its representations. Resource representations may be suitable for human or for machine to machine interaction. In our work we will be interested in the second type of representations.
For what concerns Hypertext as the engine of the application state, a successful response contains a representation of the state of the identified resource. Some of these representations may contain links to next application states. Each steady state represents the current application state.
Having presented REST it is time to understand how it is applied in practice.
The first application of REST was to design the modern Web architecture (URI and MIME RFCs are an example of an exact correspondence with the REST model). To be precise, REST was realized as a model of how the World Wide Web should work. This makes it a good model for building web applications too.
REST has been used in many web applications. Many popular frameworks have been developed to support the development of RESTful applications.
Building web applications the rest way makes it easy to provide APIs for third party applications since it is only required to provide machine readable representations of an application state.
Furthermore, many RESTful applications are built so that they have human readable URIs which results in making it easy to understand the APIs themselves if available.