CHAPTER 4 Phenotypic changes and signaling pathway of
GPR17-expressing neural precursor cells during oligodendrocyte
differentiation
As mentioned in CHAPTER 1, in both brain and spinal cord, GPR17 decorated a subset of olygodendrocyte precursor cells. These cells are the myelinating cells of CNS and the end product of a cell lineage which has to undergo a complex and precisely timed program of proliferation, migration, differentiation, and myelination to finally produce the insulating sheath of axons.
In the spinal cord, most oligodendrocytes derive from a specialized domain of the ventral ventricular zone, which first gives rise to motor neuron precursors, and then, after the neurogenic/gliogenic switch, to oligodendrocyte precursor cells/progenitors (Lu et al., 2002; Sun et al., 1998; Takebayashi et al., 2002; Zhou and Anderson, 2002). From there, OPCs migrate all through the spinal cord and finally differentiate into myelin-forming oligodendrocytes.
In the forebrain, the first OPCs originate in the medial ganglionic eminence and anterior entopeduncular area of the ventral forebrain. These OPCs populate the entire embryonic telencephalon including the cerebral cortex, and are then joined by a second wave of OPCs derived from the lateral and/or caudal ganglionic eminences. The third wave of OPCs, finally, arises within the postnatal cortex. These different populations of OPCs are functionally redundant: When any one of them is destroyed at source by the targeted expression of a toxin gene in mice, the remaining cells spread into the vacant territory and restore the normal distribution of OPCs. As mentioned above, oligodendrocyte development in vitro progresses through distinct stages characterized by specific antigenic phenotypes; early oligodendrocytes progenitors are characterized by their expression of platelet derived growth factor receptor alpha (PDGFRα) and NG2 proteoglicans (Pringle and Richardson, 1993; Pringle et al, 1992), while multipolar, postmigratory, proliferative cells could be identified by the marker 04. Then, loss of these traits and the emergence of galactocerebroside (GalC or O1) expression (Fok-Seang and Miller, 1994; Noble et al., 1988) signal terminal differentiation into premyelinating oligodendrocytes. In a few days, mature oligodendrocytes develop with the regulated expression of terminal markers (such as myelin basic protein MBP, proteolipid protein PLP and myelin oligodendrocyte glycoprotein MOG), the synthesis of myelin proteins membrane and elaborate sheet-like membranes (Duchala et al.,
Olig2, are expressed by oligodendrocytes as they progress from precursor to mature myelinating cells and are essential for their specification (Nery et al, 2001).
Particular interest has been generated over the years by the progenitor population expressing the proteoglycan NG2. In both the grey and white matter of adult CNS, there still remain many NG2+ stem-like cells that serve as OPCs and as the primary source of remyelinating cells in demyelinated lesions. These cells (polydendrocytes), which are the majority of proliferating cells in the adult brain and spinal cord, actually represent a peculiar type of multifunctional cells, since, under specific conditions, they can also give rise to neurons and astrocytes (Nishiyama et al., 2009). Moreover, lineage tracing studies indicate that some NG2+ cells in the mature brain cease proliferating and rarely, if ever, undergo differentiation (Rivers et al., 2008). Finally, some NG2+ cells might also generate action potentials (De Biase et al., 2010) and physically interact with axon terminals filled with synaptic vesicles, leading to the novel concept of neuron-polydendrocyte synapses. NG2+ cells thus represent a heterogeneous population of precursors whose complete characterization would benefit from the identification of new markers mapping specific functional/differentiation stages.
It's clear that studies of the mechanisms that regulate progenitor survival, migration, and proliferation, both in normal and pathological conditions may be helpful in the search for therapeutic treatment of demyelinating diseases. In this context, the availability of precursor cells in which GPR17 is naturally expressed, to study “in vitro” the mechanisms of oligodendrocytes differentiation assumes great importance in shedding light on the role of GPR17 in differentiation and in the process of myelin production by oligodendrocytes.
Experimental section
Introduction
The membrane G-protein-coupled receptor GPR17 has been identified as a new key player in oligodendrocyte differentiation (Lecca et al., 2008); in primary cortical neuron-glia cultures, this receptor is expressed by OPCs together with typical pre-oligodendroglial markers like NG2 and O4 (Lecca et al., 2008). Both in vivo and in
vitro, colocalization of GPR17 with markers of mature myelinating oligodendrocytes (e.g., myelin basic protein, MBP) was found to a very small extent (Lecca et al., 2008). Important from a functional point of view, we also originally showed that the pharmacological manipulation of GPR17 with its ligands fosters the progression of pre-oligodendrocytes toward mature myelinating cells (Lecca et al., 2008). Accordingly, GPR17 forced over-expression inhibits OPC differentiation and maturation, and, conversely, GPR17 knock out mice show precocious onset of myelination (Chen et al., 2009).
However, more data are needed to explore in detail the time-dependent changes of GPR17 during OPC differentiation, its presence at specific maturation stages and its role in the proliferation and multi-facet functions of NG2+ cells. Moreover, despite extensive signaling studies on recombinant GPR17 in various heterologous expression models suggesting GPR17 coupling to both cAMP formation and, under certain circumstances, to calcium increases (Ciana et al., 2006; Lecca et al., 2008; Pugliese et al., 2009), no data are available on the signaling mechanisms and second messengers utilized by the natively occurring receptor in OPCs. The relatively low number of OPCs (approximately 5-10%) in the previously utilized neuronal-glia cultures (Lecca et al., 2008) has hampered the functional characterization of GPR17 and of its signaling. On this basis, the present study was undertaken on purified OPCs from rat cortex to characterize GPR17 expression during spontaneous in vitro differentiation, to fully define the immunophenotype of GPR17-expressing cells and to unveil the signaling pathways of the native receptor.
Methods
Primary OPC cultures. OPCs were isolated from mixed glial cultures from embryonic (E19) or postnatal day 2 Sprague-Dawley rat cortex, by shaking method, as described (12- 14). OPCs were plated onto poly-D,L-ornithine (final concentration 50 µg/ml, Sigma-Aldrich, Milan, Italy) coated 13mm or 24mm glass coverslips for immunocytochemistry, single cell RT-PCR (1.5 x 10⁴ cells/coverslip) or calcium imaging studies (8 x 10⁴ cells/coverslip) in Neurobasal with 2% B27 (Invitrogen, Milan, Italy), 2 mM L-glutamine, 10 ng/ml human platelet-derived growth factor BB (Sigma-Aldrich) and 10ng/ml human basic fibroblast growth factor (Invitrogen) to promote proliferation. After one day, cells were switched to a Neurobasal medium lacking growth factors to allow differentiation. The 87.6 ± 2.9 % of cells was positive for the Olig2, (n=4900, from 5 independent experiments); a very low percentage of contaminating astrocytes and microglia was found.
Immunocytochemistry. Primary OPCs were fixed at room temperature with 4% paraformaldehyde in 0.1 M PBS; Euroclone. Double labeling was performed using the in-house made anti-GPR17 polyclonal antibody (1:100; 2.5 h at RT) with the selected primary antibodies in Goat Serum Dilution Buffer (GSDB; 450 mM NaCl, 20 mM sodium phosphate buffer, pH 7.4, 15% goat serum, 0.3% Triton X-100). The following primary antibodies were used: mouse anti-NG2 (1:200, Abcam, Cambridge,UK), rabbit Olig2 (1:600,Chemicon, Millipore, Milan, Italy), mouse anti-O4 (1:100), mouse anti-O1 (1: 500), rat anti-MBP (1:200) (all from Chemicon), mouse anti-phospho histone H3 (PH3, 1:500, Cell Signaling, Danvers, MA). Double-labeling with anti-O4 was performed using detergent-free buffers. When co-staining with primary antibodies developed in the same species was done, GPR17 was detected with the high-sensitivity tyramide signal amplification kit (Perkin Elmer, Milan, Italy). Cells were then incubated for 1 hour at RT with the secondary goat anti-rabbit and goat antimouse antibodies conjugated to AlexaFluor 488 or AlexaFluor 555 (1:600 in GSDB; Molecular Probes, Invitrogen). An additional step with the UV fluorescent dye Hoechst-33258 (1:10000, Molecular Probes, Invitrogen, Milan) for the nuclei labeling was performed. Coverslips were finally mounted with a fluorescent mounting medium (Dako, Milan), and analyzed as described (Lecca et al., 2008). The total number of cells counted for any given condition is indicated as “n”.
Western blotting analysis. Whole cell lysate were prepared and analyzed by Western blotting as previously described (Lecca et al., 2008). Briefly, approximately 30 µg aliquots from each protein sample were loaded on 12% or 6% sodium-dodecylsulphate polycrylamide gels, and blotted onto nitrocellulose membranes (Bio-Rad Laboratories, Milan, Italy). Filters were saturated with 5% non-fat dry milk or 5% BSA in Tris-buffered saline (TBS; 1mM Tris-HCl, 150 mM NaCl, pH 8) overnight at 4°C. Membranes were then incubated 2 h at RT with a rat anti-PLP/DM20 antibody (1: 250 from Chemicon) and with rabbit anti-PDGFRα polyclonal antibody (1:250, Thermo Scientific) diluted in TBS plus 0.1%Tween and 5% milk or 5% BSA, respectively. Filters were then washed in TBS plus Tween20, incubated for 1h with anti-rat, or rabbit secondary antibodies coniugated to horseradish peroxidase (1:30,000, Sigma-Aldrich). Specific signals were detected using the ECL immunoblotting detection system (Thermo Scientific). These experiments were performed in collaboration with Marta Fumagalli, University of Milan, Italy.
Intracellular calcium measurements. Intracellular calcium imaging experiments were performed after 6 days in culture as previously described (Fumagalli et al., 2003). Briefly, cells were loaded with 2 mM Fura-2 pentacetoxy methylester in Krebs–Ringer solution, washed and transferred to the recording chamber of an inverted microscope (Axiovert 100; Zeiss, NY) equipped with a calcium imaging unit. In some experiments, agonists were applied in calcium-free medium. Polychrome IV (TILL Photonics, Germany) was used as the light source. Fura-2 and EGFP fluorescence images were collected with a PCO Super VGA SensiCam (Axon Instruments, Forest City, CA) and analyzed with the Axon Imaging Workbench 2.2 software (Axon Instruments). Images were acquired at 1–4 340/380 ratios/s. The following pharmacological agents were tested: ADP, UTP, UDP, UDP-glucose (Sigma-Aldrich), all at 100 µM. LTD4 (Cayman Europe, Estonia) was also utilized (100 nM). The total number of cells analyzed for any given condition is indicated as “n”. These experiments were performed in collaboration with Marta Fumagalli, University of Milan, Italy.
Real-time and RT-PCR studies. Total RNA was extracted using the Trizol reagent method (Invitrogen, Carlsbad, CA). The quality of RNA samples was assessed with an Agilent 2100 Bioanalyzer (Agilent Technologies, Palo Alto, CA). One µg of total RNA was used for semi-quantitative real-time RT-PCR (AMV first strand cDNA
Synthesis Kit and Faststart DNA Master SYBR Green 1 PCR reaction mix, Roche Diagnostics, Indianapolis, IN), with the following primers:
GPR17: Fw:CTGCTACCTGCTGATCATTCG; Rv: TAGACTGAACGGTGGATGTGG.
MPB: Fw:CGATTGGGTGTCACTCCGAAA; Rv: CCCAGCAGAGAATGAACACAA.
PLP1: Fw:AAGTCGCAGAGGAATGAAAGC; Rv:AAGGACATTCCTGCTTTCTACC.
GAPDH: Fw:AATGCATCCTGCACCACCAAC; Rv: TGGATGCAGGGATGTTCTG.
Data analysis was performed using LightCycler Software (Roche Diagnostics, Indianapolis, IN) with quantification and melting curve options. The acquired fluorescence signal was quantified by the second derivative maximum method using LightCycler data analysis software to obtain crossing point values (Cp) and PCR efficiency (E). Changes in concentration of the amplified target were detected as differences in threshold cycle (∆Cp) between samples; relative expression ratio (R) of target genes were calculated based on E and ∆CP and expressed as a ratio to the reference housekeeping gene Glyceraldehyde 3-phosphate dehydrogenase (GAPDH).
For single cell RT-PCR studies, one living cell or a small pools of cells (up to 10) was sucked into a patch pipette by applying a negative pressure, and then processed for RT-PCR, using oligo(dT) for retrotrascription (Invitrogen), as described (Lecca et al., 2008). The selection of oligodendrocytes was performed at the light microscope on the basis of cell morphology. Half of the reverse-transcribed cDNA product was amplified with Platinum Taq DNA polymerase. Amplifications were performed in a GeneAmp 9700 thermal cycler (Applied Biosystems) for 40 cycles (94 °C/45 s, 30 s at the optimal annealing temperature for each primer pair and 72 °C/45 s). For a complete list of primers sequences, annealing temperature (Ta) and size of PCR products for GPR17, P2Y and CysLT receptors see (Daniele et al., 2010). The following primers were also utilized: Rat Olig2, Fw: TCCTCCAGCACCTCCTCGTC-3’, Rv: 5’-GTGACCCCCGTAAATCTCGC-3’ (Ta: 59.8°C; PCR product: 306bp); rat PDGF receptor-α (PDGFRα), Fw: 5’-GGAAATCAGAACCGAGGAG-3’, Rv: 5’CAGTTTGATGGACGGGAGT-3’ (Ta: 55.9°C; PCR product: 306bp).
Primers used for two splicing forms of PLP1: PLP and DM-20, Fw: 5’-GAAAAGTTAATTGAGACCTA-3’, Rv: 5’-TACCAGGGAAACTAGTGTGG-3’ (Ta:57°C; PCR products: two bands of 532 and 637 bp representing DM-20 and PLP transcripts, respectively). Twenty µl aliquots of the PCR products were size separated by electrophoresis on a 1,5 % agarose gel. To ckeck GPR17 knock-down after silencing experiments, total RNA from control and silenced postnatal OPCs was extracted with TRIZOL® Reagent (Invitrogen) according to the manufacturer’s instructions.
Retrotranscriptions to cDNA and PCR reactions were carried out as described in Chapter 3.
RNA interference. After 3-4 days in culture, cells in proliferating medium were transfected with a siRNA specifically designed for silencing rat GPR17 (Qiagen, Milan, Italy): CCGTATAGAGAAGCACCTCAA (target sequence). siRNAs were transfected with Lipofectamine RNAiMAX reagent (Invitrogen) as described (Daniele et al., 2010) to a final concentration of 100 nM/well (24 well cell culture-plate), following the manufacturer's protocol. In parallel, an ineffective randomly designed RNA sequence was used as negative control (Qiagen). GPR17 knock down was checked by RT-PCR analysis and immunocytochemistry. Measurement of cyclic-AMP levels in OPCs was evaluated 48-72 h after siRNA transfection.
Measurement of cyclic-AMP levels. Intracellular cAMP levels were measured using a competitive protein binding method as reported (Colotta et al., 2008; Trincavelli et al., 2008). Briefly, purified OPCs were seeded on poly-D,L-ornithine 24 well plates (1.5 x 10⁴ cells/well) in 0.5 mL medium and maintained in culture for 6-7 days (pick of GPR17 expression). For the assay, the complete medium was removed and cells were incubated at 37 °C for 15 min with 0.4 mL of medium in the presence of the phosphodiesterase inhibitor Ro20-1724 (20 µM). The concentration-response curve of tested ligands was evaluated by assessing their ability to inhibit cAMP accumulation stimulated by 10 µM forskolin. Agonists were added to cells for 15 min. When required, cells were pre-incubated for 10 min with antagonists. Reactions were terminated by medium removal and addition of 200 µl of 0.4 N HCl. After 30 min, lysates were neutralized with 50 µl of 4 N KOH and suspension centrifuged at 800 g for 5 min. For determination of cAMP, cAMP binding protein isolated from bovine adrenal glands was incubated with [3H] cAMP (2 nM), 50 µL of cell lysate or cAMP standard (0-16 pmol) at 0 °C for 150 min, in a total volume of 300 µL. Bound radioactivity was separated by rapid filtration through GF/C glass fibre filters and washed twice with 4 mL 50 mM Tris/HCl pH 7.4. Radioactivity was measured by liquid scintillation spectrometry.
Data Analysis. For cAMP data, a non-linear multipurpose curve-fitting program Graph-Pad Prism was used. Data are reported as mean ± SEM of three/four different experiments (performed in duplicate).
Results and Discussion
GPR17 mRNA expression in cultured primary OPCs. As a first step, we analyzed the induction of GPR17 mRNA in comparison to the mRNAs of some major myelin proteins, such as MBP and PLP1 during the process of spontaneous in vitro differentiation.
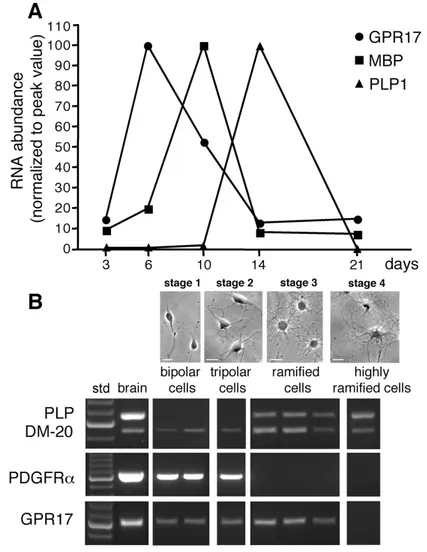
Real time PCR analysis showed that GPR17 mRNA was expressed at low levels at early differentiation stages (∼ after 2-3 days in culture), whereas it was sharply increased immediately afterwards, reaching a maximum peak around day 6, when the mRNA levels of MBP started to increase. As OPC differentiation proceeded, GPR17 mRNA progressively declined, reaching its lowest level at 14 days in culture, when, conversely, PLP1 expression reached its maximum (Fig. 1A). These expression changes were paralleled by gradual morphological changes in culture, from a very simple bipolar shape to an increasingly complex ramified morphology (see also below and Fig. 3). To obtain more information on the expression pattern of other OPC markers in the GPR17 expressing cells, we examined genes encoding for the PDGFRα, a typical marker of early OPCs, and for the two splicing variant forms of PLP1: DM- 20, the predominant immature isoform during early OPC development, and the myelin protein PLP, which is instead expressed by more mature OPCs. To this purpose, at different days in culture corresponding to distinct maturation stages (stage 1-4, see Fig. 1B), single cell PCR was applied to pools of bipolar, tripolar or ramified oligodendrocytes (2-5 cells/pool) picked up from living cultures using cell morphology at the light microscope as a guide. We found that bipolar cells at day 2 in culture (stage 1) co-expressed the mRNAs for both GPR17, the immature marker PDGFRα, and the more immature PLP splicing variant DM-20. Tripolar cells at day 4 in culture (stage 2) maintained the same gene expression pattern. At day 6 (stage 3), ramified pre-oligodendrocytes instead co-expressed GPR17 mRNA together with the mRNAs for both PLP and DM-20 myelin proteins, whereas they did no longer express PDGFRα mRNA (Fig. 1B). At this stage, virtually all ramified cells were still immature oligodendrocytes, since very few MBP+ cells (2.7±0.3%, n=2470) were found at this age in culture. Highly ramified cells isolated at day 10 in culture (stage 4) were instead typically MBP+; these cells had lost GPR17 mRNA, but still maintained the mRNAs for both PLP1 isoforms (Fig. 1B). Altogether, these data suggest that, during in vitro OPC specification, GPR17 expression is restricted to cells at early differentiation stages characterized by distinct expression patterns.
Fig. 1 GPR17 mRNA expression in cultured primary OPCs. A. Total RNA was extracted from rat OPCs cultured for 3, 6, 10, 14 and 21 days, as indicated; cDNAs obtained by retrotranscription were used for semi-quantitative real-time RT-PCR. Data analysis was performed by LightCycler Software with quantification and melting curve options. Fold changes are expressed as percentage of the peak value of each gene, set to 100%. B. Single cell RT-PCR: different pools of 2-5 cells, at various stages of oligodendrocyte differentiation (defined as stage 1-4), were picked up from living cultures using cell morphology as a guide at the light microscope. Representative bright field microscope images showing OPC morphology at the selected stages are shown in the upper part of the Figure. For RT-PCR analysis, each lane corresponds to a single pool of 5 cells. cDNA from adult rat brain was utilized in parallel as a positive control (shown in left panel, after 100bp ladder, std).
GPR17 protein expression in cultured primary OPCs. To get more information on the morphological characteristics and immunophenotye of GPR17-expressing cells, we then followed the appearance of the GPR17 protein in culture by employing our anti-GPR17 antibody (Lecca et al., 2008) along with a variety of specific markers labeling differentiation stages characterized by distinct morphologies (i.e., O4 and O1 for pre/immature oligodendrocytes, MBP for mature cells, see also above).
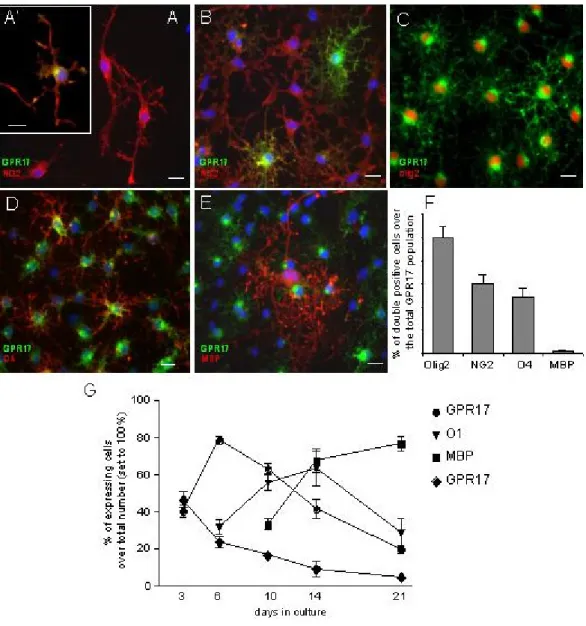
At early stages (∼ 1, 2 days) in culture, OPCs showed a typical bipolar morphology with little secondary branching and were positive for NG2 (Fig. 2A). These cells accounted for the 72 ± 6.7% of the total cell population (n=2350 cells, four independent experiments). Despite the presence of GPR17 mRNA (Fig. 1), at this initial stage, the GPR17 protein was undetectable in the majority of cells, being present only in cells with a tripolar or more complex morphology (Fig. 2A’). These NG2+-GPR17+ double-positive cells accounted only for the 2.6 ± 0.4 % of NG2+ population (n=1496, from three independent experiments). As OPCs started to spontaneously differentiate in
vitro, strong GPR17 immunolabeling was found in NG2+ cells with many branched processes emerging from the cell body (Fig. 2B), thus increasing the percentage of NG2+-GPR17+ double-positive cells to 23 ± 2.7 % of the total NG2+ population (Fig. 2B, n=1010, from four independent experiments). Interestingly, at stage 2, the DM20 and PLP isoforms are not espressed by OPCs as assessed by both immunocytochemistry (supplemental Fig. S1A) and by western blot analysis performed in parallel with rodent brain extracts utilised as positive controls (supplemental Fig. S1C). On the contrary, at this early stage in culture, the PDGFRα protein is present in almost all cells, and double staining with the anti-GPR17 antibody indicates that morphologically immature GPR17+ cells also coexpress PDGFRα (supplemental Fig S1D, D’). Presence of PDGFRα was also confirmed by western blotting analysis (supplemental Fig S1G). The number of GPR17+ OPCs continued to increase during differentiation, reaching a maximum peak around day 6 when they represented about 70% of the total cell population and when a significant number of cells acquired a pre-oligodendrocyte phenotype (Fig. 2C and 2G), as assessed by immunoreactivity for O4 (number of O4+/total: 35.8 ± 5.3 %, n=4406) and O1 (Fig.2G). At this stage, 59.8 ± 7.9% of GPR17+ OPCs were still immunoreactive for NG2 (n= 3454, from six independent experiments); 48.3 ± 7.9 % of GPR17+ OPCs acquired O4 immunoreactivity (n= 1829, from three independent experiments; Fig. 2D and H), while only 1.4 ± 1.1 % of GPR17+ cells co-localized with the mature marker MBP (n=2770, from 5 independent experiments; Fig. 2E, F). Of note, at this stage, the majority of O4+ cells were also
immunoreactive for GPR17 (GPR17+-O4+: 82 ± 6.5%; total number of O4+= 700, data from three independent experiments). Moreover, at this time in culture (stage 3), some GPR17+ cells also started to express the proteolipid protein (see white arrows in supplemental Fig. S1B); western blotting analysis indeed showed the presence of the DM20 isoform (supplemental Fig. 2SC). Conversely, virtually all the ramified GPR17+ cells had lost expression of PDGFRα (supplemental Fig. S1E), as also confirmed by western blotting analysis showing massive reduction of the specific PDGFRα immunoreactive band (supplemental Fig.S1G).When the majority of cells differentiated to immature oligodendrocytes, as assessed by O1 immunostaining(∼ at day 10, Fig 2G), almost all GPR17+ cells co-expressed O1 (number of GPR17+/total: 63.55 ± 2.67 %, and O1+-GPR17+: 79.07 ± 7.35 % vs GPR17+ cells, n=960 from three independent experiments) and were loosing expression of NG2. At later stages of maturation, while MBP immunoreactivity progressively increased up to day 21 (when oligodendrocytes reach terminal differentiation), labeling for GPR17 constantly declined, and the percentage of double positive GPR17+-MBP+ cells decreased from 26.29 ± 2.51 % at day 10 to almost zero at day 21. Incidentally, typically mature cells did nor express either GPR17 nor PDGFRα (supplemental Fig. 2F). A summary of GPR17 expression together with other already known markers of different OPC differentiation stages is reported in Fig. 3. In line with previous indications (Lecca et al., 2008), in vivo immunohistochemistry in rat cortex showed co-expression of GPR17 with Olig2 and NG2, but not with mature oligodendrocyte markers like PLP and MBP (Fig. 4), thus confirming the validity of our in vitro results.
We also assessed the nuclear labeling for the mitotic marker phospho-histone PH3 on cells fixed at distinct times in culture (Fig. 2G). The number of PH3+ oligodendrocytes was quite high at day 3 in culture and progressively decreased with time, in line with the time-dependent increase of oligodendrocyte terminal differentiation (Fig 2G). Interestingly, the number of mitotic GPR17cells (ie, double labeled PH3+-GPR17+ cells) was low at each time point (data not shown).
Thus, GPR17-expressing OPCs have a quite low proliferation rate and the time-dependent increase of GPR17+ cells in culture is mainly due to the spontaneous differentiation of the already present OPCs rather to proliferation of the GPR17+ cell subpopulation.
Fig. 2. GPR17 protein expression in primary OPCs. Representative images of purified primary OPCs cultured for two days showing NG2+ precursors (red fluorescence) exhibiting bi (stage 1) or tripolar morphology with little secondary branching (stage 2). A. At this stage, only a small percentage of NG2+ cells co-stained for the GPR17 protein (an example is shown in A’), whereas most cells already expressed GPR17 mRNA (see text). B. As OPCs spontaneously differentiated in culture, strong GPR17 labeling appeared in cells with more processes emerging from the cell body (stage 2). C. The number of GPR17+ OPCs continued to increase during differentiation, reaching its maximum when a significant number of cells acquired a ramified morphology (stage 3). D. At this stage, GPR17+ cells became positive for O4 (in red) and O1 (not shown), typical markers of pre-/immature oligodendrocytes. Co-localization of GPR17 with markers of mature, myelinating oligodendrocytes MAG (not shown) and MBP (E) was found only to a much lesser extent. Nuclei were labeled with Hoechst33258 dye (blue). Scale bar 15µm. F. Histograms showing quantification of the percentage of ramified GPR17+ cells that also co-express the indicated oligodendrocyte markers in 6-day old cultures (stage 3). G. Presence of the GPR17 protein on pre-oligodendrocytes decreases in parallel with the in vitro maturation of cells towards fully differentiated oligodendroglia. At the indicated times in culture, cells were fixed and immunostained with antibodies against GPR17 and markers of specific oligodendrocyte differentiation stages (O1, MBP or PH3, as indicated). Labeling with the mitotic marker PH3 showed that oligodendrocyte proliferative ability gradually decreased with time, in parallel with their terminal differentiation. Data represent the mean ± SEM of three separate experiments.
Supplemental Fig. 1. Analysis of GPR17 protein expression along with the oligodendrocyte markers DM20, PLP and PDGFRα. A. At stage 2 in culture, GPR17 is expressed by a small percentage of cells. B. At stage 3, as expected, the GPR17 receptor protein was found in many cells, and some of these cells were also found to express the PLP/DM20 protein (see white arrows in panel B). Scale bar: 15 µm. C. To characterize the DM20/PLP antibody for western-blotting analyis, we first examined extracts from the adult (postnatal day 60, P60) mouse brain (Br). In these samples, the anti-PLP/DM20 antibody indeed recognized both PLP isoforms, as shown by two immunoreactive bands at 20 kDa (corresponding to the immature DM20 isoform) and at 23 kDa (corresponding to the PLP isoform). In mouse brain, both isoforms were already present at postnatal day 3 (P3), but only the immature DM20 protein was detected in rat brain (rat Br) at postnatal day 2 (P2). After this initial characterization, we used this antibody to assess the nature of the PLP isoform(s) expressed in our OPC cultures. In line with data shown in panel A, no immunoreactive bands were detected at stage 2 in culture. At stage 3, when significant labelling is found on cultured OPCs (panel B), only the lower molecular weight protein band corresponding to DM20 was detected in western blotting analysis. D. Immunocytochemical analysis showed that, at stage 2 in culture, PDGFRα is expressed by almost all cells (red fluorescente). D’. Same field as in D, showing double staining with anti-GPR17 (green fluorescente). Data indicate that morphologically immature cells expressing GPR17 also coexpressed PDGFRα (see white arrows). E. At stage 3, virtually all the ramified GPR17+ cells have lost expression of PDGFRα. F. At stage 4, typically mature oligodendrocytes did neither express PDGFRα nor GPR17. An example of such cells is shown. Scale bar: 15 µm. G. Western blotting analysis of PDGFRα in lysates from OPCs of different stages clearly confirmed presence of PDGFRα at stage 2 and a marked decrease of this protein at stage 3 in culture.
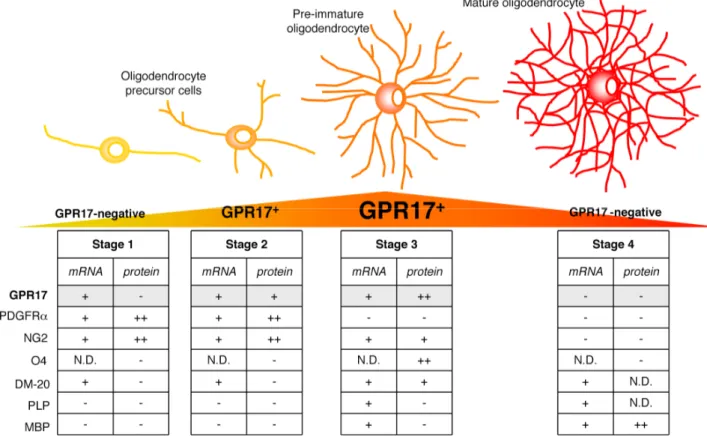
Fig. 3. Scheme showing GPR17 expression as a function of OPC differentiation. The drawing illustrates the typical differentiation steps of OPCs, from the immature precursor to mature oligodendrocyte. Tables summarize single-cells RT-PCR (mRNA) and immunocytochemical (protein) data for GPR17 and other already known markers identifying specific differentiation stages. GPR17 can be considered as a novel lineage marker that recognizes two subsets of NG2+ cells (polydendrocytes) and pre/immature oligodendrocytes. At early stage (stage 1), bipolar OPCs already express GPR17 mRNA, but receptor protein expression is detectable only when NG2+ cells acquire a more complex morphology (stage 2, polydendrocyte stage). After this stage, GPR17 gradually increases in pre/immature oligodendrocytes, reaching a maximum peak when O4 is expressed (stage 3). GPR17 expression is then turned down and mature MBP+ cells do no longer express the receptor (stage 4). The graded changes of the GPR17 protein during differentiation is highlighted in a yellow-orange-red triangle, where orange represents the maximum expression level. N.D.: not done.
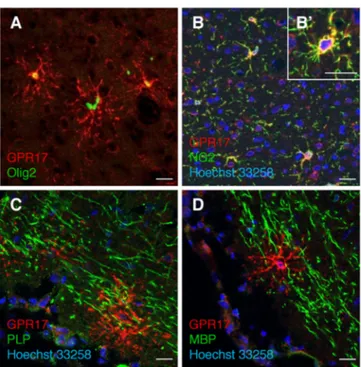
Fig. 4. Immunohistochemistry experiments in rat brain to detect GPR17 (red fluorescence) in parallel with early (Olig2 and NG2) or late (PLP and MBP) markers of oligodendrogliogenesis (green fluorescence) as described in Experimental Procedures. A. Co-localization of GPR17 with the transcription factor Olig2 and, B, B’ with the membrane proteoglican NG2. C. No co-localization was observed with proteolipid protein PLP and, D, with myelin basic protein MBP. Nuclei were labeled with Hoechst33258 dye (blue). Scale bars: 20µm.
GPR17 signaling pathways in cultured primary OPCs. Since GPR17 can respond to both nucleotides and cysLTs (Ciana et al., 2006; Lecca et al., 2008; Pugliese et al., 2009), to dissect the signaling pathway(s) associated to the native receptor in OPCs, we first performed a detailed single cell RT-PCR analysis of all cloned P2YRs and CysLT1 and CysLT2 receptors. This approach was needed to estimate the potential contribution of other co-expressed receptors of the same family to the responses detected in OPCs upon exposure to these ligands. Analysis of 2-10 cells picked up from living cultures showed that, together with GPR17, all P2YRs (i.e P2Y1,2,6,12,13,14), with the only exception of P2Y4R, were co-expressed in pre-oligodendrocytes (supplemental Fig. S2). Concerning CysLTRs, CysLT1R was not found (supplemental Fig. S2B), whereas a specific band for CysLT2R was identified (Fig. supplemental Fig. S2C).
As recombinant P2YRs, including P2Y12,13,14R,GPR17 and CysLTRs can couple to the Gq protein and phospholipase C to increase intracellular calcium ([Ca2+]i) (Ciana et al., 2006; Fumagalli et al., 2003; Bianco et al., 2005; Capra et al., 2005), the functionality of the detected receptors was investigated by single cell calcium imaging by recording responses to the most commonly utilized P2YR agonists and LTD4. We found that a significant percentage of cells responded to ADP (supplemental Fig. S2D,
∆F340/380: 0.36 ± 0.04), whereas only a very small fraction showed responses to UDP (5.08 ± 2.5 %, n=185; ∆F340/380: 0.25 ± 0.03). In 5 independent OPC preparations (n=200), no cells responded to UDP-glucose or LTD4 (supplemental Fig. S2F-H), thus ruling out the possibility that, in primary rodent OPCs, GPR17 is coupled to Gq, at least under these experimental conditions.
As previously published data demonstrate that recombinant human and rodent GPR17 is primarily coupled to the Gi protein, which, in turn, inhibits cAMP formation (Ciana et al., 2006), we evaluated the possible receptor coupling to the adenylyl cyclase system. In particular, the effect of uracil derivatives and cysLTs on cAMP accumulation stimulated by forskolin was evaluated. As a first approach, cAMP production was assayed by incubating cells with increasing forskolin concentrations (from 1 µM to 30 µM) in the absence or presence of LTD4 (10 nM) or UDP-glucose (10 µM). Both agonists inhibited cAMP accumulation stimulated by 1, 5 and 10 µM forskolin (data not shown). No inhibition on cAMP accumulation was observed when forskolin was used at a 30 µM concentration (data not shown). Based on these data, 10 µM forskolin was then used in all subsequent functional assays.
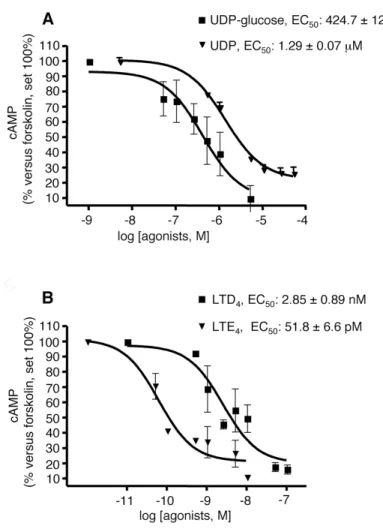
Complete concentration-response curves to these two agonists were then performed. UDP-glucose and LTD4 concentration-dependently inhibited the cAMP formation elicited by 10µM forskolin, with EC50 values of 424.7 ± 125 nM and 2.85 ± 0.89 nM, respectively (Fig. 5, panel A and B), confirming their agonist activity at native GPR17. In a similar way, also UDP and the cysLT derivative LTE4, that has recently been proposed to also act as a GPR17 agonist (Lecca et al., 2008), significantly and concentration-dependently inhibited forskolin stimulation, with an EC50 value of 1.29 ± 0.07 µM and 51.8 ± 6.6 pM respectively (Fig. 5, panel A and B). Interestingly, the calculated affinity constant values for all agonists are comparable to those obtained in 1321N1 cells heterologously transfected with rat GPR17 by [35S]GTPγS binding (Ciana et al., 2006).
Supplemental Fig. 2. RT-PCR and intracellular calcium experiments in primary rat OPC cultures. A, B, C. Different pools of 2-10 ramified OPCs were picked up from living cultures using cell morphology as a guide at the light microscope and processed for single-cell RT-PCR. Resulting cDNAs were amplified with primers specific for each of the indicated P2YRs, CysLTRs, for GPR17 and for the oligodendrocyte marker Olig2 (not shown). In each PCR experiment, cDNA obtained from rat brain was amplified in parallel as a positive control (not shown); an aliquot of the same cDNA was amplified in parallel to confirm expression of Olig2 and GPR17, as indicated. A representative experiment out of three is shown. D. Series of pseudocolor images of the same Fura-2 loaded cells. First micrograph from the left shows a field of cells under basal conditions at the 380 nm fluorescence; the second image refers to the same group of cells at F340/380; the third image shows response after the application of 100 µM ADP (at peak of Ca2+ response); changes of fluorescence from dark blue to light blue indicates increases of intracellular calcium concentrations [Ca2+]i. E. Post-fixation staining of the same field of cells with NG2 (in red) and GPR17 (in green) indicates that several NG2+ and GPR17+ cells indeed responded to ADP (see cell highlighted with red circle in both D and E as an example). F. Representative traces of Ca2+ increases recorded from pre-oligodendrocytes after application of ADP, UDP, UTP, UDP-glucose or LTD4, as indicated. Scale bar for time: 1min. The reported response to ADP refers to the oligodendrocyte identified by the red circle in D and E, which also expressed GPR17, suggesting that a subpopulation of GPR17+ pre-oligodendrocytes express ADP-sensitive P2Y1Rs. As evident from subsequent traces, the same cell did not show any response to either UDP-glucose or LTD4. G. Mean [Ca2+]i increases, evaluated as changes in the 340/380 fluorescence ratio (F340/380) and H. percentage of OPCs responding to the indicated P2YR agonists.
Fig. 5. Inhibition of forskolin-stimulated adenylyl cyclase activity in primary OPCs by GPR17 agonists. A. OPCs were plated in 24-wells and after 6 days in culture they were treated with 10 µM forskolin (FK), in the absence or presence of graded concentrations of UDP-glucose (50nM-5µM) and UDP (500nM-50µM) or B. LTD4 (0.5nM-250nM) and LTE4 (0.05nM-10nM). After 15 min, reactions were stopped by addition of HCl and the intracellular levels of cAMP in cell lysates evaluated as described in Materials and Methods. Results are expressed as percentage of FK-stimulated cAMP levels set to 100%. Data represent the mean ± SEM of three separate experiments, each performed in duplicate.
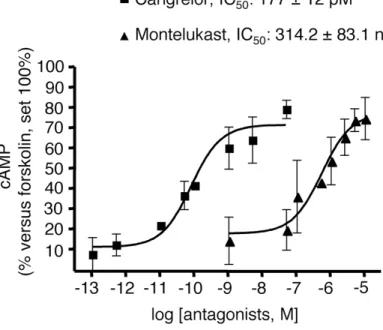
To determine whether UDP-glucose and LTD4 effects could be selectively ascribed to the activation of GPR17, we performed specific experiments with the GPR17 antagonists cangrelor and montelukast (Ciana et al., 2006; Pugliese et al., 2009). As depicted in Fig. 6, both cangrelor, an antagonist of the purinergic binding site on GPR17, and montelukast, an antagonist of the cysLT binding site on GPR17, concentration-dependently counteracted the inhibition of cAMP formation elicited by 1 µM UDP glucose and 10 nM LTD4, with half-maximal inhibition (IC50) values in the picomolar and nanomolar range, respectively. These results suggest that the UDP-glucose and LTD4-induced effects are indeed mediated by GPR17.
Fig. 6. The GPR17 antagonists cangrelor and montelukast concentration-dependently counteract agonist-mediated inhibition of FK-stimulated adenylyl cyclase in primary OPCs. OPCs were plated in 24-wells and after 6 days in culture they were treated with either the purinergic agonist UDP-glucose (1 µM) or the cysLT agonist LTD4 (10 nM) and 10 µM FK, in the absence or presence of graded concentrations of the indicated antagonists (5pM-50nM for Cangrelor and 50nM-10µM for Montelukast). After 15 min, reactions were stopped by addition of HCl and the intracellular levels of cAMP in cell lysates evaluated as described in Materials and Methods. Results are expressed as percentage of FK-stimulated cAMP levels set to 100%. Data represent the mean ± SEM of three separate experiments, each performed in duplicate.
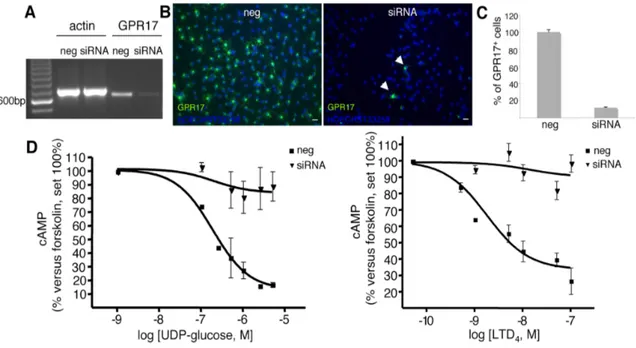
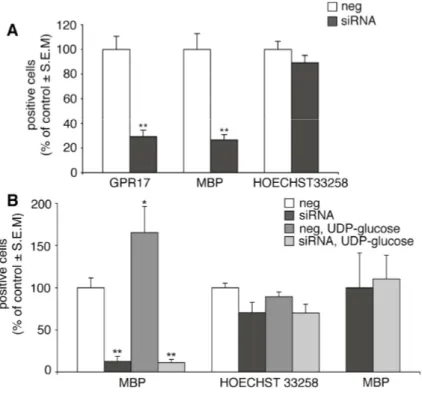
Finally, since OPCs also express the mRNA for CysLT2R and various other P2YRs, including the uridine sugar nucleotide P2Y14R (Fig. 3H), to unequivocally prove that the detected effects are due to GPR17, we performed silencing experiments. cAMP levels were thus determined in primary OPCs upon transfection of cells with small interfering RNAs against rGPR17. The silencing efficiency of GPR17 was evaluated by RT-PCR experiments (Fig. 7A) immunocytochemistry (Fig. 7B, C) and western blot (data not shown). Results demonstrate that, after selective GPR17 knock-down, the ability of UDP-glucose and LTD4 to inhibit FK-stimulated cAMP production was virtually abolished with respect to control cells exposed to randomly arranged interfering small RNAs (Fig. 7D). These results confirm that the effects of these ligands are indeed due to the selective activation of the GPR17 receptor in OPCs.
Fig. 7. GPR17 knock-down in primary OPCs by specific siRNAs abolishes UDP-glucose mediated inhibition of forskolin-stimulated adenylyl cyclase. OPCs were plated in 24-wells and after 3-4 days in proliferating medium they were treated with either siRNAs (100 nM) specifically designed against rat GPR17 or ineffective randomly designed siRNA utilized as a negative control (neg). A. After 48-72 h, no specific amplification product for GPR17 was detected by RT-PCR in silenced samples (siRNA) with respect to controls (neg). B. Immunocytochemical analysis showed a massive reduction of GPR17-positive cells (in green) in siRNA cultures with respect to negative controls (neg). In blue, cell nuclei stained with Hoechst 33258. Data from one typical experiment are shown; similar data were obtained in four independent experiments; appropriate controls for the knock-down of the GPR17 protein have been performed for each single silencing experiment. C. Quantification of GPR17 expressing cells in control (neg) and silenced (siRNA) OPC cultures. Fifty optical fields/coverslip were counted for a total of eight coverslips/group. Data are reported as % of the total number of GPR17 expressing cells set to 100% and represent the mean of four independent experiments.
D. UDP-glucose significantly and concentration-dependently inhibited FK-stimulated adenylyl cyclase in control OPCs (neg), while no significant inhibition was detected in GPR17 silenced cultures (siRNA) (Student’s-t test). Each point in graph is the mean ± SEM of six separate determinations from three independent experiments (left panel). In a similar way, LTD4 inhibited FK-stimulated adenlyl cyclase in control OPCs (neg) and this effect was completely lost in GPR17 silenced cells (siRNA). Each point in graph is the mean ± SEM of three separate determinations from one experiment. (right panel).
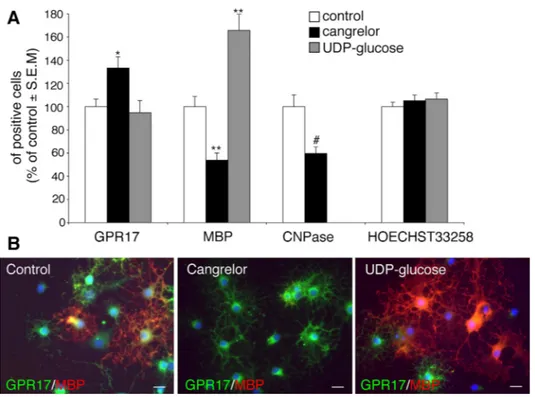
Effect of GPR17 ligands on OPC differentiation in culture. Having established that, in primary cultured OPCs, GPR17 is functional, we then asked whether its pharmacological modulation with agonists/antagonists had any effects on the final destiny of these cells. We reasoned that, if GPR17 is important for spontaneous OPC differentiation, then GPR17 antagonists should delay maturation by counteracting the effects mediated by endogenous GPR17 agonists; conversely, exogenous agonist ligands should accelerate OPC maturation by promoting receptor activation. Exposure of OPCs to cangrelor indeed significantly reduced the number of mature MBP+ or CNPase+ cells, while increasing the number of GPR17+ precursors (Fig. 8A), indicating a shift of cells toward a less differentiated stage, as also confirmed by prevalence of a morphologically undifferentiated phenotype (Fig. 8B). In contrast, the GPR17 activator UDP-glucose increased the number of MBP+ oligodendrocytes (Fig. 8A), suggesting acceleration of cell maturation, as also assessed by appearance of a myelinating phenotype in culture (Fig. 8B). In neither case were these effects due to changes in the total number of cells in culture, since no changes in cell labeling with Hoechst33258 were detected (Fig. 8A).
Effect of GPR17 knock-down on the normal program of oligodendrocyte differentiation. Finally, to univocally establish a link between GPR17 activation and oligodendrocyte differentiation, we assessed the effect of GPR17 silencing on spontaneous OPC maturation. As expected, receptor knock-down significantly reduced the number of GPR17+ cells in culture; this was associated to a dramatic decrease in the number of terminally differentiated MBP+ cells (Fig. 9A). Nuclei labeling with Hoechst33258 showed no significant changes in cell number, confirming that these effects are not due to toxicity, but are really related to GPR17 knock down. In line with these data, in the absence of GPR17, the differentiating effects of UDP-glucose was completely lost (Fig 9B). Thus, GPR17 is necessary for oligodendrocyte differentiation and its silencing markedly interferes with OPC maturation. Moreover, maturation of GPR17+ OPCs is crucially driven by uracil-nucleotides, suggesting a key role for these ligands in the normal differentiating program of these cells.
Fig. 8. Effect of GPR17 ligands on OPC differentiation in vitro. Primary purified OPCs were cultured in differentiating medium containing T3. At day 5, the GPR17 antagonist cangrelor (10 µM) or the agonist UDP-glucose (100 µM) were added to cultures. After 48h, cells were fixed and immunostained with anti-GPR17, anti-MBP and anti-CNPase antibodies.
A. Histograms showing quantification of the percentage of cells expressing the indicated oligodendrocyte markers in control and treated cells (with vehicle-treated control cells set to 100%). Hoechst 33258 was used to label cell nuclei. The number of positive cells was counted in 10 optical fields under a 10X magnification (~2000 cells/coverslip in the control condition). For cangrelor, data are the mean± SEM of cell counts from a total of 10-20 coverslips/condition from 4 independent experiments. For UDP-glucose, data are the mean± SEM of cell counts from a total of 9 coverslips/condition from 3 independent experiments running in parallel with cangrelor (n= **p<0.001, *p<0.05 compared to control, one-way ANOVA, followed by Bonferroni's multiple comparison test. #p<0.01 compared to control, Student’s-t test. B. Representative images of control, cangrelor- or UDP-glucose treated cells showing double immunostaining with anti-GPR17 and anti-MBP antibodies. Nuclei were labeled with Hoechst 33258. Scale bar: 15µm.
Fig. 9. Effect of GPR17 knock-down on the normal program of oligodendrocyte differentiation. OPCs were plated in 24-wells and after 3-4 days in differentiating medium containing T3, they were treated with either siRNAs specifically designed against rat GPR17 or ineffective randomly designed siRNA utilized as a negative control. After 72 h, cells were fixed and stained with anti-GPR17 and anti-MBP antibodies. A. Histograms show the quantification of GPR17+ or MBP+ cells in control (neg) and silenced (siRNA) OPC cultures (with control cells set to 100%). In GPR17 silenced cultures, a significant reduction of the number of MBP+ cells with respect to control was observed, along with the expected significant reduction in the number of GPR17+ cells. **p<0.0001 compared to control, Student’s-t test. The number of positive cells was counted in 10 optical fields under a 10X magnification (~2000 cells/coverslip in the control condition). Data are the mean ± SEM of counts from a total of 10 coverslips/condition from 3 independent experiments. B. In a set of four experiments, at day 3, OPCs cultured in differentiating medium containing T3, were transfected with siRNA and, after 48 h, treated with UDP-glucose (100µM) for additional 48 h. Cells were fixed to assess the differentiation degree by immunocytochemistry. Histograms show the quantification of MBP+ cells in control (neg) and silenced (siRNA) OPC cultures (with control cells set to 100%), in the absence or presence of UDP-glucose (100µM). In line with data reported in A, in GPR17 silenced cultures, a significant reduction of the number of MBP+ cells with respect to control was reproduced. Moreover, UDP-glucose induced a significant increase in the % of mature MBP+ cells (*p<0.05). In the absence of GPR17, the differentiating effect of UDP-glucose was dramatically reduced, (**p<0.0001 with respect to control (neg), one-way ANOVA, followed by Bonferroni's multiple comparison test). There were no significant changes in the total number of cells, as shown by labeling of cells nuclei with Hoechst 33258. The loss of the UDP-glucose induced effect after GPR17 silencing is even more evident if, in the siRNA treated cultures, data are expressed as percentage increase of MBP+ oligodendrocytes with respect to the basal number of MBP+ cells set to 100% (right columns).
Here we report the molecular characterization of GPR17 and its transduction system during the spontaneous in vitro differentiation and maturation of primary rodent NG2+ OPCs. To our knowledge, this is the first time that such a detailed description of GPR17 signaling pathway is reported in a native system.
The main findings of this work are as follows:
1. In cultured OPCs, the GPR17 transcript is first detected in bipolar NG2+ polydendrocytes. Receptor expression gradually increases with in vitro morphological differentiation in cells with more processes emerging from the cell body, is maximal in immature pre-oligodendrocytes and then gradually decreases along with terminal maturation.
2. In line with these findings, the GPR17 receptor protein decorates two subsets of slowly proliferating cells. The first one corresponds to early, morphologically immature and slowly proliferating NG2+ precursor cells that also express Olig2, PDGFRα and the immature PLP isoform DM-20; the second one corresponds to more ramified, still immature pre-oligodendrocytes that are loosing NG2 and PDGFRα immunoreactivity and already express O4, O1 and the two splicing variants of the myelin protein PLP (Fig. 3). We thus propose GPR17 as a new marker that specifically labels two distinct early OPC stages characterized by the morphological features and immunophenotypes summarized in Fig. 3.
3. In these cells, GPR17 is functional. Its activation by UDP-glucose and LTD4 did not affect intracellular calcium levels but resulted in marked inhibition of cAMP formation. Adenylyl cyclase thus represents the primary transduction signaling system of native GPR17 in OPCs.
Regarding findings 1 and 2, our data significantly contribute to defining the specific differentiation stage at which OPCs express GPR17. These findings significantly extend in vitro data obtained in primary neuron-glia mixed cultures (Lecca et al., 2008) and are in line with our previous and present in vivo results. Moreover, the presence of GPR17 in multifunctional NG2+ polydendrocytes suggests that it may be theoretically possible to exploit this receptor to address these cells to also generate new functional neurons and astrocytes under specific conditions (Nishiyama, et al., 2009).
Regarding the oligodendrocyte fate of the GPR17+-NG2+ precursors, in the Lecca et al paper, authors hypothesized that GPR17 has to be turned down to allow the terminal differentiation of immature oligodendrocytes. In line with our hypothesis, starting at postnatal week 2, transgenic mice overexpressing GPR17 under the control of the CNP1 promoter (and showing predominant transgene presence in oligodendrocytes
after the precursor stage), displayed generalized tremors, hind limb paralysis reminiscent of those described for dysmyelinating mouse mutants, followed by precocious death at 3 weeks of age (Chen et al., 2009). These data confirm that the forced expression of GPR17 at advanced OPC differentiation stages (such as that of cells already expressing the mature oligodendrocyte marker CNPase) is associated to defective myelination during postnatal life.
Regarding finding 3, this is the first demonstration that GPR17 is functionally active in native NG2+ neural progenitors, and, that the receptor is able to respond to endogenous GPR17 ligands, such as UDP, UDP-glucose, LTD4 and LTE4. Specifically, we identify inhibition of cAMP production as the main signaling pathway utilized by GPR17. The detected pharmacological profile for cAMP inhibition is comparable to that obtained in cells expressing the recombinant receptor (Ciana et al., 2006; Lecca et al., 2008). At variance from transfected systems, no coupling to intracellular calcium increases was detected. This suggests that, in native cells, GPR17 may be segregated from Gq proteins, which are necessary to activate PLC and calcium release from intracellular stores. Finally, GPR17 agonists promote and GPR17 antagonists delay spontaneous OPC differentiation in culture. These data, together with the demonstration that GPR17 silencing inhibits OPC maturation, unequivocally establish a mechanistic link between GPR17 and the final destiny of these cells.
GPR17 has been proposed as an intrinsic regulator of oligodendrogliogenesis (Chen et al., 2009). While our data fully confirm the role of GPR17 in OPC specification, we propose that GPR17 is also extrinsically regulated by physiological ligands that accumulate in the extracellular milieu. The identification of inhibition of cAMP as GPR17 main signaling pathway may help understanding the molecular mechanisms involved in the regulation of oligodendrocyte differentiation and terminal maturation, and is in line with previous data implicating this signaling pathway in cell differentiation (Ravni et al., 2008). In general, the activation of the cAMP pathway promotes neural precursor cells differentiation (Cai et al., 2006; Joubert et al., 2010) that, in some cases, occurs through the regulation of the Id2/Id4 transcriptional factors (Cheng et al., 2007; Andres-Barquin et al., 1999). We hypothesize that, by inhibiting cAMP formation at early differentiation stages, GPR17 keeps cells in an immature state, which is necessary to prepare them for myelination. When a critical stage of OPC differentiation is reached, GPR17 is downregulated to allow cells to resume the appropriate cAMP levels necessary for their terminal maturation.