DOTTORATO DI RICERCA IN
INGEGNERIA CIVILE, AMBIENTALE E DEI MATERIALI
Ciclo XXVIIISettore Concorsuale di afferenza: 08/B1 Settore Scientifico disciplinare: ICAR/07
A NUMERICAL INVESTIGATION OF LATERAL SPREADING
PHENOMENA IN RIVER EMBANKMENTS
Presentata da: Luca Balbarini
Coordinatore Dottorato
Relatore
Prof. Luca Vittuari
Prof. Guido Gottardi
Correlatore
Prof. Laura Tonni
2
INDEX……….1
ABSTRACT……….…5
INTRODUCTION………...6
AKNOWLEDGMENTS………6
CHAPTER 1 General features of soil liquefaction...9
1.1 Definition of soil liquefaction...9
1.2 Historical and geological criteria...13
1.3 Cyclic and monotonic loading...15
1.4 Remediation techniques………..………..18
1.5 Liquefaction aspects of river embankments……….………...20
1.5.1. General elements………...20
1.5.2 Relevant case histories...24
1.5.2.1 San Fernando Dam………...24
1.5.2.2 Kushiro-oki earthquake……….……….26
1.5.2.3 Tohoku earthquake………..31
1.5.2.4 Tottori-Seibu earthquake………..…44
1.5.2.5 Christchurch……….46
CHAPTER 2 Methods for evaluation of liquefaction triggering...53
2.1 Aspects affecting the estimation of liquefaction susceptibility….53 2.2 Compositional criteria……….60
2.2 Methods based on in situ tests……….61
2.2.1 NCEER method………...62
2.2.2 Boulanger&Idriss (2014) method………..69
2.2.3 Andrus & Stokoe method………69
2.3 Methods based on critical state concept………...71
2.3.1 Stress-Density method...…...71
CHAPTER 3 Site response analysis………...76
3.1 Equivalent linear 1D site response analysis………..76
3.2 Time series method………...65
3.3 Statistical approach………...86.
3.4. Signal deconvolution………...92
4.1 Model commands………...96
4.2 Elements...98
4.3 Materials………..105
4.3.1 Stress density material………107
4.3.2 Pressureindepenmultiyield material………108
4.4 Analysis commads………...111
CHAPTER 5 Emilia earthquake sequence...116
5.1 General aspects………116.
5.2 Liquefaction………....122
5.3 Liquefaction of river embankments…...125
5.3.1 The Scortichino case study………128
CAPITOLO 6 The Scortichino case study – in situ and laboratory investigations ……132
6.1 Geotechnical investigations program…………...132
6.2 In situ tests………...134
6.2.1 Topographical survey………..135
6.2.2 Core drilling………..136
6.2.3 Cone penetration tests (CPTU)………138
6.2.4 Seismic dilatometer tests (SDMT)………141
6.3 Laboratory tests………...142
CHAPTER 7 The Scortichino case study – Liquefaction evaluation based on in situ tests 151 7.1 Preliminary evaluation of liquefaction susceptibility based on historical and geological criterion………..151
7.1.1 History of Canale Diversivo and of the surrounding areas………151
7.1.2 Cracks map………153
7.2 Liquefaction potential computation based on in situ tests...157
7.2.1 Choice of input parameters...158
7.2.1.1 Ground motion...162
7.2.1.2 Water table level...165
7.2.1.3 Fine content………167
7.2.2 NCEER method (2001) ………...172
7.2.3 Boulanger & Idriss method (2014)………...173
7.2.4 Andrus & Stokoe (2000) method………...175. 7.2.5 Sensitivity analysis for variation of PGA and water table level...
4
7.3 Final remarks on simplified methods...
CHAPTER 8 Scortichino case study – numerical analysis...178
8.1 General aspects of the model………178
8.1.1 Model structure………179
8.1.2 Geometrical aspects and boundaries………181
8.1.3 Stratigraphy and soil constitutive models……….183
8.1.4 Ground motion……….183
8.2 Site response analysis………184
8.2.1 Choice of strong motion records……….. 8.2.2 Signal filtering………. 8.2.3 Soil properties………. 8.2.4 Signal deconvolution……….. 8.2.5 Definition of motion input parameters for the numerical model 8.3 Calibration of soil constitutive models………. 8.3.1 Stratigraphy………. 8.3.2 Calibration of clayey layers……….. 8.3.3 Calibration of sandy and silty layers……… 8.3.4 Calibration of deep layers ………. 8.4 Graphical pre and post-processing………. 8.4.1 model boundaries……… 8.4.2 mesh……….. 8.5 Analysis……….. 8.6 Discussion………. CHAPTER 9 Conclusions...186 LIST OF REFERENCES...192
6
ABSTRACT
The 20th and 29th of May 2012 Emilia region was struck by two main earthquakes having
ML=5,9 and 5,8 respectively and epicentres located close the villages of Finale Emilia and Mirandola, in Modena province. The earthquake induced soil liquefaction, concentrated on some areas built on the paleochannel of Reno river and minor areas in Modena province. The left embankment of an irrigation channel called “Canale Diversivo” showed a damage pattern along a section of its path close to the village of Scortichino. The damages appear to be related to lateral movement affecting the embankment body, with formation of longitudinal fissures and seems to be compatible with occourence of soil liquefaction, especially at the light of a detailed in-situ and laboratory investigation campaign organized by “Gruppo di Lavoro AGI-RER” from which the results from in situ tests and laboratory tets are briefly presented. A detailed survey made with the GNSS (Global Navigation Satellite System) technology has provided the ground surface used to locate the in-situ tests and to perform the preliminary and numerical analysis.
Based on other reconnaissance experiences performed in other case histories a careful evaluation of the damage pattern observed along the embankment has been created. The resulting crack map gives a global spatial overview of the evidences. A further important preliminary research described in chapter 7 is the reconstruction of the history of “Canale Diversivo” and of the surrounding area. Available data allow to define the soil profile through the section: the embankment body is made by a quite mixed material (Unit Ar) mainly silty; underneath Unit Ar a layer classified as sandy silt is located at the base of the embankment (Unit B). Underneath Unit B a clayey layer named Unit C is found. At the base of Unit C and thick sandy layer named Unit A is located. Unit A extends at around 30 m from ground surface and reaches the maximum depth of interest. The surficial water table is located a few meters belowe the ground surface. Liquefaction susceptibility analysis have beed performed using methods based on in-situ tests: 2 methods based on CPT were choosen (NCERR and Boulanger&Idriss 2014); in addition, a method that relies on Vs values was used (Andrus and Stokoe 2000). A reference pga value for the analysis equal to 0,29g. Additional considerations are suggested to evaluate the sensitivity of the liquefaction susceptibility to the variation of acceleration.
INTRODUCTION
The 20th and 29th of May 2012 Emilia region was struck by two main earthquakes having
ML=5,9 and 5,8 respectively and epicentres located close the villages of Finale Emilia and Mirandola, in Modena province; during the following days and weeks many aftershocks occoured, and some of them had magnitude higher than 5. The seismic sequence cause 27 fatalities, hundreds of injuries and billions of euros of damages. Many historical and industrial buildings suffered severe damages, due to the poor resistance of these structures to earthquakes loading.
A peculiar caractheristic of the Emilia earthquake, compared to other recent Italian events, is the occourence of relevant soil liquefaction, concentrated on some areas particularly susceptible to the phenomenon. The villages of San Carlo and Mirabello (FE), built on the paleochannel of Reno river were affected by ground deformations, sand ejecta, lifelines uplifting and significant damages to buildings and structures. Other area in Modena province showed smaller evidences of soil liquefaction.
In particular, the left embankment of an irrigation channel called “Canale Diversivo” showed a damage pattern along a section of its path close to the village of Scortichino. The section interested by the evidences is approximately 2 km long and some groups of houses are located on the embankment crest and showed cracks and deformations. The damages appear to be related to lateral movement affecting the embankment body, with formation of longitudinal fissures. The damage pattern appears compatible with occourence of soil liquefaction, especially at the light of a detailed in-situ and laboratory investigation campaign organized by “Gruppo di Lavoro AGI-RER”.
The aim of this research is to analyse the behaviour under seismic conditions of the embankment and of the soil profile underneath it, and finally to understand if liquefaction occoured and which layer is responsible for it.
A first part, including chapters 1, 2, 3 and 4 is dedicated to the bibliographical background used as reference to the development of the analysis carried on in the second part of the work: the second part, including chapters 5, 6, 7 and 8 is focused on Scortichino case study. Chapter 9 collects the results and conclusion of the study.
8
Chapter 1 is dedicated to the description of the main aspects available in literature related to soil liquefaction with a specific focus on case histories of liquefaction affecting river embankment structures.
Some of the methods available in literature for the evaluation of liquefaction susceptibility are presented in chapter 2. Attention is given to the main elements affecting the soil characterization, the quality of sampling and on the soil properties that play a key role in defining the stress-strain behaviour under cyclic undrained loading. Some methods based on compositional creteria are presented as well as methods based on in-situ tests like CPTU and direct Vs measurements. Finally, some paragraphs are dedicated to the description of advanced constitutive soil models available in literature and based on state concept; these models proved to be able to replicate the behaviour of soils under seismic loading and detect deformations and excess pore pressure build up.
Chapter 3 introduces some general features about site response analysis with attention on those aspects useful to develop a signal deconvolution in order to provide a input velocity time history for the numerical model created in chapter 8.
The computational platform used to perform a finite element numerical analysis of the river embankment is Opensees, described in its general features and main commands in chapter 4.
Chapter 5 introduced the case study, giving a general overwiev of the Emilia earthquake sequence and consequently a focus on the soil liquefaction evidences. The Scortichino case study, in terms of main features and description of damages is introduced in the last paragraph of the chapter.
The fact that the damage pattern, although not inducing a dramatic collapse of the embankment, has affected some residential buildings, inspired a particular attention from the authorities that created the “Gruppo di Lavoro AGI-RER” and organized a detailed investigation campaing with the aim of understanding the causes of the cracks formation observed on the crest. In chapter 6 all the results obtained from the in-situ and laboratory tests performed along the investigation sections are sintetically presented.
Based on the reconnaissance experiences performed in literature, on the theoretical background introduced in the first part and on the data provided by the investigation campaign a preliminary analysis is arranged in chapter 7. First, an accurate crack map is created, in order to obtain a global understanding of the fissures structure and of other evidences. A detailed reconstruction of the channel history and of the main geological features of the area is presented in the same section. The methods based on in-situ tests and presented in chapter 2 for the determination of liquefaction susceptibility are then used to analyse the main cross sections of interest. Sensitivity analysis for evaluating the
influence of the variation of water table level and of the peak ground acceleration on liquefaction are carried on.
Chapter 8 is then dedicated to the numerical analysis with the aim of obtaining detailed information about the deformative pattern of the embankment and of its foundation soil under undrained cyclic loading. The numerical model considers a 2D structure representing a significant cross section of the embankment. The soil profile is defined using the stratigraphy obtained by the investigation campaign. The critical layers in term of liquefaction analysis are studied using advanced constitutive models able to interpretate the deformative behaviour of the soil. The ground motion input at the base of the model is obtained through signal deconvolution from surficial ground motion station. Once the soil profile is defined and the constitutive models are calibrated through the laboratory tests data, the ground motion input is available and the geometry of the model are choosen, the numerical analysis can be run.
10
CHAPTER 1
General features of soil liquefaction
1.1 DEFINITION OF SOIL LIQUEFACTION
One of the most dramatic causes of damage to structures during earthquakes is the occurrence of liquefaction in saturated sand deposits. The term soil liquefaction is used to describe the sudden loss of strength of very loose soils that causes settlements, lateral spreading, material ejection, eccc…. In figure 1.1 some typical damage patterns due to soil liquefaction are presented (Seed et al. 2003). More details about the horizontal movements will be introduced in paragraph 1.6. The Niigata and Alaska earthquakes in 1964 are certainly the events that focused the attention on the phenomenon of soil liquefaction. Many earthquakes in the last 50 years have illustrated the significance and extent of damage that can be caused by soil liquefaction which and identified it as a major problem in earthquake engineering (Idriss and Boulanger 2008). For example, the loss of shear strength and stiffness in liquefied sands during the 1964 Niigata earthquake resulted in massive bearing failures beneath buildings (Figure 1.3), the uplift of buried stuctures like tanks and manoholes, and the collapse of bridges. Liquefaction was the cause of much of the damage to the port facilities in Kobe in 1995: the earthquake caused extensive liquefaction throughout the reclaimed lands and manmade islands, hosting one of the primary port facilities in the world. Other relevant earthquakes are the 1971 San Fernando and the 1989 Loma Prieta earthquakes in California, the 1995 Kobe earthquake in Japan, the 1999 Kocaeli earthquake in Turkey and more recently the Tohoku earthquake in 2011 in Japan and the Darfield (2010) and Christchurch (2011) earthquakes in New Zealand.
Soil liquefaction is also a major design problem for earth structures such as earth dams and tailing dams. The San Fernando Dam was struck in 1971 by a large earthquake and the earth dam almost totally collapsed causing the evacuation of around 80000 people. This dramatic event, that will be discussed more in detail in paragraph 1.6 has been
carefully studied and investigated and marked a major change in embankment design worldwide.
12
Figure 1.2 Sand boil from the 1989 Loma Prieta, California earthquake.
Figure 1.4 Manholes uplitifing in Urayasu, Japan, during Tohoku earthquake,11th March 2011 (Koki
Nagahama/Getty Images)
Loose sand tends to contract under the cyclic loading imposed by earthquake shaking, which can transfer normal stress from the sand matrix onto the pore water if the soil is saturated and largely unable to drain during shaking. The result is a reduction in the effective confining stress within the soil and an associated loss of strength and stiffness that contributes to deformations of the soil deposit. A common manifestation of liquefaction is the formation of sand boils at the ground surface by water flow through ground cracks. Figure 1.3 shows a typical sand boil profile. The damage from liquefaction is due to different factor: loss of strength and stiffness in the soils that have liquefied, ground deformations, sand boils and deformation induced by the ejcted material relocation, deformations and collapses related to lateral movements of slopes.
Figure 1.5 presents a flow chart to clarify the phenomena of soil liquefaction (Robertson 2009).
14
Figure 1.5 Flow chart to introduce liquefaction related phenomena (From Robertson 2009)
1.2 HISTORICAL AND GEOLOGICAL CRITERIA
A great amount of information on soil liquefaction is derived from post earthquake field investigations, showing that liquefaction often recurs at the same location when soil and groundwater conditions have remained unchanged. Liquefaction case histories are used to identify specific sites and site conditions where liquefaction may occur again in future earthquakes. Historical evidence of liquefaction is often used to map liquefaction susceptibility. The distance to which liquefaction can be expected strongly increases with increasing magnitude. There are maps based on historical events that report and relate liquefaction evidences to epicentral distance: those maps are helpful for estimation of regional liquefaction hazard scenarios but they offer no guarantee that liquefaction cannot occur at greater distances. Deep earthquakes (focal depths > 50 km) can produce liquefaction at greater distances compared to surficial earthquakes with same magnitude.
Soil deposits that are susceptible to liquefaction are formed within a relatively narrow range of geological environments. The main factors that must be taken into account are
the depositional and hydrological environment, and the age of the soil deposit. Geologic processes that sort soils into uniform grain size distribution and deposit them in loose produce soil deposits with high liquefaction susceptibility. Consequently, fluvial and colluvial deposits when saturated, are likely to be susceptible to liquefaction. Liquefaction has also been observed in alluvial-fan, alluvial-plain, beach, terrace, and estuarine deposits, even though with lower severity which decreases with increasing groundwater depth; the effect of liquefaction are most commonly observed at sites where groundwater is within a few meters of the ground surface. At sites where groundwater levels fluctuate significantly, liquefaction hazards may also fluctuate. Human-made soil deposited also deserve attention. Loose fills, such as those placed without compaction, are very likely to be susceptible to liquefaction. Stability of hydraulic fill dams and mine tailings piles, in which soil particles are loosely deposited by settling through water, remain an important contemporary seismic hazard. Well-compacted fills, on the other hand, are unlikely to satisfy state criteria for liquefaction susceptibility.
Compositional characteristics of soils such as particle size, shape, gradation and all those related to volume change are strongly conditioning liquefaction susceptibility. For many years, liquefaction related phenomena were thought to be limited to sands. Finer-grained soils were considered incapable of generating the high pore pressure and coarser-grained soils were considered too permeable for liquefaction to develop. Some filed observations have in the last 20 years proved that the family of liquefiable soils is much wider and in particular includes gravels and low plasticity silts, among sands. Liquefaction of gravels has been observed in the field and in the laboratory; in real conditions this has happened especially in presence of overlying impermeable layers that induced undrained conditions.
In addition, well-graded soils are generally more susceptible to liquefaction than poorly graded soils because the filling of voids between larger particles with smaller particles in a well-graded soil induces a lower volume change potential and, consequently, lower excess pore pressures. Particle shape can also influence liquefaction susceptibility. Soils with rounded particle shapes densify more easily than soils with angular grains and are for this reason more liquefiable. Tipically rounded particles can be found in depositional and fluvial areas, which result proner to liquefaction.
Cohesive sediments are not considered liquefiable but can develop significant strains under seismic conditions, particularly if the sediments are soft and sensitive and the ground motion is strong. The term “liquefaction” is used to describe the behavior of cohesionless soils (gravels, sands, and very-low-plasticity silts) and for cohesive soils (clays and plastic silts) the term “cyclic softening” is preferred.
16
1.3 CYCLIC AND MONOTONIC LOADING
Before describing methods to evaluate liquefaction potential, it is important to first explain the phenomena of soil liquefaction.
The principal features of the response of saturated sand to drained and undrained monotonic and cyclic loading are described. Most of studies that form the theoretical base of the liquefaction analysis under seismic conditions refer to clean sands. As mentioned before, the phenomenon has been observed not only in sandy soils but also in silty and gravelly soils. The results obtained for sandy soils are used also as reference theory even for different materials, but more studies are required aspecially for what concerns the models calibration. The methods for the evaluation of lilquefaction susceptibility introduced in chapter 2 have been improved in terms of database to include different kinds of soil.
The critical state concept is a key element for the analysis of monotonic and cyclic behaviour under drained and undrained condition. The critical state for a soil is defined as conditions when it is being sheared continuously and no further changes in volume or stress are occurring. All the points where this condition happen form a line called critical state line (CSL), which represents all possible combinations of void ratio and confining stress at the critical state. In case the the critical state line satisfies the requirement of a steady rate of deformation, the line is called “steady state line”. Typically the steady state and critical state lines are can be assumed to be the same line.
Figure 2.1 shows the critical state line for a sand and the loading paths: the critical state line is represented in a graph the void ratio and mean affective stress are on the axis. The critical state line divide all the possible combinations of void ratio values and mean effective stress values into two region called “dense of critical” and “loose of critical”. The loading paths presented in figure 1.6 show the behaviour of the soil under monotonic loading for drained and undrained conditions; the points on the “loose of critical” and “dense of critical regions” tend to reach the critical state line with a contractive behaviour (points in the “loose of critical region”) and dilative behaviour (points in the “dense of critical” region).
It is relevant to note that The stress-strain response of sand to monotonic or cyclic loading is strongly dependent on the sand’s relative density (DR) and the critical state
approach is particularly able to capture the effects of volume changes.
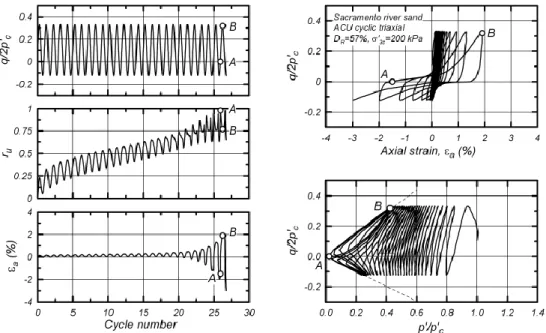
In an undrained cyclic loading test (figure 1.7), the sand matrix or skeleton can tend to contract under the cyclic loads, but the resulting rearrangement of sand particles instead transfers normal stresses from the sand matrix to the pore water (i.e., σ stays constant, while σ’ decreases and u increases) (Idriss and Boulanger 2008). The excess pore water pressure (Δu) generated during undrained cyclic triaxial loading is normalized by the minor effective consolidation stress (σ’3c); this ratio is called the
18
Figure 1.7 Pore pressure generation during cyclic loading (from Idriss and Boulanger 2008)
For standard cyclic simple shear tests, ru is instead computed on the basis of the vertical effective consolidation stress (σ’vc):
The maximum possible value for ru is again 1.0when the total vertical stress is held constant, as in a standard cyclic simple shear test. The ru = 1.0 condition is often called “initial liquefaction”. Several features of the behavior in Figure 1.8 are worth noting. The
ru increased progressively throughout cyclic loading until ru = 1.0 was reached after about 27 cycles of loading. The axial strains (εa) remained relatively small (a fraction of 1%)
until p’ approached zero and ru approached 100%, after which the axial strains increased to about 2% in less than 2 additional cycles of loading. Axial strains would have increased very rapidly with continued cyclic loading, although this particular test was stopped after
reaching 3% strain. The corresponding stress-strain response shows rapid softening as
p_ approached zero, with the hysteretic loops taking on an inverted s-shape. The stress
path—that is, q/(2p’c) versus p’/p’c—moved progressively toward the origin during cyclic
loading until it stabilized with repeating loops emanating from the origin (Idriss and Boulanger 2008).
Figure 1.8 Undrained cyclic loafing of sands (from Idriss and Boulanger 2008)
1.4 REMEDIATION TECHNIQUES
Sand compactions piles and stone columns must follow a regular and uniform distribution on all the area of interest, and must form a net with piles sufficiently close: typical distances vary from 0,5 to 2 m, and strongly depends on the soil characteristics. The geometry of the piles, in terms of diameter, is also another important aspect, together with the properties of the filling material used (figure 1.9)
20
Figure 1.9 Typical arrangement for sand compaction piles and stone columns (from Yamaguchi et al. 2012)
Robertson (2009) presented a chart (figure 1.10) with a summary of all the main remediation technologies adopted and available.
Figure 1.10 List of the main remediation technology for soil liquefaction (from Robertson 2009)
1.5 LIQUEFACTION ASPECTS OF RIVER EMBANKMENTS
1.5.1 General elementsEarth structures such as dams and embankments are quite vulnerable to liquefaction effects and require a careful analysis. In particular these structures meet the presence of a surficial water table and a formed by materials that can meet the compositional requirements described in paragraph 1.2. Another critical aspect that is in reality quite common, is the presence of liquifiable layers underneath the earth structures. For
22
example, the fact that a river embankment is placed on a soil that is made of river deposition sediments, young and saturated, might induce liquefaction at the base and conquequent damages on the earth structure. In other cases, liquefaction might occour inside the earth structure itself.
Figure 1.11 shows typical damage patterns of slopes, embakments, dams and other earth structures characterizex by the presence of a slope. The common feature of these structures is called lateral spreading.
Figure 1.11 Typical damage pattern for sloping ground connected to liquefaction (from Seed et al. 2003)
Figure 1.12 shows a typical situation manifestation of damages and material ejecta for an embankment with inclusion of sandy liquefiable layer in its core.
Figure 1.12 Liquefaction of sandy layers in embanment body (from idriss and Boulanger 2008)
Soil liquefaction can occour in the following situatios:
• coastal areas, surficial water basins and river embankments; • harbours,
• holocene or pleistocene loose sand deposits with high water table level (H < 5 m)
24
Oka et al. (2012) suggested a classification for the damage pattern due to soil liquefaction for earth river embankments and earth dam in general. Different evidences can appear on the embankment surface. Typically heaving at the embankment toe and, going to more severe events, settlement of the crest, longitudinal cracks, lateral deformations and, in the worse cases, total collapse of the structure. San boils, can occour more easily at the toe, and only for severe events, on the crest and on the slopes because of the higher resistance met by the liquefied soil to go through the embankment body. A settlement of the embankment base, and consequent subduction, can be observed when there is liquefaction of the layers underneath the earth structure.
1.5.2 Relevant case histories 1.5.2.1 San Fenando Dam
COUNTRY: U.S.A. MAGNITUDE: 6.6
LOCATION: Lower/upper San Fernando dam DATE: 9/02/1971
26
San Fernando Dam case hitstory is one of the most famous, resonant and well documented cases of liquefaction of an earth dam under seismic load. During the same event 2 earth dams experienced severe damages: lower San Fernando dam e Upper San Fernando dam.
The slide that formed in the internal side of the Lower San Fernando Dam during the 1971 San Fernando earthquake and caused the evacuation of about 80,000 people who were living close to the dam. The dramatic extent of the slope failure is shown by a photo (Figure ).
From Jitno 2009
The liquefaction of loose sandy layers at the base of the embankment has caused the complete collapse of the Lower dam. At the end of the seismic event the free surface was only 1,5 m high. The liquefaction of reported sandy soil in the lower part of the internal side of the dam caused the almost total collapse of the structure.
Small damages have instead occured at the Upper San Fernando dam, with maximum deformations of the embankment body close to 0,8m. Remediation works have been carried on in order to strengthen and stabilize the dam. In particular the embankment body has been widened on the external side, the material has been addictionally compacted and the stone columns have been realized.
From jitno 2009
28
COUNTRY: JAPAN MAGNITUDE: 7.8
LOCATION: Kushiro-Oki DATE: 15/01/1993
The Kushiro-oki earthquake has caused extensive liquefaction effects on river embankments. Previuosly the problem of liquefaction of river embankments was considered marginal, compared to other liquefaction effects on structures. In fact the low probability of having a strong earthquake simultaneously to a river flood was thought to consider not particularly dangerous the damages occoured to river embankment. Its was expcted to restore the earth structures in a reasonably short time and make it able again to resist to a river flood. The high extenstion of the damaged section has instead made clear that the reparation time would have been much longer than expected. The probability to face a river flood before the end of the reparation works has been thus considered unacceptable and this had pointed out the need to provide mitigations techniques to apply on earth structures to prevent possible damages connected to seismic soil liquefaction.
Fiume Kushiro - da Sasaki 2009
During the Kushiro-Oki earthquake soil liquefaction has been observed inside embankment bodies realized with sandy material. Subsidence of the embankment crest, widening at the toe and slope rotations have been observed. The embankment is built on a peat layer, not liquefiable. The dense sandy layers underneath have not shown liquefaction effects.
It appears clear that the consolidation settlement of the peat layer due to the weight of the embankment has allowed the water table to reach the base of the embankment. The sand used to realize the embankment was not compacted with the aim to reduce the settlement of the peat underneath it, and this choice has increased the liquefaction susceptibility of the soil.
30
Longitudinal cracks of important size has appeared along the crest and close the the slopes, as well as lateral spreading and swelling of the toes.
Sections with same characteristics in terms of geometry and materials have reacted differently to the event. The differences were quite relevant and this has been related to a 3D effect in the embankment behaviuor Damages have been observed both on riverside and landside, but were more relevant on riverside.
The escavation of trenches and more detailed internal inspections have proved the presence of internal fissures not visible on the external surface. This kind of damages is considered to be particularly dangerous for the embankment strength during flood event, since it cannot be discovered with surficial inspections.
The monitoring wells realized in the sorroundings and already exhisting before the earthquake have pointed out that the water table level has increased during the event. This fact, combined with the presence of loose sand at the base of the embankment has created the conditions for soil liquefactions to occour. In figure… it is possible to see the time required for the water table to reduce again to its normal level, that is below the embankment base. To reduce most of the increase the time required is around a couple of days. This makes clear that aftershocks taking place in a short time, even of lower intensity than the main event, can generate further liquefaction. To prevent the presence of the water table and the storage of rain water inside the embankment body it is of particular importance the realization of drainage works.
Figure…shows that the subsidence of the embankment placed on a soil with low bearing characteristics has been in some sections higher than 1 m before the earthquake. This has created the conditions for soil liquefaction. From experimental measurements it is possible to establish a correlation between the amount of pre-earthquake subsidence and the embankment crest settlement.
32
Restoration works have been realised by the use of sand compaction piles (SCP) in order to increase the density and the strength of the embankment itself and of the soil underneath it. On the sides piles with shorter length have been used in order to create a transition zone and reduce differential settlements. A drainage layer at the toe on landside has been installed to prevent the accumulation of rain water.
1.5.2.3 Tohoku earthquake
COUNTRY: JAPAN MAGNITUDE: 9
Tohoku earthquake has affected a wide area of the eastern coast of Japan, in terms of shaking intensity, of duration and of the size of the rupture plane. Many aftershocks with high magnitude have caused repeated liquefaction phenomena and in most cases with increased severity of damages.
Evidence of soil liquefaction has been detected on: • Urban areas;
• River embankments; • Road structures; • Coastal zones; • Agricultural fields.
The tsunami that followed the main shock has deleted part of the liquefaction evidence, as it appears from figure….
34
da Yamaguchi et al. 2012 (a)
Many sand boils have been observed on alluvial planes, especially close to rivers or extinct rivers. Figure…. Shows the situation in 1975, with the presence of a channel that in the picture taken in 2011 appears filled with soil material. It appears clearly that sand boils are located along the the path of the old channel. Extensive fissures are a typical evidence of soil liquefaction. The semicircular shape of the fissures in figure … follows, like the situation of figure…, the path of an old channel.
da Oka et al. 2012 (a)
River embankments that were affected by soil liquefaction are located on a wide and extended area. Liquefaction has been observed inside the embankment bodies and in the soil underneath it as well. Maps in figure… show river embankments that experienced liquefaction in the north-east area of Hokkaido Island and along the basin of Edo river.
The cracks generated by soil liquefaction on the crest of river embankments have the same direction of the embankment itself. Figure ….shows longitudinal cracks long up to 100 m along Naruse river, together with lateral spreading and crest settlement. In this case liquefaction has occured in the soil underneath the embankment.
36
da Sasaki et al. 2012
In figure…. damages on a road built on an abandoned river path are reported. Rotation of the body and lateral spreading are clearly visible.
Swelling at the embankment toe is another tipycal element related to soil liquefaction.
Da Tsukamoto et al. 2012
Lateral spreading along Jukken-Gawa river; settlements have caused damages to the road and to the building behind. The great amount of material ejected has partly occluded the bed of Jukken-Gawa river.Effects of liquefaction along abandoned bed of Naka and Tone rivers. There is evidence of sand boils and lateral spreading.
38
In the extreme cases the total collapse of the embankment can be reached. The embankment along the old path of Naruse river has totally collapsed on a section around 500 m long. The height of the structure at the end of the event has been reduced of 2/3 respect to the original one. Longitudinal fissured with ejected sandy material are clearly visible.
It is evident the almost complete collapse of the earth structure along the Abukuma river. The embankment height has reduced to 2,8 m from the initial 5,7 m, that means a reduction bigger than 50%. Longitudinal cracks around 1 m deep, with extensive sand ejection are present on a wide part of the embankment. The damages have occoured along all the river section, with predominance on the landside.
Da Oka et al. 2012
Damage pattern of the embankment of river Edo, close to Nishisekyado. Liquefaction occoured in the alluvial sandy layer (As1) located immediately under the embankment body. Liquefaction affected mainly the landside, in the direction of a clayey layer (Ac1). The settlement of the crest is close to 1 m. From the cracks that formed on the slopes sandy material was ejected.
40
Da Oka et al. 2012
Trenches are a very useful tool to recognize sand boils and flows of material in the embankment body. In this way it is also possible to know with certainty which layer, or part of layer, exactly liquefied. Upwards flow paths are clearly visible. In this specific case liquefaction occurred in the lower layer of the embankment, where sandy material with N<5 is present. The presence of rain water is considered the possible cause of the liquefaction event. It is important to point out that with a trench it is possible to notice the presence of material flows that don’t reach the surface. In some cases it is possible to detect liquefaction phenomena that occoured during past earthquakes. The embankment of figure… has experienced a settlement of around 5,5 m with a total height of around 13 m. Tha damages caused by soil liquefaction mainly occured on alluvial depots and along present and past river beds and embankments. Another not negligible situation potentially prone to soil liquefaction is the presence of hydraulic filling. In Japan it is quite typical to have structures on reclaimed areas, where soil material, usually sand, has been placed with hydraulic filling technique. In Onanoma city all liquefaction phenomena occoured on reclaimed areas, where hydraulic filling was used. (fig….). Other parts of the city didn’t show any relevant damage.
Dams are susceptible to liquefaction in the same way as river embankment. Many dams, both realized with earth and concrete are present in the area. Damages have affected many dams, both made of concrete and of earth. Concrete dams, despite having shown a strength higher than earth dams, have reported damages that are not negligible. Repairs consisted of rebuilding and substitution of the part of the dam body realised with material that showed poor performance. In figure… damages occoured to the Ishibuchi dam during the 2008 earthquake are visible.
In figure … the same section is represented after the 2011 earthquake. Apparently no damages were observed, as a proof of the effectiveness of the repairs.
Da Yamaguchi et al. 2012 (a)
The most used remediation techniques used in Tokyo region are compaction techniques. Most of interventions were performed using sand compaction piles (SCP) and stone columns. Solidification techniques like Lattice type deep mixing soil (TOFT) and drainage techniques (gravel drains, GD) have also proved to be efficient.
42
Da Yamaguchi et al. 2012 (a)
Tokyo has experienced significant liquefaction effects, mainly in reclaimed areas where hydraulic fill was used. In these areas many work for reducing liquefaction susceptibility have been performed during the years In figure…. liquefied areas are indicated; they follow precisely the areas where hydraulic fill was used (F layer in the stratigraphy of figure…).
Da Yamaguchi et al. 2012 (a)
Sand Compaction piles (SCP) and gravel drains (GD) intervention have shown good results. Similar techniques have also been used on river embankments with positive results. Along Tone river, on some sections gravel drains have been realized. Earthquakes occoured subsequently to the drain installation have shown a significantly different behaviuor between the section equipped with gravel drains and the sections with the original embankment structure. The sections with gravel drains have experienced almost no damages, differently from the sections without any remediation work.
Da Sasaki et al. 2012
Gravel drains can be installed underneath the embankment or inside the embankment body itself, according to the liquefaction susceptibility of the different layers.
44
Da Sasaki et al. 2012
Da Sasaki et al. 2012
Sections treated with gravel drains represented with green line in figure…. didn’t show liquefaction evidences. The sections indicated with red line, which were not improved with gravel drains were almost all affected by damages, even if with different levels of severity.
Da Sasaki et al. 2012
In Figure … different partes of Naruse river, located at a short distance the one from the other are shown. After an earthquake occurred in 2007 some parts of the river embankment were consolidated with gravel drains. In figure … the effects of Tohoku earthquake are shown. It appears very clearly that the section with gravel drains performed much better. In figure … the same embankment after an earthquake event of 2003 is shown.
1.5.2.4 Tottoriken-Seibu earthquake
COUNTRY: JAPAN MAGNITUDE: 7.3
46
Da Sasaki et al. 2004
The use of sand compaction piles, stone columns and gravel drains has proved to be very effective for mitigation of liquefaction potential both on buildings and on embankments and earth structures in general. The cost of these remediation techniques is however rather high, especially considering that river embankments have usually remarkable extensions. The use of geogrids can be a valid alternative solution. Figure….. refers to the remediation works performed on earth dam around Naka lake after the 1996 earthquake. The Tottoriken-Seibu earthquake that occoured in 2000 in the same area gave the opportunity to evaluated the effectiveness of this technique. The crest experienced a settlement (figure….) which was anyway quite modest and allowed the dam to maintain its functions without reducing its strength. Figure… shows a section were higher deformations were observed caused by the distortions and rotation of the geogrids and by the reduction of the interspace of the different geogrids layers, probably due to the soil softening. In this case liquefaction is thought to be happened inside the dam body.
Tottoriken earthquake has thus shown that geogrid use can be effective for liquefaction potential reduction on river embankment. The results point out that compaction techniques are a better solution compared to geogrid. On the other hand geogrid have a much lower installation cost and for that reason can be considered a valid solution for river embankment and earth structures, which can tolerate some level of deformations, without loosing their operation.
1.5.2.5 Christchurch earthquake
COUNTRY: NEW ZEALAND MAGNITUDE: 6.3
48
Christchurch earthquake has caused one of the most extensive soil liquefactions events ever observed. The magnitude of the event was not particularly high, but the fact that the epicentre was under the city itself has generated very high accelerations in many neighboroughs (fig…..). These input motion combined with a soil prone to liquefaction and high water table level has caused huge damages to buildings, river embankments and service lines.
The geological characteristics of Christchurch are quite complex. The western part of the city is based on sediments carried by Waimakariri river, which is now flowing approximately 10 km north from the city. The eastern part of the city is showing a more varied geological structure. For long time it has been occupied by by swamps and coastal deposits. This area has been covered with alluvial deposit carried by the 2 city rivers, the Avon and the Heathcote.
Almost all the eastern area of Christchurch experienced soil liquefaction. Most of the embankment, especially those of Avon river were completely damaged.
50
From Cubrinovsky 2011
Liquefaction took place in the loose sandy layers located between 3 and 8 m from ground surface.In the liquified area the water table level is rather high, around 1-2 m from the surface.
From Cubrinovsky 2011
Lateral spreading effects have caused damages not only to the earth structures but also to roads and buildings in the sorroundings, considering the level of urbanization of the area. Lateral spreading occoured in fact even in zone with very small inclination of the surface; this means that not only the proper embankment structures faced damages but also the slightly inclined surfaces in the proximity of the river path.
Lateral spreading caused important damages to bridge structures. The horizontal movement of the upper layer of soil that liquefied was following the surface inclination and directed towards the river bed. This caused the back rotation of the abutments, since the deck was blocking the movement of the top of the abutments. Almost all bridges on Avon river were damaged by lateral spreading and the all showed a similar damage pattern, even if with different levels of severity. Fortunately, the characteristics of the bridges along Avon river, which are of short length, limited height and of squat and stiff structure avoided total collapses and catastrophic consequences.
52
Typical longitudinal cracks on the crest of the embankment. Samples taken from sand boils proved that the surficial layer liquefied.
Emergency repairs on the earth structures were realized with geogrids, in order to protect the eastern neighbourhood of the city in a short time from high tides. The earthquake, and the consequent liquefaction, caused in fact the subsidence of many areas close to Avon estuary. The subsidence was quite relevant, many tens of cm and in some zones around 1 m. This made any areas vulnerable to high tides.
54
CHAPTER 2
Methods
for
liquefaction
triggering
The main aspects of sand behaviour and soils in general under seismic conditions have been introduced in chapter 1. A further step is the development of methods able to evaluate the liquefaction susceptibility. This is a difficult task to reach because the soil behaviour is conditioned by several factors, including the number of loading cycles, relative density, confining stress, depositional method, fabric, prior stress-strain history, age, cementation, and other environmental factors. Many methods have been suggested in literature: some of them are quite simplified and base of soil properties that can be easily obtained. Some methods, that will be described in detail in paragraph… are based on in-situ tests such as CPTU, SPT and SDMT; other methods are instead based on laboratory tests. There are, finally more sopthisticated methods based on advanced soil constitutive models.
2.1 Main aspects affecting the estimation of liquefaction
susceptibility
The liquefaction occourence of a certain soil can be considered as a dual problem: on one side there is the soil resistance, considered as the soil tendency or non-tendency to develop excess pore water pressure and to loose its strength; on the other side there is the cyclic load applied to the soil in terms of frequency, number of cycles ecc.. Obviuosly the two aspects are strictly related since a same soil could liquefy or not liquefy is subjected to two different cyclic loads.
Focusing first on defining soil properties in resisting to cyclic loading, apparently they could be determined by obtaining high-quality field samples and then testing them in an appropriate laboratory device. Unfortunately sand sampling is a quite delicate operation: the use of conventional techniques provides quite unreliable results, because of the excessive sample disturbance. More reliable sampling techniques that provide
lower sampling disturbance are available even if they are usually associated to a great costs increase and for this reason not always usable. In any case, every kind of sampling provide some disturbance and therefore a good knowledge of how the sampling technique affects the laboratory tests results is required.
Conventional tube sampling can be performed using more refined high-quality sampler in order to reduce the disturbance. An alternative can be the frozen sampling techniques, which is considered nowadays the best technique to obtain undisturbed samples in sandy soil, because of its ability to preserve the original void distribution and fabric structure: the sand is frozen in situ and then samples are obtained by coring the frozen ground. The frozen samples are transported to the laboratory and tested. A more recent technique known as Gel-Push technique (……) has proved to be a valid alternative to the frozen sampling: a tube sampler is filled with a special gel before penetrating the soil for sampling. The gel has the function to maintain the in-situ soil structure without altering the soil structure. Experiments have proved that Gel-Push technique provide results similar to the frozen sampling technique with the advantage of lower operational costs.
Reconstituted specimens are an additional option to provide samples for laboratory test. The most traditional moist tamping technique have prove to provide results in terms of soil density and fabric not enough accurate for good quality testing. It is relevant to note that for liquefaction aspects in particular, the volumetric properties of soils are of foundamental importance and it is essential to use samples with the same characteristics of in-situ soils. A secondo option to provide reconstituted specimens is the pluvation technique, which provides good results, especially considering that liquefiable soil are young soils tipically coming from fluvial deposition and having layering procedure similar to the in-situ one helps in obtaining good samples. In any case, reconstituted samples of a specific soil should be compared with undisturbed samples of the same soil in order to calibrate the reconstitution procedure and obtain the same relative density. Reconstituted sand specimens must be used with care and with a good calibration and comparison with undisturbed samples since in situ fabric, cementation, aging affect greatly the resistance of soils under cyclic loading and in the reconstitution process those properties can be easily altered (Porcino and Ghionna 2002).
In summary, careful laboratory testing can provide a valuable measure of a soil’s cyclic stress-strain behavior, if the samples are truly undisturbed.
Nonuniformities of strain in laboratory test specimens can alterate experimental results. A tipycal situation that occour on dense sand samples during drained loading is the formation of shear bands: after the formation of the shear band, any additional deformation take place along the band.
56
From Idriss and Boulanger 2008
In addition, there are in situ conditions that cannot be replicated in laboratory tests, even using a high quality sampling technique. The excess pore water pressures generated by a generic perturbation, mainly seismic events, dissipate with time through a water flow from the areas with high water pressure to areas ti lower water pressure. The water flow affect the soil behaviour (strength loss and deformation) and is greatly conditioned by the site stratigraphy and can hardly be evaluated through laboratory tests.
From Idriss and Boulanger 2008
Tipically the excess pore pressure generates in the liquefiable soil and the flow goes in the direction of non-liquefiable soils or less liquefiable soils and eventually of the surface, in this case with material ejecta. The flow is often concentrated along cracks and localized channels and producing sand and water boils at the ground surface. In some cases the water flow can increase the water pressure in layers with lower liquefaction susceptibility until inducing liquefaction in those layers as well. Pore water can also accumulate in the interface between a liquefiable layer and an impermeable low liquefiable layer, such as a clayey layer, creating water films.
The development of analytical procedures for assessing liquefaction triggering is based on empirical data to provide the link between liquefaction resistance and in-situ test parameters. Cyclic triaxial tests and cyclic simple shear tests are the two most reliable laboratory test for studying the cyclic behaviour of soils. The two kind of tests provide different results on testing the same specimen, due to the different loading scheme used in the devices. For evaluating liquefaction purposes cyclic shear test is considered more reliable because the loading scheme is more similar to the real loading pattern provided by a seismic event on a soil profile.
Liquefaction of saturated sands can be triggered by different combinations of uniform cyclic shear stress ratio (CSR), which is the uniform cyclic shear stress divided by the initial effective confining stress, and the number of loading cycles (N). A greater CSR will trigger liquefaction in fewer loading cycles, whereas a smaller CSR will require more loading cycles. This aspect of behavior is illustrated by the results of the shaking table tests by De Alba et al. (1976), as shown in Figure ().
58
From Idriss and Boulanger 2008
The CSR that is required to reach liquefaction in a specified number of loading cycles may also be called cyclic resistance ratio (CRR). The relationship between the CRR and
N, can generally be approximated with a power function as
where the parameters a and b are experimental parameters.
The CRR of sand increases with increasing relative density. The CRR of sand also depends on the effective confining stress, which reflects the fact that the tendency of sand to dilate or contract depends on confining stress. Seed (1983) introduced the overburden correction factor (Kσ ) as a way to represent the dependence of the CRR on consolidation
where CRRσ’c is the CRR of a soil under a specific value of effective consolidation stress
σ’c, and CRRσ’c=1 is the CRR of the same soil when σ’c= 1 atm.
The effect of an initial static shear stress on the undrained cyclic loading behaviour and consequently on pore pressure and shear strain generation of granular soils is not negligible (Idriss and Boulanger 2008). This effect is for example shown on the experiments illustrated on figure …..
From Idriss and Boulanger 2008
The generation of excess pore pressure and shear strains during undrained cyclic loading of saturated sand is significantly affected by the rotation of principal stress directions, which reverses the shear stress direction on certain planes. Seed (1983) developed the
Kα correction factor to represent the effects of an initial static shear stress ratio (α) on the cyclic strength. Kα is defined as the cyclic strength for some value of α, divided by the cyclic strength for α = 0:
Kα depends on relative density and confining stress, as illustrated in Figure. The ξR index appearsto provide a reasonable means of accounting for the combinedinfluence of relative density and confining stress on Kα relationships for sands.
60
The CRR is typically taken at about 15 cycles of uniform loading to represent an equivalent earthquake loading of magnitude (M) 7.5, i.e., CRR7.5. The CRR for any other size earthquake can be estimated using the following equation:
CRR =(CRR7.5 ) (MSF)
where MSF is the magnitude scaling factor.
2.2 COMPOSITIONAL CRITERIA
One of the first and simplest methods for the evaluation of liquefaction susceptibility is the so called Chinese criteria (Wang, 1979) which plots the soils liquefiable and not-liquifiable on a chart based on water content (W) and liquid limit (LL); in addition there are some requirements related to the fine content. The Chinese criteria is based on empirical data from liquefaction case histories and doest not consider the ground motion parameters. In does not provide then a Factor of Safety ad the Seed and Idriss (1971) does, but simply evaluates the soils that, according to their compositional characteristics might be liquefaction prone.
The soil properties in terms of type and state (void ratio, effective confining stress, stress history, etc.) are the key elements for evaluating the behaviour under cyclic loading: to seismic loading varies with soil type and state. The same concept emerging from the
62
Chinese criteria has been clarified by Boulanger and Idriss (2004) distinguishing between
sand-like and clay-like behavior. Sand-like soils are susceptible to cyclic liquefaction
when their behavior is typically characterized by Plasticity Index (PI) < 10 and Liquid Limit (LL) < 37 and natural water content (wc) > 0.85 (LL) (Robertson……). Clay-like soils are generally not susceptible to cyclic liquefaction when their behavior is characterized by PI > 15 but they can experience cyclic softening (Robertson….).
Bray and Sancio (2006) provided their own criteria based on soil properties, considering water content (W), liquid limit (LL) and plasticity index (PI) and obtaining a chart for the evaluation of liquefaction susceptibility (fig ……). This latter method considers also a transition zone which must be evaluated with care and with additional tests.
2.3 Methods based on in situ tests
The "simplified procedure", introduced by Seed and Idriss (1971), is currently used for evaluating the liquefaction potential. This method requires the calculation of the seismic demand on a soil layer generated by the earthquake, or cyclic stress ratio (CSR) and of the capacity of the soil to resist liquefaction, or cyclic resistance ratio (CRR).
If CSR is greater than CRR, liquefaction can occur (factor of safety against liquefaction). The cyclic stress ratio CSR is calculated by the equation:
where τav = average cyclic shear stress, amax = peak horizontal acceleration at ground surface generated by the earthquake, g = acceleration of gravity, σv0 and σ'v0 = total
and effective overburden stresses and rd = stress reduction coefficient dependent on depth, mostly in the range ≈ 0.8 to 1.
CRR is instead calculated with different methods based on in-situ or laboratory tests and provide the resistance that the soil is able to provide against a cyclic load.
One reason for the continued use of the SPT has been the need to obtain a soil sample to determine the fines content of the soil. However, this has been offset by the generally poor repeatability of the SPT data.
Currently, the most popular simple method for estimating CRR is the CPT because of its repeatability and the continuous nature of its profile.. A simplified method to estimate CSR was also developed by Seed and Idriss (1971) base on the maximum ground surface acceleration (amax) at the site. This simplified approach can be summarized as follows:
where tav is the average cyclic shear stress; amax is the maximum horizontal acceleration at the ground surface; g is the acceleration due to gravity; svo and svo¢ are the total and effective vertical overburden stresses, respectively; and rd is a stress-reduction factor which is dependent on depth which can be calculated with the equation:
2.3.1 NCEER method
In recent years, there has been an increase in available field performance data, especially for the CPT. The recent field performance data have shown that the existing CPT-based correlations to estimate CRR are generally good for clean sands. The proposed equation to obtain the equivalent clean sand normalized CPT penetration resistance, (qc1N)cs, is a function of both the measured penetration resistance, qc1N, and the grain characteristics of the soil, as follows:
64
Grain characteristics such as apparent fines content of sandy soils can be estimated directly from CPT data using soil behaviour charts (Robertson….) available in literature, since CPT friction ratio increases with increasing fines content and soil plasticity. The measured penetration resistance can then be corrected to an equivalent clean sand value. Using the CPT chart by Robertson (1990), the soil behaviour type index, Ic, can be defined as follows:
An important reference value, which prove to be a good tool for a preliminary liquefaction susceptibility evaluation, is the Ic value = 2,6. Tipically soils with Ic>2,6 are not liquefiable, pointing out that Ic is a soil behaviour type index.
66
The chart presented in figure…. (Robertson…) provides a correlation Ic and the fine content, combined with the plasticity index. The chart is of great importance for the liquefaction related problems, since fine content and plasticity paly a key role on it. Relevant to note that the correlation based on the CPT is affected by a level of uncertainities since the CPT measured parameters (qc, fs, and u) responds to many other factors affecting soil behaviour, such as soil plasticity, mineralogy, sensitivity, and stress history. Figure… shows the chart for obtaining the correction factor Kc from the Ic values.
When thin sand layers are embedded in softer deposits, the CPT will not always measure the correct mechanical properties: the difficulty of analysing profile with complex layering has been proved in different situations (Robertson…) and consequently addional tests must be performed and different analysis techniques should be combined. Procedures are proposed with the aim to correct cone data in thin layers; for example a correction factor is given by Robertson and Wride (1998) in the NCEER report and will be used in chapter 7 to perform preliminary analysis.
Using the equivalent clean sand normalized penetration resistance (qc1N)cs, the CRR (for M = 7.5) can be estimated using the following simplified equation:
The proposed integrated CPT method is summarized in Fig. () (Robertson ….) in the form of a flow chart.
68
Apply the simplified (NCEER) approach as described by Youd et al (2001) using generally conservative assumptions. The recommended CPT correlation for sand-like soils is shown in Figure () and can be estimated using the following simplified equations suggested by Robertson and Wride, (1998):
The correlation to estimate CRR7.5 for silty sands is different than that for clean sands and a correction is needed to determine an equivalent clean sand penetration resistance based on grain characteristics. Robertson and Wride (1998) suggest estimating an equivalent clean sand cone penetration resistance with the equation :
(Qtn)cs = Kc Qtn
where n ≤ 1.0 (see Figure () for flow chart).
The factor of safely against cyclic liquefaction is defined as:
Where MSF is the Magnitude Scaling Factor to convert the CRR7.5 for M = 7.5 to the equivalent CRR for the design earthquake. The NCEER recommended MSF is given by:
Clay-like materials tend to develop pore pressures more slowly under undrained cyclic loading than sand-like materials and generally do not reach zero effective stress under cyclic loading. Hence, clay-like materials are not susceptible to complete cyclic liquefaction. However, when the cyclic stress ratio (CSR) is large relative to the undrained shear strength ratio of clay-like materials, deformations and softening can develop. The term ‘cyclic softening’ is used to define this build-up of deformations under cyclic loading in clay-like soils. The CRR for cyclic softening in clay-like materials is controlled by the undrained shear strength ratio, which is controlled by stress history (OCR).
70
2.3.2 Boulanger & Idriss (2014)
2.3.3 Andrus & Stokoe (2000)
The Andrus and Stokoe (2000) is based on the same procedure introduced by Seed and Idriss (1971) described in the previuos paragraphs. The seismic demand on a soil layer generated by the earthquake, or cyclic stress ratio (CSR) is obtained with the same formulation used for the other methods based on CPT tests:
where τav = average cyclic shear stress, amax = peak horizontal acceleration at ground surface generated by the earthquake, g = acceleration of gravity, σv0 and σ'v0 = total and effective overburden stresses and rd = stress reduction coefficient dependent on depth, mostly in the range ≈ 0.8 to 1.
The liquefaction resistance CRR, which was derived in the previous paragraphs from CPT tests, is instead based on Vs measurements. CRR is generally evaluated from in situ measurements (normalized to overburden stress) by use of charts in which the CRR curves define the liquefaction and no-liquefaction areas on the charts, mainly based on