2018-03-13, 17*42 Web of Science [v.5.27] - Export Transfer Service
Close Web of Science
Page 1 (Records 1 -- 1) [ 1 ]
Record 1 of 1
Title: Integration and Fixation Preferences of Human and Mouse Endogenous Retroviruses Uncovered with Functional Data Analysis
Author(s): Campos-Sanchez, R (Campos-Sanchez, Rebeca); Cremona, MA (Cremona, Marzia A.); Pini, A (Pini, Alessia); Chiaromonte, F (Chiaromonte, Francesca); Makova, KD (Makova, Kateryna D.)
Source: PLOS COMPUTATIONAL BIOLOGY Volume: 12 Issue: 6 Article Number: e1004956 DOI: 10.1371/journal.pcbi.1004956 Published: JUN 2016 Times Cited in Web of Science Core Collection: 4
Total Times Cited: 4
Usage Count (Last 180 days): 0 Usage Count (Since 2013): 0 Cited Reference Count: 129
Abstract: Endogenous retroviruses (ERVs), the remnants of retroviral infections in the germ line, occupy similar to 8% and similar to 10% of the human and mouse genomes, respectively, and affect their structure, evolution, and function. Yet we still have a limited understanding of how the genomic landscape influences integration and fixation of ERVs. Here we conducted a genomewide study of the most recently active ERVs in the human and mouse genome. We investigated 826 fixed and 1,065 in vitro HERV-Ks in human, and 1,624 fixed and 242 polymorphic ETns, as well as 3,964 fixed and 1,986 polymorphic IAPs, in mouse. We quantitated >40 human and mouse genomic features (e.g., non-B DNA structure, recombination rates, and histone modifications) in +/- 32 kb of these ERVs' integration sites and in control regions, and analyzed them using Functional Data Analysis (FDA) methodology. In one of the first applications of FDA in genomics, we identified genomic scales and locations at which these features display their influence, and how they work in concert, to provide signals essential for integration and fixation of ERVs. The investigation of ERVs of different evolutionary ages (young in vitro and polymorphic ERVs, older fixed ERVs) allowed us to disentangle integration vs. fixation preferences. As a result of these analyses, we built a comprehensive model explaining the uneven distribution of ERVs along the genome. We found that ERVs integrate in late-replicating AT-rich regions with abundant microsatellites, mirror repeats, and repressive histone marks. Regions favoring fixation are depleted of genes and evolutionarily conserved elements, and have low recombination rates, reflecting the effects of purifying selection and ectopic recombination removing ERVs from the genome. In addition to providing these biological insights, our study demonstrates the power of exploiting multiple scales and localization with FDA. These powerful techniques are expected to be applicable to many other genomic investigations.
Accession Number: WOS:000379349700033 PubMed ID: 27309962
Language: English Document Type: Article
KeyWords Plus: TARGET SITE SELECTION; HUMAN GENOME; TRANSPOSABLE ELEMENTS; RECOMBINATION RATES; IN-VITRO; PREIMPLANTATION EMBRYOS; EVOLUTIONARY DYNAMICS; REGULATORY SEQUENCES; DNA-STRUCTURE; HOST GENES
Addresses: [Campos-Sanchez, Rebeca] Penn State Univ, Grad Program Genet, Huck Inst Life Sci, University Pk, PA 16802 USA. [Cremona, Marzia A.; Pini, Alessia] Politecn Milan, Dept Math, MOX Modeling & Sci Comp, Milan, Italy.
[Cremona, Marzia A.; Chiaromonte, Francesca] Penn State Univ, Dept Stat, University Pk, PA 16802 USA.
[Chiaromonte, Francesca; Makova, Kateryna D.] Penn State Univ, Ctr Med Genom, Huck Inst Life Sci, University Pk, PA 16802 USA. [Makova, Kateryna D.] Penn State Univ, Dept Biol, University Pk, PA 16802 USA.
[Campos-Sanchez, Rebeca] Univ Costa Rica, Ctr Invest Biol Celular & Mol, San Jose, Costa Rica.
Reprint Address: Chiaromonte, F (reprint author), Penn State Univ, Dept Stat, University Pk, PA 16802 USA.
Chiaromonte, F; Makova, KD (reprint author), Penn State Univ, Ctr Med Genom, Huck Inst Life Sci, University Pk, PA 16802 USA. Makova, KD (reprint author), Penn State Univ, Dept Biol, University Pk, PA 16802 USA.
E-mail Addresses: [email protected]; [email protected] Author Identifiers:
Author ResearcherID Number ORCID Number
Pini, Alessia 0000-0001-9235-3062
Publisher: PUBLIC LIBRARY SCIENCE
Publisher Address: 1160 BATTERY STREET, STE 100, SAN FRANCISCO, CA 94111 USA Web of Science Categories: Biochemical Research Methods; Mathematical & Computational Biology Research Areas: Biochemistry & Molecular Biology; Mathematical & Computational Biology IDS Number: DQ6XN
ISSN: 1553-734X eISSN: 1553-7358
29-char Source Abbrev.: PLOS COMPUT BIOL ISO Source Abbrev.: PLoS Comput. Biol. Source Item Page Count: 41
Funding:
Funding Agency Grant Number
National Science Foundation DBI-0965596
National Institute of General Medical Sciences GM087472 Penn State Clinical and Translational Science Institute
Pennsylvania Department of Health
This work was supported by the National Science Foundation (grant number DBI-0965596 to KDM); the National Institute of General Medical Sciences (grant number GM087472 to KDM and Kristin Eckert); the Penn State Clinical and Translational Science Institute and the Pennsylvania Department of Health using Tobacco Settlement Funds (the Department specifically disclaims responsibility for any analyses, interpretations or conclusions). The funders had no role in study design, data collection and analysis, decision to publish, or preparation of the manuscript.
Open Access: gold Output Date: 2018-03-13
Close Web of Science
Page 1 (Records 1 -- 1) [ 1 ]
Integration and Fixation Preferences of
Human and Mouse Endogenous Retroviruses
Uncovered with Functional Data Analysis
Rebeca Campos-Sánchez1☯¤, Marzia A. Cremona2,3☯, Alessia Pini2, Francesca Chiaromonte3,4*, Kateryna D. Makova4,5*
1 Genetics Graduate Program, The Huck Institutes of the Life Sciences, Penn State University, University Park, Pennsylvania, United States of America, 2 MOX—Modeling and Scientific Computing, Department of Mathematics, Politecnico di Milano, Milano, Italy, 3 Department of Statistics, Penn State University, University Park, Pennsylvania, United States of America, 4 Center for Medical Genomics, The Huck Institutes of the Life Sciences, Penn State University, University Park, Pennsylvania, United States of America, 5 Department of Biology, Penn State University, University Park, Pennsylvania, United States of America
☯These authors contributed equally to this work.
¤ Current address: Centro de Investigación en Biología Celular y Molecular, Universidad de Costa Rica, San José, Costa Rica
*[email protected](FC);[email protected](KDM)
Abstract
Endogenous retroviruses (ERVs), the remnants of retroviral infections in the germ line, occupy ~8% and ~10% of the human and mouse genomes, respectively, and affect their structure, evolution, and function. Yet we still have a limited understanding of how the geno-mic landscape influences integration and fixation of ERVs. Here we conducted a genome-wide study of the most recently active ERVs in the human and mouse genome. We investi-gated 826 fixed and 1,065in vitro HERV-Ks in human, and 1,624 fixed and 242 polymorphic ETns, as well as 3,964 fixed and 1,986 polymorphic IAPs, in mouse. We quantitated >40 human and mouse genomic features (e.g., non-B DNA structure, recombination rates, and histone modifications) in ±32 kb of these ERVs’ integration sites and in control regions, and analyzed them using Functional Data Analysis (FDA) methodology. In one of the first appli-cations of FDA in genomics, we identified genomic scales and loappli-cations at which these fea-tures display their influence, and how they work in concert, to provide signals essential for integration and fixation of ERVs. The investigation of ERVs of different evolutionary ages (youngin vitro and polymorphic ERVs, older fixed ERVs) allowed us to disentangle integra-tion vs. fixaintegra-tion preferences. As a result of these analyses, we built a comprehensive model explaining the uneven distribution of ERVs along the genome. We found that ERVs inte-grate in late-replicating AT-rich regions with abundant microsatellites, mirror repeats, and repressive histone marks. Regions favoring fixation are depleted of genes and evolution-arily conserved elements, and have low recombination rates, reflecting the effects of purify-ing selection and ectopic recombination removpurify-ing ERVs from the genome. In addition to providing these biological insights, our study demonstrates the power of exploiting multiple
a11111
OPEN ACCESS
Citation: Campos-Sánchez R, Cremona MA, Pini A, Chiaromonte F, Makova KD (2016) Integration and Fixation Preferences of Human and Mouse Endogenous Retroviruses Uncovered with Functional Data Analysis. PLoS Comput Biol 12(6): e1004956. doi:10.1371/journal.pcbi.1004956
Editor: Sergei L. Kosakovsky Pond, Temple University, UNITED STATES
Received: January 15, 2016 Accepted: April 29, 2016 Published: June 16, 2016
Copyright: © 2016 Campos-Sánchez et al. This is an open access article distributed under the terms of theCreative Commons Attribution License, which permits unrestricted use, distribution, and reproduction in any medium, provided the original author and source are credited.
Data Availability Statement: All relevant data are within the paper and its Supporting Information files. Funding: This work was supported by the National Science Foundation (grant number DBI-0965596 to KDM); the National Institute of General Medical Sciences (grant number GM087472 to KDM and Kristin Eckert); the Penn State Clinical and Translational Science Institute and the Pennsylvania Department of Health using Tobacco Settlement Funds (the Department specifically disclaims responsibility for any analyses, interpretations or conclusions). The funders had no role in study
scales and localization with FDA. These powerful techniques are expected to be applicable to many other genomic investigations.
Author Summary
Approximately half of the human genome is composed of repetitive elements. Yet we do not completely understand why certain elements insert in particular genomic locations, and what determines which elements are retained and which are eliminated from the genome. To address these questions we studied endogenous retroviruses, one type of repetitive elements which occupy ~10% of the human and mouse genomes, together with genomic features characterizing various biological processes (e.g., recombination and tran-scription) in the neighborhoods of these elements. Using statistical techniques, we identi-fied enrichment of genomic features in the vicinity of endogenous retroviruses of different evolutionary ages. Features overrepresented adjacent to young endogenous retroviruses are expected to have facilitated their insertion in the genome. Features overrepresented adjacent to older endogenous retroviruses are expected to have facilitated both their inser-tion and their chances of being sustained in the genome. Our analyses allowed us to explain the uneven distribution of endogenous retroviruses along the genome, and thus to better understand the interaction of different biological processes in shaping the evolution of genome architecture.
Introduction
Endogenous Retroviruses (ERVs) are Class I Transposable Elements (TEs) considered to be
remnants of germ-line retrovirus infections inherited by the next generations [1]. As all Class I
TEs, ERVs transpose via an RNA intermediate, i.e. they “retrotranspose”. Because they possess Long Terminal Repeats (LTRs), they are also known as LTR-retrotransposons. Depending on the similarity of their gene content to that of certain retroviruses, ERVs are classified as
Gam-maretrovirus-, Betaretrovirus-, and Spumaretrovirus-like [1–3]. Full-length ERVs possess
three retroviral coding genes (i.e. gag, pol, and env) and LTR flanking sequences [4]]. In most
cases, the internal genes are deleted by recombination of LTRs, converting ERVs into solo-LTRs [5,6].
Most ERVs have accumulated numerous mutations that render them inactive [7]. However,
some rare examples of young ERVs that have coding capacity, are expressed and are
transposi-tionally active, have been described in mammals, e.g. in koala [8], mouse [3], cat [9], sheep
[10], and mule deer [7]. Active ERVs are transposition-competent and have integrated
recently; hence for them, polymorphic events–in terms of presence/absence–are observed at the population level but the allele frequencies of integrations are low. For instance, CrERVγ is
an endogenous gammaretrovirus that was recently detected in mule deer [7]. This ERV has
been invading the germ line of mule deer since its speciation from white-tailed deer approxi-mately 1.1 million years ago (MYA), and the copies found display polymorphisms in the wild mule deer population. In total, in this species, there are on average 100 full-length copies of the
CrERVγ per haploid genome [7]. However, if solo-LTR elements are included, this estimate
increases two-to-three-fold [7].
ERVs occupy ~8% of the reference human genome (they are called HERVs for Human
ERVs), and have been integrating in it starting more than 35 MYA [6,7,11,12]. However, only
Functional Data Analysis to Uncover Endogenous Retroviral Distributions
design, data collection and analysis, decision to publish, or preparation of the manuscript. Competing Interests: The authors have declared that no competing interests exist.
the HERV-K family has been active during the past 6 MY–since the divergence of human and
chimpanzee [13]. Moreover, among 113 human-specific HERV-K elements only 15 are
full-length and none is infectious [13], though about a dozen were found to be polymorphic in 100
individuals from diverse populations indicating retrotransposition activity in the recent past
[13,14]. In cell lines, however, two HERV-K named Phoenix [15] and HERV-KCON[16] were
reconstructed to be infectious, producing retroviral particles and causing in vitro integrations. Expression of HERV mRNA varies among tissues. Importantly, significant expression levels
were detected in testis as well as placenta [17,18]. Some analyses are available for HERV-Ks
embryonic expression [19,20].
Approximately 10% of the reference mouse genome is derived from LTR elements,
includ-ing ERVs [21]. In mouse oocytes, approximately 13% of transcripts were reported to be derived
from MaLRs (a type of LTR elements) as detected from ESTs [22]. Also, mice have highly
active ERVs causing up to 10–12% of spontaneous germ-line insertional mutations–most of which are due to activity of IAP (Intracisternal A Particle) and MusD/ETn (or ETns in short;
Early Transposon family) elements [23]. IAPs and ETns are both non-infectious
betaretro-viruses. In the mouse genome, full-length IAPs contain retroviral genes needed for retrotran-sposition; however there are also partially deleted copies (ERVs missing genes or other sequences). ETns consist of non-coding sequences and are aided by MusD proteins to
retro-transpose [3]. Insertional polymorphisms have been detected for both IAPs and ETns in
multi-ple mouse strains; additionally, some insertions arose prior to the divergence of these strains
[24,25]. In the rodent lineage, out of seventeen species studied, three (Mus, Spermophilus, and
Cavia) possess 80% of all IAP loci found in these species [26]. These elements are absent from
monkeys and apes [26]. Mouse IAPs and ETns are known to transpose in different mouse
strains causing mutations in the germ line; both polymorphic (in terms of presence/absence)
and fixed elements are known for each mouse strain [25].
The exaptation of ERVs–i.e. the recruitment of their sequences to perform a new function as regulatory or coding sequences–has influenced the evolution of genomes in multiple ways. Some enhancers and promoters derived from ERVs assume new roles in gene regulation; e.g., the alternative promoter of the CYP19 gene–an enzyme important for estrogen biosynthesis–
leads to its high expression levels in the primate placenta [3,27]. Another interesting example
of ERV exaptation associated with the evolution of placenta is syncytin, a gene derived from
the env gene of HERV-W [28]. Other ERV genes were exapted to function as proteases,
RNA-dependent DNA polymerase with RNAse H, and integrases, as well as structural proteins, in
diverse organisms [29]. Importantly, while ERVs have been relevant to genome evolution, they
have also been implicated in the development of multiple diseases by disrupting genes, modify-ing regulatory sequences or altermodify-ing gene expression. Though causal links have not been defi-nitely established, the diseases that have been associated with ERV retrotransposition or
expression include multiple sclerosis, cancer and psoriasis in human [3,11,29,30]; and obesity,
diabetes, and cancer in mouse [24].
Notwithstanding the role ERVs play in the architecture, evolution, and function of genomes, our knowledge of how the genomic landscape influences their integration and fixation is still limited. Gene density and GC content have been shown to be negative predictors of ERV
den-sity–for not only full-length elements but also solo-LTRs [31–33]. In contrast, reconstructed
HERV-Ks integrate in regions with high numbers of gene transcription units [34]. Similarly, in
vitro IAP integrations occurred preferentially in actively transcribed domains of HeLa cells
[35]. Interestingly, human and mouse ERVs that are located in introns are mostly present in
antisense orientation avoiding gene expression disruption [32,36,37]. Other important
geno-mic characteristics of ERVs and their genogeno-mic neighborhoods are high levels of methylation
show decreased methylation when located in the vicinity of transcription start sites and
expressed genes [39]. Chromosome location is another relevant feature of ERV distribution, as
illustrated by the description of 100 previously unknown HERV-Ks in the centromeres of 15
chromosomes [40]. It has been suggested [34] that the accumulation of ERVs is the net result
of two processes–integration, which can be biased towards certain genomic landscapes, and purifying selection, which removes ERVs disrupting the function of important elements, e.g. of genes. Disentangling these two processes can be challenging and requires the investigation of ERVs that integrated in the genome at different times.
Several approaches have been used to elucidate the relationships between genomic features and distribution of TEs. Most studies of the associations between genomic features and TE density, Integration Site (IntS) preferences, or neighboring sequences characteristics were
per-formed employing statistical methods such as ROC curves [41], non-parametric tests [42],
Fisher exact tests [43], maximum likelihood techniques [33], MANOVA [44], and multiple
regressions [45,46]. The main limitation of many past studies was the low data resolution
determined by available technologies. However, resolution has recently improved, e.g., with the
release of ENCODE and ModENCODE consortia data [47]. The application of innovative
sta-tistical approaches though has not kept pace with the improvement in data. Stasta-tistical method-ology should address the fact that many features of the genome act jointly in defining its biological functionality. Being able to consider multiple genomic features simultaneously, e.g.,
with multiple regression analyses [45,46], is essential to obtain meaningful biological
conclu-sions. Moreover, with the availability of higher resolution data, it becomes paramount to use statistical techniques capable of detecting and differentiating effects at different scales and loca-tions, e.g., one genomic feature may be generally enriched or depleted in the broad flanks of a TE, while another may show enrichment or depletion at a specific location in close proximity of the element’s IntS.
To perform more powerful and effective analyses, one can view genomic features as “curves” composed of measurements in consecutive genomic intervals. In this framework, Functional Data Analysis (FDA) techniques can be exploited to extract signals from these curves, taking advantage of the ordered nature of the measurements and considering different scales and
loca-tions, i.e. sizes and positions of genomic intervals (see [48] and [49] for a comprehensive
intro-duction to FDA). This class of techniques includes curve smoothing and registration methods, functional principal component analysis, functional hypothesis testing, functional regression,
and functional clustering [50]. In the last decade FDA has been utilized in an increasing
num-ber of biomedical applications [51,52], particularly in cardiovascular research [53–55] and
kinesiology [56]. Although still limited in number, some applications of FDA also exist in the
context of genetics and genomics, e.g., in genetic association studies [57–59], epistasis analysis
[60], and ChIP-seq peak shape clustering [61].
Here, applying FDA methodology, we address three questions about the biology of ERVs. First, what genomic features are significant for ERV integration and fixation? Second, at what genomic scales and locations are these features influential? Third, and finally, how do genomic features work in concert to provide signals essential for integration and fixation of ERVs? Using genome-wide data, we applied the recently developed Interval Testing Procedure (ITP)
[62] to determine the influence of flanking sequence features on integration and fixation of
mouse (polymorphic and fixed ETns and IAPs) and human (fixed and in vitro HERV-Ks) ERVs. As a result, we detected diverse genomic features that affect integration and fixation of these elements (e.g. gene content, replication timing, AT count, and LINE content), and did so differentiating effects at various scales and locations in the flanking regions. Finally, we employed multiple Functional Logistic Regression (FLR) models to capture the combined effects of a restricted set of features resulting in a compact group of genome features that define
the genomic landscape of integration and/or fixation preferences for ERVs. Importantly, the functional testing procedures and regression techniques we extended, employed and demon-strated in this study can be broadly applied in genomics.
Results
Elements and controls
In this study we analyzed in vitro, polymorphic, and fixed ERVs. The distributions of in vitro and polymorphic ERVs are only marginally influenced by selection and thus provide a more accurate view of integration preferences. Fixed ERVs, in contrast, carry information about both integration and fixation. We interrogated the genomic neighborhoods (32-kb flanking
sequences upstream and 32-kb flanking sequences downstream of each element, so there is no overlap among flanking regions to maximize the number of ERVs in the study) of one human and two mouse ERV families. In mouse, we considered 1,866 ETns (242 polymorphic and 1,624 fixed) and 5,950 IAPs (1,986 polymorphic and 3,964 fixed) detected genome-wide by
Zhang and colleagues [25]; elements were considered to be fixed if they were shared among
four mice strains, and polymorphic if they were present in the C57BL/6J strain but not in the
other three strains (seeMethods). As control regions, we considered 1,379 continuous 64-kb
regions of the mouse genome that did not overlap with the flanking sequences of ERVs (see
Methods,Table 1). In human, we considered 826 fixed HERV-Ks (Table 1) annotated by
Sub-ramanian and colleagues [63]. We also extracted the genomic locations of 1,065 in vitro
HERV-K integrations in human embryonic kidney and fibrosarcoma cell lines [34] (Table 1).
A total of 1,690 control regions were generated similarly to those in mouse (seeMethods).
Human and mouse ERVs in our analyses ranged from solo-LTRs (~60 bp) to full-length
ele-ments (~9 kb) (Table A inS1 Text). The number of ERVs present on each chromosome
corre-lated with chromosome size (Fig A inS1 Text). Human chromosome 19 was an outlier with an
overrepresentation of fixed HERV-Ks (Fig A inS1 Text).
Genomic features
We selected a diverse set of genomic features (Table 2) that could be implicated in ERV
inte-gration or fixation as reported by previous ERV [31–33] and non-ERV TE studies [45,46]. In
total, we considered 41 and 43 genomic features in mouse and human ERV flanking regions, respectively (derived from 43 datasets in mouse and 44 datasets in human). These features reflected DNA conformation (e.g., G-quadruplex), DNA sequence (e.g., A/T content), position on the chromosome (e.g., distance to the closest centromere and telomere), recombination (e.g., local recombination rates), replication (e.g., replication timing), gene regulation and expression (e.g., histone marks and DNase I hypersensitive sites), as well as selection (e.g., exons and most conserved elements). Where possible, we specifically utilized features studied in embryonic stem cells (ESCs) or in sperm cells as they most closely proxy characteristics of
germ-line and embryonic cells [64]. Four low-resolution features (replication timing,
recombi-nation rates, distance to telomere, and distance to centromere) were represented by a single value for each 64-kb region. For each high-resolution feature, we measured either its content (fraction of the genomic window covered by the feature), its count or its weighted average (WA, only for methylation and expression features) in each of the 64 1-kb windows
constitut-ing the flanks of each ERV and each control region (Fig 1A, seeMethods). We applied
hierar-chical clustering to screen out high-resolution genomic features that present strong
correlations with each other (Figs B and C inS1 Text). For example, for human, exon content
was highly correlated with gene expression in ESCs and thus we removed the latter from the analysis. As a result, a total of 35 mouse and 36 human high-resolution genomic features
(derived from 35 datasets in mouse and 37 datasets in human) were retained for further
analy-sis (Figs D and E inS1 Text).
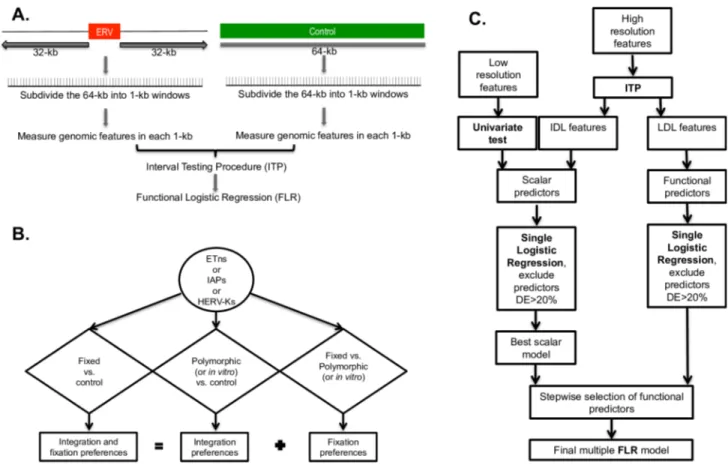
Analysis overview
To identify genomic features significantly affecting the ERV distributions in the human and mouse genomes, we contrasted flanking regions of fixed ERVs (either mouse ETn and IAP, or human HERV-K) vs. control regions; such a comparison is expected to reflect both integration
and fixation preferences (Fig 1B). In an attempt to disentangle genomic features affecting ERV
integration from those affecting their fixation, we conducted additional comparisons; namely, we contrasted flanking regions of polymorphic mouse ERVs (ETn and IAP) vs. mouse control regions, and flanking regions of in vitro HERV-K vs. human control regions. In these compari-sons integration preferences are expected to be substantially more prominent than fixation preferences because selection had substantially less time to act on polymorphic or in vitro ERVs than on fixed ERVs. Finally, to pinpoint genomic features significant for ERV fixation, we contrasted flanking regions of fixed vs. polymorphic mouse elements (ETns and IAPs), and of fixed vs. in vitro HERV-Ks. In a way, the analysis of fixed ERVs vs. controls can be viewed as
“cumulating” that of polymorphic or in vitro ERVs vs. controls, and that of fixed vs.
polymor-phic or in vitro ERVs. In total, we conducted nine comparisons (Fig 1B), each using four
differ-ent statistical techniques as described below (Fig 1C). Admittedly, polymorphic integrations
are affected by selection to a greater degree than in vitro ones, however we are not in possession of both of these data types for the species in our study; only polymorphic data are available for mouse ERVs and only in vitro data are available for human ERVs.
First, we tested whether ERV presence was significantly affected by low-resolution features
using a univariate permutation test (seeMethods, Table B inS1 Text;Fig 2); this is appropriate
because these features are represented by a single value for each 64-kb region. Second, for the high-resolution genomic features, we employed the two-population Interval Testing Procedure
(ITP) for functional data [62] to assess whether each feature, when considered alone, had
sig-nificantly different content (or count, or WA) in a comparison, e.g. in ERV flanking regions vs.
controls (seeMethodsfor details). This technique is particularly suitable for our analysis
because it considers the data as a curve over the 64 1-kb windows comprising each region, instead of taking one value for the region (e.g., an average over the 64 windows). ITP combines inference on the whole curve with component-wise inference (i.e. inference on measurements comprising the curve). Thus, it allows us to select relevant genomic features detecting both the
scale and the location at which each feature acts (seeMethodsfor more details). From this
anal-ysis we expect to detect genomic features that: (1) show significant enrichment/depletion locally, especially in windows close to the IntS of ERVs or further away from it–we call these
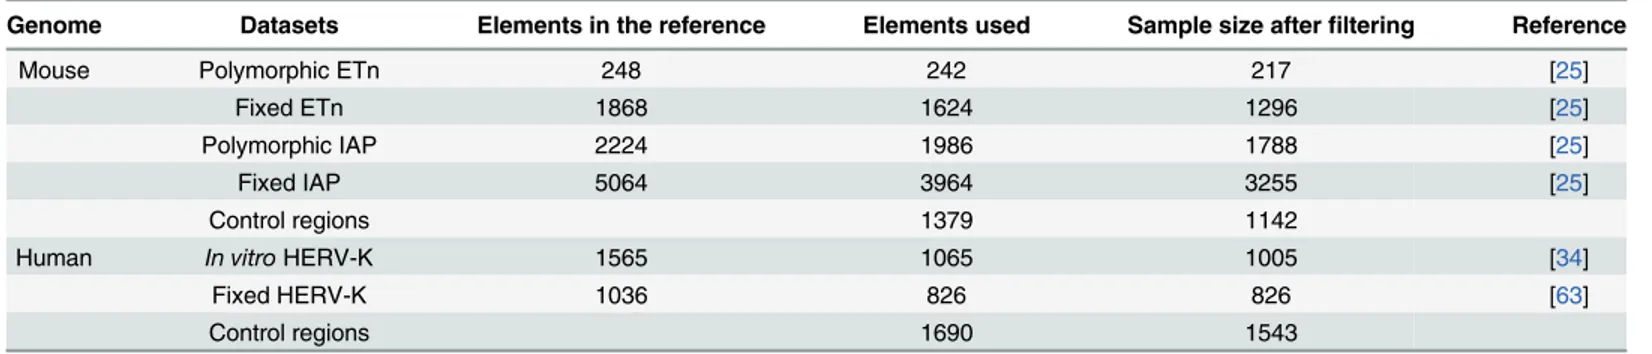
Table 1. Number of ERV elements and control regions used in this study.
Genome Datasets Elements in the reference Elements used Sample size after filtering Reference
Mouse Polymorphic ETn 248 242 217 [25]
Fixed ETn 1868 1624 1296 [25]
Polymorphic IAP 2224 1986 1788 [25]
Fixed IAP 5064 3964 3255 [25]
Control regions 1379 1142
Human In vitro HERV-K 1565 1065 1005 [34]
Fixed HERV-K 1036 826 826 [63]
Control regions 1690 1543
doi:10.1371/journal.pcbi.1004956.t001
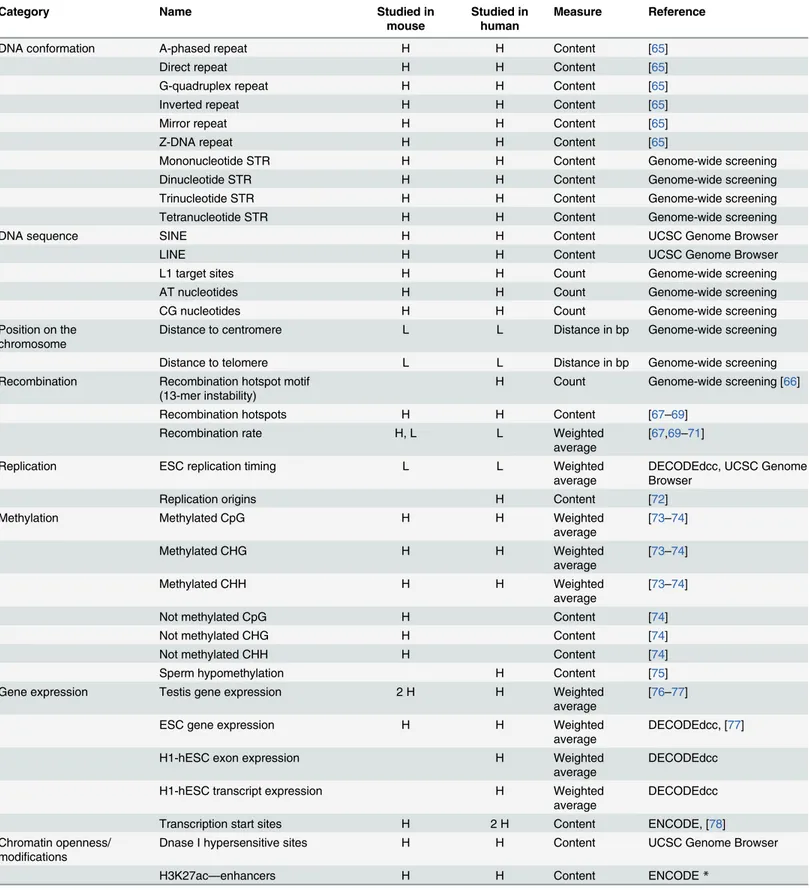
Table 2. Complete list of genomic features analyzed in this study. H and L marks indicate features analyzed in mouse, human or both using high- and low-resolution datasets, respectively. The nature of the measures used is explained in more detail in the Methods.
Category Name Studied in
mouse Studied inhuman Measure Reference
DNA conformation A-phased repeat H H Content [65]
Direct repeat H H Content [65]
G-quadruplex repeat H H Content [65]
Inverted repeat H H Content [65]
Mirror repeat H H Content [65]
Z-DNA repeat H H Content [65]
Mononucleotide STR H H Content Genome-wide screening
Dinucleotide STR H H Content Genome-wide screening
Trinucleotide STR H H Content Genome-wide screening
Tetranucleotide STR H H Content Genome-wide screening
DNA sequence SINE H H Content UCSC Genome Browser
LINE H H Content UCSC Genome Browser
L1 target sites H H Count Genome-wide screening
AT nucleotides H H Count Genome-wide screening
CG nucleotides H H Count Genome-wide screening
Position on the
chromosome Distance to centromere L L Distance in bp Genome-wide screening
Distance to telomere L L Distance in bp Genome-wide screening
Recombination Recombination hotspot motif (13-mer instability)
H Count Genome-wide screening [66]
Recombination hotspots H H Content [67–69]
Recombination rate H, L L Weighted
average [67,69 –71]
Replication ESC replication timing L L Weighted
average DECODEdcc, UCSC GenomeBrowser
Replication origins H Content [72]
Methylation Methylated CpG H H Weighted
average [73 –74] Methylated CHG H H Weighted average [73 –74] Methylated CHH H H Weighted average [73 –74]
Not methylated CpG H Content [74]
Not methylated CHG H Content [74]
Not methylated CHH H Content [74]
Sperm hypomethylation H Content [75]
Gene expression Testis gene expression 2 H H Weighted
average [76 –77]
ESC gene expression H H Weighted
average DECODEdcc, [77]
H1-hESC exon expression H Weighted
average DECODEdcc
H1-hESC transcript expression H Weighted
average DECODEdcc
Transcription start sites H 2 H Content ENCODE, [78]
Chromatin openness/
modifications Dnase I hypersensitive sites H H Content UCSC Genome Browser
H3K27ac—enhancers H H Content ENCODE*
localized differential landscape (LDL) features (e.g.Fig 3A); (2) show a uniform level of signifi-cant enrichment/depletion throughout all 64 1-kb windows–we call these invariant differential
landscape (IDL) features (e.g.Fig 3B); or (3) are not significant over the whole 64-kb region
Table 2. (Continued)
Category Name Studied in
mouse
Studied in human
Measure Reference
H3K27me3—repressed chromatin H H Content ENCODE*
H3K36me3—transcribed chromatin H H Content ENCODE*
H3K4me1—enhancers H H Content ENCODE*
H3K4me3—promoters H H Content ENCODE*
H3K9ac—transcription activation H H Content ENCODE*
H3K9me3—repressed chromatin H H Content ENCODE*
Selection CpG islands H H Content UCSC Genome Browser
Exon H H Content UCSC Genome Browser
Intron H H Content UCSC Genome Browser
Most conserved elements H H Content UCSC Genome Browser
Total number features 41 43
* Mouse ES Bruce4 C57BL6, human H1-ESC. doi:10.1371/journal.pcbi.1004956.t002
Fig 1. Workflow of the methodology employed to compare the flanking regions of ERVs versus control regions. The comparison between the flanking regions of two different ERV types utilizes an analogous pipeline. (A) Generation of windows and data. (B) Schematic of the nine comparisons implemented in our study. (C) Schematic of the statistical analysis, including Functional Data Analysis techniques. FLR: Functional Logistic Regression, ITP: interval testing procedure, IDL: invariant differential landscape, LDL: localized differential landscape.
examined. In order to capture different nuances of the data, we performed ITP using three test
statistics (mean difference, median difference, and variance ratio; Figs4–6and F-T inS1 Text),
however, below we focus on results concerning mean differences.
Third, to determine the individual explanatory power of major predictors, we fitted single
Functional Logistic Regressions (FLRs; Figs1Cand7, Table C inS1 Text) for each feature
found to be significant in ITP. This analysis allowed us to summarize and better quantify the
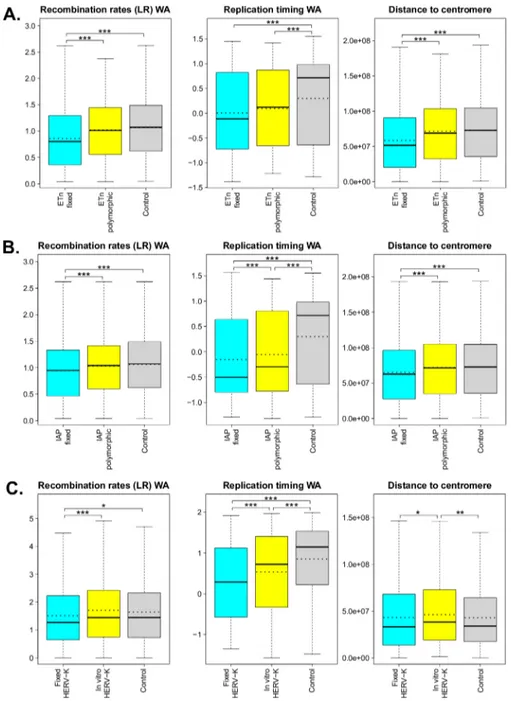
Fig 2. Boxplots of significant low-resolution features (i.e. recombination rates, replication timing, and distance to centromere) measured for the flanking regions of fixed and polymorphic (orin vitro) ERVs, and for control regions. The ERVs considered are: (A) ETns, (B) IAPs, and (C) HERV-Ks. Dotted lines represent means (solid lines in the boxplots are medians). Univariate permutation tests for the mean differences are summarized with asterisks above the corresponding comparisons (value <0.001 ‘***’, p-value <0.01 ‘**’, and p-p-value <0.05 ‘*’). Distance to telomere was also tested but was not found to have significant mean differences. WA—weighted average. More details can be found in Table C inS1 Text. doi:10.1371/journal.pcbi.1004956.g002
results obtained by univariate permutation test and ITP (Fig 7). Moreover, it allowed us to identify features that, by themselves, explained a percent of deviance in excess of 20%. These are clearly very
relevant predictors (Table C inS1 Text) but we did not include them in our final multiple FLR
mod-els (see below) as they would hide the concurrent effects of other potentially relevant predictors. Fourth, we examined the joint effects of the remaining significant predictors (as determined
by ITP and univariate permutation test) via multiple Functional Logistic Regression (Fig 1C
and Tables3–11). The multiple FLR models expressed the likelihood of being in the
neighbor-hood of an ERV vs. control (or of a fixed vs. a polymorphic mouse ERV, or of a fixed vs. in vitro HERV-K) as a joint function of several predictors. In particular, IDL features and low-res-olution features that proved significant in univariate permutation tests were treated as scalar predictors represented by their averages across the 64 windows constituting each region. In contrast, LDL features were treated as functional predictors with curves evaluated at customized scales and intervals to capture the specific behavior of each LDL feature, e.g. around the IntS,
as suggested by the ITP. Importantly, the modified ITP we employed (seeMethods) gave us
detailed information on the best scale and location, i.e. on the subregions on which to study the curve, for each of these functional predictors.
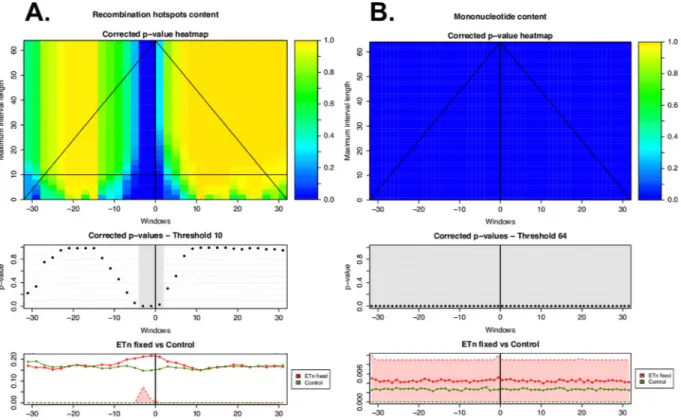
Fig 3. ITP results using the mean difference as test statistics for (A) recombination hotspots (localized differential landscape–LDL) and (B) mononucleotide microsatellites (invariant differential landscape–IDL) in the flanking regions of fixed ETn vs. controls. The heatmap in the top panel shows the p-values for each component (i.e. window; horizontal axis) corrected controlling the family-wise error rate on all possible maximum interval lengths (vertical axis). Blue corresponds to low p-values, hence significant differences between the distributions underlying the flanking regions of ERVs and the controls. The middle panel shows corrected p-values at the chosen maximum interval length threshold, with gray highlighting significant components (corrected p-values<0.05). The lower panels show the average of the genome feature under consideration over the flanking regions of all fixed ETns (red line) and controls (green line). First and third quartiles (25% and 75% quantiles) are shaded in the respective colors–red for ETns and green for controls. The shades for control are invisible because they are zeros for control. The heatmap suggests the scales (vertical axis) and the locations (horizontal axis) at which the feature is significant to characterize ERVs genomic landscape.
doi:10.1371/journal.pcbi.1004956.g003
ETns
To identify genomic features affecting the distribution of ETns in the mouse genome–as a result of both integration and fixation preferences of these elements–we contrasted flanking sequences of fixed ETns vs. control regions. Univariate permutation tests applied to the
low-resolution features (Fig 2Aand Table B inS1 Text) indicated that the flanking regions of fixed
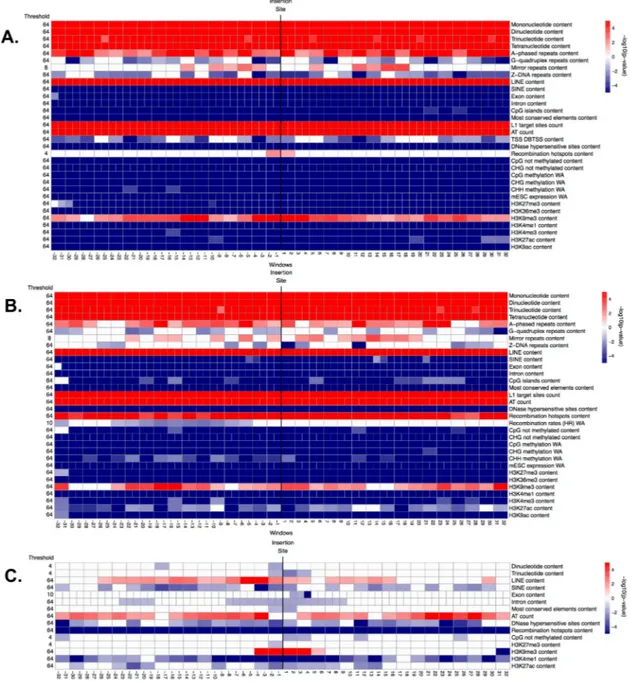
Fig 4. Significance (i.e. -log10(corrected p-value)) of genomic features in windows along the flanking regions, obtained from the ITP using the mean difference as test statistics: (A) fixed ETns vs. controls, (B) polymorphic ETns vs. controls, and (C) fixed vs. polymorphic ETns. In each panel, the horizontal axis represents the 64 1-kb windows. The vertical black line between window -1 kb and 1 kb marks the integration site. The thresholds reported on the left represent the maximum scale at which each feature is significant, ranging from 64 kb (coarsest) to 1 kb (finest). Each row corresponds to one feature and each cell represents one or two contiguous windows, depending on the number of nodes employed in the B-splines (we consider one value for every 1-kb window when using the raw data, and one value every two 1-kb windows when using the piecewise constant smoothed version of the data). White cells: not significant (p-value >0.05), red cells: significant with higher mean in the flanking regions of ETns vs. controls (or in the flanking regions of fixed vs. polymorphic ETns), blue cells: significant with lower mean in the flanking regions of ETns vs. controls (or in the flanking regions of fixed vs. polymorphic ETns). Color intensity is proportional to significance (more intense colors correspond to lower corrected p-values).
ETns have lower recombination rates and later replication timing, and are closer to
centro-meres. ITP indicated (Fig 4Aand Fig F inS1 Text) that all four microsatellites types, LINEs, L1
target sites, AT count, and the H3K9me3 histone mark are overrepresented, while SINEs, exons, introns, CpG islands, most conserved elements, all features associated with CpG methyl-ation, ESC expression, and two histone marks (H3K27me3 and H3K36me3) are underrepre-sented, throughout the whole fixed ETn flanking regions. ITP also identified features with interesting localized behaviors: recombination hotspot content and the H3K27ac histone mark are overrepresented immediately next to the IntS, while DNase I hypersensitive sites and three histone marks (H3K4me1, H3K4me3, and H3K9ac) are underrepresented everywhere except
Fig 5. Significance (i.e. -log10(corrected p-value)) of genomic features in windows along the flanking regions, obtained from the ITP using the mean difference as test statistics: (A) fixed IAPs vs. controls, (B) polymorphic IAPs vs. controls, and (C) fixed vs. polymorphic IAPs. See explanations forFig 4.
doi:10.1371/journal.pcbi.1004956.g005
for immediately next to the IntS. We found that also Z-DNA repeats and G-quadruplex repeats are underrepresented, with a yet more complex local behavior. Next, single FLRs revealed that all four microsatellites types, LINEs, introns, most conserved elements, and ESC expression
have very strong effects (relative contribution to the deviance explained, RCDE !26%;Fig 7A
and Table C inS1 Text). We therefore excluded these predictors from the final multiple FLR
model, which explained 51.1% of the deviance in discriminating fixed ETns from controls (Table 3). The two strongest scalar predictors in such a model (i.e. H3K9me3 and L1 target sites, RCDE 20.5% and 23.5%, respectively) had positive effects, while AT count and
H3K27me3 had negative effects (RCDE 17.8% and 4.7%, respectively; seeDiscussionfor the
Fig 6. Significance (i.e. -log10(corrected p-value)) of genomic features in windows along the flanking regions, obtained from the ITP using the mean difference as test statistics: (A) fixed HERV-Ks vs. controls, (B)in vitro HERV-Ks vs. controls, and (C) fixed vs.in vitro HERV-Ks. See explanations forFig 4.
explanation of the negative effect of AT count in multiple FLRs). The two strongest functional predictors–CpG methylation and exon content (RCDE of ~10%)–had negative effects. Interest-ingly, the H3K4me1 mark (RCDE 5.1%) had a strong positive effect strictly localized at the IntS (-4 to 4 kb) and a negative effect away from the IntS, while mirror repeats (RCDE 3.1%) had a positive effect on the whole region.
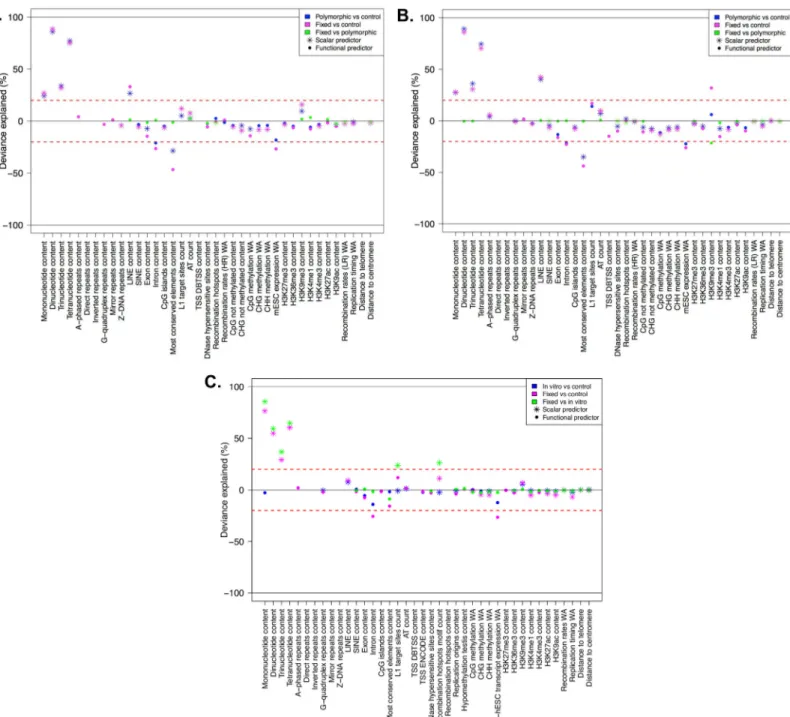
Fig 7. Deviance explained by individual predictors in single logistic regression fits, concerning (A) ETns, (B) IAPs, and (C) HERV-Ks. Each panel contains color-coded results from three comparisons–magenta: fixed vs. controls, blue: polymorphic (orin vitro) vs controls, green: fixed vs. polymorphic (or in vitro). Only features that resulted significant in the ITP are considered here as scalar or functional predictors (indicated with stars and points, respectively), depending on whether they were IDL or LDL features. The deviance explained (between 0 and 100%) is reported as positive or negative depending on the sign of the estimated predictor coefficient (the predominant sign in the case of functional predictors). The red lines at ±20% represent the threshold above (below) which “dominant” predictors were omitted from the subsequent multiple FLR modeling.
doi:10.1371/journal.pcbi.1004956.g007
To highlight integration preferences, we contrasted flanking sequences of polymorphic
ETns vs. control regions. In this analysis (Fig 4Band Fig G inS1 Text) we found many
similari-ties but also a number of noteworthy differences with respect to the analysis of fixed ETns vs.
controls (Fig 4Aand Fig F inS1 Text). For instance, similar to fixed ETns, the flanking
sequences of polymorphic ETns appeared to replicate later than controls (Table B inS1 Text
andFig 2A) suggesting that this feature might be important for ETn integration. The underrep-resentation of exons, CpG islands, and several histone marks was weaker for polymorphic ETns vs. controls than for fixed ETns vs. controls suggesting that ETns can integrate but tend
not to become fixed in such environments (Fig 4B and 4A). Moreover, the content of DNase I
hypersensitive sites did not differ significantly from controls in a relatively large region
sur-rounding the IntS for polymorphic ETns (-6 kb to +16 kb;Fig 4B) but only at 1 kb upstream
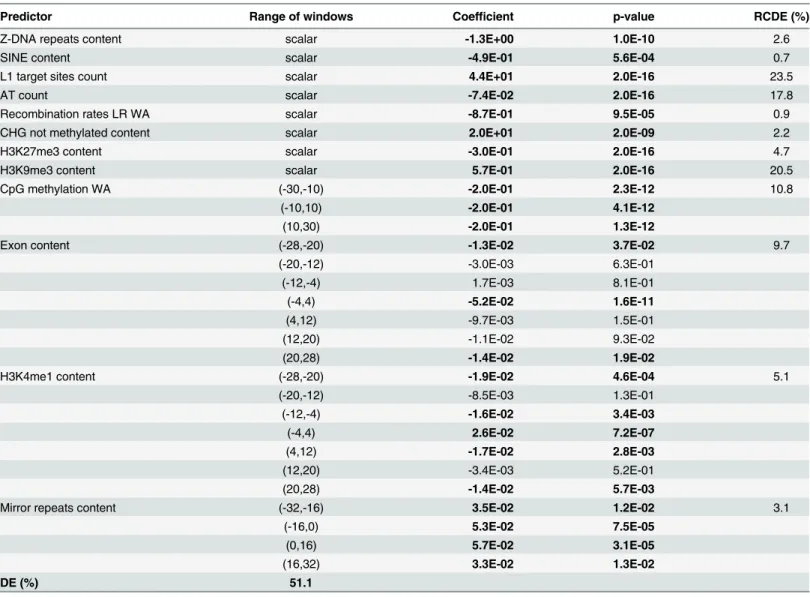
Table 3. Multiple FLR models for fixed ETn vs. control. The "Predictor" column reports predictors included in the logistic regression. The "Coefficient" col-umn reports coefficient estimates (a positive coefficient means that an increase in the feature increases the likelihood of, e.g., fixed vs. control; a negative coefficient means an increase in the feature decreases such likelihood). The "value" column reports values for the coefficients. They both are in bold if p-value<0.05. For functional predictors, several rows are listed corresponding to the intervals where the feature was considered—as indicated in the "Range of windows" column. The "RCDE" column reports the relative contribution to the deviance explained for each feature. "DE" at the bottom of each panel is the total deviance explained by the model.
Predictor Range of windows Coefficient p-value RCDE (%)
Z-DNA repeats content scalar -1.3E+00 1.0E-10 2.6
SINE content scalar -4.9E-01 5.6E-04 0.7
L1 target sites count scalar 4.4E+01 2.0E-16 23.5
AT count scalar -7.4E-02 2.0E-16 17.8
Recombination rates LR WA scalar -8.7E-01 9.5E-05 0.9
CHG not methylated content scalar 2.0E+01 2.0E-09 2.2
H3K27me3 content scalar -3.0E-01 2.0E-16 4.7
H3K9me3 content scalar 5.7E-01 2.0E-16 20.5
CpG methylation WA (-30,-10) -2.0E-01 2.3E-12 10.8
(-10,10) -2.0E-01 4.1E-12
(10,30) -2.0E-01 1.3E-12
Exon content (-28,-20) -1.3E-02 3.7E-02 9.7
(-20,-12) -3.0E-03 6.3E-01 (-12,-4) 1.7E-03 8.1E-01 (-4,4) -5.2E-02 1.6E-11 (4,12) -9.7E-03 1.5E-01 (12,20) -1.1E-02 9.3E-02 (20,28) -1.4E-02 1.9E-02
H3K4me1 content (-28,-20) -1.9E-02 4.6E-04 5.1
(-20,-12) -8.5E-03 1.3E-01 (-12,-4) -1.6E-02 3.4E-03 (-4,4) 2.6E-02 7.2E-07 (4,12) -1.7E-02 2.8E-03 (12,20) -3.4E-03 5.2E-01 (20,28) -1.4E-02 5.7E-03
Mirror repeats content (-32,-16) 3.5E-02 1.2E-02 3.1
(-16,0) 5.3E-02 7.5E-05
(0,16) 5.7E-02 3.1E-05
(16,32) 3.3E-02 1.3E-02
DE (%) 51.1
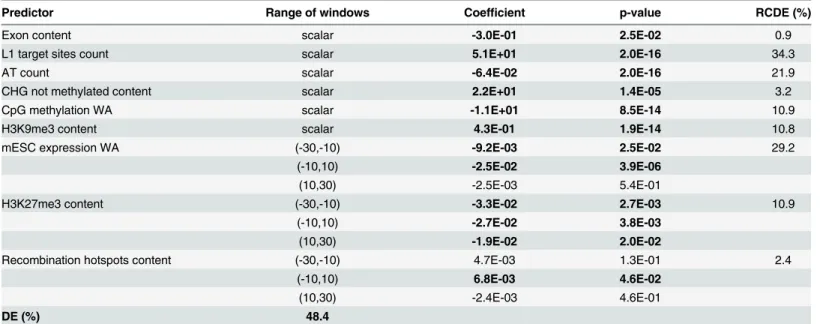
from the IntS for fixed ETns (Fig 4A). Single FLRs displayed very similar explained deviances for microsatellites and LINEs in the two comparisons, while the explained deviances for intron content and most conserved elements content were lower for polymorphic ETns vs. controls
than for fixed ETns vs. controls (Fig 7A, Tables4and3)–confirming that the former are subject
to weaker selection effects. The final multiple FLR model for polymorphic ETns vs. controls
explained 48.4% of the deviance (Table 4) and was similar to the model for fixed ETns vs.
con-trols (Table 3).
Next, to highlight fixation preferences, we contrasted flanking regions of fixed vs. polymor-phic ETns. This analysis, too, revealed some similarities and some important differences rela-tive to that of fixed ETn vs. controls. Fixed ETns were located in regions with lower
recombination rates and closer to centromeres compared to polymorphic ETns (Table B inS1
TextandFig 2A) suggesting that these features are important for fixation. The ITP tests
con-trasting fixed vs. polymorphic ETns (Fig 4Cand Fig H inS1 Text) did not identify
microsatel-lites as features differentiating fixation and integration propensities. However, they did reveal a more localized underrepresentation of exons and most conserved elements around the IntS (Fig 4C)–as compared to the ITP tests contrasting fixed ETns vs. controls (Fig 4A).
Recombi-nation hotspots, which were overrepresented in polymorphic ETns vs. controls (Fig 4B) and
strongly overrepresented near the IntS in fixed ETns vs. controls (Fig 4A), were
underrepre-sented in fixed vs. polymorphic ETns (Fig 4C). Also, several histone marks (H3K9me3,
H3k4me1, and H3K9ac) were overrepresented near the IntS in fixed vs. polymorphic ETns (Fig 4C), but did not show a significant difference near the IntS in fixed ETn vs. controls (Fig
4A). Interestingly, DNase I hypersensitive sites were overrepresented -1 kb upstream and
underrepresented up to 2 kb downstream from the IntS (Fig 4C). Single FLRs did not identify
features which, individually, had great strength in characterizing fixed vs. polymorphic ETns
(all explained deviances <3.5%) (Fig 7Aand Table C inS1 Text). However, taken together in
the context of multiple FLR, eight features explained 15% of the deviance in discriminating
fixed vs. polymorphic ETns (Table 5) and reiterated most of our observations from the ITP
tests (Fig 4C).
Table 4. Multiple FLR models for polymorphic ETn vs. control. See explanations forTable 3.
Predictor Range of windows Coefficient p-value RCDE (%)
Exon content scalar -3.0E-01 2.5E-02 0.9
L1 target sites count scalar 5.1E+01 2.0E-16 34.3
AT count scalar -6.4E-02 2.0E-16 21.9
CHG not methylated content scalar 2.2E+01 1.4E-05 3.2
CpG methylation WA scalar -1.1E+01 8.5E-14 10.9
H3K9me3 content scalar 4.3E-01 1.9E-14 10.8
mESC expression WA (-30,-10) -9.2E-03 2.5E-02 29.2
(-10,10) -2.5E-02 3.9E-06
(10,30) -2.5E-03 5.4E-01
H3K27me3 content (-30,-10) -3.3E-02 2.7E-03 10.9
(-10,10) -2.7E-02 3.8E-03
(10,30) -1.9E-02 2.0E-02
Recombination hotspots content (-30,-10) 4.7E-03 1.3E-01 2.4
(-10,10) 6.8E-03 4.6E-02
(10,30) -2.4E-03 4.6E-01
DE (%) 48.4
doi:10.1371/journal.pcbi.1004956.t004
Table 5. Multiple FLR models for fixed vs. polymorphic ETn. See explanations forTable 3.
Predictor Range of windows Coefficient p-value RCDE (%)
Recombination hotspots content scalar -4.2E-01 5.2E-05 8.7
Distance to centromere scalar -5.7E-09 2.3E-03 4.9
H3K4me1 content (-28,-20) 1.6E-02 8.9E-02 25.3
(-20,-12) -2.3E-02 2.6E-02 (-12,-4) -3.3E-02 7.8E-04 (-4,4) 4.9E-02 1.9E-06 (4,12) -2.3E-02 1.4E-02 (12,20) 1.3E-02 2.0E-01 (20,28) 1.3E-02 2.0E-01
H3K9ac content (-28,-20) -1.4E-02 3.7E-01 14.9
(-20,-12) 3.1E-02 9.7E-02 (-12,-4) 1.5E-02 4.2E-01 (-4,4) 5.7E-02 6.9E-03 (4,12) -4.3E-02 2.8E-03 (12,20) 4.5E-02 6.8E-03 (20,28) -1.5E-02 2.9E-01
H3K9me3 content (-28,-20) 1.3E-02 4.4E-01 16.4
(-20,-12) -3.6E-02 1.8E-02 (-12,-4) -7.2E-03 6.8E-01 (-4,4) 4.7E-02 9.1E-05 (4,12) -1.8E-02 2.6E-01 (12,20) 2.0E-02 2.5E-01 (20,28) 4.0E-02 6.7E-02
DNase hypersensitive sites content (-30,-26) -9.3E-02 2.0E-02 15.1
(-26,-22) -1.2E-02 7.8E-01 (-22,-18) 6.7E-03 8.8E-01 (-18,-14) -4.2E-02 3.7E-01 (-14,-10) 3.6E-02 4.1E-01 (-10,-6) 1.0E-03 9.8E-01 (-6,-2) -5.4E-02 1.9E-01 (-2,2) -2.2E-02 5.8E-01 (2,6) -7.1E-02 8.3E-02 (6,10) -1.2E-02 7.9E-01 (10,14) -9.5E-02 3.2E-02 (14,18) -1.1E-02 8.2E-01 (18,22) -2.3E-02 6.1E-01 (22,26) 8.7E-03 8.5E-01 (26,30) -3.4E-03 9.3E-01
H3K27ac content (-28,-20) 1.4E-02 4.2E-01 8.1
(-20,-12) 1.4E-02 4.0E-01 (-12,-4) 2.2E-02 1.6E-01 (-4,4) 2.0E-02 1.8E-01 (4,12) 3.0E-02 6.2E-02 (12,20) -3.1E-02 3.3E-02 (20,28) 1.9E-03 9.0E-01 DE (%) 15.0 doi:10.1371/journal.pcbi.1004956.t005
IAPs
Interestingly, the genomic features significant in distinguishing between the flanking sequences of fixed IAP and control regions were very similar to those identified in the analogous
compari-son for ETns. For instance, just as fixed ETns (Table B inS1 TextandFig 2A), fixed IAPs were
found in regions with lower recombination, later replication, and smaller distance to the
cen-tromere than controls (Table B inS1 TextandFig 2B). Most predictors found to be significant
Table 6. Multiple FLR models for fixed IAP vs. control. See explanations forTable 3.
Predictor Range of windows Coefficient p-value RCDE (%)
CpG methylation WA scalar -1.1E+00 1.2E-03 0.6
H3K27me3 content scalar -2.6E-01 2.0E-16 5.5
H3K4me3 content scalar 3.5E-01 1.2E-03 0.6
TSS DBTSS content (-32,-24) -1.9E-02 3.1E-04 11.1
(-24,-16) -1.5E-02 2.3E-03 (-16,-8) -2.9E-03 5.4E-01 (-8,0) -1.8E-02 2.3E-04 (0,8) -1.4E-02 3.1E-03 (8,16) -2.1E-02 1.1E-05 (16,24) -1.1E-02 2.7E-02 (24,32) -1.5E-02 5.7E-04
Exon content (-28,-20) 2.4E-03 5.0E-01 7.6
(-20,-12) -1.0E-02 5.8E-03 (-12,-4) 1.0E-03 8.0E-01 (-4,4) -3.2E-02 3.4E-14 (4,12) -3.4E-03 4.0E-01 (12,20) -5.2E-03 1.9E-01 (20,28) -6.8E-03 4.7E-02
H3K4me1 content (-28,-20) -7.0E-03 1.6E-02 9.4
(-20,-12) 4.2E-04 8.9E-01 (-12,-4) -4.4E-03 1.7E-01 (-4,4) -3.3E-02 2.0E-16 (4,12) -3.8E-03 2.4E-01 (12,20) -2.4E-05 9.9E-01 (20,28) -5.9E-03 4.7E-02
L1 target sites count (-30,-10) 5.4E-02 7.1E-06 8.6
(-10,10) 5.3E-02 2.2E-05
(10,30) 5.1E-02 1.0E-05
DNase hypersensitive sites content (-28,-20) 4.0E-03 5.0E-01 5.1
(-20,-12) 2.1E-02 1.1E-03 (-12,-4) 2.2E-02 6.6E-04 (-4,4) 6.8E-03 2.7E-01 (4,12) 1.9E-02 3.8E-03 (12,20) 1.9E-02 2.3E-03 (20,28) 1.6E-02 1.0E-02
H3K36me3 content (-30,-10) 6.8E-04 7.3E-01 3.5
(-10,10) -1.6E-02 2.2E-11
(10,30) 5.4E-03 8.8E-03
DE (%) 33.3
doi:10.1371/journal.pcbi.1004956.t006
Table 7. Multiple FLR models for polymorphic IAP vs. control. See explanations forTable 3.
Predictor Range of windows Coefficient p-value RCDE (%)
Recombination hotspots content scalar 3.2E-01 8.3E-07 2.1
CHG methylation WA scalar 7.6E+00 4.5E-05 1.4
Replication timing WA scalar 8.0E-01 2.0E-16 6.6
H3K27me3 content scalar -1.2E-01 8.8E-07 2.1
H3K36me3 content scalar -9.4E-02 1.9E-05 1.5
H3K4me1 content scalar -1.5E-01 7.0E-03 0.6
L1 target sites count (-30,-10) 6.3E-02 1.6E-07 13.5
(-10,10) 5.0E-02 5.4E-05
(10,30) 4.3E-02 1.7E-04
H3K9me3 content (-28,-20) 6.8E-02 7.6E-05 16.1
(-20,-12) 1.4E-01 7.7E-08 (-12,-4) 7.1E-02 2.0E-04 (-4,4) 7.8E-02 2.0E-05 (4,12) 5.1E-02 8.6E-03 (12,20) 4.9E-02 1.9E-03 (20,28) 1.0E-01 7.2E-06
Exon content (-28,-20) -9.8E-03 3.7E-02 8.9
(-20,-12) -5.6E-03 2.6E-01 (-12,-4) 3.2E-03 5.4E-01 (-4,4) -3.6E-02 3.2E-10 (4,12) -6.4E-04 9.0E-01 (12,20) -8.2E-03 1.2E-01 (20,28) -6.0E-03 1.9E-01
CpG methylation WA (-28,-20) -1.2E-01 5.3E-04 6.1
(-20,-12) 3.0E-02 4.0E-01 (-12,-4) -7.6E-02 2.9E-02 (-4,4) -1.3E-02 7.0E-01 (4,12) -1.1E-01 2.0E-03 (12,20) -1.1E-01 1.7E-03 (20,28) -8.7E-02 1.2E-02 DE (%) 30.4 doi:10.1371/journal.pcbi.1004956.t007
Table 8. Multiple FLR models for fixed vs. polymorphic IAP. See explanations forTable 3.
Predictor Range of windows Coefficient p-value RCDE (%)
Recombination hotspots content scalar -4.1E-01 2.0E-16 42.2
Recombination rates LR WA scalar -1.9E+00 1.3E-03 4.2
H3K4me1 content (-28,-20) -6.7E-04 7.5E-01 47.6
(-20,-12) 1.6E-03 4.6E-01 (-12,-4) 4.9E-04 8.2E-01 (-4,4) -2.4E-02 2.0E-16 (4,12) 9.2E-04 6.6E-01 (12,20) 1.2E-03 5.6E-01 (20,28) -2.1E-03 2.8E-01 DE (%) 3.8 doi:10.1371/journal.pcbi.1004956.t008
by the ITP tests were also shared between the fixed IAPs vs. controls and the fixed ETns vs.
controls comparisons (Figs5Aand4A, respectively). Several noteworthy exceptions included a
uniform underrepresentation of H3K27ac throughout the 64 kb region flanking fixed IAPs (Fig 5Aand Fig I inS1 Text), while this histone mark was overrepresented near the IntS of fixed
Table 9. Multiple FLR models for fixed HERV-K vs. control. See explanations forTable 3.
Predictor Range of windows Coefficient p-value RCDE (%)
LINE content scalar 3.6E+00 2.0E-16 13.33
Recombination hotspots motif count scalar 3.0E+00 2.0E-16 9.68
Replication timing WA scalar -8.3E-01 4.1E-07 1.12
CHG methylation WA scalar -7.8E+00 1.5E-04 0.64
H3K9me3 content scalar 1.9E-01 1.9E-07 1.17
H3K4me1 content scalar -3.6E-01 1.9E-04 0.58
H3K9ac content scalar -3.1E-01 9.1E-04 0.46
L1 target sites count (-30,-10) 3.2E-01 2.0E-16 27.09
(-10,10) 2.6E-01 1.6E-14
(10,30) 3.4E-01 2.0E-16
AT count (-30,-10) -1.9E-03 8.5E-13 12.61
(-10,10) -1.5E-03 5.4E-08
(10,30) -2.1E-03 5.5E-16
G-quadruplex repeats content (-32,-16) -9.7E-02 1.8E-02 1.89
(-16,0) -1.5E-01 2.4E-04
(0,16) -1.1E-01 5.2E-03
(16,32) -3.0E-02 4.5E-01
Hypomethylation testis content (-32,-16) 3.7E-02 2.6E-06 5.37
(-16,0) 3.9E-02 2.4E-07
(0,16) 3.3E-02 5.0E-05
(16,32) 1.8E-02 1.8E-02
CpG islands content (-32,0) -5.7E-02 2.9E-13 5.22
(0,32) -3.1E-02 7.2E-06
DE (%) 79.0
doi:10.1371/journal.pcbi.1004956.t009
Table 10. Multiple FLR models forin vitro HERV-K vs. control. See explanations forTable 3.
Predictor Range of windows Coefficient p-value RCDE (%)
L1 target sites count scalar -2.8E+00 2.0E-16 11.0
AT count scalar 1.6E-02 5.9E-15 7.7
Recombination hotspots motif count scalar -2.9E-01 4.9E-04 1.5
CHH methylation WA scalar -3.4E+00 5.0E-03 0.9
H3K9me3 content scalar 1.3E-01 5.3E-14 6.8
Distance to telomere scalar -4.5E-09 3.0E-02 0.6
Intron content (-32,-16) -4.6E-02 1.9E-05 29.2
(-16,0) -3.7E-02 4.0E-03
(0,16) -3.8E-02 3.9E-03
(16,32) -3.5E-02 8.0E-04
CpG methylation WA (-32,-16) 1.6E-01 6.0E-03 4.6
(-16,0) 8.8E-02 1.2E-01
(0,16) 1.4E-01 2.0E-02
(16,32) 1.5E-01 4.5E-03
DE (%) 24.4
ETns (Fig 4Aand Fig H inS1 Text). Transcription start sites were underrepresented for fixed IAPs, while they were not significant for fixed ETns. Also, three histone marks (H3K4me1, H3K4me3, and K3K9ac), as well as DNase I hypersensitive sites, were uniformly underrepre-sented throughout the 64 kb region flanking fixed IAPs, but not significantly different from
controls immediately next to the IntS for ETns (Fig 5A, Fig I inS1 Text,Fig 4A, and Fig H in
S1 Text). Major individual predictors, as identified by single FLRs, were also remarkably similar
between fixed IAPs (Table C inS1 TextandFig 7B) and fixed ETns (Table C inS1 TextandFig
7A)–with only one extra predictor for fixed IAPs; H3K9me3 content. The multiple FLR model
had a 33.3% deviance explained (Table 6) and again showed many similarities to the analogous
model for fixed ETns (Table 3).
Next, following a logic similar to the one used above for ETns, we attempted to separate integration vs. fixation preferences for IAPs. Just as was observed for ETns, genomic features significant in distinguishing the flanking sequences of polymorphic IAPs from control regions (Fig 5Band Fig J inS1 Text) were very similar to those distinguishing the flanking sequences of
fixed IAP from control regions (Fig 5Aand Fig I inS1 Text). The underrepresentation of
Z-DNA repeats was more localized (close to the IntS), while recombination hotspot content was more uniformly overrepresented in polymorphic IAPs vs. controls than in fixed IAPs vs. controls. Moreover, transcription start sites showed no significant differences and the H3K27ac histone mark was only weakly underrepresented in polymorphic IAPs vs. controls, while these features were more prominent in fixed IAPs vs. controls suggesting their impor-tance for fixation rather than integration. Single FLRs identified the same group of major pre-dictors for polymorphic IAPs vs. controls as were identified for polymorphic ETns vs. controls,
with the addition of the functional predictor ESC expression (explained deviance 22%)(Fig 7B
and Table C inS1 Text). We excluded these features from the final multiple FLR model, which
Table 11. Multiple FLR models for fixed vs.in vitro HERV-K. See explanations forTable 3.
Predictor Range of windows Coefficient p-value RCDE (%)
Replication timing WA scalar -1.7E-01 1.0E-02 2.2
CHH methylation WA scalar -3.9E+00 3.5E-05 5.8
Most conserved elements content (-30,-10) -1.2E-02 2.3E-04 56.1
(-10,10) -2.6E-02 9.2E-13
(10,30) -2.7E-03 4.0E-01
Exon content (-28,-20) 1.1E-02 9.4E-02 10.3
(-20,-12) 1.6E-02 1.8E-02 (-12,-4) 4.7E-03 5.0E-01 (-4,4) -1.5E-02 5.4E-02 (4,12) 3.8E-03 5.9E-01 (12,20) 5.2E-03 4.5E-01 (20,28) 1.3E-02 3.4E-02
H3K4me1 content (-28,-20) -1.6E-02 2.9E-02 9.1
(-20,-12) 4.0E-04 9.6E-01 (-12,-4) -2.3E-02 5.3E-03 (-4,4) 2.5E-02 1.2E-03 (4,12) -6.6E-03 3.7E-01 (12,20) -5.5E-03 4.8E-01 (20,28) -3.7E-03 5.9E-01 DE (%) 12.1 doi:10.1371/journal.pcbi.1004956.t011
explained 30.4% of the deviance in discriminating polymorphic IAPs vs. controls (Table 7) and
was similar to the analogous model for ETns (Table 4).
When comparing fixed and polymorphic IAPs (Fig 5Cand Fig K inS1 Text), the ITP
identi-fied only three features that had lower means throughout the fixed IAP integration regions– SINEs, DNase I hypersensitive sites, and recombination hotspots. However, striking differences were observed for 12 genomic features with localized landscape. For instance, fixed IAPs revealed strong signatures of depressed means within ±4 kb from the IntS for features such as dinucleotide and trinucleotide microsatellites, most conserved elements, unmethylated CpGs, and the histone mark H3K27me3. Introns and two histone marks (i.e. H3K4me1 and
H3K27ac) were also underrepresented in a larger area around the IntS. Moreover, we observed overrepresentation of LINEs and H3K9me3 (the mark of heterochromatic regions) surround-ing the IntS in fixed vs. polymorphic IAPs. Exon content was underrepresented in a few win-dows downstream of the IntS, while AT count was overrepresented in most winwin-dows of both flanks except at the IntS. Single FLRs for fixed vs. polymorphic IAPs identified H3K9me3 as a
very strong functional predictor (explained deviance of 21.5%,Fig 7Band Table C inS1 Text).
All other features, singularly, could explain only a very low portion of the deviance (<2%), and even their concurrent effect was low, producing a multiple FLR model with an explained
devi-ance of 3.8% (Table 8).
HERV-Ks
Flanking sequences of fixed HERV-Ks were characterized by lower recombination rates and
later replication timing than controls (Table B inS1 TextandFig 2C). Based on the ITP (Fig
6A), microsatellites (of all four types), LINEs, recombination hotspots, L1 target sites, AT
count, and H3K9me3 marks were overrepresented, while G-quadruplex repeats, SINEs, repli-cation origins, cytosine methylation level features (i.e. CpG, CHG, and CHH), and four histone marks (H3K36me3, H3K4me1, H3K27ac, and H3K9ac) were underrepresented, throughout these flanking sequences. Exons, introns, and most conserved elements were underrepresented as well, especially near the IntS. Single FLR fits revealed that all four microsatellites types (sca-lar predictors), introns, and H1-hESC transcript expression, considered as functional predic-tors, each individually explained 26–76% of the deviance. These features were excluded from
the final multiple FLR model (Fig 7Cand Table C inS1 Text), which explained 79% of the
devi-ance (Table 9). The model included LINEs and recombination hotspots as positive scalar
pre-dictors (RCDE of 13% and 9.7%, respectively). In terms of functional prepre-dictors, L1 target sites was the strongest predictor with a positive effect in the whole region from -30 to 30 kb, and stronger away from the IntS (RCDE 27.1%). In addition, AT count had a negative effect stron-ger away from the IntS (RCDE 12.6%), hypomethylation in testis and CpG islands had positive and negative effects, respectively, for the whole integration region (both RCDE of ~5%), and G-quadruplex repeats had a negative effect near and upstream of the IntS (RCDE 1.9%).
To highlight HERV-Ks’ integration preferences, we contrasted flanking sequences of in vitro HERV-Ks vs. control regions. The former replicated later and were more distant from the
centromere than the latter (Table B inS1 TextandFig 2C). The ITP indicated (Fig 6B) that
G-quadruplex repeats, L1 target sites, recombination hotspots, replication origins, CHH methyla-tion, and four histone marks associated with active transcription or promoters (H3K36me3, H3K4me1, H3K27ac, and H3K9ac) were underrepresented, while LINEs, AT count, and the H3K9me3 mark were overrepresented, throughout the flanking sequences compared to control regions. Additionally, the ITP indicated that there were fewer CHG methylated sites near the IntS of in vitro HERV-Ks than in control regions. Other genomic features had significant dif-ferences further away from the IntS (e.g., SINEs, TSS ENCODE, H1-hESC transcript
expression, and H3K27me3), or showed more complex localized behaviors (Fig 6Band Fig M inS1 Text). The multiple FLR model for in vitro HERV-Ks vs controls explained 24.4% of the
deviance (Table 10).
To focus on HERV-K fixation preferences, we contrasted flanking sequences of fixed vs. in vitro HERV-Ks. Recombination rates, replication timing, and distance to centromere were
sig-nificantly different, with lower means for fixed compared to in vitro HERV-Ks (Table B inS1
TextandFig 2C). The ITP (Fig 6Cand Fig N inS1 Text) indicated that microsatellites, L1 tar-get sites, and recombination hotspots were overrepresented throughout the flanking sequences of fixed vs. in vitro HERV-Ks. Introns and most conserved elements were underrepresented throughout the whole region too, but the difference was stronger near the IntS. Exons were underrepresented ±2 kb next to the IntS. Moreover, three histone marks (H3K4me3, H3K27ac, and H3K9ac) were underrepresented upstream of the IntS, while the H3K9me3 mark was over-represented downstream of the IntS. CpG and CHG methylated sites, as well as H3K36me3, were generally underrepresented but had more complex localization patterns. Single FLRs identified six positive scalar predictors–all four microsatellites types, recombination hotspots,
and L1 target sites–each of which, individually, explained as much as 85% of the deviance (Fig
7Cand Table C inS1 Text).
Discussion
Here, to investigate patterns in the distributions of ERV elements, we studied a number of genomic features in the flanking sequences of human and mouse ERVs with FDA, a class of statistical techniques still relatively underused in the field of genomics. In particular, we con-trasted features between the flanking regions of fixed ERVs vs. controls, polymorphic (or in vitro) ERVs vs. controls, and fixed vs. polymorphic ERVs. The first type of contrast reflects both fixation and integration preferences with the latter somewhat eroded by selection, the sec-ond type highlights integration preferences with minimal influence of selection–particularly in the case of in vitro ERVs, while the third type captures fixation preferences. We observed that various genomic features are overrepresented or underrepresented in some but not other
con-trasts (Fig 7). Moreover, while some features present significant differences over the whole
flanking regions considered, others present localized differences–especially close to the IntS. Below we discuss our findings, relating them to biological processes proxied by the various
genomic features under analysis (Table 2).
DNA conformation
We explored the associations between ERVs and a diverse set of non-B DNA conformation predictors inferred from the primary DNA sequence of the human and mouse genomes. In vivo, such conformations are formed transiently during recombination, repair, transcription,
and replication, frequently causing genomic instability [79] and were found to be associated
with the presence of DNA transposons [44,46]. We observed that mirror repeats and A-phased
repeats are overrepresented in the flanking regions of fixed ETns, as well as of fixed and poly-morphic IAPs, as compared with control regions (A-phased repeats are also overrepresented in the vicinity of fixed HERV-Ks). The overrepresentation of these repeats in the flanking regions of both fixed and polymorphic IAPs suggests their role in ERV integration–the lack of signifi-cant overrepresentation for polymorphic ETns perhaps being due to a more limited statistical
power, given the smaller sample size (Table 1). A subset of mirror repeats–triplex repeats–are
thought to bind mismatch and nucleotide excision repair proteins [79], therefore we propose
that these protein complexes might be recognized by the integrase machinery and trigger ERV integration. This hypothesis needs to be evaluated experimentally. Mirror repeats have also
been associated with low gene expression levels [79]. In agreement with this we found ERVs enriched in regions with low levels of transcription (see below). A-phased repeats cause double helix bends that have been implicated in nucleosome assembly and expansion of trinucleotide
microsatellites [65,80] and might be important for the recognition of IntSs by the ERV
inte-grase, as suggested by retroviral studies [81–84]. Moreover, unlike mirror repeats that do not
have base composition bias, A-phased repeats are adenine-rich [65], resonating with the effect
of A/T nucleotides (see below).
G-quadruplex and Z-DNA repeats displayed negative associations with the ERVs. G-quad-ruplex repeats are underrepresented in fixed vs. control and in vitro (or polymorphic) vs. con-trol contrasts for both HERV-Ks and IAPs and thus likely inhibit ERV integration. Z-DNA repeats might inhibit ERV integration as well, because they are underrepresented in the flank-ing regions of both fixed and polymorphic IAPs. Importantly, these two types of repeats appear
to be inhibitive of ERV integration beyond their GC-rich composition [65] because in several
of our models they appear as significant predictors of ERV distributions together with
AT-con-tent (Tables3and9). Both G-quadruplex and Z-DNA repeats are enriched in promoters and
in the 5’ and 3’ gene termini [79], and therefore we cannot exclude the possibility that purifying
selection removes ERVs from such regions.
We observed a strong overrepresentation of all four types of microsatellites in the fixed and polymorphic mouse ERVs compared to controls, suggesting the importance of microsatellites
for ERV integration. Many microsatellites form non-canonical DNA structures–e.g., (AG)n
repeats form triplexes, (AT)nform four-stranded cruciforms, while (CA)nand (GC)nform
Z-DNA [85,86]–which lead to genome instability [87] and may be used by the integrases to
recognize potential IntSs. In the human genome, we found an enrichment of microsatellites of all four types for fixed HERV-Ks compared with controls, and for fixed vs. in vitro HERV-Ks. Therefore, microsatellites might not be directly relevant to HERV-K integration, and instead be more relevant for their fixation (caution should be exercised though when comparing the results from in vitro vs. control and polymorphic vs. control contrasts, as the latter are more influenced by selection). The flanking regions of in vitro HERV-Ks actually had an underrepre-sentation of mononucleotide microsatellites, potentially because such microsatellites are
fre-quently present as (A/T)nrepeats located at the 3’ ends of retrotransposed genes–where
HERV-K integrations might be selected against. Additionally, (A/T)nrepeats are found in Alus
that are also underrepresented in the in vitro HERV-K flanking regions (see below).
Nucleotide composition and the presence of other TEs
Corroborating previous studies [24,32], we observed that both mouse and human ERVs
inte-grate and become fixed in AT-rich genomic regions. Indeed, AT-content was a significant pre-dictor in eight out of nine ITP contrasts (except for in vitro HERV-K). Moreover, L1 target
sites [88] are overrepresented in the flanking regions of polymorphic and fixed mouse ERVs as
compared to controls, suggesting that these sequences correlate with mouse ERV integration. L1 target sites are also overrepresented in the flanking regions of fixed HERV-Ks vs. controls, and of fixed vs. in vitro HERV-Ks, but are underrepresented in the flanking sequences of in vitro HERV-Ks vs. controls, thus suggesting that these sequences correlate with HERV-K fixa-tion. The enrichment of L1 target sites in the vicinity of ERVs can be explained by the high AT-content of these sequences, and thus it might simply reflect the AT-richness of the genomic regions in which ERVs integrate or are fixed, or perhaps it also indicates the enrichment of LINEs in these flanking regions (see below). Both AT nucleotides and L1 target sites have posi-tive effects as single predictors, however, in the context of multiple FLR, when the two predic-tors are considered jointly, we observed a negative effect of AT nucleotides. Indeed, given the