Adenosine A
2Areceptor ligand recognition and signaling is blocked
by A
2Breceptors
Sonja Hinz1, Gemma Navarro2,4, Dasiel Borroto-Escuela3, Benjamin F. Seibt1,
York-Christoph Ammon1, Elisabetta de Filippo1, Azeem Danish1, Svenja K. Lacher1,
Barbora Červinková1, Muhammad Rafehi1, Kjell Fuxe3, Anke C. Schiedel1, Rafael
Franco2,4 and Christa E. Müller1
1PharmaCenter Bonn, Pharmaceutical Institute, Pharmaceutical Chemistry I, University of Bonn, Bonn, Germany 2Department of Biochemistry and Molecular Biomedicine, Faculty of Biology, University of Barcelona, Barcelona, Spain 3Department of Neuroscience, Karolinska Institutet, Stockholm, Sweden
4Centro de Investigación en Red, Enfermedades Neurodegenerativas (CIBERNED), Instituto de Salud Carlos III, Madrid, Spain Correspondence to: Christa E. Müller, email: [email protected]
Keywords: adenosine receptors (ARs); G protein-coupled receptor (GPCR); immuno-oncology; pharmacology; receptor
heteromerization
Received: November 08, 2017 Accepted: January 30, 2018 Published: February 06, 2018
Copyright: Hinz et al. This is an open-access article distributed under the terms of the Creative Commons Attribution License 3.0 (CC BY 3.0), which permits unrestricted use, distribution, and reproduction in any medium, provided the original author and source are credited.
ABSTRACT
The adenosine receptor (AR) subtypes A2A and A2B are rhodopsin-like Gs protein-coupled receptors whose expression is highly regulated under pathological, e.g. hypoxic, ischemic and inflammatory conditions. Both receptors play important roles in inflammatory and neurodegenerative diseases, are blocked by caffeine, and have now become major drug targets in immuno-oncology. By Förster resonance energy transfer (FRET), bioluminescence resonance energy transfer (BRET), bimolecular fluorescence complementation (BiFC) and proximity ligation assays (PLA) we demonstrated A2A-A2BAR heteromeric complex formation. Moreover we observed a dramatically altered pharmacology of the A2AAR when co-expressed with the A2BAR (A2B ≥ A2A) in recombinant as well as in native cells. In the presence of A2BARs, A2A-selective ligands lost high affinity binding to A2AARs and displayed strongly reduced potency in cAMP accumulation and dynamic mass redistribution (DMR) assays. These results have major implications for the use of A2AAR ligands as drugs as they will fail to modulate the receptor in an A2A-A2B heteromer context. Accordingly, A2A-A2BAR heteromers represent novel pharmacological targets.
www.impactjournals.com/oncotarget/ Oncotarget, 2018, Vol. 9, (No. 17), pp: 13593-13611
INTRODUCTION
Adenosine receptors (ARs) are G protein-coupled receptors (GPCRs) activated by the nucleoside adenosine. Four subtypes designated A1, A2A, A2B and A3ARs exist. A1
and A3ARs preferentially couple to Gi/o proteins mediating
inhibition of adenylate cyclase (AC) activity, while A2A
and A2B receptors couple to Gs/olf proteins leading to AC
activation and subsequent increase in cAMP formation [1]. In addition, A2B and A3ARs were shown to couple to
Gq proteins which results in phospholipase C activation
followed by a rise in inositol trisphosphate levels mediating intracellular calcium release [2–3]. The A2AAR
is expressed in high density in the caudate-putamen, and at low levels in most other brain regions. In the periphery, the A2AAR is highly expressed in cells of the immune system and blood platelets, and at lower levels in many other cells and organs [4]. The A2BAR is broadly expressed but mostly at moderate to low levels. A2A and A2BARs are the most closely related AR subtypes with an overall sequence identity of 58% and a similarity of 73% [5]. They are co-expressed on many different cell types and in various organs and tissues, e.g. in heart [6], myeloid cells [7], T-cells [8], blood platelets [9], brown and white adipocytes [10], and in many tumors, e.g. neuroendocrine tumors [11], ovarian cancer [12], and prostate cancer
www.impactjournals.com/oncotarget
[13]. The expression of A2A and A2BARs and their relative proportion can be markedly altered under pathological conditions [14]. For example, increased A2AAR expression is observed in the brains of patients suffering from neurodegenerative diseases [15], in multiple sclerosis and in amyotrophic lateral sclerosis [16–17]. Upon activation of T-lymphocytes the A2AAR is considerably upregulated [18]. On the other hand, the expression of A2BARs can be drastically increased in a hypoxia-inducible factor- (HIF1α-) dependent manner under hypoxic conditions, e.g. in inflamed or ischemic tissue, in tumors and cancer cells [19–20]. Hypoxia induction leads to a decrease in A2AAR expression while increasing A2BAR expression in human umbilical vein endothelial and bronchial smooth muscle cells. Pharmacological responses of A2A/A2BAR agonists were significantly altered in these cells [21]. The well investigated A2AAR subtype, the so-called “high-affinity A2AR receptor”, is typically activated by relatively low (nanomolar) concentrations of adenosine, mediating potent anti-inflammatory and immunosuppressant as well as hypotensive and anti-psychotic effects [22]. In contrast, activation of the A2BAR subtype, the “low-affinity A2AR”, requires high, micromolar adenosine concentrations for activation [4]. Extracellular adenosine levels can rise from basal values of around 100 nM by up to 100-fold reaching concentrations of around 10 µM under pathological, i.e. hypoxic, ischemic or inflammatory conditions [1, 4, 23]. Cell death can lead to the formation of large amounts of extracellular adenosine through enzymatic degradation of released ATP by ectonucleotidases (CD39, CD73), e.g. in solid tumors [24]. Both anti- as well as pro-inflammatory effects have been associated with the A2BAR [25], and the reasons for these contradictory results have remained obscure. The physiological significance of the A2BAR subtype is scarcely understood so far. During the last decade it has become well accepted that GPCRs are able to form di- or oligomeric assemblies of identical or distinct receptor monomers [26]. Most of these complexes have been detected in transfected living cells using well accepted biophysical techniques such as resonance energy transfer (bioluminescence and Förster resonance energy transfer, BRET and FRET) or bimolecular fluorescence complementation (BiFC) assays [27–28]. Proximity ligation assays (PLA) have been developed for identifying receptor heteromers in native cells and tissues [29]. Heteromer formation may modulate receptor pharmacology such as the affinity and potency of ligands or G protein coupling and signaling [30–31]. Recently, structural models of GPCR oligomers associated with G proteins have been built [32], and the development of heteromer-selective receptor ligands is becoming a promising new research area [33]. The A2AAR was reported to form homomeric receptor complexes as well as heteromers with several other GPCRs including dopamine D2 and D3, cannabinoid CB1, nucleotide P2Y1 and P2Y2, and A1ARs [1]. Especially A2A-D2 heteromeric
receptor complexes have been intensively studied since they play a significant role in Parkinson’s disease [34]. However, homo- or heteromer formation of the A2BAR subtype has not been demonstrated up to now. Based on the frequent co-expression of the closely related AR subtypes A2A and A2B, and considering the up-regulation of the A2BAR subtype and the up- or down-regulation of the A2AAR under many pathological conditions, the question arises if both receptors could form heteromers and whether this might affect their pharmacology and signaling. Here we demonstrate that A2A-A2BAR heteromers are formed in living cells by employing FRET, BRET and PLA, and their presence in native tissue was confirmed. Heteromer formation was found to be independent of the presence of agonists or antagonists, and does not require the long C-terminus of the A2AAR. Importantly, we demonstrate that A2A-A2B heteromerization is the reason for drastically altered pharmacology, in particular for the A2AAR, which is completely blocked by the presence of A2BAR protein. These results can now help to explain many unexpected or previously misinterpreted observations. They will be of high relevance for recently started drug development programs targeting A2A or A2BARs, in particular in neurodegenerative diseases and immuno-oncology.
RESULTS
FRET, BRET and BiFC experiments
FRET is a powerful technique for measuring protein-protein interactions in living cells [35]. To investigate a possible A2A-A2BAR interaction, FRET
experiments were performed in Chinese hamster ovary (CHO-K1) cells transiently transfected with fusion proteins of green fluorescent protein variant 2 (GFP2) and
enhanced yellow fluorescent protein (EYFP) attached to the C-terminus of the receptors [36] (Figure 1A–1C). The previously described A2A-homodimer and the fusion
protein GFP²-EYFP were employed as positive controls showing FRET efficiencies of 0.23 and 0.44, respectively, similar to those previously reported (A2A homodimer:
0.28, GFP²-EYFP: 0.52) (Figure 1A, 1B) [37]. The fusion protein GFP²-EYFP displayed a high FRET efficiency due to the very close proximity of donor and acceptor as a result of the short linker between both fluorophores. A clear FRET signal with an efficiency of 0.16 was observed in the co-transfected cells indicating the formation of A2A-A2B heteroreceptor complexes (Figure 1A). The pair
A2AAR and GABAB2 receptor [36–37] was employed as
a negative control; it showed a very low FRET signal demonstrating the specificity of the observed interactions (Figure 1A–1B). To gain insight into the potential A2A
-A2B heteromer interface, the C-terminal tail of the A2AAR
was removed and the resulting construct A2A
1-293R-EYFP was studied in FRET experiments as an acceptor fluorophore in combination with the A2B-GFP² donor
fluorophore. The results indicated that the A2AAR that was lacking the C-terminal domain was still fully able to form heteromers with the A2BAR (FRET efficiency 0.24, Figure 1B) suggesting that different receptor domains, possibly helical domains, have to be involved in heteromer formation.
BRET is another biophysical technique that can be utilized to detect protein-protein interactions by measuring energy transfer from a bioluminescence donor to a fluorescent acceptor [35]. To confirm a direct A2A -A2BAR interaction, BRET experiments were performed in living CHO-K1 cells transiently expressing fusion proteins
Figure 1: Biophysical assays using A2A and A2BARs fused to FRET donor and acceptor. (A) FRET efficiencies were calculated by a sensitized emission method in living CHO cells transiently transfected with the different plasmids. Data are means ± SEM of 4–5 independent experiments performed in duplicates. The one-way ANOVA with Dunnett’s post-hoc test showed significant differences in A2A-GFP² + A2A-EYFP (positive control) or A2B-GFP² + A2A-EYFP versus the negative control (A2A-GFP2 + GABABR2-EYFP), **p
< 0.01. As an internal control the fusion protein GFP2-EYFP was used. (B) FRET efficiencies determined in CHO cells transiently
transfected with the different plasmids. The same controls were used as shown in (A). Data are means ± SEM of 5 independent experiments performed in duplicates. The one-way ANOVA with Dunnett’s post-hoc test showed significant differences between A2A-GFP² + A2A-EYFP
(positive control) or A2B-GFP² + A2A-1-293-EYFP versus the negative control (A2A-GFP2 + GABABR2-EYFP), **p < 0.01. (C) Schematic
www.impactjournals.com/oncotarget
consisting of a receptor (A2A, A2B, D2, or GABAB2) and Rluc (Renilla luciferase) or the fluorescent protein EYFP attached to the C-terminus (Figure 2A–2D). Three kinds of experiments were performed as shown in Figure 2A, 2C and 2D. For BRET saturation curves cells were co-transfected with a constant amount of cDNA for Rluc-receptor constructs and increasing concentrations of cDNAs for EYFP-receptor constructs. As a widely accepted positive control for GPCR dimers, donor/aceptor proteins having the dopamine D2 R-A2AAR were used. The results showed a high BRET signal displaying a hyperbolic curve, with a BRET50 value of 239 ± 40 and a BRETmax value of 144 ± 6 mBU. As a negative control, donor/acceptor proteins having the A2AAR and GABAB2 receptor pair were used. The combination of A2A and A2BARs resulted in a specific BRET signal which was
even higher than the positive control indicating a specific interaction of both receptors. A BRET50 value of 122 ± 6 and a BRETmax value of 158 ± 10 mBU were determined (Figure 2A). Subsequently, a BRET displacement study was performed in which increasing amounts of unlabeled A2BAR were added to A2B-Rluc and A2A-YFP receptors. The experiment showed a significant decrease in the BRET signal, which was dependent on the added amount of unlabeled A2BAR (Figure 2C), indicating displacement by the unlabeled receptor of the Rluc-tagged A2BAR in the heteromer. As a final step, potential effects of A2A and A2BAR agonists and antagonists on A2A-A2B heteromer formation were studied. The BRET signal after 60 min of treatment with agonists (adenosine, nonselective; NECA, nonselective; CGS-21680, A2A-selective; BAY60–6583, A2B-selective) or
Figure 2: Biophysical assays using A2A and A2BARs fused to BRET donor and acceptor. (A) BRET saturation curves: CHO-K1 cells were transiently co-transfected with a constant amount of A2A, A2B or D2 receptors fused to Rluc and increasing amounts of
cDNA for A2A or GABAB2 receptors fused to EYFP. BRET experiments were performed in duplicates for A2B-Rluc and A2A-YFP (▲) (n
=11) with a BRETmax = 158 ± 10 mBU and BRET50 = 122 ± 58, positive control D2-Rluc and A2A-YFP (●) (n = 15) BRETmax = 144 ± 6
mBU and BRET50 = 239 ± 40, and negative control A2A-Rluc and GABAB2-YFP (♦) (n = 13). (B) Schematic representation of the BRET experiments. (C) BRET competition experiments were performed (n = 4, in triplicates) in cells transfected with 1.25 µg of cDNA for A2B-Rluc, 2.5 µg of cDNA for A2A-YFP and increasing amounts of cDNA for untagged A2BARs. The one-way ANOVA with Dunnett’s
post-hoc test showed a significant decrease in the BRET signal compared to cells which were not transfected with untagged A2BARs (green
column; *p < 0.05; **p < 0.01). (D) CHO cells were transiently co-transfected with 2 µg of cDNA for A
2B-Rluc and 3 µg of cDNA for A2A
-YFP. Different agonists (adenosine, NECA, CGS-21680, BAY60-6583) and antagonists (PSB-603) were added and the BRET signal was measured over a time period of 60 min (n = 3, in duplicates).
the A2B antagonist PSB-603 was similar to that obtained in the absence of ligands (Figure 2D), thus indicating that A2A-A2B heteromer formation was not influenced by those receptor ligands.
These results were further corroborated by BiFC experiments, which provided strong evidence for a very close interaction between A2A and A2BARs (Supplementary Figures 1, 2).
In situ proximity ligation experiments in the rat
brain
The PLA combines the high specificity and affinity of antibodies (PLA probe) with the sensitivity of quantitative polymerase chain reactions (PCR) to detect proteins that are forming molecular complexes in native sources [38]. Initially we studied the recombinant CHO-A2A-A2B cell line to investigate the
receptors’ proximity (Supplementary Figure 3A–3C) and obtained small, brightly green fluorescent spots each of which represents a single A2A-A2BAR heteromer
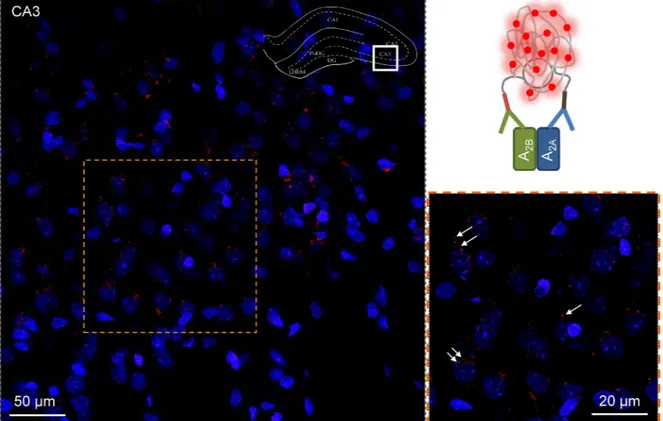
(Supplementary Figure 3C). Next we performed in situ PLA focusing on the dorsal hippocampus of the rat brain (Figure 3, Supplementary Figures 4, 5) where moderate
to high densities of PLA-specific clusters were found. It should be noted that the molecular layer of the dentate gyrus lacked PLA clusters, and the unspecific labeling there was similar to that observed in negative control sections obtained by omitting the primary anti-A2A antibody. Furthermore, few PLA positive clusters were observed in the oriens of the CA1 areas. In contrast, a high density of A2A-A2B specific clusters was found in the CA3 pyramidal cell layer, mainly in perisomatic location (Figure 3), where PLA-positive clusters had diameters from 0.5–2 µm. They were present also in lower densities in the radiatum and oriens. In all these regions PLA positive clusters were also found in the neuropil. The CA1 showed a similar distribution pattern (as compared with CA3), with high dot/cluster densities within the pyramidal cell layer. An important difference was, however, the diameter range of the clusters, which appeared to be reduced in this CA1 region versus CA3 (Supplementary Figure 4).
In the polymorphic layer of the dentate gyrus (PoDG), a high density of specific A2A-A2B clusters was observed in both perisomatic and neuropil position. The range of diameter size in the clusters was similar to that in the CA3 area (Supplementary Figure 5).
Figure 3: In situ proximity ligation assay in rat hippocampus. A2A-A2BAR-specific PLA clusters in the CA3 region of the dorsal hippocampus of the rat (Bregma: –3.6 mm). The sampled region is taken from the framed section of the dorsal hippocampus in the upper
right corner of the figure. The microphotographs taken are based on 20 Z-scans (1 µm each). The nuclei are shown in blue. A high density of PLA positive clusters in red are visualized mainly in the pyramidal cell layer shown also in higher amplification in the panel at the lower right part of the figure. A few are indicated by arrows. The diameter range of the clusters is 0.5–2 µm. They are mainly located in a perisomatic position around the blue nuclei but also in the neuropil. A low density of specific PLA clusters is also found in the radiatum and oriens close to the pyramidal cell layer.
www.impactjournals.com/oncotarget
Pharmacological implications of A2A-A2BAR heteromer formation
To study the pharmacology of A2A-A2BAR
heteromers, native as well as recombinant cell lines were investigated. Expression levels of A2A and A2BARs were
analyzed by reverse transcriptase (RT) PCR, Western blot analysis and radioligand binding studies (Supplementary Figure 6A–6E). Recombinant cell lines were prepared to control the proportion of A2A and A2BAR expression (A2B ≥
A2A, and A2A > A2B) (Supplementary Table 1).
Radioligand-receptor binding studies
Radioligand binding studies were performed using the A2B-selective antagonist radioligand [³H]
PSB-603 and two A2A-selective radioligands, the
antagonist [³H]MSX-2, and the agonist [³H]CGS-21680 (Supplementary Figure 7A–7C, Supplementary Table 2). A selective radiolabeled agonist for A2BARs
is currently not available. Labeling of A2BARs with
[³H]PSB-603 demonstrated high A2B expression in
membrane preparations of CHO-A2B and CHO-A2A-A2B
(A2B ≥ A2A) cell lines both of which displayed similar A2B expression levels (502 and 418 fmol/mg protein, respectively). Jurkat-T (220 fmol/mg protein) and HeLa cells (80 fmol/mg protein) had lower A2BAR expression
levels (Supplementary Figure 6E, Supplementary Table 2). As expected, in cells lacking significant A2B
expression (CHO-K1, CHO-HA-A2A, HEK-A2A), no high-affinity binding of the A2B-selective antagonist radioligand [³H]PSB-603 was observed(Supplementary Figure 7C). In cells that co-expressed both receptors (CHO-A2A-A2B cells, HeLa cells, Jurkat-T cells, native
human T-lymphocytes), specific binding of [³H]PSB-603 was detected, and its affinity was similar to that determined at CHO cells expressing only A2BARs
(Supplementary Figure 8A, Supplementary Table 2). Native primary human lymphocytes displayed a moderate expression level of A2BARs, lower to that of
A2AARs. Upon activation with phytohemagglutinin (PHA), the A2B expression level remained virtually unaltered (Supplementary Figure 9). All radioligand binding results on A2BARs were in agreement with the
data obtained in RT-PCR and Western blot experiments (Supplementary Figure 6A–6D, Supplementary Table 2). The A2A-selective radioligands [3H]MSX-2 and [3H]
CGS-21680 labeled A2AARs in CHO-A2A cells and in cells expressing more A2A- than A2BARs (Figure 4,
Supplementary Figure 7A, 7B, Supplementary Table 2). Native primary human lymphocytes displayed specific binding of [3H]MSX-2 indicating A
2AAR expression,
that was significantly upregulated (by about 4-fold) upon activation with PHA (Supplementary Figure 9, Supplementary Table 2). Unexpectedly, in cells with similar or higher expression of A2B as compared to
A2AARs no high-affinity binding of either A2A-selective radioligand, [3H]MSX-2 or [3H]CGS-21680, was
observed (Supplementary Figure 8A, 8B, Supplementary Table 2). Competition binding assays versus [3
H]PSB-603 were performed to determine the A2B affinity of
selected agonists and antagonists while A2A affinity of
compounds was determined versus [3H]MSX-2. Indeed,
the latter was only possible in cell lines expressing more A2A than A2BARs since high affinity binding of the A2A
-selective radioligands was abolished when A2B receptors
were co-expressed (see above).
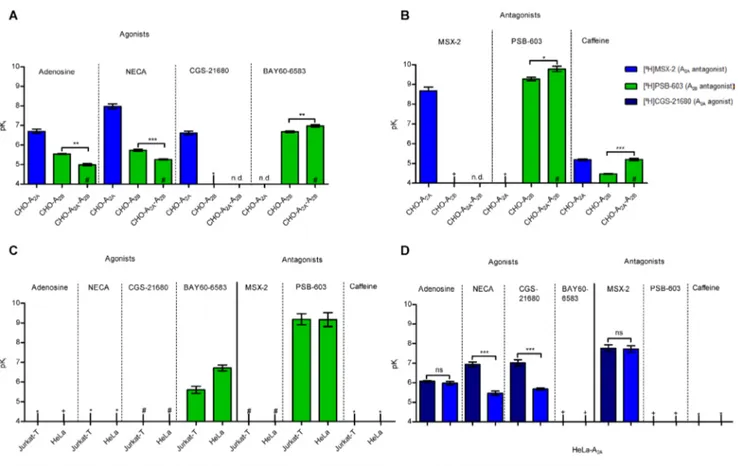
CHO-A2A and CHO-A2B cell lines displayed the expected affinities of agonists and antagonists typical for, respectively, A2A or A2BARs (Figure 4A, 4B, Supplementary Table 3). In CHO-A2A-A2B cell membranes, which showed a similar or slightly higher expression of A2B than of A2AARs, the agonists adenosine, NECA, and
BAY60-6583 and the antagonists PSB-603 and caffeine displayed only slightly modulated A2B affinities (Figure
4A, 4B, Supplementary Table 3). We subsequently studied a T-cell line, namely Jurkat-T cells, which express similar amounts of A2A and A2BARs, the level of which
is, however, lower than in the recombinant CHO-A2A
-A2B cells. The A2B-selective radioligand [3H]PSB-603
displayed high affinity binding which was displaced by the A2B-selective partial agonist BAY60-6583 (Figure 4C, Supplementary Figure 8A, Supplementary Tables 2, 3). However, no high-affinity binding was observed for the A2A-selective radioligands [³H]MSX-2 and
[³H]CGS-21680 (Supplementary Figure 8A, 8B, Supplementary Table 2), although we could clearly detect A2AAR protein
expression in Jurkat-T cells (Supplementary Figure 6C). In native T-lymphocytes, isolated from healthy human blood donors, the expression of the A2AAR was higher than that
of the A2BAR (Supplementary Figure 9, Supplementary
Table 2). High affinity binding was then observed for the A2A-selective radioligand [3H]MSX-2 as well as for the
A2B-selective radioligand [3H]PSB-603 (Supplementary
Figure 8A, 8B, Supplementary Table 2). In HeLa cells, which natively express more A2B than A2AARs, again,
no high-affinity binding was obtained for the A2A
-selective radioligands [³H]MSX-2 and [³H]CGS-21680 (Supplementary Figure 8A, 8B, Supplementary Table 2) although we could clearly detect the A2AAR protein in this
cell line (Supplementary Figure 6D). As a next step we overexpressed the human A2AAR containing an HA tag in
HeLa cells to obtain a cell line which expressed more A2A
than A2BARs (Supplementary Figure 6D, Supplementary Table 2). This led to the recovery of high-affinity binding for the A2A-selective radioligands (Figure 4D, Supplementary Table 2). NECA and CGS-21680 showed higher affinity versus the agonist radioligand than versus the antagonist radioligand, whereas the antagonist MSX-2 displayed similar affinities versus both radioligands (Figure 4D, Supplementary Table 3), results that are typical for A2AARs [39].
cAMP accumulation assays
A2A and A2BARs are coupled to Gs proteins,
activating adenylate cyclase. Thus, cAMP accumulation assays were performed at CHO cells stably expressing the A2AAR, the A2BAR, or both. Adenosine increased cAMP
accumulation with an EC50 value of 174 nM in CHO
cells expressing the “high affinity” A2AAR, and with an
EC50 value of 12,500 nM in CHO cells expressing the
“low-affinity” A2BAR. The CHO-A2A-A2B cell line
co-expressing both subtypes showed virtually the same EC50
value (13,100 nM) as the cell line only expressing A2BARs
(Figure 5A, Supplementary Table 4). The metabolically more stable adenosine analog NECA displayed a similar behaviour. The potent A2A-selective agonist CGS-21680
(EC50 16.6 nM in CHO-A2A cells) was inactive in
CHO-A2A-A2B cells (EC50 > 10,000 nM). In contrast, the A2B
-selective partial agonist BAY60-6583 (EC50 165 nM
in A2BAR-expressing cells) had similar potency in the
A2A-A2B-coexpressing cell line (EC50 193 nM) (Figure 5A, Supplementary Table 4). Antagonist potencies were determined by measuring concentration-response curves for the non-selective agonist NECA in the presence or absence of different antagonists, and KB values were calculated. The A2B-selective antagonist PSB-603 and the non-selective antagonist caffeine showed very similar KB-values at CHO-A2A-hA2B (PSB-603, KB 0.673 nM; caffeine, KB 9,900 nM) as at CHO-A2B cells (PSB-603, KB 0.358 nM; caffeine, KB 15,600 nM) (Figure 5B, Supplementary Table 4).
We next employed Jurkat-T cells as a native cell line expressing similar amounts of A2A and A2BARs. These cells behaved like the CHO-A2A-A2B cell line displaying moderate potency for the physiological agonist adenosine and the structurally related agonist NECA. Again, CGS-21680 was inactive at concentrations up to 10 µM, while the A2B-selective antagonist PSB-603 and the nonselective antagonist caffeine displayed KB-values in the same
Figure 4: Affinities of AR agonists and antagonists in different cells expressing A2A and A2BARs. (A) Competition binding
experiments of agonists versus 1 nM [³H]MSX-2 at A2A-expressingmembranes, and versus 0.3 nM [³H]PSB-603 at A2B- and at A2A-A2B
AR-expressing membranes of CHO cells. The two-tailed t-test showed significant differences. ***p < 0.001, **p < 0.01, n = 2–3, see also
Supplementary Table 3. (B) Competition binding experiments of AR antagonists versus 1 nM [³H]MSX-2 at A2A-expressing, and versus
0.3 nM [³H]PSB-603 at A2B - and at A2A-A2BAR co-expressing CHO cell membranes. The two-tailed t-test showed significant differences.
***p < 0.001, *p < 0.1, n = 3, see also Supplementary Table 3. (C) Competition binding experiments of AR agonists and antagonists
versus 0.3 nM [³H]PSB-603 at Jurkat-T and HeLa cell membranes, n = 3–6, see also Supplementary Table 3. (D) Competition binding experiments agonists and antagonists versus 5 nM [³H]CGS-21680, and versus 1 nM [³H]MSX2, respectively, at HeLa cell membranes recombinantly overexpressing A2AARs. The two-tailed t-test showed significant differences. ns: not significant, ***p < 0.001, n = 3–4, see
www.impactjournals.com/oncotarget
range as those determined at CHO-A2B cells (Figure 5C, Supplementary Table 4).
cAMP assays at HEK-A2A cells transiently transfected with increasing amounts of A2BAR
Next, the effect of the expression of different amounts of A2BARs on A2AAR pharmacology was studied. To this end human embryonic kidney (HEK293T) cells stably expressing the human A2AAR were transfected with
human A2BAR cDNA to transiently express increasing amounts of A2BARs. The A2B-selective agonist BAY60-6583 (100 nM) showed a significant increase in cAMP accumulation with increasing amounts of transiently transfected A2BARs confirming functionality of the A2BAR (Figure 6A). In contrast, when stimulating the cells with the A2A-selective agonist CGS-21680 (100 nM), a significant decrease in cAMP accumulation with increasing amounts of the transiently transfected A2BAR was observed suggesting an inhibition of the A2AAR
Figure 5: cAMP accumulation in recombinant CHO cell lines and in Jurkat-T cells. (A) pEC50 values of AR agonists in
cAMP accumulation assays in CHO-A2A, CHO-A2B and CHO-A2A-A2B cells. The one-way ANOVA with Dunnett’s post-hoc test indicated significant differences. ns: not significant, **p < 0.01, n = 2–4, see also Supplementary Table 4. The A
2AAR agonist CGS-21680 showed
only a negligible signal in CHO-A2A-A2B cells at concentrations of up to 100 µM. (B) pKB values for AR antagonists in cAMP accumulation
assays in CHO-A2A, CHO-A2B and CHO-A2A-A2B cells with agonist stimulation by NECA. The one-way ANOVA with Dunnett’s post-hoc
test showed significant differences. ns: not significant, **p < 0.01, n = 4–6, see also Supplementary Table 4. (C) pEC
50 values of agonists
Figure 6: cAMP determination in cells coexpressing variable proportions of A2A and A2BARs. (A) Stimulation of cAMP
accumulation induced by 100 nM of the A2B-selective partial agonist BAY60-6583 at HEK-A2A cells transiently transfected with increasing
amounts of cDNA for A2BAR (0.25–1.5 µg). The basal cAMP level, i.e. HEK-A2A cells only with medium but without the agonist, was
set at 100%. The one-way ANOVA with Dunnett’s post-hoc test showed significant differences. ns: not significant, **p < 0.01 (n = 2, in
triplicates). (B) Stimulation of cAMP accumulation induced by 100 nM of the A2A-selective agonist CGS-21680 at HEK-A2A cells transiently transfected with increasing amounts of cDNA for A2BAR (0.25–1.5 µg). Basal cAMP, i.e. HEK-A2A cells only with medium but without the
agonist, was set at 100%. The one-way ANOVA with Dunnett’s post-hoc test showed significant differences. ns: not significant, *p < 0.05, **p < 0.01 (n = 2, in triplicates). (C) Stimulation of cAMP accumulation induced by a combination of 100 nM of the A
2A-selective agonist
CGS-21680 and of 100 nM of the A2B-selective partial agonist BAY60-6583 at HEK-A2A cells transiently transfected with with increasing
amounts of cDNA for A2BAR (0.25–1.5 µg). Basal cAMP, i.e. HEK-A2A cells only with medium but without the agonist, was set at 100 %. The one-way ANOVA with Dunnett’s post-hoc test showed significant differences. ns: not significant, **p < 0.01 (n = 2, in triplicates).
www.impactjournals.com/oncotarget
through the A2BAR (Figure 6B). Stimulation of the cells with a combination of both receptor subtype-selective agonists (100 nM each), showed a significant increase in cAMP accumulation with increasing amounts of transiently transfected A2BAR additionally suggesting a dominant role for the A2BAR (Figure 6C).
Dynamic mass redistribution assays
Finally, dynamic mass redistribution (DMR) assays providing a holistic readout were performed in HEK293T cells transiently transfected with different ratios of A2A and
A2BAR cDNA. The A2B-selective agonist BAY60-6583
(100 nM) displayed a time-dependent increase in the signal with increasing amounts of transiently transfected A2BAR
confirming the presence of functional A2BARs (Figure
7A). In contrast, when stimulating the cells with the A2A-selective agonist, CGS21680 (100 nM), a
time-dependent decrease in signal was observed with increasing amounts of transiently transfected A2BAR suggesting an
inhibition of the A2AAR-mediated DMR signal through
the A2BARs (Figure 7B). Stimulation of the cells with
a combination of both, A2A and A2BAR agonist (100
nM each), showed a significant increase in signal with increased amounts of transiently transfected A2BAR,
but not with increased amounts of A2AAR, additionally
suggesting within the heteromer a dominant role for the A2BAR (Figure 7C).
DISCUSSION
Adenosine is an important signaling molecule, and the A2A and A2BAR subtypes are established (A2A) or
potential (A2B) drug targets. Both receptors are Gs
protein-coupled, but the A2BAR requires much higher adenosine
concentrations to be activated than the A2AAR, and its
physiological role remains enigmatic. In the present study we demonstrate that A2BARs physically interact with
A2AARs forming A2A-A2B heteromers. This interaction leads
to new signalling properties as observed in cAMP experiments at Jurkat-T and further native and recombinant cells. Although A1, A2A and A3 homomeric ARs and several
heteromers of A1 and A2AARs had previously been
described [1, 40–41], neither homo- nor heteromers of A2BARs have been unambiguously demonstrated so far. Our
study was motivated (i) by the fact that A2A and A2BARs are
frequently co-expressed; (ii) by the observation that A2AAR
pharmacology appears to be strikingly different than expected in a number of A2A-A2B co-expressing cells and
tissues, (iii) by the still unknown physiological role of the “low-affinity” A2BARs; (iv) by contradictory results on pro-
or anti-inflammatory effects mediated by the A2BAR, and
(v) by the observation that A2A and A2BARs upon activation
– although they are both Gs protein-coupled – often show
opposite effects [25]. A2A-A2B heteromerization had
previously been postulated to be required for high A2BAR
expression, and the C-terminus of the A2AAR has been suggested to play an important role in this respect [42]. However, we could not confirm the published results. In fact, high A2BAR expression is observed in many cancer cells including those which express lower amounts of A2AARs [12–13, 43–45]. Nevertheless, co-immunoprecipitation experiments on A2A-A2B AR-coexpressing HEK293 cells had provided the first indication of a possible existence of A2A-A2B heteromers [42]. In the present study, by applying several complementary techniques, we provide compelling evidence that A2A and A2B form heteromeric di-/oligomers in recombinant as well as in native cells and tissues. FRET experiments confirmed specific interaction between both receptor subtypes (Figure 1A). So far the structure of the heteromers and their interaction surface is still unknown. In the well-characterized A2A-D2 heteromer the long C-terminus of the A2AAR is involved in heteromerization [46]. To gain insight into the A2A-A2B heteromer interface, we removed the C-terminus of the A2AAR and examined the resulting truncated receptor mutant co-expressed with the A2BAR in FRET experiments. The observed FRET signal was comparable to the one obtained for the wt A2A-A2BAR heteromer (Figure 1A, 1B) indicating that the C-terminus is not involved in the formation of A2A-A2B heteromers. Extensive BRET studies, including displacement experiments with untagged receptors, showed high, specific BRET signals for the A2A-A2BAR pair (Figure 2A, 2C). Incubation of cells with various agonists, adenosine (nonselective), NECA (nonselective), CGS-21680 (A2A -selective), BAY60-6583 (A2B-selective), or antagonists (PSB-603, A2B-selective) did not lead to a significant change of the signal (Figure 2D). This means that A2A-A2B heteromer formation is independent of the presence of A2A or A2BAR ligands and stable in the presence of ligands. Furthermore BiFC experiments in which part of the EYFP sequence is attached to the A2A, the other part to the A2BAR, resulted in positive signals. These data convincingly underscore that both receptors are directly interacting, and that an A2A-A2B heterodi- or -oligomer must have been formed (Supplementary Figures 1, 2). A2A-A2B heteromer formation in CHO-A2A-A2B cells was confirmed by yet another technique, proximity ligation assays (PLA), using specific modified primary antibodies. The positive PLA signals obtained in living CHO-A2A-A2B cells, but not in non-transfected CHO cells, indicated close proximity of both receptors in the CHO cell line that coexpress them (Supplementary Figure 3). Thus, all conducted biophysical and biochemical techniques, namely FRET, BRET, BiFC and PLA studies, provided evidence that A2A and A2BARs can form heteromers in living cells. Importantly, the existence of A2A-A2B heteromers in native tissues was confirmed by using the PLA approach (Figure 3, Supplementary Figures 4, 5) thus proving their physiological relevance. Remarkably, heteromers were detected in sections from hippocampus of the rat. Receptor
pharmacology was altered in cells expressing the two receptors and, therefore, also expressing A2A-A2B heteromers, as compared to that in cells expressing only one receptor subtype. This was initially observed in a recombinant system investigating CHO-A2A, CHO-A2B and CHO-A2A-A2B cells, the latter of which had higher A2B than
A2AAR expression as assessed by RT-PCR and Western blot analysis. In cell lines only expressing A2A or A2BARs, radioligand binding studies provided the expected affinities for standard ligands, i.e. high affinity binding of the selective A2AAR ligands CGS-21680 (agonist) and MSX-2 (antagonist), but lacking affinity for the A2B-selective
Figure 7: Label-free assays in cells coexpressing variable proportions of A2A and A2BARs. (A) Time-dependent dynamic mass redistribution (DMR) measurement induced by 100 nM of the A2B-selective partial agonist BAY60-6583 in HEK293T cells transiently
transfected with a constant amount of cDNA for A2AAR and increasing amounts of cDNA for A2BAR, or vice versa, a constant amount of
cDNA for A2BAR and increasing amounts of cDNA for A2AAR. (B) DMR measurement induced by 100 nM of the A2A-selective agonist CGS-21680 in HEK293T cells transiently transfected with a constant amount of cDNA for A2AAR and increasing amounts of cDNA for
A2BAR, or vice versa, a constant amount of cDNA for A2BAR and increasing amounts of cDNA for A2AAR. (C) DMR measurement induced
by a combination of 100 nM of the A2A-selective agonist CGS-21680 and of 100 nM of the A2B-selective partial agonist BAY60-6583 at
HEK293T cells transiently transfected with a constant amount of cDNA for A2AAR and increasing amounts of cDNA for A2BAR, or vice versa, a constant amount of cDNA for A2BAR and increasing amounts of cDNA for A2AAR.
www.impactjournals.com/oncotarget
ligands BAY60-6583 (partial agonist) and PSB-603 (antagonist) at the CHO-A2A cells and vice versa for the CHO-A2B cells (Supplementary Tables 2, 3). At the CHO-A2A-A2B cell line, however, no binding for the A2A-selective radioligands [³H]MSX-2 and [³H]CGS-21680 was detected although we could clearly prove both the presence of A2AAR mRNA and A2AAR protein in this cell line (Supplementary Figures 8A, 8B, 6A, 6B, Supplementary Table 2) and its cell surface localization (Supplementary Figure 3C). The A2A-A2B heteromer behaved almost like an A2BAR by displaying low affinity for adenosine and NECA (Figure 4A, 4B), high affinity for PSB-603 and no significant sign of A2AAR activation. cAMP accumulation assays yielded results in line with the pharmacology obtained in binding studies (Figure 5A–5C, Supplementary Table 4). Moreover in cAMP assays as well as in DMR assays at HEK-A2A cells transiently transfected with increasing amounts of the A2BAR (Figure 6A–6C, Figure 7A–7C) a clear inhibiton of A2AAR function through A2BARs could be demonstrated. This means that the A2AAR signaling appears to be completely blocked in the A2A-A2B heteromer. On a molecular level, this would mean that the A2BAR modulates the conformation of the binding site of the A2AAR in such a way that it either loses its affinity for ligands completely, and only the A2B binding site is available for interaction with ligands, or the A2A binding site in the heteromer switches to A2B-like properties. Both would in principle be possible. In fact, the binding sites for adenosine in A2A and A2BARs are almost identical differing only in a single amino acid (A2A: L249, A2B: V250), and yet their affinity for adenosine is very different. It is therefore likely that the ligand binding site of A2A and A2BARs is readily amenable to allosteric modulation. The discovery of A2AAR action blockade by the A2BAR was very consistent when assayed in heterologous expression systems, in cell lines or in primary cells. Other groups had previously confirmed A2A and A2B mRNA expression in Jurkat-T cells (A2B ≥ A2A) and discovered that the selective A2AAR agonist CGS-21680 was nearly inactive in cAMP assays [47], and also the binding of [³H]CGS-21680 (12.5 nM) to Jurkat-T cell membranes was found to be negligible [48]. These results can now be explained by taking into account our discovery that the A2AAR is non-functional within the A2A -A2B heteromer context present in Jurkat-T cells. Our findings also provide a mechanistic basis to interpret previous results, namely the altered AR pharmacology in cells expressing both A2B and A2AARs with similar or higher levels of A2B (A2B ≥ A2A). In Supplementary Table 5we have collected the appropriate literature data that may now be interpreted in the light of our main finding. For example, in the human bladder carcinoma cell line T24 the expression of A2B and A2A receptors was demonstrated by RT-PCR (A2B > A2A). In cAMP assays NECA and adenosine were able to induce cAMP accumulation whereas the A2A-selective agonist CGS-21680 was inactive [45]. Wei et al. showed expression of all four AR subtypes in three prostate cancer
cell lines by qRT-PCR and Western blot experiments, with domination of the A2BAR (A2B > A2A). NECA and the selective A2BAR agonist BAY60-6583, but not the A2A -selective agonist CGS-21680, concentration-dependently induced cAMP accumulation [13]. Recently, Hajiahmadi
et al. demonstrated expression of all four AR subtypes in
three human ovarian cancer cell lines by qRT-PCR and Western blot, in which, again, the A2BAR was the most abundant one (A2B > A2A), and NECA but not the A2AAR agonist CGS-21680, concentration-dependently induced cAMP accumulation [12]. In contrast, in A2A-A2B -co-expressing cell lines and tissues in which the expression level of A2AARs is higher than that of A2B (A2A > A2B), e.g. in T-lymphocytes from human blood, PC12 cells, or HMC-1 cells, canonical A2A and A2B pharmacology is observed (Supplementary Tables 2, 5) [8, 16, 49–50]. It is likely that A2A-A2BAR heteromers exist in these cells but in a proportion that does not prohibit activation of free A2AARs (that cannot be blocked by A2BARs). Thus, regulation of A2A and A2B expression levels can in turn govern the pharmacological outcome of stimulation with adenosine or synthetic AR agonists. Both Gs-coupled A2AR subtypes play important (patho)physiologic roles and are co-expressed on many cell types and tissues [6, 8, 11, 51]. Up-regulation of A2AAR expression in different tissues can be found under various pathological conditions. For example, lymphocytes from amyotrophic lateral sclerosis (ALS) or multiple sclerosis (MS) patients show increased A2AAR levels [16–17]. NF-kappaB was found to enhance hypoxia-driven T-cell immunosuppression via activation of upregulated A2AARs [52]. In a study on isolated perfused mouse heart investigating the contributions of A2A and A2BARs on cardiac flow, the A2A-selective agonist CGS-21680 and the non-selective agonist NECA increased coronary flow in A2B knockout (KO) mice to a significantly higher degree than in wildtype (WT) mice [51]. The A2A -selective antagonist SCH58261 blocked NECA-induced increase in coronary flow to a higher degree in KO than in WT mice. The authors explained these discrepancies by an observed upregulation of A2AARs (ca. 20% as estimated by Western blot) in mesenteric arterioles of KO as compared to WT mice. However, an additional or alternative explanation could be that by deletion of A2BARs, heteromer formation would no longer be possible leading to a de-blocking of the A2AARs and thus a higher number of free receptors with typical A2A pharmacology. Several studies have led to the proposal that GPCR heteromers may constitute drug targets in their own right and that heteromers can be upregulated in disease [53]. It appears that A2A and A2BARs display very high affinity for each other, and whenever they are co-expressed they would form stable heteromers with a distinct pharmacology. This implies that the A2A-A2B interface and the interactions must be unique to produce such a remarkable and persistent disappearance of A2AAR ligand recognition and signaling through allosteric receptor-receptor modulation.
MATERIALS AND METHODS
Molecular biologyFor FRET experiments the cDNAs of the human A2AAR and the C-terminal truncated mutant A2A1-293R were amplified by PCR using primers that delete the stop codon of the receptors and introduce EcoRI and AgeI restriction enzyme sites. The resulting PCR products were cloned in-frame with EcoRI/AgeI into the vectors pEYFP-N1 and pGFP²-N3, respectively. The cDNA of the human A2BAR was also cloned with EcoRI/AgeI into the vector pGFP²-N3. For a positive control a fusion protein GFP²-EYFP was used. The cDNA of GFP² was amplified by PCR using primers that delete the stop codon of the protein and introduce BamHI and AgeI restriction enzyme sites. The resulting PCR product was cloned in-frame with BamHI/AgeI into pEYFP-N1 plasmid, respectively. The cDNA of the GABABR2-EYFP receptor construct was a gift from Prof. Franco. For BRET experiments the cDNAs of the human A2A and A2BAR were amplified by PCR using primers that delete the stop codon of the receptors and introduce EcoRI and BamHI restriction enzyme sites. The resulting A2A and A2BAR PCR products were cloned in-frame with EcoRI/BamHI into pRluc-N2. The dopamine D2-pRluc-N2 receptor construct was a gift from Prof. Franco. The A2AAR cDNA was cloned in-frame with EcoRI/AgeI into pEYFP-N1, respectively. For BRET experiments Rluc-EYFP was used as a positive control, and Rluc alone and EYFP plasmids alone were employed as negative controls. For the positive control the cDNA of
Rluc was amplified by PCR using primers that delete the
stop codon of the protein and introduce EcoRI and BamHI restriction sites. The resulting PCR product was cloned in-frame with EcoRI/BamHI into pEYFP-N1 plasmid, respectively. For BRET displacement experiments, the cDNA of the human A2BAR was cloned with EcoRI/NotI into the pcDNA3.1(+) plasmid.
Transiently transfected HEK293T cells were prepared by subcloning the cDNAs of the human A2A and A2B AR with HindIII/BamHI into the vector pcDNA3.1(+). All restriction enzymes and supplements for the molecular biology were obtained at NEB (Frankfurt, Germany). DNA and RNA purification kits were obtained at Zymo Research (Freiburg, Germany) or Life Technologies GmbH (Darmstadt, Germany).
Transient transfection of CHO-K1 cells for FRET and BRET experiments
For FRET and BRET experiments CHO-K1 cells were transiently co-transfected with constant amounts of the receptor-donor DNA (e.g. A2B-GFP² or A2B-Rluc) and constant or increasing amounts of receptor-acceptor DNA (e.g. A2A-EYFP) using Lipofectamine 2000 (Thermo Fisher Scientific, Waltham, USA). Moreover
the receptor-donor DNAs and receptor-acceptor DNAs were transfected alone to determine their contribution to the detection channels (spectral signature). The cells were harvested 24 h after transfection and used for FRET, and BRET experiments, respectively.
FRET experiments analyzed by fluorimetry FRET experiments were conducted as previously described [36]. 20 µg of the transfected cells (100 µl) were distributed in duplicates in a black 96-well plate with black bottom for fluorescence measurements. The fluorescence signals were detected by a Mithras LB 940 fluorimeter using a 10-nm bandwidth excitation filter at 405 nm and 500 nm and 10-nm bandwidth and 25-nm bandwidth emission filters corresponding to 510 25-nm and 535 nm (GFP2 exication 405 nm, emission 510 nm;
EYFP exication 500 nm, emission 535 nm). Background fluorescence signals from non-transfected CHO-K1 cells were substracted. For all experiments the gain settings and the read time of 0.1 s were kept identical.
Quantification of FRET signal
Quantification of the FRET signals was performed as described by Elder et al. according to a sensitized emission method [54]. This method requires correction for donor bleed-through (donor fluorophore emission into the acceptor channel) and acceptor cross-excitation (direct excitation of acceptor fluorophores by donor excitation). For that, the contributions of GFP2 and EYFP proteins
alone to the two detection channels were measured in experiments with cells expressing only one of these proteins. The spectral signatures of the different receptors fused to either GFP2 or EYFP did not significantly vary
from the determined spectral signatures of the fluorescent proteins alone. The donor bleed-through correction factor (DER, measured in cells expressing only donor fluorophors) and acceptor cross-excitation factor (AER, measured in cells expressing only acceptor fluorophores) were calculated using the following formula [54]:
DA DA AA DD I I AER DER I I = =
The AER is the ratio of emission into the acceptor channel when using donor excitation relative to when using acceptor excitation. The DER is the ratio of emission into the acceptor channel relative to emission into the donor channel, when using donor excitation [54]. The corrected FRET signal was then calculated according to the following formula [54]:
* *
DA DD AA
cFRET I= −DER I −AER I
Different FRET normalisation equations can be used to determine the efficiency of the FRET signal.
www.impactjournals.com/oncotarget
Here we used the NFRET normalizing method according to Shyu et al., which takes changes in donor and acceptor concentrations into account [55]:
( * )
FRET cFRETDD AA
N
I I
=
FRET signal analyses were done in Excel and results were displayed using GraphPad Prism 4.
Bioluminescence resonance energy transfer (BRET) experiments analyzed by fluorimetry
BRET experiments were conducted as previously described [36]. 20 µg of the transfected cells (100 µl) were distributed in duplicates into a black 96-well plate with black bottom for fluorescence and a white 96-well plate with white bottom for bioluminescence measurements. Signals were detected by a Mithras LB 940 fluorimeter calculating the integration for bioluminescence using filters for 440–500 nm (485 nm maximum emission of bioluminescence), and for fluorescence with a filter for 510–590 nm (530 nm maximum emission of EYFP). To confirm equal expression of Rluc and increasing expression of EYFP, for each sample bioluminescence and fluorescence was measured before starting the experiment. EYFP fluorescence was defined as the fluorescence of the sample minus the fluorescence of cells expressing only Rluc-tagged receptors. For BRET, 5 µM coelenterazine-H (PJK, Kleinblittersdorf, Germany) was added to the samples and measurements were performed after 1 min (net BRET determination) and after 10 min (Rluc luminescence quantification). Net BRET was defined as the bioluminescence of the sample minus the bioluminescence of cells expressing only Rluc-tagged receptors. BRET signals were determined by calculating the ratio of the light emitted by EYFP over the light emitted by the Rluc A. milliBRET unit (mBU) is the BRET ratio × 1000. Curves were fitted using nonlinear regression. Displacement studies were performed in triplicates at a constant BRET ratio, around the BRET50 of the A2BAR-Rluc/A2AAR-YFP pair, and increasing amounts of the A2BAR. For testing the effects of compounds on
heteromerization of A2AAR and A2BAR the agonists
adenosine (100 µM), NECA (100 µM), CGS-21680 (A2AR,
10 µM), BAY60-6583 (A2BR, 10 µM), and the antagonist PSB-603 (A2BR, 500 nM) were added for 60 min to cells which expressed A2BAR-Rluc and A2AAR-YFP, around
the BRET50 value. The final DMSO concentration in these
experiments was 2.5 % and experiments were performed in triplicates.
In situ proximity ligation assay in the rat brain
The experiments were carried out in accordance with the European Directive 2010/63/EU and were
approved by the Bioethical Committee at Karolinska Institutet. Male Sprague-Dawley (derived from the licensed animal breeder Charles River, Sulzfeld, Germany), weighing between 260–310 g at the beginning of the experiment, were used. The animals (n = 5) were housed individually in standard plastic rodent cages (25 cm × 30 cm × 30 cm) in a colony room maintained at 21 ± 1° C and 40–50 % humidity under a 12-hour light-dark cycle (lights on at 6:00 am). Rodent food and water were available ad libitum. All animals used for the in situ PLA neurochemical study were experimentally naive.
To study the distribution of the adenosine A2A
-A2B heteroreceptor complex in the rat brain the in situ proximity ligation assay (in situ PLA) was performed as described previously [56].
Retroviral transfection
CHO cells stably expressing HA-tagged human A2A
or A2BARs, or both human A2A and A2BARs were generated using a retroviral transfection system [5]. HeLa cells stably overexpressing HA-tagged human A2AARs were
also generated using a retroviral transfection system [5]. For generating the A2A-A2B co-expressing cell line, GP+env
AM12 cells were co-transfected with 6.75 µg of the pQCXIP-A2A vector construct and 3.25 µg of VSV-G using Lipofectamine 2000. The supernatant medium containing the modified virus was filtered and transferred into a small flask of 70% confluent CHO-A2B cells. After infection the selection of the CHO-A2A-A2B cells was started after 48 h
by the addition of 10 µg/ml of puromycin. Cell culture
Chinese hamster ovary cells (CHO-K1), GP+ env
AM12 cells and CHO cells stably expressing human A2AARs, HA-tagged human A2AAR or human A2BAR
were cultured as drecribed previously [5, 57]. CHO cells stably co-transfected with human A2AAR and A2BAR were maintained in Dulbecco's Modified Eagle Medium (DMEM-F12) medium supplemented with 10% (v/v) fetal calf serum (FCS), 100 units/ml penicillin, 100 µg/ml streptomycin, 800 µg/ml G418 and 10 µg/ml puromycin at 37° C and 5 % CO2. Human Jurkat-T cells
natively expressing A2A and A2BARs were cultured in RPMI 1640 medium supplemented with 10 % (v/v) fetal calf serum (FCS), 100 units/ml penicillin, 100 µg/ml streptomycin and 2 mM L-glutamine. HeLa cells natively expressing human A2A and A2BARs were cultured in
DMEM supplemented with 10% (v/v) FCS, 100 units/ml penicillin, 100 µg/ml streptomycin. HeLa cells stably overexpressing the human HA-tagged A2AAR were
cultured in the same medium with the addition of 800 µg/ml of G418. HEK293T cells were grown in DMEM supplemented with 2 mM L-glutamine, 5% (v/v) FCS, 100 units/ml penicillin, 100 µg/ml streptomycin, and
minimal essential medium non-essential amino acid solution (1:100) at 37° C in an atmosphere of 5 % CO2. All cell culture media and supplements were obtained from (Darmstadt, Germany), Sigma-Aldrich (Munich, Germany) or Applichem (Darmstadt, Germany).
Membrane preparation
The preparations of CHO and HeLa membranes recombinantly (or natively) expressing human A2A and/or
A2BAR subtypes were performed as previously described
[5]. Membranes from HEK-A2B or A2A cells, which were
used for some of the radioligand competition binding studies, were purchased from Perkin Elmer (Waltham, USA). The preparation of Jurkat-T cell membranes was performed as follows: a Jurkat-T cell suspension was centrifuged in 50 ml falcon tubes at 200 g, 4° C, 5 min. The supernatant was discarded and the cell pellets were quickly frozen at –80° C. The defrosted pellets were then resuspended in ice-cold 25 mM Tris-buffer, 0.32 M sucrose, 1 mM ethylenediaminetetraacetic acid (EDTA), 0.1 mM phenylmethanesulfonylfluoride (PMSF), pH 7.4, and homogenized with an Ultra-Turrax (30 s on ice). The homogenate was centrifuged for 10 min at 1000 g at 4° C. The resulting pellets were discarded and the supernatant was centrifuged for 1 h at 48.000 g at 4° C. Pellets containing the membranes were resuspended in aqua bidest., homogenized with an Ultra-Turrax (30 s on ice) and centrifuged under the same conditions. The supernantant was discarded and the pellets were resuspended in 50 mM Tris-buffer, pH 7.4 and homogenized with a glass Teflon homogenizer on ice. The resuspended and homogenzied pellets were aliquoted and stored at –80° C until use. The protein content of all membrane preparations was determined with the Lowry method [58].
Radioligand binding assays
Radioligand receptor binding experiments at membrane preparation of native (HeLa) and recombinant cells (CHO- or HEK cells recombinantly expressing A2A and/or A2BARs) using the A2B-selective antagonist
radioligand [³H]PSB-603 (spec. activity: 79 Ci/mmol) to detect A2BARs were performed as previously described
[59]. Competition binding experiments at various membrane preparations of native (HeLa, Jurkat-T) and recombinant cells (CHO or HEK cells expressing A2A and/ or A2BARs) using the A2A-selective antagonist radioligand
[3H]MSX-2 (spec. activity: 85 Ci/mmol) to detect A 2AARs
were performed in analogy to described procedures [39]. The assay was performed in a final volume of 400 µl containing 4 µl of test compound dissolved in DMSO, 196 µl buffer (50 mM Tris-HCl, pH 7.4), 100 µl of radioligand solution in the same buffer (1 nM), and 100 µl of membrane preparation (10 to 200 µg protein per vial,
2 U/ml adenosine deaminase (ADA) 20 min incubation at rt). Non-specific binding was determined in the presence of unlabeled MSX-2, or CGS-15943, respectively (10 µM), both giving identical results.
Competition binding experiments at membrane preparations of native cells (HeLa, Jurkat-T cells) or recombinant cells (CHO, HEK or HeLa recombinantly expressing the human A2AAR) using the agonist radioligand [3H]CGS-21680 (spec. activity: 39 Ci/mmol) were
performed in analogy to described procedures [5]. The assay was performed in a final volume of 400 µl containing 4 µl of test compound dissolved in DMSO, 196 µl buffer (50 mM Tris-HCl, 10 mM MgCl2 pH 7.4), 100 µl of
radioligand solution in the same buffer (5 nM), and 100 µl of membrane preparation (10 to 200 µg of protein per vial, 2 U/ml ADA 20 min incubation at rt). Non-specific binding was determined in the presence of NECA (10 or 50 µM, respectively) or CGS-15942 (final concentration 10 µM); all gave identical results. All data were analyzed with GraphPad Prism, Version 4 (GraphPad Inc., La Jolla, CA). Radioligand binding assays at Jurkat-T cell membranes
Competition binding experiments at Jurkat-T cell membrane preparations using the A2B-selective antagonist
radioligand [³H]PSB-603 to detect A2BARs were
performed in a final volume of 1000 µl containing 25 µl of test compound dissolved in DMSO/50 mM Tris-buffer pH 7.4 (1:1), 375 µl of assay buffer (50 mM Tris-HCl, pH 7.4), 100 µl of radioligand solution in the same buffer (final concentration 0.3 nM), and 500 µl of membrane suspension (100–200 µg protein per vial, 2 U/ml 20 min incubation at rt). Non-specific binding was determined in the presence of unlabeled PSB-603 (10 nM) or DPCPX (10 µM); both gave similar results. After an incubation time of 60 min at rt, the assay mixture was filtered through GF/B glass fiber filters. Washing buffer: 50 mM Tris-HCl buffer, 0.1% bovine serum albumin (BSA), pH 7.4.
cAMP assays
The determination of cAMP accumulation in recombinant CHO and in Jurkat-T cells was performed as previously described [5, 60]. KB-values for the A2A -specific antagonist MSX-2, the A2B-specific antagonist
PSB-603 and the non-selective antagonist caffeine were determined versus the full agonist NECA. KB-values were
calculated using the child equation [61].
Transient transfection of HEK293T cells for cAMP assays
HEK293T cells were transiently transfected with the corresponding cDNA (pcDNA3.1+-hA2B,
pcDNA3.1+-www.impactjournals.com/oncotarget
hA2A) by the polyethylenimine (Sigma) method [62]. The determination of AR-induced cAMP accumulation in HEK293T cells transiently expressing A2A and A2BARs was performed as previously described [62].
Dynamic mass redistribution assays
Dynamic mass redistribution (DMR) at HEK293T cells transfected with A2A and A2BARs was determined
as described previously [62]. In brief, 24 h before the assay, cells were seeded at a density of 7,500 cells per well in 384-well sensor microplates with 40 µl of growth medium and cultured for 24 h (37° C, 5 % CO2) to obtain
70–80% confluent monolayers. Prior to the assay, cells were washed twice with assay buffer (Hank’s balanced salt solution; HBSS with 20 mM HEPES, pH 7.15) and incubated for 2 h in 40 µl per well of assay buffer in the DMR reader at 24° C. Hereafter, the sensor plate was scanned and a baseline optical signature was recorded before adding 10 µl of test compound dissolved in assay buffer containing 0.1% DMSO and DMR responses were monitored for at least 8,000 s using an EnSpire®
Multimode Plate Reader (PerkinElmer, Waltham, MA, USA) by a label-free technology. Data were analyzed using EnSpire Workstation Software v 4.10.
Abbreviations
ADA: adenosine deaminase; AR: adenosine receptor(s); BAY60-6583: 2-({6-amino-3,5-dicyano-4-[4-(cyclopropylmethoxy)phenyl]pyridin-2-yl}sulfanylacetamide; BiFC: bimolecular fluorescence complementation; BRET: bioluminescence resonance energy transfer; BSA: bovine serum albumin; cDNA: complementary deoxyribonucleic acid; CGS-21680: (2-p-[2-carboxyethyl]phenethylamino)-5´-N-ethylcarboxamidoadenosine; CHO: Chinese hamster ovary; DAPI: 4′,6-diamidin-2-phenylindole; DEPC: diethylpyrocarbonate; DMEM: Dulbecco’s Modified Eagle Medium; DMSO: dimethylsulfoxide; DPCPX: 8-cyclopentyl-1,3-dipropylxanthine; DMR: dynamic mass redistribution; EDTA: ethylenediamine tetraacetic acid; EGTA: ethyleneglycoltetraacetic acid; EYFP: enhanced yellow fluorescent protein; FCS: fetal calf serum; FRET: Förster resonance energy transfer; GFP2: green fluorescent protein
variant 2; GPCR: G protein-coupled receptor; G418: geneticin; HA: human influenza hemagglutinin tag; h: human; HBSS: Hank’s balanced salt solution; KO: knock-out; KRH: Krebs-Ringer-Hepes; mRNA: messenger ribonucleic acid; MSX-2: 3-(3-hydroxypropyl)-7-methyl-8-(m-methoxystyryl)-1-propargylxanthine; NECA: 5′-N-ethylcarboxamidoadenosine; PBS: phosphate buffered saline; PEI: polyethylenemine; PMSF: phenylmethanesulfonyl fluoride; PVDF: polyvinylidene fluoride; PSB-603: 8-(4-(4-(4-chlorophenyl)-piperazine-1-sulfonyl)phenyl)-1-propylxanthine; Rluc: Renilla Luciferase; RNA: ribonucleic acid; Ro 20-1724: 4-(3-butoxy-4-methoxyphenyl)methyl-2-imidazolidone; RPMI: Roswell
Park Memorial Institute; rt: room temperature; RT-PCR: reverse transcriptase-polymerase chain reaction; TBS: Tris buffered saline; Tris: Tris(hydroxymethyl)aminomethan.
Author contributions
SH designed, performed and analyzed FRET and BiFC experiments, cloned some of the receptor constructs for BRET experiments, prepared the stably transfected CHO-A2B, CHO-A2A-A2B cell lines and characterized them
and performed the majority of radioligand binding and cAMP assays. GN designed, performed and interpreted the DMR studies and cAMP experiments at HEK-A2A cells.
DBE designed, performed and analyzed PLA experiments at rat brains; YCA established and performed PLA experiments at CHO-A2A-A2B cells, performed Western
blots at CHO-A2A-A2B and Jurkat-T cell membranes and
analyzed results. BFS and BC designed, performed and analyzed BRET experiments. AD, EdF and MR prepared some of the stably transfected cell lines, characterized them and performed and analyzed cAMP experiments. SKL performed radioligand binding studies at human T-lymphocytes and analyzed the results. ACS designed PLA experiments at the CHO-A2A-A2B cell line and supervised some of the molecular biology studies. CEM, SH and RF wrote the manuscript; GN, DBE and KF contributed to writing the manuscript. RF designed and supervised some of the FRET, BRET and DMR studies. CEM designed and supervised the complete study.
ACKNOWLEDGMENTS
We thank Prof. Dr. Tom Kerppola for providing the Jun and Fos cDNA constructs. Angelika Fischer and Anika Püsche are acknowledged for expert technical assistance. We thank Magdalena Navarro Sala for performing some BRET and FRET experiments and Anna Werning for the cloning of some of the receptor constructs. Barbora Červinková is grateful to the European Commission for support within the Erasmus program.
CONFLICTS OF INTEREST
The authors declare no competing or financial interest.
REFERENCES
1. Fredholm BB, IJzerman AP, Jacobson KA, Linden J, Müller CE. International Union of Basic and Clinical Pharmacology. LXXXI. Nomenclature and classification of adenosine receptors-an update. Pharmacol Rev. 2011; 63:1–34.
2. Abbracchio MP, Brambilla R, Ceruti S, Kim HO, von Lubitz DK, Jacobson KA, Cattabeni F. G protein-dependent