Lessons Learned from tbe Result Comparison of Calculations of a
Reference Severe Accident Sequence on a TMI-2 Like PWR Reactor of
900 MWe witb tbe Integrai Codes ASTEC and MELCOR
Descrittori
Tipologia del documento: Rapporto Tecnico
Collocazione contrattuale: Accordo di programma ENEA-MSE: Piano Annuale di
Realizzazione 2013, Linea Progettuale 1,Obiettivo A: Acquisizione, Sviluppo e Validazione di Codici eMetodi per Studi ed Analisi di Sicurezza e Sostenibilità, Task A3.3
Argomenti trattati: Sicurezza Nucleare
Sommario
This report presents the activity performed in the frame of LP 1, Objective A (Acquisition, development and validation of methods and codes for sustainable and safety studies and analyses), Task A3.3 ofPAR2013, ADP ENEA-MSE. In this study the integral codes ASTEC and MELCOR have been applied for the calculation of a reference severe accident sequence (SBLOCA) on the TMI-2 plant (PWR of 900 MWe). Several insights on the reliability and consistency of code response have been gained from a detailed comparison of the main code results. The reasons of the differences m code results have been thoroughly investigated and tentatively explained. Recommendations have been made for sensitivity studies on important and uncertain core degradation parameters and model options, in order to better understand the different code behavior and make proposals for further code model improvements.
Note:
This document has been prepared by the following main contributors: - G. Bandini (ENEA)
- M. Di Giuli, M. Surnini (CIRTEN - Università di Bologna) (I) - A. Manfredini, W. Ambrosini (CIRTEN -Università di Pisa) (2)
e)
Ref. doc. CERSE-UNIBO RL 1556/2014;e)
Ref. doc. CERSE-UNIPI RL 153J!2014FIRMA
CONVALIDA APPROVAZIONE NOME 2 FIRMA NOME 1 FIRMA
o
EMISSIONE 17/09/14 f---_N_OM_E_--k-.---G_B_an_._d_i_m+-+-,F'!pVJ+~)_e_R."...o.."s>-a-.•e_R--,0+----:iF~r;Js1".,--;...Da---l~
l "
'
-
~-
r-rf;{/jdt,;/~
t~0~
REDAZIONEDESCRIZIONE
List of Contents
1. Introduction ………..….... 4
2. Accident scenario and plant data ……….…..….… 5
2.1 Accident scenario ………..……...….. 5
2.2 Boundary conditions ………..….… 5
2.2.1 Power ……….…. 5
2.2.2 Steam generator pressure and level control ………... 7
2.2.3 Hot leg break ………. 9
2.2.4 Letdown/make-up flow and ECCS injections ………..… 9
2.2.5 Threshold set-point values ………..… 9
2.3 TMI-2 plant data ………...… 9
2.3.1 Free volumes ………..…... 9
2.3.2 Heat transfer with secondary side ………,..………. 10
2.3.3 Intact core geometry ………,…...…. 10
2.3.4 Vessel and internal structures ………,..…… 10
2.3.5 Vent valve operation ………,…...…… 10
2.4 Initial TMI-2 plant conditions ……….…..….. 11
2.4.1 Nominal TMI-2 steady-state ………,………….. 11
2.4.2 Primary coolant mass inventory ………,…...…... 11
3. SBLOCA accident calculation with MELCOR ……….… 13
3.1 Brief description of the MELCOR code ……….….... 13
3.2 Standard physical parameters of the code ………..… 14
3.3 Initial TMI-2 plant conditions ………...….. 15
3.3.1 Nominal TMI-2 steady-state ………...……… 15
3.3.2 TMI-2 plant model ……… 16
3.3.3 Primary mass inventory ………..…..….. 18
3.4 Parameters and results ……….….…...19
3.5 Synthetic view of the core at selected instants ……… 31
3.5.1 Core void fraction ……… 32
3.5.2 Cladding temperature maps ……….……….. 33
3.5.3 Linear mass of materials at different instants ……… 34
3.6 Final remarks ………..… 38
4. SBLOCA accident calculation with ASTEC ……….……….…… 40
4.1 Brief description of the ASTEC code ……….……….….….. 40
4.2 TMI-2 ASTEC modeling …….……….….…. 41
4.2.1 DEBRIS and NO DEBRIS models………..… 43
4.3 Primary mass inventory ……….…. 44
4.4 Steady-state calculation ……….…. 45
4.5 Parameters and results ……….……….….. 46
4.6 Summary and conclusions ……….…. 59
5. Comparison of MELCOR and ASTEC results ……….…. 62
5.1 TMI-2 steady-state conditions at nominal power ………..…. 62
5.2 In-vessel core degradation parameters and modelling options ………..…. 63
5.3 Chronology of main events ……….….... 65
5.4 Evolution of main parameters ……….…… 66
1.
Introduction
Since the Three Mile Island Unit 2 (TMI-2) reactor accident in 1979, there have been extensive research activities to try to understand the phenomena involved, and to develop accident management strategies to mitigate the consequences of core melt accidents. Given that a severe accident cannot be simulated at or near full scale, since all the experimental database on core heat up, melt progression and fission product release is limited to the results of small-scale experiments, which are only partially representative of what could occur in a real reactor. Therefore, integral codes are used to describe core degradation transients in nuclear reactors without a clear idea of their predictive capabilities. This is the reason why TMI-2 provides a unique opportunity to assess the capability of integral codes to simulate a severe accident in a full scale Pressurizer Water Reactor (PWR).
The TMI-2 reactor modeling used in computer codes for severe accidents as MELCOR, ASTEC, MAAP 4 and ATHLET-CD has improved significantly over the years due to better understanding, and the simulation results confirm these continuous improvements. In the frame of Task 3.3 of PAR2013 - LP1, the CIRTEN activity, in collaboration with ENEA, is devoted to verify the progress and reliability of ASTEC and MELCOR codes through the result comparison for a representative severe accident sequence in a pressurized nuclear power plant of 900 MWe.
Starting from the same reactor model realized to simulate the real TMI-2 accident, it was decided to analyze an alternative severe accident scenario such as a Small Break Loss-Of-Coolant Accident (SBLOCA) with simultaneous loss of main feedwater to the steam generators, and without safety injection. The evolution of the accident has been studied until molten core slumping into the lower plenum and possible lower head vessel failure. The entire transient was analyzed by means of the integral ASTEC and MELCOR codes widely used worldwide for severe accident analysis in light water reactors. In the present study, the results of the two calculations have been compared and the differences pointed out and deeply investigated, in order to understand and try to explain the reason for the main discrepancies, and thus identify eventual code weaknesses and areas where further code model improvements is deemed necessary.
In Section 2 of this report, the reference specifications for both code calculations are defined regarding: the SBLOCA accident scenario, the boundary conditions, the TMI-2 plant data and the steady-state conditions of the TMI-2 plant at transient initiation, with the aim to best harmonize the two code input decks. In Section 3, the results of the MELCOR calculation performed by the University of Pisa are presented in details, along with a short description of the code models used in the analysis to best represent the in-vessel core degradation phase. Similarly, in Section 4, the results of the ASTEC calculations performed by the University of Bologna and the code models used are presented in detail using two different modeling options for the core late degradation phase. In Section 5, the main code results are compared and the main differences tentatively explained. Finally, main conclusions are drawn and recommendations for further activity in this area are made in Sec. 6.
2.
Accident scenario and plant data
2.1 Accident scenario
The initial event is a small break (size = 0.0015 m2) in the hot leg A at t = 0 s, with simultaneous loss of main feedwater on the secondary side of steam generators (SGs). The primary pressure begins to reduce along with the pressurizer level as soon as the break opens. After few seconds, the fast SG dryout with consequent loss of heat removal from the primary side results in sudden primary pressure increase. The opening of the pressurizer PORV is not enough to limit the pressure rise and, therefore, reactor scram occurs when the pressurizer pressure set-point of 16.3 MPa is reached. The further primary pressure increase after reactor scram might be attenuated by the pressurizer safety valve operation (valve pressure set-point at 17.0 MPa).
The auxiliary feedwater starts at t = 100 s trying to restore 1 m water level in the SG secondary side. The primary pump stop occurs when the whole primary water mass (liquid + steam) inventory reduces below 85000 kg.
Then the accidental transient is let free to evolve towards core uncovery and heatup, core melting and corium relocation in the lower plenum, until possible lower head vessel failure. No HPI or LPI injections are actuated during the transient phase. The transient calculation should be pursued until vessel failure using code model options and parameter values recommended by code Best Practice Guidelines.
2.2 Boundary conditions
The SBLOCA scenario is specified with very simple and well defined boundary conditions, in order to minimize the influence of uncertainty of these conditions on the variability of code results.
2.2.1 Power
• Initial core power = 2772 MW.
• Thermal heat losses from primary system to containment atmosphere are not taken into account.
Table 2.1: Core power evolution
Time (s) Power (W)
0 2772.00e6
ts (scram time) 2772.00e6
ts + 1 167.94e6 ts + 4 147.96e6 ts + 10 130.14e6 ts + 40 103.14e6 ts + 100 86.13e6 ts + 400 65.34e6 ts + 800 52.92e6 ts + 1000 49.95e6 ts + 2000 42.39e6 ts + 4000 34.56e6 ts + 8000 28.35e6 ts + 10000 26.05e6 ts + 20000 21.46e6
• Radial core power profile (6 rings) is given in Table 2.2 below (according to the radial discretization and number of fuel rods defined in the ASTEC simulation by ENEA in ATMI Benchmark [1]).
Table 2.2: Radial profile of core power
Ring Factor Number of fuel rods External radius (m)
1 1.2572 1040 0.27 2 1.2127 3120 0.54 3 1.1469 5200 0.81 4 1.0596 7072 1.08 5 0.951 9152 1.35 6 0.8198 11232 1.665
• Axial profile of core power is given in Table 2.3 below (same axial power profile in different rings).
Table 2.3: Axial profile of core power Z (m) Factor 0 0 0.15 0 0.302 0.675 0.607 0.857 0.912 1.037 1.217 1.153 1.522 1.202 1.826 1.231 2.131 1.241 2.436 1.209 2.893 1.102 3.503 0.595 3.81 0 4 0
The radial and axial profiles in Table 2.2 and Table 2.3 are valid for intact core geometry. The change in power distribution following core degradation and fuel relocation must be taken into account by the respective code models.
2.2.2 Steam generator pressure and level control
Boundary conditions for the SG secondary side are given by controlling the steam generator pressure and water level (in the riser) as follows:
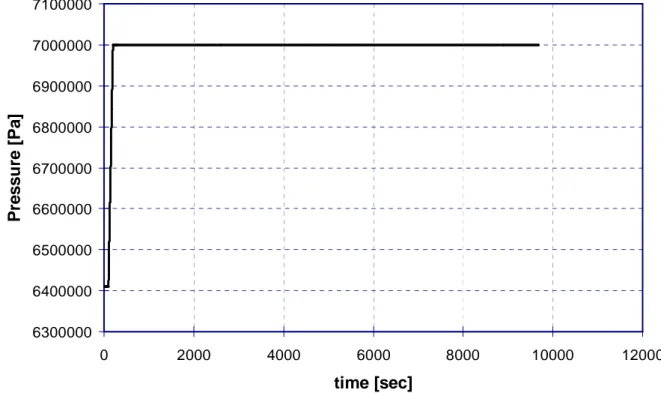
• SG pressure at steady-state value in the first 100 s (P = 6.41 MPa), then pressure rise up to 7.0 MPa in 100 s and constant value until the end of the transient, as shown in Figure 2.1.
• SG level reduces quickly down to 0 due to heat transfer from primary side (timing of SG dryout is calculated by the code), then linear increase from t = 100 s, by startup of auxiliary feedwater, reaching the 1 m value at 200 s, and then constant until the end of the transient, as shown in Figure 2.2, by auxiliary feedwater flow rate control.
Regarding the feedwater control, we assume:
• Maximum feedwater flow rate = 50 kg/s per SG.
• Feedwater temperature = 295.15 K.
The linear increase of SG level up to 1 m, starting at 100 s by auxiliary feedwater injection, might be delayed because of strong evaporation inside the SG and due to the limit on maximum feedwater flow rate.
Also based on the experience of the ATMI Benchmark, it seems important to note that the SG pressure and level might deviate from the boundary values, when SG power removal reduces down close to 0, due to stop of natural circulation in the primary loops, after the initial boil-off phase. By this time, steam condensation in the secondary side of SG leads to slow progressive decrease of the SG pressure below 7.0 MPa and, at the same time, leads to slow progressive increase of the SG level above 1 m. In any case, and in particular in this situation, the pressure cannot be controlled by steam ingress into the SG dome, so as the level cannot be controlled by water draining from the SG bottom.
Figure 2.1: SG pressure control
Figure 2.2: SG level control 62 64 66 68 70 72 0 100 200 300 400 500 600 700 800 900 1000 Time (s) P re s s u re ( b a r) SG pressure 0.0 0.2 0.4 0.6 0.8 1.0 1.2 0 100 200 300 400 500 600 700 800 900 1000 Time (s) L e v e l (m ) SG level
2.2.3 Hot leg break
• Break size = 0.0015 m2
• Break position = 4 m along the hot leg of loop A, from vessel outlet nozzle
• Containment pressure = 0.1 MPa (pressurization of the containment atmosphere is not taken into account)
• No stratification in the hot leg during the boil-off phase before primary pump stop, which may significantly affect the break mass flow rate value.
2.2.4 Letdown/make-up flow and ECCS injections
• Letdown flow rate = 0
• Make-up flow rate = constant value of 2 kg/s during the all transient in cold leg 2B (water temperature = 315.15 K)
• No HPI injection
• No LPI injection
2.2.5 Threshold set-point values
• Pressurizer PORV opening Pressurizer pressure > 15.56 MPa
• Pressurizer PORV closure Pressurizer pressure < 14.96 MPa
• Reactor scram Pressurizer pressure > 16.30 MPa
• Pressurizer safety valve set-point 17.0 MPa (valve capacity = 86.9 kg/s)
• Primary pump stop Primary mass (liquid + steam) < 85000 kg 2.3 TMI-2 plant data
General plant geometry is defined according to the Final Report of the OECD/ATMI Benchmark [1]. Plant data concerning free volumes of the primary system have been updated according to the Final Specifications of MSLB Benchmark Report [2]. Other details on the overall TMI-2 plant layout can be found in Ref. [2] if needed.
The radial and axial core discretization is let free to the code user, but the power distribution in the core must be consistent with the radial and axial power profiles given in Section 2.2.1.
2.3.1 Free volumes
• Primary system volume without the pressurizer = 288.29 m3
• Pressurizer volume = 42.5 m3
• Reactor pressure volume = 113.6 m3
2.3.2 Heat transfer with secondary side
• SG tubes surface per SG (secondary side) = 12302.5 m2
• Number of tubes per SG = 15530 2.3.3 Intact Core Geometry
Main characteristics of the core
• Number of fuel bundles of type 15x15 = 177
• Active core length = 3.66 m
• Total core length = 4.0 m (from core bottom: 0.15 m + 3.66 m (active length) + 0.19 m)
• Type of fuel lattice = square, pitch = 0.01443 m
• Number of fuel rods per assembly = 208
• External diameter of fuel rod = 0.0109 m
• Fuel pellet radius = 0.0047 m
• Fuel rod cladding thickness = 0.000673 m
Initial core material inventory
• UO2 mass = 93650 kg (over the 3.66 m of core active length)
• Zircaloy mass = 23050 kg
• H2 total mass if converted from total zircaloy = 1011 kg (Zircaloy mass / 22.8)
• AIC mass (Ag + In + Cd) = 2750 kg 2.3.4 Vessel and internal structures
• Core baffle internal diameter = 3.28 m
• Core baffle external diameter = 3.33 m
• Core barrel internal diameter = 3.584 m
• Core barrel external diameter = 3.683 m
• Thermal shield internal diameter = 3.683 m
• Thermal shield external diameter = 3.753 m
• Vessel wall internal diameter = 4.36 m
• Vessel wall external diameter = 4.86 m 2.3.5 Vent valve operation
These valves, between the upper plenum and the top of the downcomer, are designed to avoid a direct loss of water by the hot leg. They should be modeled, as they were shown to have an influence on the transient. Simplified simulation of these valves is defined as follows:
• If ∆P > 1724 Pa, the valves are fully open, which corresponds to a total section of 0.794 m2.
• If 414 Pa < ∆P < 1724 Pa, the valves are considered partly open, with a cross section area increasing linearly with ∆P.
2.4. Initial TMI-2 plant conditions
2.4.1 Nominal TMI-2 steady-state
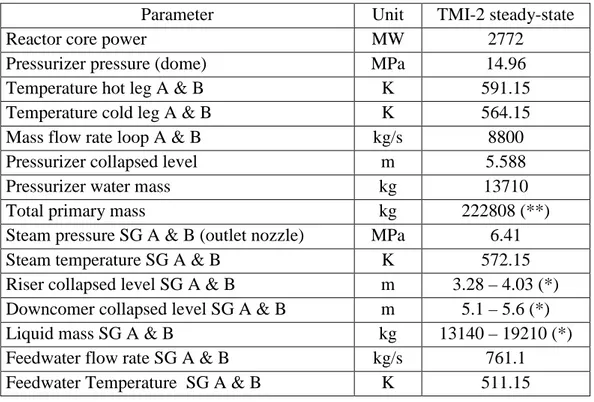
The nominal steady-state of the TMI-2 plant is the one defined in the “Pressurizer Water Reactor Main Steam Line Break (MSLB) Benchmark” Final Specifications [2]. The nominal values of the main TMI-2 plant parameters for both primary and secondary systems are listed in Table 2.4.
Table 2.4: Nominal TMI-2 steady-state conditions at transient initiation
Parameter Unit TMI-2 steady-state
Reactor core power MW 2772
Pressurizer pressure (dome) MPa 14.96
Temperature hot leg A & B K 591.15
Temperature cold leg A & B K 564.15
Mass flow rate loop A & B kg/s 8800
Pressurizer collapsed level m 5.588
Pressurizer water mass kg 13710
Total primary mass kg 222808 (**)
Steam pressure SG A & B (outlet nozzle) MPa 6.41
Steam temperature SG A & B K 572.15
Riser collapsed level SG A & B m 3.28 – 4.03 (*)
Downcomer collapsed level SG A & B m 5.1 – 5.6 (*)
Liquid mass SG A & B kg 13140 – 19210 (*)
Feedwater flow rate SG A & B kg/s 761.1
Feedwater Temperature SG A & B K 511.15
(*) Range of values used by participants in the ATMI Benchmark (**) According to primary volumes in Table 2.5
2.4.2 Primary coolant mass inventory
The coolant mass inventory in the primary system has been evaluated according to the primary component volumes defined in Ref. [2]. The calculation of the primary mass inventory is illustrated in Table 2.5 below.
Table 2.5: Coolant mass inventory in the primary system Component Vol. (m3) N° Tot. vol. (m3) Temp. (K) Density (kg/m3) Mass (kg)
Pressurizer water volume 22.7 1 22.7 615.1 604.0 13710
Pressurizer steam volume 19.8 1 19.8 615.1 96.1 1903
Surge line 0.566 1 0.566 603.15 (*) 649.3 368
Cold leg (each) 6.73 4 26.92 564.15 744.1 20030
Reactor coolant pump (each) 1.59 4 6.36 564.25 744.1 4732
Hot leg (each) 13.3 2 26.6 591.15 684.6 18209
Reactor vessel water volume:
- Lower plenum = 8.27 m3 - Core = 20.4 m3 - Downcomer = 34.69 m3 - Upper plenum = 21.97 m3 - Upper head = 14.4 m3 113.6 1 113.6 575.22 (*) 721.8 81992
SG primary side volume (each):
- Upper plenum = 7.96 m3 - Lower plenum = 7.84 m3
57.12 2 114.24 577.65 (*) 716.5 81858
Total 330.79 222808
Total without pressurizer 288.29 207189
(*) Estimated average temperature values
References
1. F. Fichot, O. Marchand, G. Bandini, H. Austregesilo, M. Buck, M. Barnak, P. Matejovic, L. Humphries, K. Suh, S. Paci, “Ability of Current Advanced Codes to Predict Core Degradation, Melt Progression and Reflooding - Benchmark Exercise on an Alternative TMI-2 Accident Scenario”, NEA/CSNI/R(2009)3, July 2009.
2. K.N. Ivanov, T. M. Beam, A. J. Baratta, “Pressurised Water Reactor Main Steam Line Break (MSLB) Benchmark”, Volume 1: Final Specifications, NEA/NSC/DOC(99)8, April 1999.
3.
SBLOCA accident calculation with MELCOR
3.1 Brief description of the MELCOR code
MELCOR is a fully integrated, engineering-level computer code able to model the progression of severe accidents in LWR nuclear power plants [1]. It is being developed at SNL for the U.S.N.R.C. as a second generation plant risk assessment tool and the successor to the Source Term Code Package. The spectrum of severe accident phenomena, including reactor coolant system and containment thermal-hydraulic response, core heat-up, degradation and relocation, and fission product release and transport, is treated in MELCOR in a unified framework for both BWR and PWR reactors. MELCOR has especially been designed to facilitate sensitivity and uncertainty analyses. The code has been under development since 1982 and the latest version is the 2.1, released in 2008.
Thermal-hydraulic behavior is modeled in MELCOR in terms of control volumes and flow paths. All hydrodynamic material (and its energy) resides in control volumes. Hydrodynamic material includes the coolant and non-condensable gases. These materials are assumed to separate under the influence of gravity within a control volume to form a pool beneath and an atmosphere above. Each control volume is characterized by a single pressure and two temperatures, one temperature for the pool and one for the atmosphere. The control volumes are connected by flow paths through which materials may move without residence time, driven by a momentum equation. Based on the elevations of the pool surfaces in the connected control volumes relative to the junctions with the flow paths, both pool and atmosphere may pass through each flow path. Appropriate hydrostatic head terms are included in the momentum equation for the flow paths, allowing calculation of natural circulation.
The MELCOR COR-package calculates the thermal response of the core and lower plenum structures, including the portion of the lower head directly beneath the core. In addition, the relocation of core materials during melting, slumping, and debris formation are modeled. Fuel pellets, cladding, grid spacers, canister walls, other core structures (e.g. control rods), and particulate debris are modeled separately with individual cells. Cells are the basic nodalization units in the COR-package. All important heat transfer processes are modeled in each COR cell. Thermal radiation within a cell and between different cells in both axial and radial direction is accounted for, as well as radiation to boundary structures. Radiation to a liquid pool and to steam is also included. Radial conduction across the fuel cladding gap and axial conduction between cells is modeled. Convection to the control volume fluids is simulated for a wide range of fluid conditions and structure surface temperatures, including nucleate and film boiling. Oxidation of zircaloy and steel is modeled for both the limiting cases of solid state diffusion of oxygen through the oxide layer and gaseous diffusion of steam or oxygen through the mixture. The core degradation model treats eutectic reactions, dissolution reactions, candling of molten core materials and the formation and relocation of particulate debris.
MELCOR calculates both the release and transport behavior of fission products and control rod materials. It tracks the masses of these materials by grouping them into classes. Each material class represents a group of one or more elements or compounds with similar physical properties. Each class has its own set of values of parameters, such as release coefficients and vapor pressure. Aerosols and vapors can deposit directly on surfaces such as heat structures and water pools. In addition, aerosols can agglomerate and settle.
3.2 Standard physical parameters of the code
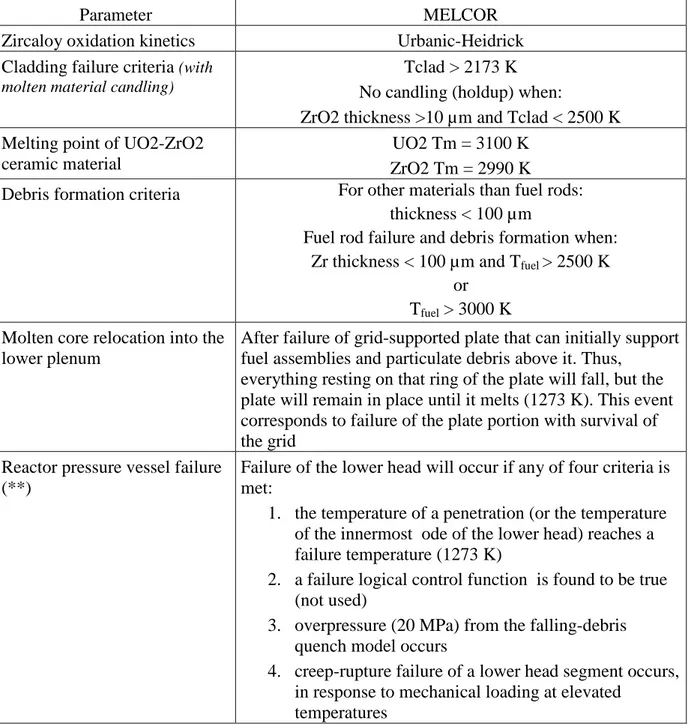
Main core degradation physical parameters used in the standard calculation with MELCOR are summarized in the Table 3.1. The physical parameters used in the standard calculation are the MELCOR default recommended values [2].
For Zircaloy oxidation, the solid-state diffusion of oxygen through an oxide layer to unoxidized metal is represented by a parabolic rate equation, whose rate constant is evaluate using the Urbanic-Heidrick correlation. For very low oxidant concentrations, gaseous diffusion may limit the reaction rate, and a mass transfer coefficient is calculated via a heat-mass transfer analogy from the heat transfer correlations.
Candling, that is the downward flow of molten core materials and the subsequent refreezing of these materials as they transfer latent heat to cooler structures below, is addressed with a semi-mechanistic model, based on fundamental thermal/hydraulic principles. Relocation of core materials may result in a reduction of area and increase of flow resistance, or even total blockage of flow, within various parts of the core. A model is also implemented for an oxide shell to hold up molten material until the shell is breached. Molten material is held up within a component if the oxide thickness is greater than a critical value hold, if the component temperature is less than a critical value, and if no candling from the component in that cell has yet taken place.
MELCOR contains several simple models that consider the structural integrity and support of intact components, and convert them to particulate debris when either is lost. Most are logical models rather than structural models; no stress calculations are performed for any component other than supporting structure. All components other than fuel rods are immediately converted to particulate debris whenever the unoxidized metal thickness is reduced below a user defined minimum value. The thickness criterion is also used for cladding, which is assumed to support fuel pellets, but other criteria are also considered for fuel rods. Oxidized rods are assumed to retain their identity until the cladding reaches 2500 K, and to collapse unconditionally if the fuel temperature reaches 3100 K (the approximate melting temperature of UO2).
Table 3.1: Main assumptions on main degradation models for the reference calculation
Parameter MELCOR
Zircaloy oxidation kinetics Urbanic-Heidrick
Cladding failure criteria (with molten material candling)
Tclad > 2173 K No candling (holdup) when:
ZrO2 thickness >10 µm and Tclad < 2500 K Melting point of UO2-ZrO2
ceramic material
UO2 Tm = 3100 K ZrO2 Tm = 2990 K
Debris formation criteria For other materials than fuel rods:
thickness < 100 µm
Fuel rod failure and debris formation when: Zr thickness < 100 µm and Tfuel > 2500 K
or Tfuel > 3000 K
Molten core relocation into the lower plenum
After failure of grid-supported plate that can initially support fuel assemblies and particulate debris above it. Thus,
everything resting on that ring of the plate will fall, but the plate will remain in place until it melts (1273 K). This event corresponds to failure of the plate portion with survival of the grid
Reactor pressure vessel failure (**)
Failure of the lower head will occur if any of four criteria is met:
1. the temperature of a penetration (or the temperature of the innermost ode of the lower head) reaches a failure temperature (1273 K)
2. a failure logical control function is found to be true (not used)
3. overpressure (20 MPa) from the falling-debris quench model occurs
4. creep-rupture failure of a lower head segment occurs, in response to mechanical loading at elevated
temperatures
3.3 Initial TMI-2 plant conditions
3.3.1 Nominal TMI-2 steady-state
The nominal steady-state of the TMI-2 plant is the one defined in the “Pressurizer Water Reactor Main Steam Line Break (MSLB) Benchmark” Final Specifications. The nominal values of the main TMI-2 plant parameters for both primary and secondary systems are listed in Table 3.2. The TMI-2 initial conditions are obtained by a steady-state code run lasting 2000 s and starting from plant thermal-hydraulic parameter values close to the ones
specified for TMI-2. During the steady-state calculation, some regulations in the primary and secondary sides are activated to facilitate the achievement of stable conditions.
The regulated parameters are:
• the pressurizer pressure by turning on the heaters when the pressure is lower than the nominal value;
• the pressurizer liquid mass, by water injection or draining, in order to obtain the precise liquid level;
The TMI-2 plant initial conditions calculated by the MELCOR code are compared with TMI-2 accident data at turbine trip in the Table 3.2 below. The primary circuit conditions are very well reproduced by the code, the larger mismatch being the mass core flow rate which resulted about 3% lower with respect to reference plant parameters.
Table 3.2: Nominal TMI-2 steady-state conditions at transient initiation
Parameter Unit TMI-2 steady-state MELCOR
Reactor core power MW 2772 2772
Pressurizer pressure (dome) MPa 14.96 14.95
Temperature hot leg A & B K 591.15 589.9
Temperature cold leg A & B K 564.15 561.8
Mass flow rate loop A & B kg/s 8800 8863
Pressurizer collapsed level m 5.588 5.56
Pressurizer water mass kg 13710 14347
Total primary mass kg 222808 220489
Steam pressure SG A & B (outlet nozzle) MPa 6.41 6.41
Steam temperature SG A & B K 572.15 570.0
Riser collapsed level SG A & B m 3.28 – 4.03 6.12
Downcomer collapsed level SG A & B m 5.1 – 5.6 7.79
Liquid mass SG A & B kg 13140 – 19210 25957
Feedwater flow rate SG A & B kg/s 761.1 761.1
Feedwater Temperature SG A & B K 511.15 511.15
3.3.2 TMI-2 plant model
The same nodalization used to simulate the first two phases of the TMI-2 accident has been used for this benchmark, with proper boundary conditions. Moreover, minor changes were performed with respect to this benchmark, in order to reduce stratification in the primary side and improve heat transfer through steam generators.
The nodalization of the TMI-2 primary system for the MELCOR 1.8.6 code is presented in the Figure 3.1. Both primary loops have been modelled simulating each SGs and
considering a single equivalent main pump and cold leg. The secondary system is modelled only up to the main feed and isolation valves, while the SGs were modelled with a high level of detail. The secondary side is connected to an imposed pressure control volume and to a “spill & feed” level control, which assure the desired imposed boundary conditions.
Particular care has also been devoted to core simulation (Figure 3.2). The core schematization is constituted by five radial rings and twelve axial levels; four thermal-hydraulic levels are used in each ring of the core region, with three core cells axially in each thermal-hydraulic control volume. Radial and axial flow paths in the core region allow for the prediction of 2-D flow patterns. Heat structures representative of the control rod guide tubes and upper tie plate in the upper plenum have been added to the MELCOR model to permit condensation heat transfer and coolant recirculation inside the vessel. The input deck was developed using standard default MELCOR modeling parameters as long as possible, and allows for a complete description of an eventual severe progression of an accidental transient.
The VENT valves are also explicitly modeled between the cold and hot collectors. The plant geometry, the boundary conditions and the accident scenario have been strictly defined according to TMI-2 scenario benchmark specifications.
Figure 3.2: TMI-2 core simulation with MELCOR
3.3.3 Primary mass inventory
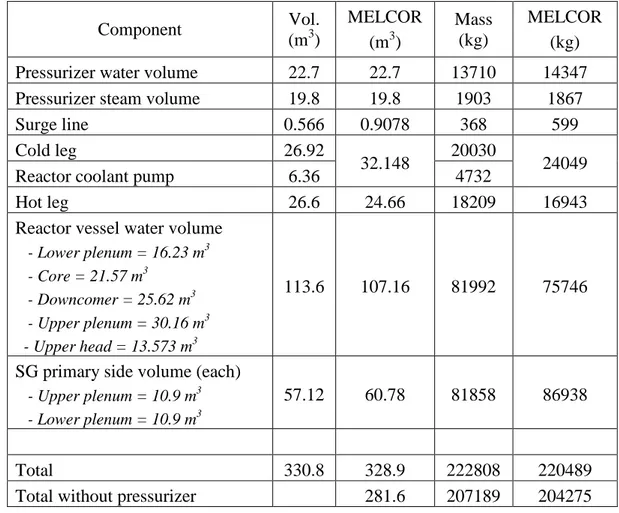
The coolant mass inventory in the primary system has been evaluated according to the primary component volumes defined in Ref. [3]. The calculation of the primary mass inventory is illustrated in Table 3.3.
Table 3.3: Coolant mass inventory in the primary system Component Vol. (m3) MELCOR (m3) Mass (kg) MELCOR (kg)
Pressurizer water volume 22.7 22.7 13710 14347
Pressurizer steam volume 19.8 19.8 1903 1867
Surge line 0.566 0.9078 368 599
Cold leg 26.92
32.148 20030 24049
Reactor coolant pump 6.36 4732
Hot leg 26.6 24.66 18209 16943
Reactor vessel water volume
- Lower plenum = 16.23 m3 - Core = 21.57 m3 - Downcomer = 25.62 m3 - Upper plenum = 30.16 m3 - Upper head = 13.573 m3 113.6 107.16 81992 75746
SG primary side volume (each)
- Upper plenum = 10.9 m3 - Lower plenum = 10.9 m3
57.12 60.78 81858 86938
Total 330.8 328.9 222808 220489
Total without pressurizer 281.6 207189 204275
3.4 Parameters and results
The chronology of major events calculated by MELCOR is presented in Table 3.4 and discussed in the following.
Boundary conditions on the SGs secondary side (Figures 3.3 to 3.4) are maintained during the whole transient, by connecting each steam generator secondary side to a control volume with imposed pressure and using a “spill&feed” level control. So, changes in pressure and in liquid level due to steam evaporation/condensation which takes place during the transient are continuously corrected by injecting/spilling saturated steam and water from/to the two controlled source.
The initial feedwater trip and the consequent heat removal loss through the two steam generators causes the primary pressure to rapidly reach the opening PORV set-point and after about 27 s the reactor scram is actuated. The primary pressure (Figure 3.5) rapidly approaches saturation as a consequence of the break on the hot leg and remains almost constant at a value of 7.6 MPa up to the trip of the pumps which takes place after 2593 s. Almost at the same time the break uncovers and pressure starts increasing due to reduced removed power through the steam generators and the break. After 10 minutes the pressure decreases again, due to the
beginning of core uncovery, reaching a minimum value of about 6.8 MPa. Finally, the primary pressure slightly decreases up to the time of vessel failure.
Table 3.4: Chronology of main events (code output)
Parameter Time (s)
Break opening and total loss of main feedwater 0
Pressurizer PORV opens (P > 15.56 MPa) 17.03
Reactor scram (P > 16.30 MPa) 26.68
Pressurizer PORV closes (P < 14.96 MPa) 33.02
Full steam generator dryout 47.22
Startup of auxiliary feedwater 100.00
Pressurizer is empty 287.0
Stop of primary pumps (primary mass (liquid + steam) < 85000 kg) 2593
First fuel rod clad perforation/burst (-)
First clad oxidation 4180
First clad melting and dislocation (also considering control rods) 5450/5700
First ceramic melting and dislocation 6310
First molten material slumping in the lower plenum 5480
Vessel failure 9680
Formation of a void fraction is predicted in the primary system (Figure 3.6) reaching almost the 50% when the main pumps trip, due to the low primary mass. Heat transfer through the two steam generators (Figure 3.7) is directly correlated to the primary system saturation temperature up to the trip of the main pumps, when heat removal steeply decreases to zero.
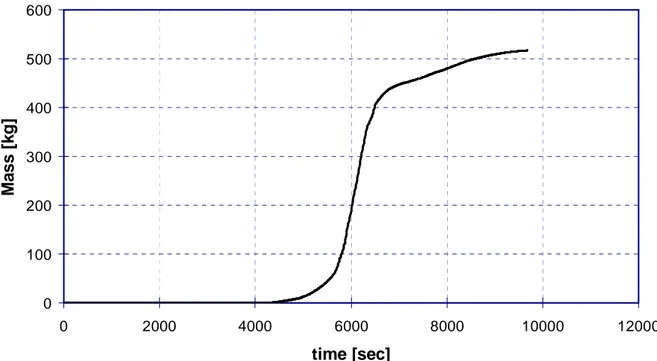
The mass of water in the primary system (Figure 3.8) decreases with an almost constant rate during liquid flow rate through the break. The calculation of break mass flow rate (Figure 3.9) is performed using RETRAN correlations for choked flow, that is the Moody model for saturated water and the Henry-Fauske model for the subcooled phase. After break uncovering the mass inventory decreases more slowly reaching a minimum value of about 37 tons at the end of the calculation.
The mass flow rate through the two primary loops (Figure 3.10) is predicted to be rapidly reduced due to void formation inside the primary system. A void degradation factor has been also applied in order to simulate the decrease of pumps head as a function of the void fraction.
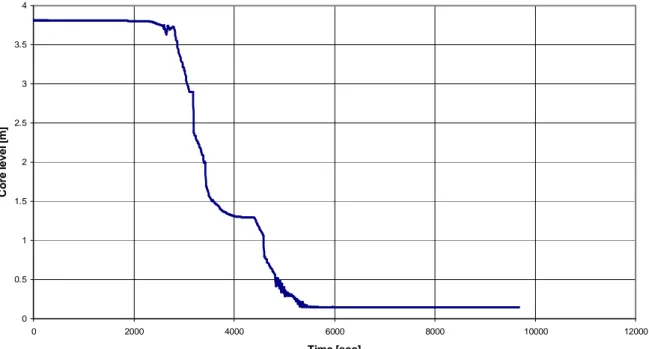
The core starts to uncover at 2800 s (Figure 3.11) as a consequence of the break and pumps trip, while core heatup starts at 2900 s at the core top, because the core decay power is no more removed by natural circulation in the primary circuit. Core level is predicted to reach the bottom of the active fuel after 5300 s since the beginning of the transient and it remains to this level up to the vessel failure.
The temperature in the cold leg (Figure 3.12) remains at saturation during the first part of the transient and undergoes a steep decrease after steam generator emptying. The behavior of the temperature inside the hot leg (Figure 3.13) is similar, even though higher values of steam superheating are evaluated during the core heatup phase.
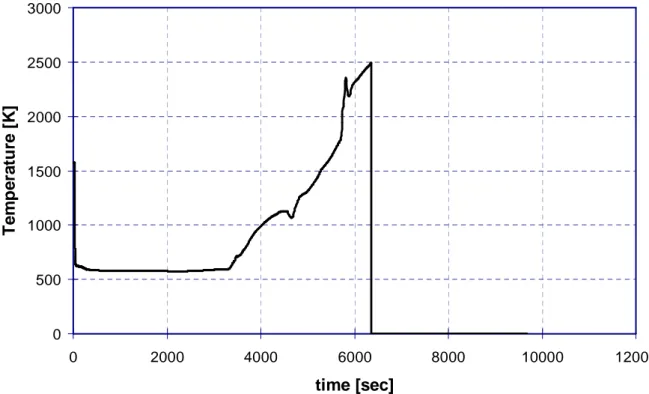
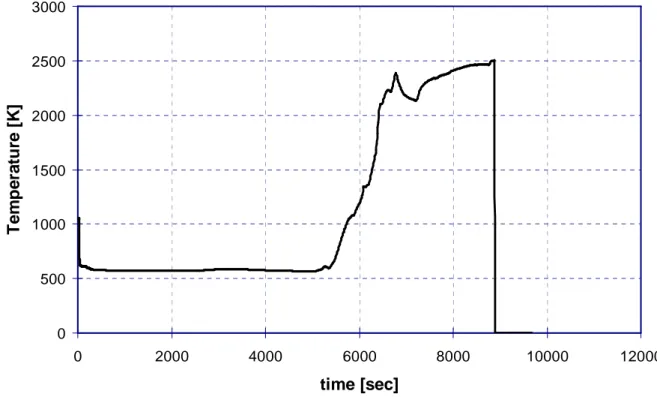
The fuel rod temperature in the central ring, as evaluated by MELCOR at three different core elevations (Figures from 3.14 to 3.16), shows a steep increase during the oxidation phase. At the bottom of the core, a weaker fuel rod heatup is anyway predicted during the phase where the core level goes to zero.
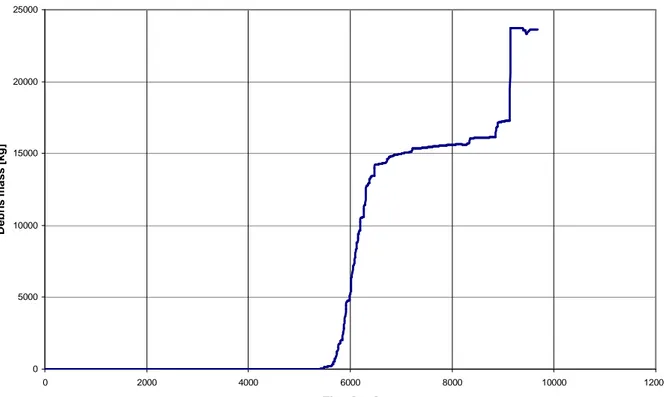
Fuel rod melting starts just before the main oxidation phase. Melting of control rods materials starts after 5400 s since the beginning of the transient, while zircaloy starts melting at about 5700 s also causing a partial dissolution of the fuel. The total mass of molten metals is predicted to be about 34 tons (Figure 3.17), while about 23.7 tons of debris is predicted to relocate towards the vessel bottom (Figure 3.18).
The main oxidation phase takes place (Figure 3.19) between 4200 s and 6900 s since the beginning of the transient. During this phase almost 516 kg of hydrogen are generated (Figure 3.20), with a maximum rate of about 0.7 kg/s at 6000 s (Figure 3.21).
Figure 3.3: Steam generator A level
0 1 2 3 4 5 6 7 8 0 2000 4000 6000 8000 10000 12000 time [sec] L e v e l (m )
Figure 3.4: Steam generator A pressure
Figure 3.5: Pressurizer pressure
6300000 6400000 6500000 6600000 6700000 6800000 6900000 7000000 7100000 0 2000 4000 6000 8000 10000 12000 time [sec] P re s s u re [ P a ] 0 2000000 4000000 6000000 8000000 10000000 12000000 14000000 16000000 18000000 0 2000 4000 6000 8000 10000 12000 time [sec] P re s s u re [ P a ]
Figure 3.6: Main pumps void fraction
Figure 3.7: Steam generator A removed power
0 0.2 0.4 0.6 0.8 1 1.2 -4000 -2000 0 2000 4000 6000 8000 10000 12000 time [sec] N o d im e n s io n FL-VOID.235 FL-VOID.285 0 100000000 200000000 300000000 400000000 500000000 600000000 0 500 1000 1500 2000 2500 3000 3500 4000 time [sec] P o w e r [W ]
Figure 3.8: Total primary water mass
Figure 3.9: Break mass flowrate
0 50000 100000 150000 200000 250000 0 2000 4000 6000 8000 10000 12000 time [sec] P ri m a ry m a s s [ k g ] 0 20 40 60 80 100 120 0 2000 4000 6000 8000 10000 12000 time [sec] M a s s F lo w R a te [ k g /s ]
Figure 3.10: Loop A mass flowrate
Figure 3.11: Core swollen water level
-4000 -2000 0 2000 4000 6000 8000 10000 0 1000 2000 3000 4000 5000 6000 7000 8000 9000 10000 time [sec] M a s s F lo w R a te [ k g /s ] 0 0.5 1 1.5 2 2.5 3 3.5 4 0 2000 4000 6000 8000 10000 12000 Time [sec] C o re l evel [ m ]
Figure 3.12: Cold leg A temperature
Figure 3.13: Hot leg A temperature
500 550 600 650 700 750 800 850 900 0 2000 4000 6000 8000 10000 12000 time [sec] T e m p e ra tu re [ K ] 0 200 400 600 800 1000 1200 1400 1600 1800 2000 0 2000 4000 6000 8000 10000 12000 time [sec] T e m p e ra tu re [ K ]
Figure 3.14: Fuel rod temperature at the top of the core
Figure 3.15: Fuel rod temperature at the middle of the core
0 500 1000 1500 2000 2500 3000 0 2000 4000 6000 8000 10000 12000 time [sec] T e m p e ra tu re [ K ] 0 500 1000 1500 2000 2500 3000 0 2000 4000 6000 8000 10000 12000 time [sec] T e m p e ra tu re [ K ]
Figure 3.16: Fuel rod temperature at the bottom of the core
Figure 3.17: total mass of molten metals
0 500 1000 1500 2000 2500 3000 0 2000 4000 6000 8000 10000 12000 time [sec] T e m p e ra tu re [ K ] 0 5000 10000 15000 20000 25000 30000 35000 40000 0 2000 4000 6000 8000 10000 12000 Time [sec] M o lt e n m a te ri a l [k g ]
Figure 3.18: total mass of debris
Figure 3.19: Fraction of non-oxidized Zr 0 5000 10000 15000 20000 25000 0 2000 4000 6000 8000 10000 12000 Time [sec] D e b ri s m a s s [ k g ] 0 10 20 30 40 50 60 0 2000 4000 6000 8000 10000 12000 time [sec] F ra c ti o n o f o x id is e d Z r [% ]
Figure 3.20: Cumulated mass of hydrogen
Figure 3.21: Hydrogen production rate
0 100 200 300 400 500 600 0 2000 4000 6000 8000 10000 12000 time [sec] M a s s [ k g ] -0.1 0 0.1 0.2 0.3 0.4 0.5 0.6 0.7 0.8 0 2000 4000 6000 8000 10000 12000 Time (s) H 2 p ro d u c ti o n r a te [ k g /s ]
3.5 Synthetic view of the core at selected instants
In the following some of the most significant variables relating to the degradation phase of the core are sketched, as contour plots extended to the active zone of the core (from the bottom support plate to the top of the fuel rods) at different given times.
Figure 3.22 shows the core void fraction from 2000 s to 5000 s during the accidental transient. Up to main pumps trip (at about 2600 s), the amount of voids in the core is quite low and slightly larger in the lower zone due to the progressive emptying of the downcomer as a consequence of the break loss. After pumps trip it is quite evident the stratification in the core with a progressive increase of voids and at 5000 s since the beginning of the transients the whole core shows a void fraction greater than 70%.
As a consequence of the increase of core void fraction and core decay power, the cladding temperature (Figure 3.23) starts to increase in the central upper zone of the core, reaching the value of 1000 K after 4000 s. At this time oxidation of zircaloy starts adding a new thermal power source to the fuel rods and at about 6000 s the melting point of zircaloy is reached in quite a large fraction of the core. The last two sketches of the Figure 3.23 shows the relocation of the material that is molten or transformed in debris from the upper and central zones of the core towards the lower plate.
Finally the Figures from 3.24 to 3.28 show the contour plots of the linear mass (kg/m) of the most significant core materials at five different times during the transient. The use of linear mass allows for the comparison between the cells of different size which model the core. At about 5000 s the oxidation of zircaloy starts in the hottest (central and upper) parts of the core, leading to a slight depletion of the zircaloy in the same location, while neither molten metal nor any degradation of the fuel is still detected (Figure 3.24).
After 6000 s since the beginning of the transient, zircaloy begins to melt and almost disappear from the upper and central zone (largely is still being converted to oxide) and is relocated by candling towards the lowest zone of the core, where refreeze or radially flows towards the external zone of the core. At this time some of the upper part of a little number of fuel rods are also failed and have been converted to debris and relocated downward (Figure 3.25).
After 7000 s almost half of the zircaloy initially present inside the core has been oxidized and the remaining is located in the lower-external zones of the core (and partly has also flowed through the support plate to the lower plenum). A larger number of fuel rods is predicted to fail in the upper zone and is relocated downward where it seems to create a sort of crucible collecting other downward flowing molten materials (Figure 3.26).
The transient then shows an increasing extension of the degraded core (Figure 3.27), even though natural circulation still present inside the vessel is able to prevent the failure of the more external zones of the core, up to the time when the relocated materials join the lower support plate (Figure 3.28) causing after a short time its partial failure, with a consequent massive transfer of materials on the vessel lower head.
3.5.1 Core void fraction
t = 2000 s t = 3000 s
t = 4000 s t = 5000 s
Figure 3.22: Core void fraction (t = 2000 - 5000 s)
-1.50 -1.00 -0.50 0.00 0.50 1.00 1.50 0.50 1.00 1.50 2.00 2.50 3.00 0.00 0.01 0.01 0.01 0.02 0.02 0.03 0.03 0.03 -1.50 -1.00 -0.50 0.00 0.50 1.00 1.50 0.50 1.00 1.50 2.00 2.50 3.00 0.05 0.10 0.15 0.20 0.25 0.30 0.35 0.40 0.45 0.50 0.55 0.60 0.65 -1.50 -1.00 -0.50 0.00 0.50 1.00 1.50 0.50 1.00 1.50 2.00 2.50 3.00 0.15 0.25 0.35 0.45 0.55 0.65 0.75 0.85 0.95 -1.50 -1.00 -0.50 0.00 0.50 1.00 1.50 0.50 1.00 1.50 2.00 2.50 3.00 0.74 0.78 0.82 0.86 0.90 0.94 0.98
3.5.2 Cladding temperature maps
t = 3000 s t = 4000 s
t = 5000 s t = 6000 s
t = 7000 s t = 9000 s
Figure 3.23: Cladding temperature (t = 3000 - 9000 s)
-1.50 -1.00 -0.50 0.00 0.50 1.00 1.50 0.50 1.00 1.50 2.00 2.50 3.00 3.50 578.00 582.00 586.00 590.00 594.00 598.00 602.00 606.00 -1.50 -1.00 -0.50 0.00 0.50 1.00 1.50 0.50 1.00 1.50 2.00 2.50 3.00 3.50 550.00 600.00 650.00 700.00 750.00 800.00 850.00 900.00 950.00 1000.00 -1.50 -1.00 -0.50 0.00 0.50 1.00 1.50 0.50 1.00 1.50 2.00 2.50 3.00 3.50 550.00 650.00 750.00 850.00 950.00 1050.00 1150.00 1250.00 1350.00 -1.50 -1.00 -0.50 0.00 0.50 1.00 1.50 0.50 1.00 1.50 2.00 2.50 3.00 3.50 1100.00 1200.00 1300.00 1400.00 1500.00 1600.00 1700.00 1800.00 1900.00 2000.00 2100.00 2200.00 2300.00 -1.50 -1.00 -0.50 0.00 0.50 1.00 1.50 0.50 1.00 1.50 2.00 2.50 3.00 3.50 1200.00 1400.00 1600.00 1800.00 2000.00 2200.00 2400.00 -1.50 -1.00 -0.50 0.00 0.50 1.00 1.50 0.50 1.00 1.50 2.00 2.50 3.00 3.50 1000.00 1200.00 1400.00 1600.00 1800.00 2000.00 2200.00
3.5.3 Linear mass of materials at different instants
Zr ZrO2
Molten Zr UO2
(No molten Zr is present at this time)
Figure 3.24: Linear mass of core materials at t = 5000 s
-1.50 -1.00 -0.50 0.00 0.50 1.00 1.50 0.50 1.00 1.50 2.00 2.50 3.00 3.50 0.152 0.153 0.154 0.154 0.155 0.156 0.157 -1.50 -1.00 -0.50 0.00 0.50 1.00 1.50 0.50 1.00 1.50 2.00 2.50 3.00 3.50 -0.001 0.001 0.002 0.002 0.004 0.004 0.005 0.007 0.007 0.009 -1.50 -1.00 -0.50 0.00 0.50 1.00 1.50 0.50 1.00 1.50 2.00 2.50 3.00 3.50 0.64 0.64 0.64 0.64 0.64 0.64 0.64 0.64 0.64 0.64 0.64
Zr ZrO2
Molten Zr UO2
Figure 3.25: Linear mass of core materials at t = 6000 s
-1.50 -1.00 -0.50 0.00 0.50 1.00 1.50 0.50 1.00 1.50 2.00 2.50 3.00 3.50 0.000 0.050 0.100 0.150 0.200 0.250 0.300 0.350 0.400 -1.50 -1.00 -0.50 0.00 0.50 1.00 1.50 0.50 1.00 1.50 2.00 2.50 3.00 3.50 -0.010 0.000 0.010 0.020 0.030 0.040 0.050 0.060 0.070 0.080 0.090 0.100 0.110 -1.50 -1.00 -0.50 0.00 0.50 1.00 1.50 0.50 1.00 1.50 2.00 2.50 3.00 3.50 0.01 0.05 0.09 0.13 0.17 0.21 0.25 -1.50 -1.00 -0.50 0.00 0.50 1.00 1.50 0.50 1.00 1.50 2.00 2.50 3.00 3.50 0.62 0.63 0.64 0.65 0.66 0.67 0.68 0.69
Zr ZrO2
Molten Zr UO2
Figure 3.26: Linear mass of core materials at t = 7000 s
-1.50 -1.00 -0.50 0.00 0.50 1.00 1.50 0.50 1.00 1.50 2.00 2.50 3.00 3.50 0.000 0.050 0.100 0.150 0.200 0.250 0.300 0.350 0.400 0.450 0.500 -1.50 -1.00 -0.50 0.00 0.50 1.00 1.50 0.50 1.00 1.50 2.00 2.50 3.00 3.50 0.000 0.040 0.080 0.120 0.160 0.200 0.240 0.280 -1.50 -1.00 -0.50 0.00 0.50 1.00 1.50 0.50 1.00 1.50 2.00 2.50 3.00 3.50 0.00 0.04 0.08 0.12 0.16 0.20 0.24 0.28 0.32 0.36 -1.50 -1.00 -0.50 0.00 0.50 1.00 1.50 0.50 1.00 1.50 2.00 2.50 3.00 3.50 0.00 0.20 0.40 0.60 0.80 1.00 1.20 1.40 1.60
Zr ZrO2
Molten Zr UO2
Figure 3.27: Linear mass of core materials at t = 8000 s
-1.50 -1.00 -0.50 0.00 0.50 1.00 1.50 0.50 1.00 1.50 2.00 2.50 3.00 3.50 0.000 0.050 0.100 0.150 0.200 0.250 0.300 0.350 0.400 0.450 -1.50 -1.00 -0.50 0.00 0.50 1.00 1.50 0.50 1.00 1.50 2.00 2.50 3.00 3.50 0.010 0.060 0.110 0.160 0.210 0.260 0.310 0.360 -1.50 -1.00 -0.50 0.00 0.50 1.00 1.50 0.50 1.00 1.50 2.00 2.50 3.00 3.50 0.01 0.05 0.09 0.13 0.17 0.21 0.25 0.29 0.33 0.37 -1.50 -1.00 -0.50 0.00 0.50 1.00 1.50 0.50 1.00 1.50 2.00 2.50 3.00 3.50 0.00 0.20 0.40 0.60 0.80 1.00 1.20 1.40 1.60
Zr ZrO2
Molten Zr UO2
Figure 3.28: Linear mass of materials at t = 9000 s
3.6 Final remarks
The results obtained using the MELCOR 1.8.6 code in the simulation of a reference severe accident scenario with prescribed boundary conditions have been presented and analyzed. This exercise follows a similar activity promoted by NEA since almost 30 years to assess the capacity of current codes to predict severe accidents. In order to allow for a comparison with other codes results a reference severe accident scenario, starting with a small break LOCA with prescribed boundary conditions was defined. The transient is supposed to take place in a plant similar to the TMI-2 reactor and a model of the primary system of this plant was set up for MELCOR. Moreover some parameters allowing to judge the quality of
-1.50 -1.00 -0.50 0.00 0.50 1.00 1.50 0.50 1.00 1.50 2.00 2.50 3.00 3.50 0.000 0.040 0.080 0.120 0.160 0.200 0.240 0.280 0.320 0.360 0.400 -1.50 -1.00 -0.50 0.00 0.50 1.00 1.50 0.50 1.00 1.50 2.00 2.50 3.00 3.50 0.010 0.060 0.110 0.160 0.210 0.260 0.310 0.360 0.410 -1.50 -1.00 -0.50 0.00 0.50 1.00 1.50 0.50 1.00 1.50 2.00 2.50 3.00 3.50 0.01 0.05 0.09 0.13 0.17 0.21 0.25 0.29 0.33 0.37 -1.50 -1.00 -0.50 0.00 0.50 1.00 1.50 0.50 1.00 1.50 2.00 2.50 3.00 3.50 0.01 0.21 0.41 0.61 0.81 1.01 1.21
the predicted results were proposed, in order to assess the predictive quality of the code and the adequate capacity of the code user.
The same nodalization used to simulate the first two phases of the TMI-2 accident has been used for this benchmark, with proper boundary conditions. Moreover, minor changes were performed with respect to this benchmark, in order to reduce stratification in the primary side and improve heat transfer through steam generators. Particular attention was devoted to the modelling of the primary vessel, in order to allow natural circulation flows, which TMI-2 evidence showed as extremely important in the correct simulation of core degradation.
Relating to the thermal-hydraulics phase, up to pump stops, the predicted results are in good qualitative agreement with those of the first phase of the TMI-2 accident. The states of the core and the primary circuit at the time of pump stops is strictly related to the break mass flow rate and to the related models employed to simulate the characteristics of the fluid upstream the break and the critical flow rate through the break.
For the degradation phase, the MELCOR code includes assessed models to describe the main physical processes of degradation as well as robust and consistent numerical schemes which make it reliable to predict a severe accident sequence with acceptable results. In particular MELCOR succeeded in calculating the scenario from the beginning to the end, without any tuning of parameters or optimization of input decks, showing the robustness of the code. Most of the parameters significant from a safety point of view (such as the hydrogen production rate and the mass of molten materials) are evaluated by the code, even though some difficulties arise when cumulative values have to be obtained.
Some weaknesses of the MELCOR code have also been identified. The first one is the melting of UO2 and its interaction with molten corium. The second one is the evaluation of structural integrity of penetrations and lower vessel head. The weaknesses to predict those phenomena are not surprising because those are areas for which experimental data are scarce and the physical understanding is still incomplete.
References
1. K. N. Ivanov, T. M. Beam, A. J. Baratta, “Pressurised Water Reactor Main Steam Line Break (MSLB) Benchmark”, Volume 1: Final Specifications, NEA/NSC/DOC(99)8, April 1999.
2. MELCOR Computer Code Manuals – Vol. 1 Primer and Users’ Guide Version 1.8.6 September 2005 - R. O. Gauntt, J.E. Cash, R. K. Cole et al. - NUREG/CR-6119, Vol. 1, Rev. 3 - SAND 2005-5713
3. MELCOR Computer Code Manuals – Vol. 2 Reference Manuals Version 1.8.6 September 2005 - R. O. Gauntt, J.E. Cash, R. K. Cole et al. - NUREG/CR-6119, Vol. 2, Rev. 3 SAND 2005-5713
4.
SBLOCA accident calculation with ASTEC
The evolution of the severe SBLOCA accident sequence has been studied until molten core slumping in the lower plenum and possible lower head vessel failure. The entire transient was analyzed by mean of ASTEC V2r2p2 code. To get the steady operating condition of the plant, a steady-state calculation has been performed, to establish the initial conditions of the transient. The core degradation phenomena was simulated adopting two different models; the first taking into account of the debris bed formation (by mean of the STRUCTURE DEBRIS), while the second using the standard 2D magma model.
4.1 Brief description of the ASTEC code
The Accident Source Term Evaluation Code (ASTEC) is a severe accident code developed in common by IRSN and GRS [1]. The code calculates the transient sequences from the initiator events until the eventual radioactive fission product releases to the atmosphere, named source term. The ASTEC code is mainly used for safety analyses on nuclear installations and development/specification of severe accidents management guidelines. The code includes several coupled modules that can deal with the different severe accident phenomena: thermal-hydraulics in the reactor system, core degradation and melt release, fission product release and transport, ex-vessel corium interaction, aerosols behavior and iodine chemistry in the containment, etc. Among them, the CESAR module is used to compute the thermal-hydraulics in the primary and secondary systems of the reactor [2]. Such module is coupled to the ICARE2 module that computes core degradation, melt relocation and behavior in the lower head up to vessel failure. The CESAR module allows a detailed representation of all components of primary and secondary circuits including auxiliary, emergency and control systems [3].
CESAR is a two-phase flow thermal-hydraulic code. The gas phase can be a mixture of steam and hydrogen. The solution of the problem is based on two mass equations, two energy equations, one equation for steam velocity, and a drift flux correlation for water velocity. The state variables computed by CESAR are: total pressure, void fraction, steam and water temperature, steam and water velocity, and partial pressure of hydrogen. All hydraulics components can be discretized by volumes (one mesh) or axial meshed volumes and connected by junctions. The volumes can be homogeneous or with a swollen level. Thermal structures are used to model the walls of the components, and compute thermal heat exchange between primary and secondary systems and heat losses to the environment.
The ICARE2 module can simulate the thermal-hydraulics in the part of the vessel below the top of the core: downcomer, lower plenum and the core itself including the core bypass. The model of the lower head of ICARE2 has one single mesh for fluids, three layers for corium (pool, metal and debris), and a 2D meshing for the vessel. The ICARE2 [4] module is activated to compute core heatup and degradation, in coupled mode with CESAR, at the onset of core uncovery. Before ICARE2 activation, the thermal-hydraulics in the vessel and the core is computed by CESAR through an automatic vessel model creation based on
ICARE2 input deck. The convective and radiative heat exchanges between core components and structures are computed by ICARE2.
Most important core degradation phenomena are dealt with in ICARE2 [5] including: core material oxidation and hydrogen generation, control rod material interaction, melting and relocation, zircaloy clad melting and fuel dissolution, fuel rod clad failure and metallic melt relocation, debris bed and molten pool formation and spreading in the late degradation phase. When corium accumulates in the lower plenum, three 0-D layers are represented: oxide, metals, and debris. The heat transfers between neighboring layers, between layers and vessel walls or residual water, use recent literature correlations, depending on layer mean temperature and power. Then, the corium layers heat up the lower head until its possible melt-through or mechanical failure (by plasticity, creep, etc.).
4.2 TMI-2 ASTEC modeling
The input data for ASTEC V2r2p2 code was prepared to simulate only in-vessel phenomena; the transient finishes when molten core slumping occurs and in case of lower head vessel failure.
To perform this kind of simulation, two ASTEC modules were activated:
• CESAR to simulate the thermal-hydraulics in the RCS, secondary circuit and vessel (with simplified core modelling) up to the beginning of core degradation phase;
• ICARE to simulate in-vessel core degradation phenomena, and thermal-hydraulics in the reactor vessel during this phase;
The drawing of the Babcock and Wilcox lowered loop plant and the graphical representation of the ASTEC primary and secondary circuits are given respectively in Figure 4.1 and in Figure 4.2. The primary part of the RCS input model is a coarse node representation of the hydraulic system and structures comprising about 39 hydraulic control volumes, of which 22 cells are used for the shell side of the steam generators. The secondary circuits are discretized in 30 fluid meshes. The plant simulation includes a detailed modelling of the primary coolant system with:
• reactor pressure vessel volumes and structures, including the VENT valve between the cold collector and the hot collector,
• two primary coolant loops (1 hot leg and 2 cold legs in each loop) with once-through steam generators and main coolant pumps,
• pressurizer with surge-line, PORV, heaters, spray-line and valve,
• main emergency and control systems.
The modelling of the secondary systems is limited to the pipe side of the steam generators, the steam lines with isolation valves, and main feedwater and auxiliary feedwater injections. The simplified reactor vessel adopted by CESAR, to compute the steady state
conditions, consists of four volumes: the core, the bypass and the downcomer volumes discretized into 20 axial meshes, and the lower plenum volume.
Figure 4.1: Babcock & Wilcox Lowered loop
Figure 4.2: Babcock & Wilcox ASTEC nodalization Upper head Upper plenum Lower plenum Pressurizer Steam Line Pump Pump Make-up LOOP B LOOP A OTSG-B OTSG-A Check valve Steam Line feedwater feedwater Break location Vessel Core Upper head Upper plenum Lower plenum Pressurizer Steam Line Pump Pump Make-up LOOP B LOOP A OTSG-B OTSG-A Check valve Steam Line feedwater feedwater Break location Vessel Core
The ICARE core model shares the same volumes and axial nodalization with the CESAR simplified model, but in this case, the core is further subdivided in 6 radial rings for a total of 161 mesh. In each ring, only one representative component of the fuel and control rods is considered, weighted by the number of rods. The baffle, the barrel and the thermal shield at the core periphery are also represented. The control rod component simulates all the full and part-length control rods, all the guide tubes (including those containing burnable poison rods) and all the instrument tubes. Mass and energy rates of change for core materials are calculated for each core node. The radial peaking factor are fixed for each ring, and an axial peaking factor is assigned for each row.
4.2.1 DEBRIS and NO DEBRIS models
The core degradation process is characterized by the high complexity of phenomena to be considered and geometry to be accurately presented, with a permanent appearance and disappearance of a large number of components in each control volume by e.g. melting, failure, relocation, and chemical reactions. The geometry of a degraded core is very complex and heterogeneous: rod bundles with spacer grids, fluid channels possibly blocked with molten/frozen mixtures of materials, corium molten pool with crusts, debris beds, peripheral and lower/upper core structures (e.g. horizontal plates, vertical surrounding walls such as barrels or shrouds), also partly or totally molten. In this work, two different models were adopted to reproduce the core degradation phenomena, the first called (in this work) NO DEBRIS case and the second called DEBRIS case (6). The first one use a special macro-component, called magma, which is especially devoted to deal with the 2D movement and relocation of the molten materials. The magma can be either liquid corium or liquid/solid corium. The second simulation (DEBRIS) also use the magma macro-component, but it takes also into account the formation of a debris bed by mean of the activation of the model DEBRIS. In this case, the user can define the threshold values of some variables, which, once achieved, will lead to the debris bed collapse.
The user criteria regard the following variables:
• the debris bed porosity: if the debris are heated up and melt down, the void fraction in the medium can become too high for the debris to stay in place,
• the debris bed mass: for the same reason than previously, the debris mass will decrease
• thresholds which can lead to the collapse of the particles,
• the debris bed temperature: when a certain temperature is reached, almost all the debris are liquid and the remaining solid phase can fall down.
In the input data file, the user can introduce criteria on these local variables to trigger the debris bed collapse as well as an instant of the transient. When the criteria are reached the solid particles are supposed to be able to fall down onto a receiver component that has to be determined (note that, as usual in ICARE, debris particles are regarded as spherical particles).