UNIVERSITA’ DELLA CALABRIA
Dipartimento di Farmacia e Scienze della Salute e della Nutrizione
Dottorato di Ricerca in
“Biochimica Cellulare ed Attività dei Farmaci in Oncologia”
(XXVII Ciclo)
Con il contributo della Commissione Europea, Fondo Sociale Europeo e della Regione Calabria
____________________________________________________
“Effects of adiponectin on the progression of breast cancer:
role of Estrogen Receptor alpha”
MED 04/Patologia Generale
Coordinatore: Ch.mo Prof. Diego Sisci
Tutor: Prof. Loredana Mauro
Dottorando: Dott.ssa Emilia Ricchio
"La presente tesi è cofinanziata con il sostegno della Commissione Europea, Fondo Sociale Europeo e della Regione Calabria. L’autore è il solo responsabile di questa tesi e la Commissione Europea e la Regione Calabria declinano ogni responsabilità sull’uso che potrà essere fatto delle informazioni in essa contenute".
Abstract
1 Adipose tissue and adipokines
3 - Adipose tissue 3 - Adipokines 6 - Obesity and breast cancer 8 - Adiponectin 15 Estrogens and their receptors
19
- Estrogens 19
- Estrogen Receptors 21
- Estrogen and breast cancer 26
Materials and Methods
31
Results
39
Discussion
58
Abstract
Adipose tissue is no longer considered an inert tissue for storing energy but is now recognized as an active endocrine organ secreting adipokines, cytokines and a diverse range of inflammatory markers.
Adiponectin is one of the adipokines secreted by white adipose tissue and has been suggested to improve insulin sensitivity, regulate glucose and lipid metabolism and might play a role in the development of diabetes and atherosclerosis.
In addition, it appears to play an important role also in the development and progression of several obesity-related malignancies, including breast cancer. In the present study, we demonstrated that adiponectin induces a dichotomic effect on breast cancer growth. Indeed, it stimulates growth in ERα-positive MCF-7 cells while it inhibits proliferation of ERα-negative MDA-MB-231 cells. Notably, only in MCF-7 cells adiponectin exposure exerts a rapid activation of MAPK phosphorylation, which is markedly reduced when knockdown of the ERα gene occurred. In addition, adiponectin induces rapid IGF-IR phosphorylation in MCF-7 cells, and the use of ERα siRNA prevents this effect. Moreover, MAPK activation induced by adiponectin was reversed by IGF-IR siRNA.
Coimmunoprecipitation studies show the existence of a multiprotein complex involving AdipoR1, APPL1, ERα, IGF-IR, and c-Src that is responsible for MAPK signaling activation in ERα-positive breast cancer cells. It is well known that in addition to the rapid effects through non-genomic mechanisms, ERα also
adiponectin is able to transactivate ERα in MCF-7 cells. We showed the classical features of ERα transactivation: nuclear localization, downregulation of mRNA and protein levels, and upregulation of estrogen dependent genes.
Finally we demonstrate that in vivo adiponectin (1 and 5 µg/ml) induces a significant reduction (60 and 40%, respectively) in tumor volume in animals injected with human ERα-negative MDA-MB-231 cells, whereas an increased tumor growth (54 and 109%, respectively) is observed in the animals receiving human ERα-positive MCF-7 cells. Moreover, cyclin D1 (CD1) mRNA and protein levels are decreased in MDA-MB-231 cells, while they are upregulated in MCF-7 cells by adiponectin.
Collectively, this study clarifies the molecular mechanism through which adiponectin modulates breast cancer cell growth, providing evidences on the cell-type dependency of adiponectin action in relationship to ERα status.
I.1 Adipose tissue
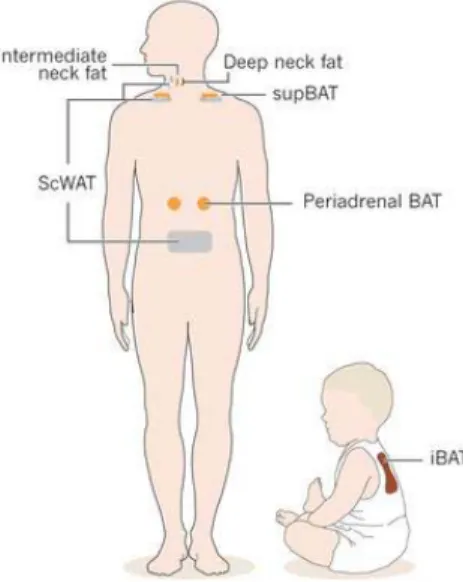
Adipose tissue is a loose connective tissue located either subcutaneously just under the skin, in neck regions, or at several intra-abdominal, or visceral, locations inside the thorax and abdomen in close proximity to major internal organs (Fantuzzi G. &. Mazzone T, 2007).
In general, adipose tissue can be divided into two major types: white adipose tissue (WAT) and brown adipose tissue (BAT), (Fig. I-1).
Brown adipocytes are only found in mammals and have a multilocular distribution of triglycerides droplets and a vast number of specialized mitochondria which contain the uniquely BAT-expressed protein, uncoupling protein-1 (UCP1), which generates heat at the expense of ATP (Rosen E.D. &. Spiegelman B.M. ,2006; Cannon B. & Nedergaard J., 2004). Until recently, the existence of BAT was thought to be
restricted to small mammals and infants, but has now been shown to be present also in adult humans (Virtanen K.A. et al., 2009; van Marken Lichtenbelt, W.D. et al., 2009).
Fig I-1. Locations of the brown adipose tissue (BAT) and WAT depots in infants and adults. iBAT, interscapular BAT; supBAT, supraclavicular BAT; scWAT, subcutaneous WAT.
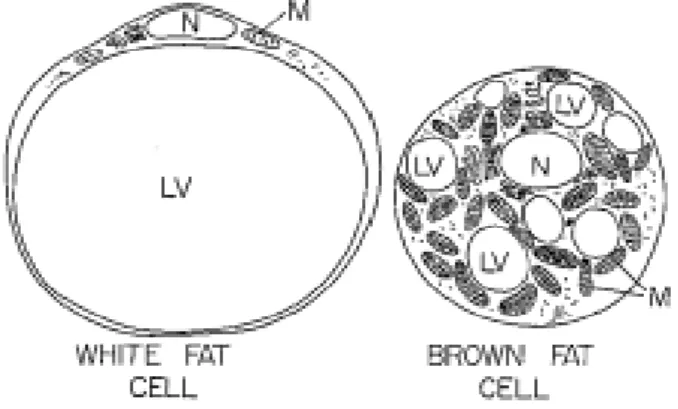
WAT is composed of mainly adipocytes and other distinct cell types including mature adipocytes, pre-adipocytes, fibroblasts and macrophages, all of which participate to a greater or lesser extent in WAT secretary functions. WAT is commonly called unilocular because most of the cytoplasm of adipocyte cells is occupied by a single large drop of fat, crushing the nucleus and mitochondria to one side of the cell (Hiragun A., 1985), (Fig.I-2).
Fig I-2. White fat cell and brown fat cell: note the single large lipid vacuole in the white fat cell and the numerous smaller lipid vacuoles in the brown fat cell. LV: lipid vacuole; M: mitochondria; N: nucleus.
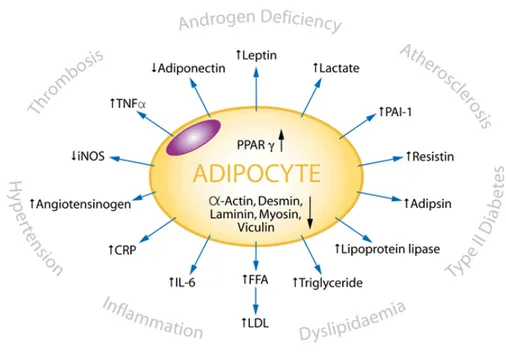
Adipose tissue is no longer considered an inert tissue mainly devoted to energy storage but is now recognized as an active endocrine organ secreting several hormones and a diverse range of other protein factors (Trayhurn P. & Wood I.S., 2004).
The proteins secreted by adipocytes are called adipocytokines.
Leptin, adiponectin, vistafin, and resistin are a few of the well known adipocytokines. Macrophages in WAT also secrete a number of cytokines including interleukin-6 (IL-6), tumour necrosis factor alpha (TNFRα), interleukine-5 (IL-5), macrophage chemoattractant protein (MCP). All hormones
expand rapidly and approximately 50 different molecular entities have been identified so far (Trayhurn P. & Wood I.S., 2004).
Many of these proteins and factors act as endocrine hormones, for example leptin and IL-6, while others act locally, for example the TNF-α and growth factors. The proteins or endocrine factors are proposed as modulators of the function of different organs, such as the liver, skeletal muscle or brain (Fig.I-3).
Even paracrine/autocrine factors can affect insulin sensitivity, promoting or inhibiting the proliferation and/or cellular differentiation of adipocytes (Su A. I. et al., 2004).
I.2 Adipokines
Adipokines, proteins derived from white adipose tissue, play a very important role in the homeostasis of the organism, since they are capable of affect a wide variety of biological and physiological processes: food intake, the regulation of energy balance, the action of insulin, glucose and lipid metabolism, angiogenesis and vascular remodelling, regulation of the blood pressure and coagulation (Frühbeck G. et al., 2001).
Currently, more than 50 different adipocytokines have been identified, which mainly regulate energy metabolism, but also have several pathophysiological functions.
The adipokines can be classified into three groups:
1. Hormones produced primarily in other tissues or organs with simultaneous adipose tissue production (i.e. TNF α).
2. Hormones produced mainly in the white adipose tissue. Nevertheless, adipocytes are not the only source of production and other cells residing in fat, i.e. immunocompetent cells, may also participate (resistin).
3. Hormones produced predominantly or exclusively by adipocytes of white adipose tissue (leptin and adiponectin).
Another classification of adipocytokines reflects their putative physiological role. According to this classification, adipocytokines may be divided into two groups: “insulin resistance-inducing factors” such as resistin, TNF-α and interleukin 6, and “insulin-sensitizing factors” such as leptin, adiponectin and the recently
Fig I-4. Classification of adipokines
The well known adipokines (leptin, adiponectin, resistin) secreted by adipose tissue, are widely studied for their involvement in the mechanisms through which obesity and metabolic disorders affect the risk of carcinogenesis. It was therefore studied the direct and indirect effect of these protein factors in the biological and clinical development of breast cancer, emphasizing their different mode of action through endocrine, paracrine and autocrine system (Harvie M. et al., 2003; Rose D.P. et al., 2004). In addition to the relationship between adipocytokines and obesity or
diabetes numerous other functions of these hormones in human body have been identified, including their potential role in the regulation of angiogenesis and tumor growth. Disturbances in the production of adipocyte-derived hormones thus may represent a new link explaining the well-known relationship between obesity and increased prevalence of malignancies.
I.3 Obesity and breast cancer
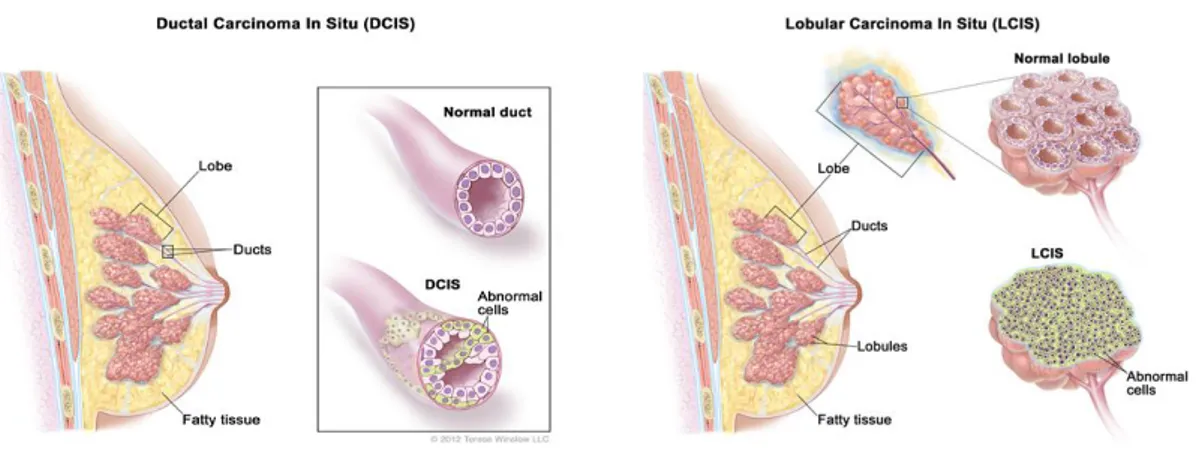
Breast cancer is the uncontrolled growth and spread of abnormal cells that initiates in mammary tissue. It often begins in the ducts, the tubes that drain milk from the breast, or in the lobules, the glands in the breast that produce milk (Argani P. & Cimino-Mathews A., 2012). There is no single known cause of breast cancer, and only 5 to 10% of these diagnoses are attributed to genetic mutations inherited from a parent.
Of these cases, BRCA1 and BRCA2 mutations are associated with 80% and 65% lifetime risk of breast tumour diagnosis, respectively.
Outside of genetics, several risk factors for the disease have been established: increased age, family history of breast cancer, early-age menarche, late-age menopause, late-age first live birth, extended use of hormone replacement therapy, alcohol consumption, and living a sedentary lifestyle (Hankinson S. et al., 2008).
Like all cancers, breast tumors are categorized with a high degree of diversity of clinical characteristics, disease pathologies and therapeutic responses.
“Carcinoma in situ” means that the cancer is still restricted to its tissue of origin. There are two types of breast carcinoma in situ: lobular carcinoma in situ (LCIS) and ductal carcinoma in situ (DCIS), (Fig.I-5). In situ breast cancers are treated with resection surgery and radiation therapy.
However, women with LCIS are at higher risk of having a future occurrence of invasive cancer in either breast, and untreated DCIS will likely grow into an
Fig I-5. Ductal carcinoma in situ (DCIS): abnormal cells are found in the lining of a breast duct. Lobular carcinoma in situ (LCIS): abnormal cells are found in the lobules of the breast.
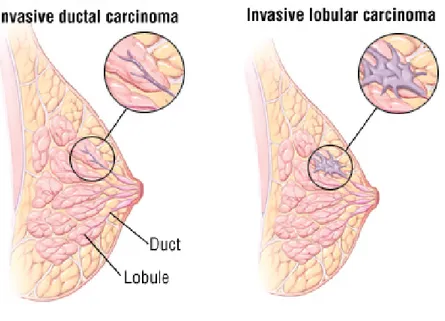
Invasive cancers are those that have spread from the ducts and lobules and into other breast tissue, fatty tissue, or surrounding lymph nodes. Invasive ductal carcinomas (IDC) and invasive lobular carcinomas (ILCs) are the most frequent diagnoses of invasive breast cancer diagnosed with a 80% and 15% frequency, respectively (Fig.I-6). There are four subtypes of IDC: colloidal, medullary, metaplastic, and tubular carcinomas. Among these, both colloidal and tubular carcinomas have a better prognosis because of their lower probability of metastasis.
Fig I-6. Invasive ductal carinoma and invasive lobular carcinoma
A third, and extremely rare type of invasive breast cancer is inflammatory breast cancer (IBC) and occurs in 1 to 3% of breast cancer diagnoses (Argani P. & Cimino-Mathews A., 2012).
The pathogenesis of breast cancer is largely dependent on interactions between malignant cells and components of the breast microenvironment. The malignant cell phenotype is regulated not only by autonomous signals originating from cancer cells, but also by the effects of the surrounding stromal cells, which influence mammary epithelial cell growth and differentiation. The close association between mammary epithelial cells and adipocytes may promote a more direct action of adipokines on that tissue (Körner A., 2007).
Obesity is associated with an increase in white adipose tissue and greatly alters the local and systemic secretion of biologically active adipocytokines. This
Due to the fact that pre- and postmenopausal breast cancers are essentially two different diseases, their connection with obesity is equally different. Several studies have identified either no or even an inverse relationship between obesity and premenopausal breast cancer (Stephenson G.D. & Rose, D.P., 2003). Reduced
ovarian production of estrogen in premenopausal obese women has been suggested as a reason for this association (Abrahamson P.E. et al., 2006).
Obesity has however been suggested as a risk factor for premenopausal breast cancer because of the relationship between adiposity and ER-negative breast cancers (Rose D.P. & Vona-Davis L., 2009). Indeed Daling and colleagues (2001)
found that, while premenopausal obese women do not have an elevated risk of developing cancer, obese premenopausal breast cancer patients had higher incidences of ER-negative, thus more malignant tumours, which resulted in longer treatments with less favourable outcomes. Hence obesity may not increase premenopausal breast cancer incidence rates, but may instead increase the severity of premenopausal breast cancer.
Obese postmenopausal women have an increased risk of developing breast cancer
(Abrahamson P.E. et al., 2006; Lahmann P.H. et al., 2004). It has been estimated that
women with a BMI over 40 kg/m2 are more than twice as likely to develop breast cancer compared to women with normal BMI (Calle E.E. et al., 2003).
However, several molecular causes for the relationship between obesity and breast cancer have been suggested (Lorincz A.M & Sukumar S. 2006). First, obesity may
increase the production of estrogen, which in turn can predispose to and promote progression of breast tumours (the estrogen connection). Second, obesity mediated hyperinsulinaemia may promote breast cancer, caused by the mitogenic
potential of insulin (the insulin connection). Third, obesity-related deregulation of adipokine secretion may promote breast cancer by adipocytes acting as mitogens or promoting an inflammatory state (the adipokine connection). It is unlikely that only one connection will be solely responsible for mediating the molecular connection. All three connections are probable contributors to the overall obesity-breast cancer relationship. Individually, one may outweigh the others, especially concerning the on-off contribution of the estrogen receptor. Lastly synergistic effects of these three connections may contribute to increase breast cancer risk (Fig.I-7).
Adipokines (leptin, adiponectin, and hepatocyte growth factor (HGF)) secreted from adipose tissue have come to be recognized for their contribution to the mechanisms by which obesity and related metabolic disorders influence breast cancer risk.
Leptin is a peptide hormone of 16 kDa, synthesized and secreted by adipocytes of white adipose tissue. It is closely related to fat mass (Bjørbaek C. et al., 1997; Dieudonne M.N. et al., 2002). Leptin acts at the level of hypothalamic centers as a
neuro-regulators of appetite, regulates thermogenesis and energy expenditure
(Zhang Y., et al., 1994; Szanto I. et al., 1999).
It also reduces intracellular levels of lipids in skeletal muscle, liver and pancreatic beta cells, thus improving insulin sensitivity (Minokoshi Y. et al., 2002).
In addition to these functions, recent studies support a possible role of leptin in the development and/or progression of certain types of tumors. In particular, leptin has been proposed as a “link cytokine” between obesity and breast cancer (Garofalo C. & Surmacz E., 2006). Leptin is required for normal development of the mammary gland and lactation (Neville M.C. et al., 2002), but can also contribute to mammary
tumorigenesis. In fact, many authors have shown the expression of the leptin gene both at the level of the normal and tumoral breast tissue.
Leptin stimulates growth, migration, and cell invasion of tumor cells in vitro and also enhances angiogenesis, manifesting its ability to promote the biological behaviour of tumor aggression. The role of leptin in mammary carcinogenesis is further supported by recent studies that have demonstrated that leptin directly transactivates estrogen receptor (ER)α (Catalano S. et al., 2004) and promotes in situ
estrogen production by increasing aromatase expression and activity in breast cancer cells (Catalano S. et al., 2003).
Another important adipokine that appears to be involved in the development of breast cancer is adiponectin.
In the mammary gland, epithelial cells are exposed to both circulating and locally produced adiponectin from adjacent adipocytes (Andò S. & Catalano S., 2012).
In contrast to leptin, epidemiological studies have demonstrated an inverse association between the serum adiponectin levels and breast cancer risk.
Particularly, breast tumors arising in patients with hypoadiponectinemia may have a more aggressive phenotype (large tumor size, high histological grade, estrogen receptor negativity, and increased metastasis), (Miyoshi Y. et al., 2003; Mantzoros C. et al., 2004). Recently it has been reported that low circulating adiponectin levels are
associated with a higher risk of breast cancer development, and that this association is independent of age, BMI, and hormonal and reproductive. Other studies described a significant negative correlation between BMI and plasma adiponectin levels in both men and women and that adiponectin levels are negatively correlated with percent body fat, waist-to-hip ratio and intra-abdominal fat (Weyer C. et. al., 2001; Andò S. & Catalano S., 2012).
The secretion of adiponectin into the bloodstream is not regulated by subcutaneous but rather by visceral adipose tissue (Körner A. et al., 2007).
I.4 Adiponectin
Adiponectin is a protein of molecular weight 30 kDa produced exclusively in white adipocytes. The molecule of human adiponectin consists of 244 amino acid residues; at the N-terminus there is an 18 amino acid long signal peptide followed by a short hypervariable region without homology to any known sequences and a collagen domain with 22 repeated motifs. C-terminal contains globular domain homologous to C1q molecule of complement cascade. C-terminal globular domain also shows homology with TNF-α trimeric cytokines family.
Adiponectin molecules are secreted from adipocytes as trimers (̴ 90 kDa; the basic unit), low molecular weight hexamers (̴180 kDa) and high molecular weight isoforms (12-18-mers; >400 kDa) (Fruebis J. et al., 2001).
In serum, adiponectin exists in its full-length form (fAdiponectin) that requires post-translational modifications for activity (e.g. hydroxylation and glycosylation), (Fig. I-8).
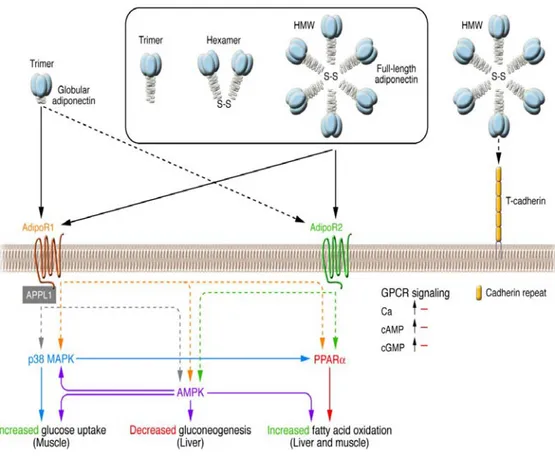
The cellular functions of adiponectin are mediated through the adiponectin receptor 1 (AdipoR1) and 2 (AdipoR2) and T-cadherin (Brochu-Gaudreau K. et al., 2010). AdipoR1 and AdipoR2 are integral membrane proteins containing 7 transmembrane domains but are structurally and functionally distinct from G protein-coupled receptors (Yamauchi T. et al., 2003). AdipoR1 presents high affinity for gAdiponectin and low affinity for fAdiponectin, and it is expressed ubiquitously but abundantly in skeletal muscle and endothelial cells. AdipoR2 has intermediate affinity for both forms of adiponectin and is predominantly expressed in the liver (Kadowaki T. & Yamauchi T., 2005). It has been demonstrated
that the globular form of adiponectin binds to AdipoR1 (Yamauchi T. et al., 2003), which, in turn, through the adaptor protein APPL1 interacting with the intracellular N terminus of AdipoR1, induces activation of MAPK through Src pathway (Mao X. et al., 2006; Lee M-H. et al., 2008). APPL1, which contains a pleckstrin homology domain, a phosphotyrosine- binding domain, and a leucin zipper motif, has emerged as an important element in AdipoR1/R2 signaling (Mao X. et al., 2006), (Fig.I-9).
Fig I-9. Signal transduction by adiponectin receptors
Adiponectin has a protective role against obesity-related disorders, including metabolic syndrome, type-2 diabetes, and cardiovascular disease (Brochu-Gaudreau K. et al., 2010). Unlike most of the other adipokines, serum adiponectin is inversely
correlated with body mass index (BMI) (Matsubara M. et al., 2002; Cnop M. et al., 2003). Circulating adiponectin levels are reduced in obesity and type 2 diabetes (Weyer C. et al., 2001) and mice lacking adiponectin develop insulin resistance, glucose
intolerance, hyperglycemia, and hypertension, all characteristics of metabolic syndrome (Kubota N. et al., 2003; Maeda N. et al., 2002).
A speculative explanation of the reduced adiponectin levels in obesity may be sustained by the enhanced production of cytokines that occurred in such
condition, and may contribute to the downregulatory effect on adiponectin secretion by adipose tissue (Tilg H. et al., 2006).
Another potential mechanism indicates a negative feedback of adiponectin on its own production and probably on the expression of its receptors during the development of obesity (Dalamaga M. et al., 2012). Recent experimental and clinical investigations suggested that low levels of plasma adiponectin are associated with an increased risk for obesity-related cancers, such as colon, prostate, endometrial, and breast cancer (Dalamaga M. et al., 2012; Kelesidis I. et al., 2006; Miyoshi Y., 2003).
II.1 Estrogens
Estrogens are the primary female sex hormones and play important roles in both reproductive and non-reproductive systems. The major sources of estrogens are the ovaries and the placenta (the temporary organ that serves to nourish the fetus and remove its wastes); additional small amounts are secreted by the adrenal glands and by the male testes.
Cholesterol is the parent molecule from which all ovarian steroid hormones are formed. Cholesterol is converted to pregnenolone, and pregnenolone is converted to progesterone. The steps in the conversion of progesterone to the main estrogens (estradiol and estrone) include the intermediate formation of several androgens (male sex hormones): dehydroepiandrosterone, androstenedione, and testosterone. Androgens are precursors of estrogens; they are converted to estrogens through the action of an enzyme known as aromatase. The ovaries are the richest source of aromatase, although some aromatase is present in adipose tissue, which is also an important source of estrogen in postmenopausal women. Estradiol, the most potent estrogen, is synthesized from testosterone. Estrone can be formed from estradiol, but its major precursor is androstenedione. Estriol, the weakest of the estrogens, is formed from both estrone and estradiol (Fig.II-1).
Fig.II-1 Estrogen synthesis
Estrogens are essential for the correct functioning of the reproductive system female and are essential for the proliferation and differentiation of normal breast. In fact, the reduction of estrogen levels, found in women after menopause, is associated with an increased risk of developing malignant breast. The estrogenic compounds also have beneficial effects on the heart and bone structure of the human organism, maintaining bone density and reducing the risk of fractures
(Watanabe T. et al., 1997). Several studies showed that these hormones affect the
centers of brain responsible for the maintenance and regulation of body temperature; they also play an important role in the central nervous, skeletal and cardiovascular systems.
Moreover, the estrogens are mainly responsible for the development of female secondary sexual characteristics, regulate the menstrual cycle and the pregnancy.
II.2 Estrogen Receptors
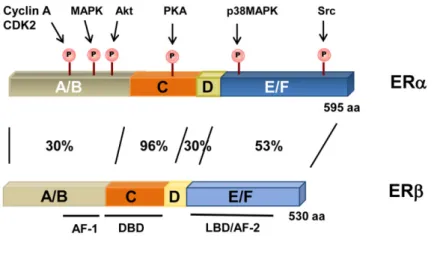
Natural human estrogens exert their biological effects via interaction with the two different isoforms of estrogen receptors, ERα, and ERβ. Both receptors belong to the superfamily of nuclear receptors, but are synthesized by different genes and possess peculiar structure and functions. The two isoforms are constituted by six domains (Edwards D.P., 2005), (Fig.II-2) and show high degree of sequence
homology (96%) in region that binds DNA, (DBD), but differ considerably in the N-terminal domain and in the AF-1 (activation function) and to a lesser extent in the LBD (53%).
Fig II-2. Estrogen receptors structure
ER contains two “activation functions” (AF) that interact with coactivators. AF-1 ligand-independent is within the N-terminal domain, whereas for AF-2 that is in the ligand binding domain (LBD), its activity is dependent on ligand-induced conformational changes. The relative contribution of each AF is cell and promoter
The DNA-binding domain (domain C) is highly conserved between ERα and ERβ and contains the protein domains responsible for the specific binding to DNA at sites characterized by the sequence AGGTCA. In the estrogen receptor, this domain consists of a sequence of about 60 amino acids.
The next domain, D (hinge region), is a less conserved and particularly flexible, containing sequences for the nuclear translocation.
The domain larger, moderately conserved, is the domain E or LBD (Ligand-Binding-Domain), responsible for the interaction with the ligand.
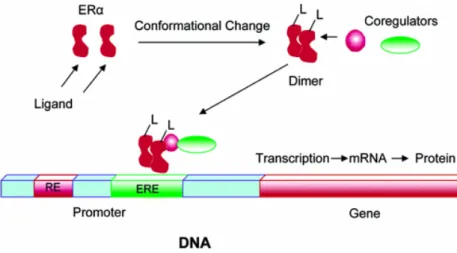
The mechanism of activation of ER starts with the interaction of the receptor with its ligand. This binding induces a conformational change in the structure of the receptor with the consequent detachment of protein stabilizers that are associated with receptor (Fig. II-3).
Fig II-3. Ligand-receptor interaction and activation of transcription
The hormone-receptor complex translocates to the nucleus and interacts with the sequences “estrogen-responsive” (ERE, Estrogen Responsive Elements). These regions are palindromic DNA sequences of 15 nucleotides consisting of a repetition, around a center of symmetry, of a same sequence reversed and
inverted. The sequence is recognized AGGTCAnnnTGACCT, in which the center of symmetry is composed of three nucleotides (nnn), (Clementi F. & Fumagalli G., 1999).
ERE sequences act as “enhancers” and amplify the transcription of genes downstream of palindromes, which code for proteins involved in physiological proliferative events (DNA replication, mitosis) or pathological (cancer development), (Lottering M.L. et al., 1992).
In addition to classic ERE-mediated activation mechanism, described above, are known other mechanisms that mediate the action of estrogen. One of these involves the activation of the estrogen receptor in a ligand-independent manner. In fact, growth factors such as IGF-I and EGF, are able to activate a pathway of intracellular kinases (MAPK) that induce the phosphorylation and the activation of ER, independently from the interaction with the ligand. The target domain of these phosphorylation events is the NH2-terminal in which the serine 118 (Ser 118) is often phosphorylated.
In some cell lines was identified a membrane estrogen receptor α whose activation occurs through a mechanism not genomic. In this case, estradiol binds to its membrane receptor determining the activation of complex transduction pathways and an immediate response in target tissues (Fig.II-4).
Fig. II-4. Mechanisms of activation of the estrogen receptor
ER ligands interact with ER subtypes in various parts of the human body (Fig.II-5). The abundance and distribution of the receptors will, in part, determine whether a ligand will have a particular effect. ERα and ERβ are known to be localized in the breast, brain, cardiovascular system, urogenital tract and bone
(Pearce S.T. &. Craig Jordan V., 2004). ERα is the main ER subtype in the liver, whereas ERβ is the main ER in the colon. ERα and ERβ may also localize to distinct cellular subtypes within each tissue. For example, within the ovary, ERα is largely present in the thecal and interstitial cells, whereas ERβ is predominantly in the granulosa cells (Hiroi H. et al., 1999; Sar M. & Welsch F., 1999). In the prostate,
ERβ localizes to the epithelium, whereas ERα localizes to the stroma (Weihua Z. et al., 2002).
Fig. II-5. Distribution of ERα and ERβ in the human body
Estrogen Receptor alpha
ERα was the first estrogen receptor cloned and it was isolated from MCF-7 human breast cancer cells in the late 1980s (Walter P. et al., 1985; Greene G.L. et al.,1986; Green S. et al., 1986). In accordance with its role as a transcription factor, this 66 kDa ERα, encoded by ESR1 gene on chromosome 6q25.1, localizes primarily to the nucleus. A 46 kDa isoform (hERα46) that lacks the first 173 amino acids of the 66 kDa form of ERα has also been preliminarily characterized (Flouriot G. et al., 2000). In
addition, several ERα splicing variants have been described (Murphy L.C. et al.,1997; Poola I. et al., 2000), but whether they are expressed as proteins that have a biological function remains unknown. Another source of variability in receptor function, and perhaps also dysfunction, is ERα gene polymorphisms. ERα polymorphisms have been linked to increased litter size in pigs (Short T.H. et al., 1997), breast cancer
(Mizunuma H. et al., 1997), hypertension (Lehrer S. et al., 1993), spontaneous abortion (Schachter B.S. & Lehrer C., 1994), and body height (Lehrer S. et al., 1994).
II.3 Estrogens and breast cancer
Epidemiological and experimental evidences implicate estrogens in the aetiology of breast cancer. Most established risk factors for breast cancer in humans are thought to influence risk through hormone-related pathways (Pike M.C. et al., 1993), increased concentrations of endogenous estrogens are strongly associated with increased risk for breast cancer in postmenopausal women (Cuzick J. et al., 2003),
and trials have shown that the anti-estrogens tamoxifen and raloxifene reduce the incidence of breast cancer (Dao T.L., 1981). Furthermore, experimental studies in
animals have shown that estrogens can promote mammary tumours, and a decrease in exposure to estrogens, by performing an oophorectomy or giving an anti-estrogenic drug, has the reverse effect (Henderson B.E. et al., 2000). However, the
effects of estrogen alone do not fully account for the relationships observed between breast cancer and hormone-related risk factors. In many cases, this type of pathology, as reported , is hormone-dependent.
Estrogens are essential compounds for the growth of mammary cell that has undergone neoplastic transformation. The development and growth of the tumor are stimulated by estrogen, which exert a mitogen action on cells of the mammary gland (Dickson R.B. & Lippman M.E., 1988): transformed cells send wrong signals to
the surrounding cells and estrogen excess products are able to induce a mitogenic effect on the surrounding tissue.
Therefore, through the interaction with its receptors, these steroid hormones are able to stimulate the proliferation of normal and transformed cells through the induction of proteins involved in nucleic acid synthesis and the activation of genes that regulate cellular division.
The rise of cell proliferation may increase the possibility of errors in DNA repair with the result of an accumulation of mutations. All of this can contribute to the modification of a normal cell into a cell hyperplastic up to the neoplastic transformation.
In addition to estrogens, other hormones may contribute to breast cancer, for example, progesterone, androgens, glucocorticoids, prolactin, thyroid hormones insulin, IGF-1, IGF-2, fibroblast growth factor (FGF) and epidermal growth factor (EGF), (Osborne C.K. & Arteaga C.L., 1990; Evans R.M., 1988). In normal conditions, the
interaction of growth factors, cytokines and hormones with specific membrane receptors activates a cascade of intracellular signals, rising the activation and/or inactivation of numerous and specific genes (Wahli W. & Martinez E., 1991; Eerola H. et al., 2002).
Before menopause most circulating estrogen is periodically produced by ovaries, according to menopausal status. Estrogen concentrations increase in response to luteinising hormone and follicle stimulating hormone secreted by the pituitary gland and decrease in response to progesterone secreted by the corpus luteum
(Nussey S.S. & Whitehead S.A., 2001). It stimulates differentiation of the endometrium
and sexual drive, preparing the female body for the reception of a fertilised oocyte. Menopause is characterised by cessation of the menstrual cycle, due to
termination of the delicate interplay of oscillating reproductive hormones, including estrogen.
In postmenopausal obese women adipose tissue is the main source of estrogen, in form of estrone, and serum estrogen concentrations are directly related to BMI
(Grodin J.M. et al., 1973). This increase in estrogen concentrations with increased BMI is caused by an overexpression of the aromatase enzyme in stromal adipose tissue cells (Cleland W.H. et al., 1985).
Breast cancer risk is increased with increased exposure to estrogen. Estrogen exposure is measured by age at menarche and menopause, hormone replacement therapy and the use of estrogen containing contraceptive (Feigelson H.S. & Henderson B.E., 1996). Cohort studies have positively linked estrogen concentrations with
breast cancer risk (Berrino F. et al., 1996; Toniolo P.G. et al., 1995). Exposure of healthy
breast epithelial cells to estrogen increased their potential to become malignant
(Dickson R.B. & Lippman M.E. 1986). Furthermore breast cancers of obese
postmenopausal women are more often ER-positive (Rose D.P. et al., 2004).
The exact actions by which estrogen predisposes to breast cancer development and contributes to breast cancer progression are not entirely known. Estrogen increases cell proliferation in healthy epithelial cells and ER-positive breast cancer cells (Dickson R.B. & Stancel G.M., 2000). Thus anti-estrogens and
ER-inhibitors decrease growth of ER-positive breast tumours and are used in treatment of these tumours (Pearson O.H. et al., 1982). Since breast tissue is composed
of up to 90% of adipose tissue, a direct cross-talk between adipose cells and breast cancer cells has been suggested (Bulun S.E. et al., 1994). Furthermore cancer cells
may cross-talk to the surrounding adipose tissue to produce more estrogen or even produce it themselves (Brodie A. et al., 1997; Chen S. et al., 2002).
Although risk for breast cancer increases with age, there is a marked decline in the rate of increase in risk with age following the loss of ovarian function, either as a result of a bilateral oophorectomy or due to the menopause (Hunter D.J. et al., 1997; Helmrich G. et al. 1983), showing that hormone production by the ovaries is a crucial
risk factor for breast cancer in humans.
Epidemiological studies have also firmly established associations between risk for breast cancer and other reproductive factors, including nulliparity (having no children) or low parity, late age at first birth, and breast feeding.
A mechanism involving estrogens, and probably other hormones, has been proposed to explain both the transient increase in risk and the reduced risk in the long term associated with pregnancy. The very high serum levels of estrogens and progesterone during pregnancy stimulate growth of the mammary epithelium and also promote the differentiation of epithelial tissue, reducing the number of epithelial structures most vulnerable to malignant transformation. Thus, the short-term effect of pregnancy may be to promote the growth of cancer if a malignant transformation is present in the breast, but in the longer term the risk for breast cancer is reduced. In contrast, malignant transformations are more likely to have accumulated in the breast tissue of older women, and there might therefore be a higher risk of cancer developing in these women when breast cells are stimulated to divide during pregnancy. The effect of age at first birth highlights the importance of timing of exposure as a critical determinant of the effects of steroid
risk for breast cancer, above and beyond that associated with multiple pregnancies (4% for every 12 months of breast feeding). This effect might be due to the suppression of ovulation, reducing exposure to ovarian hormones (Ewertz M. et al., 1990).
III.1 Cell culture
Cells utilized in the studies were obtained from American Type Culture Collection, where they were authenticated, stored according to supplier’s instructions, and used within 4 months after frozen aliquots resuscitations.
MCF-7, T47D, and HeLa cells were cultured as described (De Amicis F. et al., 2013).
MDA-MB-231 were maintained in DMEM/F-12 containing 5% fetal bovine serum (Sigma). SKBR-3 breast cancer cells were cultured in RPMI 1640 without phenol red supplemented with 10% fetal bovine serum (FBS). Before each experiment, cells were grown in phenol red-free media, for at least 24 h and then treated with 1 and 5 μg/ml recombinant human gAdiponectin/ gAcrp30 (R&D Systems) as described.
III.2 Cell proliferation assays
MTT assays: after 3 days of treatment, cell proliferation was assessed by MTT
assay as reported (Rovito D. et al., 2013) and expressed as fold change relative to
vehicle-treated cells. Soft agar growth assays and anchorage-independent growth assays were conducted as previously described (Panno M.L. et al., 2012). Data represent 3 independent experiments performed in triplicate.
Three-dimensional spheroid culture and cell growth assays: for
three-dimensional cultures, MCF-7 cells plated on 2% agar- coated plates were untreated or treated with adiponectin 1 and 5 μg/ml. After 48 h, three-dimensional cultures were photographed using a phase-contrast microscope (Olympus), and the cell numbers were evaluated as previously reported (Mauro L. et al., 2007).
III.3 RNA silencing
MCF-7 cells were transfected with RNA duplex of stealth siRNA targeted for the human ERα (SI02781401), IGF-IR (SI01074017), or APPL1 (GS26060) mRNA sequence or with a control siRNA (Qiagen, Milan, Italy) that does not match with any human mRNA, used as a control for non-sequence-specific effects. Cells were transfected using RNAiFect Transfection Reagent (Qiagen) as recommended by the manufacturer with minor modifications (Guido C., et al., 2012). After 5 h the
transfection medium was changed with serum-free medium, and then the cells were exposed to treatments.
III.4 Western blotting and immunoprecipitation
Cells were lysed in ice-cold lysis buffer containing 50 mM HEPES (pH 7.5), 150 mM NaCl, 1.5 mM MgCl2, 1 mM EGTA, 10% glycerol, 1% Triton X-100, and a mixture of protease inhibitors (aprotinin, PMSF, and sodium orthovanadate). The protein content was determined using Bradford dye reagent (Bio-Rad). Equal amounts of total protein were resolved on SDS-polyacrilamide gels and transferred onto a nitrocellulose membrane as described (Mauro L. et al., 2009). Blots
were incubated overnight at 4°C and probed with the specific primary antibodies. Immunoblotting was performed as reported (Guido C., et al., 2012). For
immunoprecipitation, 500 μg of total protein lysates were precleared for 1 h with protein A/G-agarose (Santa Cruz Biotechnology), incubated with primary Abs at 4°C for 18 h in HNTG buffer (20 mM HEPES, pH 7.5, 150 mM NaCl, 0.1%
The immunoprecipitated proteins were washed 3 times with HNTG buffer, separated on SDS-PAGE, and processed by western blotting. The following antibodies were used: AdipoR1, ERα, c-Src, APPL1, EGFR, Cyclin D1 and GAPDH from Santa Cruz Biotechnology; pERα Ser118, pERαSer167, total MAPK and phosphorylated p42/44 MAPK (Thr202/Tyr204), IGF-IR, and pIGF-IR Tyr1131 from Cell Signaling Technology.
III.5 Kinase activity of c-Src
To assay for c-Src kinase activity MCF-7 cells were grown in PRF-SFM for 24 h and stimulated with 1 or 5 μg/ml adiponectin for 15 min. Cells were then lysed with RIPA lysis buffer (500 mM TRIS-HCl, 150 mM NaCl, 1% Triton X-100) containing 10 mM PMSF, 1.5 mg/ml aprotinin, and 2 mg/ml leupeptin and immunoprecipitated. A Protein G-agarose and an anti-APPL1 antibody complex were prepared to immunopurify the lysates. A measure of 1 μg of rabbit polyclonal anti-APPL1 antibody and 30 μl of protein G-agarose (Santa Cruz, Biotechnology) were incubated at 4°C for 1 h in 500 μl of PBS with a tube rotator. The complexes were microfuged and washed with 1 ml of lysis buffer for 3 times. At the end, 1000 μg of each cell lysates were added to the Protein G-agarose/anti-APPL1 antibodies and incubated at 4°C for 2 h rotating. The proteins/complexes were centrifuged and washed 3 times with the kinase buffer (200 mM PIPES, 100 mM MnCl2). c-Src kinase activity was assayed by a standard in vitro kinase assay using acidified enolase as substrate. The incubation was performed in a total volume of 50 μl composed of the immunoprecipitates and the kinase buffer containing 5 mM ATP, 1 μC of [γ32P]ATP, and 2.5 μg of acid denatured rabbit
muscle enolase (Sigma) as exogenous substrate. Samples were incubated at 30°C for 10 min then reduced with an equal volume of 2× SDS Laemmli sample buffer (Sigma) and aliquots of them (40 μl) were submitted to SDS-PAGE (acrylamide 11%). The dried gel was exposed to X-omat film (Kodak) for 12 h. The gels were stained with Coomassie blue to ensure that an equal amount of enolase was present in all samples.
III.6 Plasmids
XETL plasmid, which carries firefly luciferase sequences under the control of an estrogen response element upstream of the thymidine kinase promoter, was provided by Dr Picard, University of Geneva. S104/106/118A-ER, S118A-ER, and S167A-ER plasmids were mutated in serine residues 104, 106, 118, or 167 to Ala, respectively (a gift from Dr DA Lannigan, University of Virginia); HE241G ERα plasmid mutant that lacks a nuclear translocation signal (NLS) (Δ250-303) (kindly provided by Dr P Chambon, CNRS-INSERM, University of Louis Pasteur). mERα plasmid containing the AF-2/ligand binding domain and a signal that targets this portion of the receptor to the plasma membrane (generously provided by Dr ER Levin, University of California).
III.7 Transfections and luciferase assays
MCF-7 cells were transfected using the FuGENE 6 reagent as recommended by the manufacturer with the mixture containing 0.5 μg of reporter plasmid XETL.
pSG5/HE15 (AF-1), pSG5/HE19 (AF-2), HE241G, S104/106/118A-ER, S118A-ER, or S167A-ER plasmids. Six hours after transfection, treatments were added, and cells were incubated for 48 h. A concentration 10 μM, of ICI 182,780 (Tocris Bioscience), Compound C (Enzo Life Sciences), H89 and PP2 (Sigma), PD98059 (Calbiochem), was used. TK Renilla luciferase plasmid (25 ng/well) serves to normalize the efficiency of the transfection. Firefly and Renilla luciferase activities were measured using a Dual Luciferase kit. The firefly luciferase data for each sample were normalized on the basis of transfection efficiency measured by Renilla luciferase activity as reported above (De Amicis F. et al., 2009).
III.8 Immunocytochemical staining
Paraformaldehyde-fixed MCF-7 cells were used for immunocytochemical staining. Endogenous peroxidase activity was inhibited by hydrogen peroxide, and nonspecific sites were blocked by normal horse serum. ERα immunostaining was then performed using as primary antibody a mouse monoclonal antiserum, whereas a biotinylated horse-anti-mouse IgG was utilized as secondary antibody. Avidin-biotin-horseradish peroxidase complex (ABC complex/horseradish peroxidase) was applied, and the chromogen 3,3’-diaminobenzidine tetrachloride dihydrate was used as detection system. TBS-T (0.05 M TRIS- HCl plus 0.15 M NaCl, pH 7.6 containing 0.05% Triton X-100) served as washing buffer. The primary antibody was replaced by normal mouse serum at the same concentration in control experiments on MCF-7 cultured cells.
III.9 Reverse transcription-PCR assay
The gene expression of ERα, cathepsin D, pS2, Cyclin D1 and 36B4 was evaluated by reverse transcription PCR (RT-PCR) method as described (Casaburi I., et al., 2012). Primer sequences include:
estrogen receptor α (ERα), forward 5′-TGATTGGTCTCGTCTGGCG-3′ and reverse 5′-CATGCCCTCTACACATTTTCCC-3′;
Cathepsin D (CatD), forward AACAACAGGGTGGGCTTC-3′ and reverse 5′-TTTGAGTAGTCAAAGTCAGAGC-3′;
Trefoil factor 1/pS2 (pS2), forward 5′-TTCTATCCTAATACCATCGACG-3′ and reverse 5′-TTTGAGTAGCAAAGTCAGAGC-3′;
Cyclin D1 forward TCTAAGATGAAGGAGACCATC-3’ and reverse 5’-GCGGTAGTAGGACAGGAAGTTGTT-3’;
36B4, forward 5′-CTCAACATCTCCCCCTTCTC-3′ and reverse 5′- CAAATCCCAT ATCCTCGT-3′.
Equal amounts of PCR product were electrophoresed on 1% agarose gels and visualized by ethidium bromide staining.
III.10 In Vivo experiments
Female 45-day-old athymic nude mice (nu/nu Swiss; Harlan Laboratories Milan, Italy) were maintained in a sterile environment. MDA-MB-231 and MCF-7 cells were pretreated with or without 1 and 5 μg/ml recombinant human gAdiponectin/gAcrp30 (R&D Systems) for 72 h. At day 0, estradiol pellets (1.7
were subcutaneously implanted into the intrascapular region of the mice receiving inoculation of ERα-positive MCF-7 cells. The next day, 5 x 10⁶ cells were
inoculated subcutaneously in 0.1 ml of Matrigel (BD Biosciences, Bedford, MA). Xenograft tumor growth was monitored twice a week by caliper measurements, and tumor volumes (in cubic centimeters) were estimated by the following formula: TV = a x (b2)/2, where a and b are tumor length and width, respectively, in centimeters. At day 35, the animals were sacrificed following standard protocols; the tumors were dissected from the neighboring connective tissue, frozen in nitrogen, and stored at -80°C for further analyses. All the procedures involving animals and their care were conducted in accordance with the institutional guidelines and regulations at the University of Calabria, Italy. The project was approved by the local ethical committee.
III.11 Histologic Analysis
Formalin-fixed, paraffin-embedded sections of tumor xenografts were sectioned at 5 m, and stained with hematoxylin and eosin Y (Bio-Optica, Milan, Italy). The epithelial nature of the tumors was verified by immunostaining with mouse monoclonal antibody directed against human cytokeratin 18 (Santa Cruz Biotechnology, Milan, Italy), and nuclei were counterstained with hematoxylin. For negative controls, non-immune serum replaced the primary antibody.
III.12 Statistical analysis
Each datum point represents the mean ± S.D. of at least three independent experiments. Data were analyzed by Student’s t test using the GraphPad Prism 4 software program. Statistical comparisons for in vivo studies were made using the Wilcoxon-Mann-Whitney test. P<0.05 was considered as statistically significant.
IV. 1 Adiponectin induces divergent effects on breast cancer cell
proliferation
We first investigated the effect of adiponectin (1 and 5 μg/ ml) on cell proliferation in both estrogen receptor α-negative (ERα−) as well as positive (ERα+) breast cancer cell lines, by MTT growth assays. After 3 days of treatment, adiponectin inhibited cell proliferation of ERα− MDA-MB-231 and SKBR-3 cells, whereas it induced growth in MCF-7 and T47D cells (Fig. IV-1A), which express high levels of ERα (Sflomos G. & Brisken C., 2013). The same dichotomic
pattern has been reproduced in anchorage-independent growth assays, using both ERα+ and ERα− breast cancer cells (Fig. IV-1B). We then performed three-dimensional MCF-7 cell cultures, which closely mimic some in vivo biologic features of tumors (Mauro L. & Surmacz E., 2004). Our results demonstrated that adiponectin treatment enhanced cell-cell adhesion (Fig. IV-1C) as well as increased cell growth (Fig.IV-1D) compared with untreated cells. In order to investigate the role of ERα in modulating the effect of adiponectin on cell proliferation, in MCF-7 cells ERα was knocked down by siRNA or abrogated by the potent and specific antiestrogen ICI 182,780. In these conditions the adiponectin-induced cell proliferation was completely reversed (Fig. IV-1E). These results address how adiponectin may affect breast cancer growth through the involvement of ERα.
Fig IV-1. Effects of adiponectin on breast cancer cell growth. (A) MTT growth assays in
MCF-7, T47D, MDA-MB-231, and SKBR-3 cells treated with vehicle (C) or adiponectin 1 (A1) or 5 μg/ml (A5) for 72 h. Cell proliferation is expressed as fold change ± SD relative to vehicle-treated cells and is representative of 3 different experiments each performed in triplicate. (B) Soft agar growth assay in MCF-7 and MDA-MB-231 cells plated in 0.35% agarose and treated as indicated above. After 14 d of growth colonies >50 μm diameter were counted. (C) MCF-7 three-dimensional cultures were untreated or treated as indicated for 48 h and then photographed under phase-contrast microscopy. (D) Cell numbers obtained from three-dimensional spheroids in MCF-7 cells treated as indicated for 48 h. (E) MCF-MCF-7 cells exposed to ICI 182 MCF-780, or transfected in suspension with 30 nM siRNAs/well (ERα siRNA or a scrambled siRNA for control samples), were treated with vehicle (C) or A1 or A5 for 72 h before testing cell viability using Mtt assay. Results are expressed as fold change ± SD relative to vehicle-treated cells and are representative of 3 different experiments, each performed in triplicate. *P < 0.05 compared with vehicle.
IV.2 Effect of adiponectin on ERα non-genomic signal
The biological actions of ERα are mediated by non-genomic action outside of the nuclear compartment and by genomic effects via nuclear ERs (Simoncini T. & Genazzani A.R., 2003). The non-genomic effects lead to the rapid activation of the
MAPK signaling pathway. Both the genomic and non-genomic actions of ERα play pivotal roles in ERα-induced cancer cell proliferation and survival. Thus, we investigated the possible cross-talk existing between membrane ERα transductional pathways and adiponectin receptor, since both signaling appear to converge to MAPK cascade. Indeed, it has been demonstrated that AdipoR1 binds to the adaptor protein APPL1 (Mao X. et al., 2006) and induces activation of MAPK through Src pathway (Lee M-H., et al., 2008). For instance, c-Src is also an initial and
integral crossroad of different membrane signalling events mediated by the ERα as well as by its cross-talk with growth factors. Thus, we found reasonable to verify whether AdipoR1/APPL1 may interact with other membrane signalling involved in breast cancer cell growth and progression. We demonstrated for the first time how, in basal conditions, APPL1 coimmunoprecipitated with AdipoR1, ERα, IGF-IR, and c-Src, but not with EGF-R at both 15 min (Fig. IV-2A) and 48 h (Fig. IV-2B). These interactions appeared enhanced by adiponectin exposure (Fig. IV-2A e 2B). Figure IV-2C shows the in vitro effect of the protein complex on Src kinase activity. MCF-7 cell lysates were immunoprecipitated with an anti-APPL1 antibody, and the Src kinase activity was measured using the exogenous acid-treated enolase as substrate in the absence and in the presence of adiponectin
phosphorylation of enolase. Furthermore, we observed an increase of IGF-IR phosphorylation after 15 and 30 min of adiponectin treatment, which was reduced after knockdown of ERα (Fig. IV-2D). In MCF-7 cells we observed a rapid activation of MAPK by adiponectin (Fig. IV-2E). To determine the mechanism through which AdipoR1 stimulates MAPK, we employed a panel of RNA silencers targeting ERα, IGF-IR, and APPL1 (Fig. IV-2F), or selective inhibitor targeting Src family kinase or PKA. We observed that MAPK activity was abrogated in the presence of all these agents (Fig. IV-2E), suggesting that MAPK cascade upon adiponectin exposure requires APPL1, ERα, IGF-IR, c-Src, and PKA activity.
Fig IV-2. Adiponectin induces MAPK activation through the formation of a multimeric protein complex. Five hundred micrograms of protein lysates from MCF-7 cells, untreated (C) or
treated with A1 or A5 for 15 min (A) or 48 h (B), were immunoprecipitated with an APPL1 antibody and then blotted with the indicated antibodies on the right. To verify equal loading, the membrane was probed with anti-APPL1 antibody. Normal rabbit IgG was used as a negative control to precipitate A5-treated samples. Numbers on top of the blots represent the average fold change vs. untreated cells. One of three similar experiments is presented. (C) MCF-7 cells, treated with adiponectin for 15 min, were lysed and immunoprecipitated with an anti-APPL1 antibody/protein A/G complex and assayed for c-Src-kinase activity using acid-treated enolase as described in “Materials and Methods”. These results are representative of three independent experiments. c-Src and enolase position is indicated. (D) pIGF-IRTyr1131 levels in MCF-7 cells
treated with vehicle (−) or A1 and A5 as reported in absence or presence of ERα siRNA. (E) Total cellular proteins were isolated from MCF-7 cells in the absence or presence of ERα, IGF-IR, or APPL1 siRNA or pre-treated with PP2 or H89 and treated with A1 and A5. pMAPK, levels were evaluated by immunoblotting. Total MAPK was used as a loading control. (F) ERα, IGF-IR, and APPL1 levels were shown as control of silencing.
The role of ERα membrane signal in the above reported membrane complex emerges from the evidence that in ERα− MDA-MB-231 cells, adiponectin was no longer able to induce MAPK phosphorylation (Fig. IV-3A). However, when these cells were transfected with a membrane ERα (mERα) construct, which consists solely of the AF-2/ligand binding domain of ERα, adiponectin short exposure was able to upregulate MAPK activity (Fig. IV-3B).
Fig IV-3. Time course of MAPK activation upon adiponectin exposure in MDA-MB-231 cells ectopically expressing membrane ERα. MDA-MB-231 (A) and MDA-MB-231 transfected with
a plasmid codifying for membrane ERα (B) were serum-starved for 24 h followed by treatment with adiponectin 1 or 5 μg/ml for the indicated times. Western blots show the phosphorylation status of MAPK. Total MAPK is used as a loading control. One of three similar experiments is presented.
IV.3 Adiponectin transactivates ERα through MAPK signaling
Several studies in recent years suggest that membrane-initiated signaling can converge into genomic events, leading to more long-term consequences. For instance, in MCF-7 breast cancer cells adiponectin revealed an induced MAPK activation still after 48 h treatment (Fig. IV-4A). Since MAPK is involved in enhancing ERα functional activation in a ligand-independent manner, we wondered whether adiponectin was able to modulate ERα transactivation. In MCF-7 cells exposed to adiponectin for 48 h, a significant activation of the estrogen-responsive gene XETL was observed (Fig. IV-4B). Similar results were reproduced in ER-negative HeLa cells ectopically expressing ERα and transfected with XETL (Fig. IV-4B). In the presence of the MAPK inhibitor PD98059, the direct capability of adiponectin in transactivating ERα was completely lost. When we tested different inhibitors of signaling converging on MAPK activation, we observed how PKA and c-Src inhibitors, H89 and PP2 respectively, were able to prevent adiponectin-induced ERα transactivation (Fig. IV.4C). Moreover, knocking down of IGF-IR exerted similar effects (Fig. IV.4D). These results address MAPK signaling as crucial in modulating ERα transactivation upon adiponectin exposure. In addition, we also studied which functional domain was involved in ERα transactivation by adiponectin.
Fig IV-4. Effects of adiponectin on ERα transactivation. (A) Total cellular proteins were
isolated from MCF-7 cells treated with A1 and A5 for 48 h. pMAPK, levels were evaluated by immunoblotting. Total MAPK was used as a loading control. (B) MCF-7 cells were transfected with the luciferase reporter plasmid XETL. HeLa cells were cotransfected with XETL and HEGO plasmids. The cells were untreated or treated for 48 h with A1 and A5 or 100 nM E2, used as
positive control. (C) MCF-7 cells were transfected with the luciferase reporter plasmid XETL. The cells were untreated or treated for 48 h with A1 and A5 or in combination with Compound C (CC), H89, PP2, or PD98059. *P < 0.05 compared with control (−); P < 0.05 compared with A1; ○P < 0.05 compared with A5. (D) MCF-7 cells were transfected with XETL plasmid in the absence or presence of IGF-IR siRNA and treated with adiponectin for 48 h. *P < 0.05 compared with control (−). The values represent the means ± SD of three different experiments. In each experiment, the activities of the transfected plasmids were assayed in triplicate transfections.
To this aim, HeLa cells were cotransfected with the XETL reporter gene and plasmids codifying for AF-1 or AF-2 domain (Fig. IV-5A). The treatment with adiponectin induced an increased transcriptional activation only in transfected cells bearing the plasmid codifying for AF-1 domain (Fig. IV-5B). These data demonstrate that the N-terminal AF-1 domain is essential in mediating the adiponectin response. Moreover, the activation of ERα occurred at the genomic level, as demonstrated by trasfecting HeLa cells with the plasmid HE241G, encoding ERα lacking the nuclear localization sequence (Fig. IV-5B). The involvement of AF-1 domain in the activation of ERα by adiponectin was confirmed cotransfecting HeLa cells with XETL and with either HEGO or different plasmids in which ERα was mutated in specific phosphorylation sites, such as Ser-104/106/118A-ER or S118A-ER or S167A-ER (Fig. IV-5C), which are effectors of phosphorylative signaling. As shown in figure IV-5D, in transfectants with either Ser-104/106/118A-ER or S118 mutants, adiponectin was no longer able to elicit any substantial activation on ERE luciferase signal as compared with the cells bearing wild-type ERα. In contrast, the activation still persisted in cells transfected with S167 mutant (Fig. IV-5D). Western blotting analysis confirmed how adiponectin enhanced the phosphorylation of ERα at Ser118, while it was unable to affect phosphorylation at Ser167 (Fig. IV-5E). The biological correlates of these events reproduce the classic features of ERα transactivation in breast cancer cells.
Fig IV-5. Effects of adiponectin on ERα functional domains. (A and C) Schematic illustration
of ER constructs used for the experiments. HEGO is a wild-type ER-expressing vector that encodes a 595-amino acid protein. HE15-(1-282) contains AF-1 and the DNA binding domain (DBD). HE19-(179-95) contains DBD, and AF-2 domains. HE241G encodes a mutated ERα, which has the nuclear localization sequence deleted (250-303). ER plasmids mutated in serine residues 104, 106, 118, and 167 to Ala. (B) HeLa cells were transiently cotransfected with XETL and either HEGO or PSG5/HE15 (AF-1) or PSG5/HE19 (AF-2) or HE241G plasmids. (D) HeLa cells were transiently cotransfected with XETL and either HEGO or 104/106/118A-ER or Ser-118A-ER or Ser-167A-ER. The cells were treated for 48 h in the absence (C) or in the presence of A1 and A5 or E2 (100 nM) used as positive control. The values represent the means ± SD of three
different experiments. In each experiment, the activities of the transfected plasmids were assayed in triplicate transfections. *P < 0.05, **P < 0.01 compared with (C). (E) Total extracts from cells treated with A1 or A5 for 30 min were analyzed for phosphorylation of serines 118 and 167 (pS118 and pS167) and expression of ERα by immunoblot analysis. GAPDH was used as a control for equal loading and transfer.
In MCF-7 cells cultured in serum deprivation conditions for 96 h, ERα immunoreactivity was no longer detectable in the control, whereas treatment with adiponectin for 24h induced a strong ERα immunoreactivity in the nuclear compartment (Fig. IV-6A). These results show that adiponectin mimics the effect of estradiol on ERα compartmentalization in breast cancer cells. In addition, in MCF-7 cells, we observed a significant downregulation of ERα mRNA and protein levels after adiponectin treatment (Fig. IV-6B and C), which is a typical hallmark of the receptor activation by an agonist. Moreover, adiponectin was able to increase the expression of classic estrogen-dependent genes, such as Catepsin D and pS2 (Fig. IV-6D), providing further evidence for the ability of this adipokine to transactivate ERα.
Fig IV-6. Adiponectin actions on cellular localization and expression of ERα. (A) MCF-7 cells
were incubated in serum-free medium for 96 h and then treated with vehicle (C), A1, A5, or 100 nM E2, used as positive control, for 24 h. No immunodetection was observed replacing the anti-ER
antibody with an irrelevant mouse IgG (NC). Each experiment is representative of at least 10 tests. (B) RT-PCR of ERα mRNA. MCF-7 cells were stimulated for 48 h with A1 and A5 or E2 (100
nM); 36B4 mRNA levels were determined as a control. (C) Immunoblot of ERα from MCF-7 cells treated as above; GAPDH serves asloading control. (D) RT-PCR of Catepsin D (CatD) and pS2 mRNA. MCF-7 cells were treated as reported. The histograms represent the mean ± SD of three separate experiments, in which band intensities were evaluated in terms of optical density arbitrary units and expressed as the percentage of the control assumed as 100%. *P<0.05 vs. control.
IV.4 Effects of adiponectin on breast cancer tumor cell growth in
vivo
Finally, we evaluated the effects of adiponectin on the development of breast carcinomas in nude mouse models. MDA-MB-231 and MCF-7 cells were pretreated with or without adiponectin (1 and 5 μg/ ml) for 72 h and then injected into the intrascapular region. All the in vivo procedures were well tolerated because no change in body weight or in food and water consumption was observed together with no evidence of reduced motor function. In addition, no significant difference in the mean weights or histologic features of the major organs (liver, lung, spleen, and kidney) after sacrifice was observed between vehicle-treated mice and those that received pre-treated cells. The in vivo data showed that on day 35 adiponectin treatment induced a significant reduction (60 and 40% at doses of 1 and 5µg/ml, respectively) in tumor volume in mice injected with MDA-MB-231 cells (Fig. IV-7A), whereas an increased tumor growth (54 and 109% at doses of 1 and 5µg/ml, respectively) was observed in the animal groups receiving pretreated MCF-7 cells (Fig. IV-7B).
Fig IV-7. Effects of adiponectin on the growth of breast cancer cell-derived tumor in nude mice. MDA-MB-231 (A) and MCF-7 (B) cells were untreated or pretreated with adiponectin 1
(A1) or 5 (A5) g/ml for 72 h and then implanted into the intrascapular region of female nude mice. Tumor growth was monitored by measuring the visible tumor sizes at various time points. Representative images of MDA-MB-231 and MCF-7 xenograft tumors collected at 35th days are
shown. n = 8 mice per group, from three independent studies. *p<0.05 versus control group.
To distinguish the xenograft from the mouse tissue we performed immunostaining on xenograft sections with hematoxylin and eosin. As evidenced in the Supplemental Figure 1A, histological examination of MDA-MB-231 and MCF-7 xenografts revealed that tumors were primarily composed of tumor epithelial cells. Moreover, the epithelial nature of the tumors was verified by immunostaining with antibody direct against human cytokeratin 18 (Fig. IV-8).
Fig IV-8. Staining of MDA-MB-231 and MCF-7 xenograft tumors. Representative tumor
sections from mice at 35th days were formalin fixed, paraffin embedded, sectioned, and stained
with hematoxylin and eosin Y (A) or incubated with a mouse monoclonal antibody directed against human cytokeratin 18 (B). Cytokeratin 18 expression appears as brown cytoplasmic staining.
To determine whether the effects in tumor growth induced by adiponectin were associated with any changes in the mitotic index, we evaluated in tumors the expression of Ki-67 as a marker of proliferation. Sections of tumors from adiponectin-treated mice exhibited a reduced expression of Ki-67 in MDA-MB-231 cells (Fig.IV-9A), while increased levels were observed in MCF-7-derived tumors compared with that in tumors from control mice (Fig. IV-9B).
Fig IV-9. Staining of Ki67 in xenograft tumors. Representative tumor sections at 35th days from
mice injected with MDA-MB-231 (A) or MCF-7 (B) cells were formalin fixed, paraffin embedded, sectioned, and incubated with a mouse monoclonal antibody directed against Ki67.
The binding of adiponectin to its receptors provokes the activation of AMPK via APPL1 which is considered a cellular energy sensor that is stimulated by an increase of intracellular AMP/ATP ratio (Obeid S. & Hebbard L., 2012). On the other hand the proliferative effect could be also explained by the activation of ERK1/2 MAPK which is crucial for cell cycle initiation, cell growth and survival (Dalamaga M. et al., 2012).
Focusing our attention on the above reported signaling, it was extremely interesting to observe how in protein extracts obtained from mice xenografted with MDA-MB-231 cells pretreatment with adiponectin we evidenced an enhanced activation of AMPK signaling (Fig. IV-10A). In contrast, in MCF-7 tumor xenografts we observed an increased MAPK phosphorylation concomitant with a progressive decrease of AMPK (Fig. IV-10B).
A
Fig IV-10. Representative Western blot analysis on protein extracts from MDA-MB-231 (A) or MCF-7 (B) xenograft tumors excised from mice showing AMPK and MAPK activation.
The immunoblots were stripped and reprobed with total AMPK and MAPK. GAPDH was used as loading control. The results are mean ± S.D. of three separate experiments in which the band intensities were evaluated in terms of optical density arbitrary units and expressed as the percentage of the control assumed to be 100%. *p<0.05 versus untreated cells.
Our in vivo results confirmed the divergent effects of adiponectin on breast cancer cell growth in relation to the ERα expression as we previously demonstrated in in vitro studies (Mauro L. et al., 2014).
IV.5 Modulatory role of adiponectin on cyclin D1 expression
Stimulation of cell growth is accompanied by the coordinate expression of multiple genes and pathways including those required for different phases of cell cycle progression (Fu M . et al., 2004). It is well known that ERα drives breast cancer
cell proliferation through the regulation of the expression levels of cyclin D1, that controls the G1-S phase transition of the cell cycle (Foster, J. S. et al., 2001).
Thus, we investigated whether adiponectin may modulate cyclin D1 expression.
In vivo adiponectin triggered opposite effects on cyclin D1 expression at both mRNA and protein level: a downregulation in MDA-MB-231-derived tumors (Fig. IV-11A) and an upregulation in MCF-7 xenografts (Fig. IV-11B). Similar results were obtained in vitro using MDA-MB-231 (Fig. IV-11C) and MCF-7 (Fig. IV-11D) cells treated with adiponectin for 48 h.
Fig IV-11. Effects of adiponectin on cyclin D1 expression. mRNA and protein levels of cyclin
D1 were done in MDA-MB-231 (A) and MCF-7 (B) tumor xenografts. MDA-MB-231 (C) and MCF-7 (D) cells were starved and treated with adiponectin 1 or 5 µg/ml for 48 h or left untreated. Total RNA was reverse transcribed and cDNA was subjected to PCR using specific primers for cyclin D1 or 36B4. NC: negative control, RNA sample without the addition of reverse transcriptase. 36B4 mRNA levels were determined as control. Protein extracts were resolved by SDS-PAGE and subjected to immunoblot analysis with rabbit antiserum against human cyclin D1. GAPDH was used as a control for equal loading and transfer. The histograms represent the mean ± S.D. of three separate experiments in which band intensities were evaluated in terms of optical density arbitrary units and expressed as the percentage of the control assumed as 100%. *p < 0.05 compared to untreated cells.