1876-6102 © 2016 The Authors. Published by Elsevier Ltd. This is an open access article under the CC BY-NC-ND license
(http://creativecommons.org/licenses/by-nc-nd/4.0/).
Peer-review under responsibility of the Scientific Committee of ATI 2016. doi: 10.1016/j.egypro.2016.11.054
Energy Procedia 101 ( 2016 ) 424 – 431
ScienceDirect
71st Conference of the Italian Thermal Machines Engineering Association, ATI2016, 14-16
September 2016, Turin, Italy
Biowaste for SOFCs
Davide Papurello
a,b*, Silvia Silvestri
b, Luca Tomasi
b, Ilaria Belcari
b, Franco Biasioli
b,
Massimo Santarelli
aaEnergy Department, Politecnico di Torino, C.so Duca degli Abruzzi 24, 10129, Torino - ITALY bFondazione Edmund Mach, Via E. MACH 1, San Michele all’adige (TN), 38010 - ITALY
Abstract
Organic Fraction of Municipal Solid Waste was adopted to produce biogas to feed a SOFC generator. Several experimental tests were accomplished on the trace compounds monitoring with PTR-ToF-MS instrument. The main organic compounds detected with the instrument were: sulfurs, terpenes, carboxyls, carbonyls and siloxanes. Coupled to these tests SOFC experiments were accomplished investigating the slipover influence from sorbent materials of sulfurs, chlorines and siloxanes. Limiting factors were evidenced from sulfur, chlorine and siloxane impact on SOFC using an electrochemical impedance spectroscopy (EIS). Tolerable concentration level of single organic compounds appears to be below 1 ppm(v) for H2S and no concentration is tolerated for siloxanes.
© 2016 The Authors. Published by Elsevier Ltd.
Peer-review under responsibility of the Scientific Committee of ATI 2016.
Keywords: OFMSW, SOFC, PTR-ToF-MS, trace compounds, ashes.
* Corresponding author. Tel.: +39-3402351692. E-mail address: [email protected]
Nomenclature
AD, Anaerobic Digestion, ASC, Anode Supported Cell, ASR, Area Specific Resistance, D4, OctamethylCyclotetrasiloxane,
EIS, Electrochemical Impedance Spectroscopy,
FU, Fuel Utilization,
ppm(v), parts per million by volume, SOFCs, Solid Oxide Fuel Cells, TCE, Tetrachloroethylene, TPB, Three Phase Boundary.
1. Introduction
Biogas from the anaerobic digestion of sewage sludge or organic waste represents a possible way for the biofuel production alternatively to fossil fuels. Anaerobic digestion is a biological process in which biodegradable matter is degraded or decomposed by the activity of specific microorganisms in the absence of oxygen. The resulting biogas
© 2016 The Authors. Published by Elsevier Ltd. This is an open access article under the CC BY-NC-ND license
(http://creativecommons.org/licenses/by-nc-nd/4.0/).
(mainly methane and carbon dioxide) can be used for electricity generation [1]. Organic Fraction of Municipal Solid Waste (OFMSW) offers the possibility to obtain a valuable bio-fuel from a waste that otherwise would be disposed in landfill. Typically, 50-70 % v/v methane, 30-50 % v/v carbon dioxide and trace volatile compounds [2–4]. To meet horizon 202020 requirements is fundamental the coupling between the biogas production and a energy high efficient system. Among many energy generators, Solid Oxide Fuel Cells represent the most promising one, in term of electrical and thermal energy conversion from the raw fuel [5–7]. Fuels however contain minor constituents as impurities. It is mandatory to provide the SOFC energy generator with a gas cleaning section in order to reach the trace compounds requirements [8–10]. Potential technologies for removal of the trace compounds in biogases include various adsorbents [11,12], absorbents [13] and biofilters [14]. Usually, in case of very stringent targets for removal of contaminants (as in case of SOFC), activated carbons are used as sorbent materials, when impregnated with metals, such as iron, copper or chromium [8,9,12]. Despite the gas cleaning section, the trace compound concentrations can be higher due to the slip-over phenomenon. Among trace compounds Sasaki et al., (2011) investigated on the H2S, PH3, Cl2 and D5 effect on NiScSz anode based fuel cell. The most detrimental compound on SOFCs performance considered in literature works are H2S and chlorine [15]. As reported by Haga et al., (2008) D5 was selected as model compound for siloxanes. 10 ppm(v) of D5 was demonstrated to be fatal on SOFCs performance [15]. No studies were accomplished on siloxanes at ultra-low concentration, even if they seem to strongly influence the cell performance at ppm(v) level [16]. Our goal was to investigate on the cell performance losses related to the different trace compounds concentration contained in a biogenous fuel. A commercial high temperature fuel cell was fed with simulated reformate mixture to which hydrogen sulfide and D4 were added singularly. Cell performance drop were investigated in galvanostatic mode, and tolerable concentration limits (representing the concentration at which the fuel cell performance are still reversible) were investigated.
Finally, the paper ends with the preliminary investigation on the digestate, adopted as culture medium for the algae growth removing CO2 from the exhausts of energy generator.
2. Material and methods
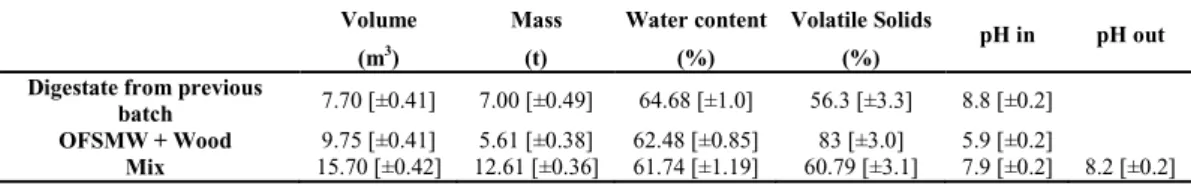
The digester pilot plant, located at Foundation Edmund Mach (S. Michele a/A, Italy) was adopted to process the OFMSW, as organic source to produce biogas. Before digester loading, OFMSW was mixed with chipped wood at a volume ratio from 0.6 to 0.7 to achieve suitable biomass porosity. Before the anaerobic digestion phase, biomass was subjected to a four day of pre-oxidation process. After the aerobic phase, the digester was isolated to transition from aerobic to anaerobic conditions. Under these conditions the anaerobic digestion was accomplished in approximately 30 days. The biomass was subjected to a further aerobic composting treatment for 20 days before final use as fertilizer. Table 1 summarizes the composition and physicochemical characteristics of the OFSMW batch used in this study.
Table 1 - Starting values of digestion cycle – Initial biomass parameters. Volume Mass Water content Volatile Solids
pH in pH out
(m3) (t) (%) (%)
Digestate from previous
batch 7.70 [±0.41] 7.00 [±0.49] 64.68 [±1.0] 56.3 [±3.3] 8.8 [±0.2] OFSMW + Wood 9.75 [±0.41] 5.61 [±0.38] 62.48 [±0.85] 83 [±3.0] 5.9 [±0.2]
Mix 15.70 [±0.42] 12.61 [±0.36] 61.74 [±1.19] 60.79 [±3.1] 7.9 [±0.2] 8.2 [±0.2]
where:
pH in: pH measured at the beginning of loading into the digester; pH out: pH at end of digestion process; Mix: total biomass loaded into the digester; Square brackets indicate the standard deviation of measurements; * Mix was left at ambient temperature for 4 days prior to loading into the digester, thereby probably changing the pH e.g. via CO2 escaping into the atmosphere.
To monitor and to detect the trace compounds contained in the biogas sample, a PTR-ToF-MS instrument was adopted. Samples (0.3 L) were collected in 3L Nalophan bags and sealed with Teflon stopper. VOCs analysis was conducted using a PTR-ToF-MS 8000 instrument in its V-mode configuration (Ionicon Analytik GmbH, Innsbruck, Austria). The sample was directly injected into the drift tube of the instrument via a heated (110°C) PEEK inlet tube. The experimental procedure adopted is reported elsewhere [2]. In order to meet SOFC requirements a gas cleaning section is mandatory. It was adopted the same instrument and procedure described above to study the behaviour of
the gas cleaning section, focusing on the sorbent material removal performance. Upstream (C0) and downstream (C) of the gas cleaning section were considered to measure the pass through ratio for a specific compound. Experimentally it was calculated the adsorption capacity of ashes. A glass reactor filter (340 ml) was filled with ashes from a wood chips boiler (3.3 MW, Viessman, Allendorf Germany). The digester is coupled to a glass filter using a blower to reach the min pressure around 30 mbar, with an average flow of 0.3 Nm3/h and a GHSV of 882 h-1. The most abundant compound identified in the ash sample with a SEM-EDS analysis (FEI Inspect, Philips 525 M - SW9100 EDAX) is oxygen followed by silicon, carbon, potassium, calcium, magnesium and aluminium.
Table 2 - Elements identified with SEM-EDS analysis in the ash sample. Element Atomic % virgin Atomic % tested
C 8.1 18 O 38.1 53.2 Mg 2.9 0.6 Al 4.3 0.6 Si 9.2 19.6 Cl 0 0.3 K 10.8 6.8 Ca 11.6 0.9 Fe 11.5 0 Ti 1.3 0 Na 1.2 0 Mn 1 0 Total: 100 100
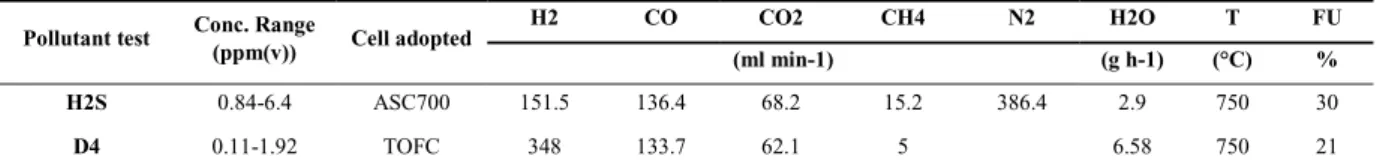
Simulated gas mixture concerning different fuel conditions are considered for the tests with trace compounds, see Table 3. Synthetic biogas was prepared and obtained by mixing pure gas feeds from CH4, CO2, CO, N2 and H2 cylinders (Siad, Italy). The biogas mixture was sent to the ASC cell with mass flow controllers (Bronkhorst, The Netherlands). Experiments were performed with anode supported solid oxide fuel cells (ASC) - nickel based. The fuel cell galvanostatic test was carried out with an electronic load (Kikusui Electronics Corp., Japan) in conjunction with an additional power supply in current-following mode (Delta Elektronica, The Netherlands). The oven temperature was kept constant at 750 °C. It was also carried on a specific experimental campaign to investigate the impact of H2S, operating temperature and current density. H2S concentration was fixed at 4 ppm(v), while the operating temperature was changed from 700 °C to 750 °C and to 800 °C, and the current density was changed from 0.21 to 0.32 and 0.42 Acm-2.
Table 3 – Test conditions.
At the end of the paper, preliminary results are achieved considering the algae growth from the digestate of the anaerobic digestion process, described above, and considering the removal of CO2 from the SOFC generator. The digestate was sterilized in autoclave at 121°C for 20 min to consider only the chlorella vulgaris as inoculum. The illumination was controlled with lamps at vapour mercury of 250 W. The CO2 flow was sent with a MFC (Bronkhorst, The Netherlands) using a gas cylinder (Siad, Italy). The algae growth was tested considering the following conditions:
B1: digestate – sterilized at T and p, dilution 1:20, with inoculum 20%, Lumen 12000; B2: digestate – sterilized at T and p, dilution 1:50, with inoculum 20%, Lumen 12000; B3: digestate – sterilized at T and p, dilution 1:70, with inoculum 20%, Lumen 12000; B4: digestate – sterilized at T and p, dilution 1:50, with inoculum 9%, Lumen 12000; B5: digestate – sterilized at T and p, dilution 1:50, with inoculum 20%, Lumen 2000; B6: digestate – sterilized at T and p, dilution 1:50, with inoculum 32%, Lumen 12000;
R1: digestate – sterilized at T and p, dilution 1:50, with inoculum 20%, Lumen 12000 and CO2 100Nml/min for 8 h/day for 15 days.
Pollutant test Conc. Range
(ppm(v)) Cell adopted
H2 CO CO2 CH4 N2 H2O T FU
(ml min-1) (g h-1) (°C) %
H2S 0.84-6.4 ASC700 151.5 136.4 68.2 15.2 386.4 2.9 750 30
The goal was to identify the best dilution condition, the inoculum concentration, the effect of the external illumination and CO2 flow.
3. Results
3.1. Trace compounds detection with PTR-ToF-MS
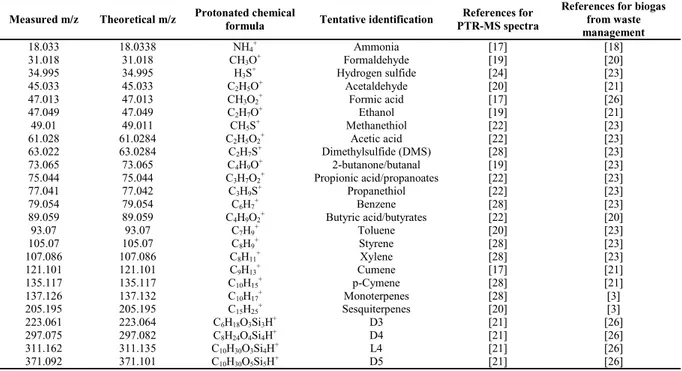
Table 4 lists a selection of the spectrometric peaks which are identified and monitored. Each compound has its experimental and expected m/z values, its chemical formula and tentative identification. PTR-ToF-MS provides only the chemical formula of the spectrographic peaks.
Table 4 - Spectrometric peaks which has been used in this paper along with their experimental and expected m/z values, their chemical formula and tentative identification supported also by available literature.
Measured m/z Theoretical m/z Protonated chemical
formula Tentative identification
References for PTR-MS spectra
References for biogas from waste management 18.033 18.0338 NH4+ Ammonia [17] [18] 31.018 31.018 CH3O+ Formaldehyde [19] [20] 34.995 34.995 H3S+ Hydrogen sulfide [24] [23] 45.033 45.033 C2H5O+ Acetaldehyde [20] [21] 47.013 47.013 CH3O2+ Formic acid [17] [26] 47.049 47.049 C2H7O+ Ethanol [19] [21] 49.01 49.011 CH5S+ Methanethiol [22] [23] 61.028 61.0284 C2H5O2+ Acetic acid [22] [23] 63.022 63.0284 C2H7S+ Dimethylsulfide (DMS) [28] [23] 73.065 73.065 C4H9O+ 2-butanone/butanal [19] [23] 75.044 75.044 C3H7O2+ Propionic acid/propanoates [22] [23] 77.041 77.042 C3H9S+ Propanethiol [22] [23] 79.054 79.054 C6H7+ Benzene [28] [23] 89.059 89.059 C4H9O2+ Butyric acid/butyrates [22] [20] 93.07 93.07 C7H9+ Toluene [20] [23] 105.07 105.07 C8H9+ Styrene [28] [23] 107.086 107.086 C8H11+ Xylene [28] [23] 121.101 121.101 C9H13+ Cumene [17] [21] 135.117 135.117 C10H15+ p-Cymene [28] [21] 137.126 137.132 C10H17+ Monoterpenes [28] [3] 205.195 205.195 C15H25+ Sesquiterpenes [20] [3] 223.061 223.064 C6H18O3Si3H+ D3 [21] [26] 297.075 297.082 C8H24O4Si4H+ D4 [21] [26] 311.162 311.135 C10H30O3Si4H+ L4 [21] [26] 371.092 371.101 C10H30O5Si5H+ D5 [21] [26]
[3] = Mata-Alvarez et al., (2000); (2008); [17] = Jordan et al., (2009); [18] = Scaglia et al (2011); [19] = Buhr et al., 2002; [20] = Font et al., (2011); [21] = Singer et al., (2011); [22] = Papurello et al., (2012); [23] = Lomans et al., (2002); [24] = Orzi et al., (2010); [26] = Papadias et al., (2012); [28] = Biasioli et al., (2011);.
Considering sulfur compounds detected from the anaerobic digestion batch of OFMSW, we have the following situation:
Figure 1 – Sulfur compounds detected during the AD process.
0 20000 40000 60000 80000 100000 120000 140000 0 5 10 15 20 25 30 Concentration (ppbv ) Days 34.995 - batch T2 49.010 - batch T2 63.022 - batch T2 77.041 - batch T2
At the beginning of the digestion process, both CH4S and C2H6S show a decreasing rate. These concentration profiles exhibit a remarkably steep reduction suggesting their participation in degradative reactions in the presence of sulfate. The H2S concentration showed two peaks at the beginning and at the end of process, where the concentration reached 33 and 25 ppmv, respectively. Considering the coupling with a SOFC system is mandatory a gas cleaning section.
3.2. Sorbent materials to remove trace compounds for SOFC application
Fig. 2 depicts the pass through ratio of sulfur compounds, considering as sorbent materials ashes from wood-chips boiler. The higher removal of H2S compared to the other sulfur compounds is due to the Ca and K oxide particles in the ash sample that helps the S removal. After 3 h of removal test only H2S shows a pass through ratio still below 50% while the other sulfur compounds have a pass through ratio above 80%. The total sulfur removed by ashes is 61.8 mgS/kgash.
Figure 2 – Sulfur compounds detected during the removal of VOCs – 34.99 H2SH+, 49.011 CH4SH+, 63.02 C2H6SH+, 77.04 C3H8SH+, 91.05 C4H10SH+.
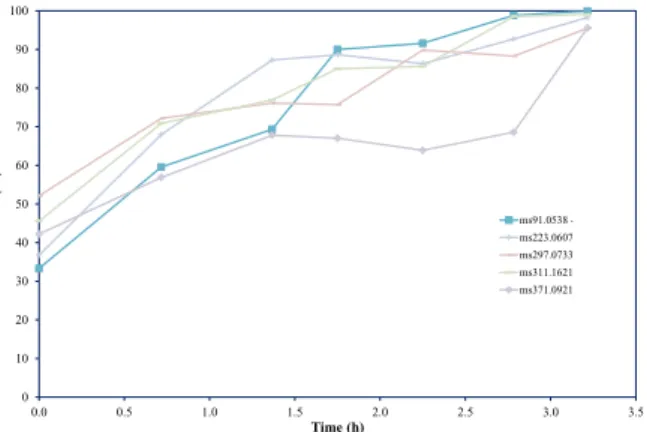
The most abundant siloxanes compound detected is D5 at 255 ppb(v), followed by D3 at 63.5 ppb(v), D4 at 47.1 ppb(v) and L4 at 26.7 ppb(v). Fig. 3 depicts the pass through ratio of siloxane compounds. A pass through ratio above 50% is recorded for all the Si compounds at the beginning of the test. The adsorption capacity of siloxanes was 0.21 mgSi/kgash.
Figure 3 – Siloxane compounds detected during the removal of VOCs – 91.05 C3H10OSiH+, 223.06 D3H+, 297.07D4H+, 311.16 L4H+, 371.09 D5H+.
3.3. Impact of sulfur and siloxane compounds on SOFC performance
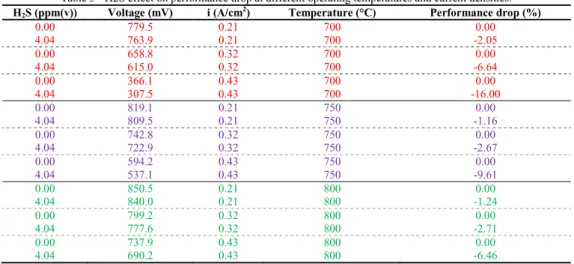
Sulfur impact on an anode supported fuel cell (Ni/8YSZ/8YSZ/GDC+LSCF) was investigated with the combination of two important operating variables: temperature T and current density i. Table 5 illustrates the results of the experimental tests. The cell voltage was measured between each poisoning and recovery steps to individuate the
0 10 20 30 40 50 60 70 80 90 100 0.0 0.5 1.0 1.5 2.0 2.5 3.0 3.5 C/C0 (% ) Time (h) ms34.9953 - a2 ms49.0112 - a2 ms63.0255 - a2 ms77.0439 - a2 ms91.0538 - a2 ms93.0622 - a2 0 10 20 30 40 50 60 70 80 90 100 0.0 0.5 1.0 1.5 2.0 2.5 3.0 3.5 C/C0 (% ) Time (h) ms91.0538 - a2 ms223.0607 - a2 ms297.0733 - a2 ms311.1621 - a2 ms371.0921 - a2
performance drop of the cell. This experimental section investigated on the combined effect of current density and operating temperature when the cell was fed by a fixed H2S concentration.
Table 5 - H2S effect on performance drop at different operating temperatures and current densities. H2S (ppm(v)) Voltage (mV) i (A/cm2) Temperature (°C) Performance drop (%)
0.00 779.5 0.21 700 0.00 4.04 763.9 0.21 700 -2.05 0.00 658.8 0.32 700 0.00 4.04 615.0 0.32 700 -6.64 0.00 366.1 0.43 700 0.00 4.04 307.5 0.43 700 -16.00 0.00 819.1 0.21 750 0.00 4.04 809.5 0.21 750 -1.16 0.00 742.8 0.32 750 0.00 4.04 722.9 0.32 750 -2.67 0.00 594.2 0.43 750 0.00 4.04 537.1 0.43 750 -9.61 0.00 850.5 0.21 800 0.00 4.04 840.0 0.21 800 -1.24 0.00 799.2 0.32 800 0.00 4.04 777.6 0.32 800 -2.71 0.00 737.9 0.43 800 0.00 4.04 690.2 0.43 800 -6.46
At 700°C when the current density was fixed at 0.21 Acm-2 the performance voltage drop registered was around 2%. This value increased at 6.64% when the current density increased to 0.32 Acm-2, and reached a performance drop of 16% when the current density was fixed at 0.43 Acm-2. A similar behavior was described in literature studies. Singhal et al., (1986) found that the power output drop increased from 10.3% to 15.6% when the cell was exposed to 10 ppm(v) of H2S and the current density increased from 160 to 250 mAcm-2 at 1000°C [31].
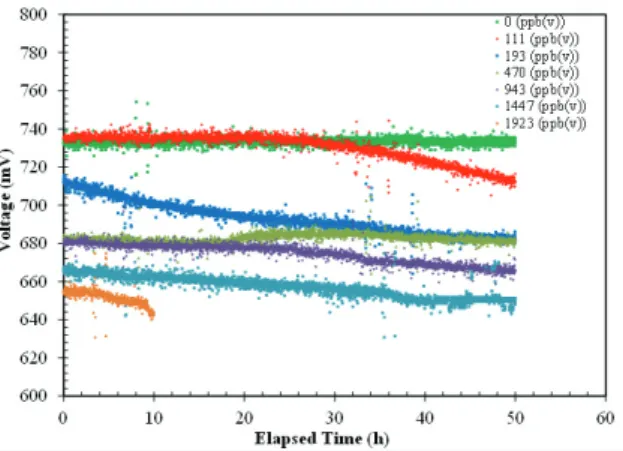
The poisoning of S is due to the blockage of surface sites by adsorbed sulfur [32]. In this case SO2 formation desorbed from the surface, leading to alleviated poisoning effect. This explanation seems reasonable since one would expect that higher oxygen ion flux would lead to quicker removal of more adsorbed sulfur. But it also noted that SO2 may exist only as a “short lived” reaction intermediate because sulfur dioxide may be reduced back to H2S in the fuel environment. This is possible even only from a thermodynamic point of view. This explanation was confirmed experimentally, see Table 5. Here, at higher current density there is no alleviation of the sulfur effect on the cell performance. The same behavior described above was clearly visible, even if in lighter way, when the operating temperature was increased to 750°C and to 800°C. The absolute value of the performance drop decreased when the operating temperature was increased. This is due to positive effect of the temperature on the ohmic resistance and polarization resistance. The first term is reduced by the improvement of the material conductivity. The second term considers the electrochemical and mass transport losses, as reported elsewhere [33]. The electrochemical losses were reduced when the operating temperature was increased. This phenomenon was linked to the activation of chemical reactions at the electrodes. Here, the temperature increases the probability to reach the activation energy required for an electrochemical reaction. The mass transport losses were positively influenced by the operating temperature. In fact, the diffusion of the reactants in the porous media improved with the temperature increasing. Also D4 test have been analysed: Figure 4 in the upper right part showed how the cell performance was irreversibly affected by the D4 test. In fact, already at 111 ppb(v) the cell voltage decreased was not recovered. This was due to the silica precipitation that may cause a decrease in the active triple phase boundary (TPB) areas. The siloxane concentration acted on the cell blocking the anode pores and consequently the TPB region was reduced strongly [33] The phenomena reported above are separated but linked to the silica compounds formation.
Figure 4 – Siloxane compounds effect on cell voltage.
3.4. Preliminary results of the algae growth from SOFC exhausts
The algae growth using digestate (from the anaerobic digestion batch) as culture media was analyzed. Preliminary results are obtained considering the dilution effect, the inoculum percentage of algae added to the starting batch, the effect of the light and the effect of the CO2 fuel flow. In the following figures are reported the batch results and the testing description. The best dilution for the digestate was find to be around at 1:70 (B3), with a biovolume of cells around 1349 mm3/ml at the end of campaign (312 h), 37% and 64% lower than the dilution of 1:50 (B2) and 1.20 (B1), respectively. Fig. 5 b) shows how the nominal inoculum condition (+20% (B2)) has the highest initial algae growth with a total production around 850 mm3/ml. The highest (B6) and the lowest (B4) inoculum condition have a similar starting condition with 221 mm3/ml. At the end of the process B6 showed an increasing trend of 110% compared to the nominal case. B4 showed the lowest production with a decreasing of 31% compared to the nominal condition. Fig. 5 c) showed the effect of the light, 12000 lm (B2) allowed an average production increasing growth around 62% compared to the low illumination case (B5). Fig 5 d) shows the algae growth for B2 and R1, considering or not the feeding with CO2. R1 was fed with CO2 (100 Nml/min) for 8 h/day for two weeks. The final production of algae is similar to the case without the CO2 flow, 911 mm3/ml versus 850 mm3/ml. It was measured the pH at the end of the process to understand why the algae production is not substantially increased. R1 showed an acid pH value compared to B2 (6.2 vs 9.2). The starting pH value for R1 reactor was 8.5 and it was acidified due to the highest CO2 flow. For future test this concentration must be decreased to achieve more basic values.
0 200 400 600 800 1000 1200 1400 1600 0 50 100 150 200 250 300 350 T otal biov olume (mm 3/m l) Time (h) B1 B2 B3 0 200 400 600 800 1000 1200 1400 1600 1800 2000 0 50 100 150 200 250 300 350 T otal biov olum e (mm3/ml) Time (h) B2 B4 B6 0 200 400 600 800 1000 1200 0 50 100 150 200 250 300 350 T otal biov olum e (mm3/ml) Time (h) B2 B5 0 200 400 600 800 1000 1200 0 50 100 150 200 250 300 350 T otal biov olum e (mm3/ml) Time (h) B2 R1 a) b) c) d)
Figure 5 – a) Dilution effect B1=1:20, B2=1:50, B3=1:70; b) Inoculum effect B2=+20%, B4=+9%, B6=+32%; c) Lighting effect B2=12000lm, B5=2000lm; d) B2=0 CO2Nml/min, R1=100 CO2Nml/min.
Conclusions
Organic Fraction of Municipal Solid Waste was adopted to produce biogas to feed a SOFC generator. PTR-ToF-MS instrument was adopted to identify and to monitor several trace compounds, the most important for SOFCs application are sulfurs, siloxanes, terpenes and aromatic compounds. Ashes from wood chips boiler are adopted to remove trace compounds; the effectiveness was proved for H2S and minor compounds. SOFC experiments were accomplished investigating the slipover influence from sorbent materials of sulfurs, chlorines and siloxanes. Tolerable concentration level of single organic compounds appears to be below 1 ppm(v) for H2S. The effect of current density and fuel utilization was also investigated varying the operating temperature. Preliminary results on the algae production were shown. The optimal dilution of digestate was found to be around at 1:70. Factors that affect the algae production are light and percentage of algae inoculum. CO2 flow must be settled to lower values in order to avoid the acidification of the environment.
Acknowledgements
This work has been partly funded by the European Union under the DEMOSOFC project (www.demosofc.eu) and part of the BWS project (Biowaste for SOFCs); project funded by the Fondazione Cassa di Risparmio di Trento e Rovereto.
References
[1] Lissens G, Vandevivere P, De Baere L, Biey EM, Verstraete W. Solid waste digestors: process performance and practice for municipal solid waste digestion. Water Sci Technol 2001;44:91–102. [2] Papurello D, Soukoulis C, Schuhfried E, Cappellin L, Gasperi F, Silvestri S, et al. Monitoring of volatile compound emissions during dry anaerobic digestion of the Organic Fraction of Municipal Solid Waste by
Proton Transfer Reaction Time-of-Flight Mass Spectrometry. Bioresour. Technol., vol. 126, 2012, p. 254–65.
[3] Mata-Alvarez J, Macé S, Llabrés P. Anaerobic digestion of organic solid wastes. An overview of research achievements ans perspectives. Bioresour Technol 2000;74.
[4] Macias-Corral M, Samani Z, Hanson A, Smith G, Funk P, Yu H, et al. Anaerobic digestion of municipal solid waste and agricultural waste and the effect of co-digestion with dairy cow manure. Bioresour Technol 2008;99:8288–93. doi:10.1016/j.biortech.2008.03.057.
[5] Sasaki K, Watanabe K, Teraoka Y. Direct-Alcohol SOFCs : Current-Voltage Characteristics and Fuel Gas Compositions. J Electrochem Soc 2004;2:965–70. doi:10.1149/1.1756884. [6] Papurello D, Lanzini A, Tognana L, Silvestri S, Santarelli M. Waste to energy: Exploitation of biogas from organic waste in a 500 Wel solid oxide fuel cell (SOFC) stack. Energy 2015;85:145–58.
doi:10.1016/j.energy.2015.03.093.
[7] Papurello D, Borchiellini R, Bareschino P, Chiodo V, Freni S, Lanzini A, et al. Performance of a Solid Oxide Fuel Cell short-stack with biogas feeding. Appl Energy 2014;125:254–63.
[8] Papurello D, Tognana L, Lanzini A, Smeacetto F, Santarelli M, Belcari I, et al. Proton transfer reaction mass spectrometry technique for the monitoring of volatile sulfur compounds in a fuel cell quality clean-up system. Fuel Process Technol 2015;130:136–46. doi:10.1016/j.fuproc.2014.09.041.
[9] Papurello D, Schuhfried E, Lanzini A, Romano A, Cappellin L, Märk TD, et al. Proton transfer reaction-mass spectrometry as a rapid inline tool for filter efficiency of activated charcoal in support of the development of Solid Oxide Fuel Cells fueled with biogas. Fuel Process Technol 2015;130:78–86. doi:10.1016/j.fuproc.2014.09.042.
[10] Papurello D, Tomasi L, Silvestri S, Belcari I, Santarelli M, Smeacetto F, et al. Biogas trace compound removal with ashes using proton transfer reaction time-of-flight mass spectrometry as innovative detection tool. Fuel Process Technol 2016;145:62–75. doi:10.1016/j.fuproc.2016.01.028.
[11] Truong LVA, Abatzoglou N. A H2S reactive adsorption process for the purification of biogas prior to its use as a bioenergy vector. Biomass and Bioenergy 2005;29:142–51. doi:10.1016/j.biombioe.2005.03.001. [12] Papurello D, Schuhfried E, Lanzini A, Romano A, Cappellin L, Märk TD, et al. Influence of co-vapors on biogas filtration for fuel cells monitored with PTR-MS (Proton Transfer Reaction-Mass Spectrometry). Fuel
Process Technol 2014;118:133–40. doi:10.1016/j.fuproc.2013.08.011.
[13] Ter Maat H, Hogendoorn JA, Versteeg GF. The removal of hydrogen sulfide from gas streams using an aqueous metal sulfate absorbent: Part I. the absorption of hydrogen sulfide in metal sulfate solutions. Sep Purif Technol 2005;43:183–97. doi:10.1016/j.seppur.2004.10.013.
[14] Schieder D, Quicker P, Schneider R, Winter H, Prechtl S, Faulstich M. Microbiological removal of hydrogen sulfide from biogas by means of a separate biofilter system: experience with technical operation. Water Sci Technol 2003;48:209–12.
[15] Haga K, Adachi S, Shiratori Y, Itoh K, Sasaki K. Poisoning of SOFC anodes by various fuel impurities. Solid State Ionics 2008;179:1427–31. doi:10.1016/j.ssi.2008.02.062.
[16] Arnold M, Kajolinna T. Development of on-line measurement techniques for siloxanes and other trace compounds in biogas. Waste Manag 2010;30:1011–7. doi:10.1016/j.wasman.2009.11.030. [17] Jordan A, Haidacher S, Hanel G, Hartungen E, Märk L, Seehauser H, et al. A high resolution and high sensitivity proton-transfer-reaction time-of-flight mass spectrometer (PTR-TOF-MS). Int J Mass Spectrom
2009;286:122–8. doi:10.1016/j.ijms.2009.07.005.
[18] Scaglia B, Orzi V, Artola a., Font X, Davoli E, Sanchez a., et al. Odours and volatile organic compounds emitted from municipal solid waste at different stage of decomposition and relationship with biological stability. Bioresour Technol 2011;102:4638–45. doi:10.1016/j.biortech.2011.01.016.
[19] Buhr K, Van Ruth S, Delahunty C. Analysis of volatile flavour compounds by Proton Transfer Reaction-Mass Spectrometry: Fragmentation patterns and discrimination between isobaric and isomeric compounds. Int J Mass Spectrom 2002;221:1–7. doi:10.1016/S1387-3806(02)00896-5.
[20] Font X, Artola A, Sánchez A. Detection, composition and treatment of volatile organic compounds from waste treatment plants. Sensors 2011;11:4043–59. doi:10.3390/s110404043. [21] Singer W, Herbig J, Gutmann R, Winkler K, Kohl I, Hansel A. Applications of PTR-MS in Medicine and Biotechnology. Life Sci Solut Am Lab 2011:2–5.
[22] Papurello D, Soukoulis C, Schuhfried E, Cappellin L, Gasperi F, Silvestri S, et al. Monitoring of volatile compound emissions during dry anaerobic digestion of the Organic Fraction of Municipal Solid Waste by Proton Transfer Reaction Time-of-Flight Mass Spectrometry. Bioresour Technol 2012;126:254–65. doi:10.1016/j.biortech.2012.09.033.
[23] Lomans BP, Van Der Drift C, Pol A, Op Den Camp HJM. Cellular and Molecular Life Sciences Microbial cycling of volatile organic sulfur compounds. Cell Mol Life Sci 2002;59:575–88.
[24] Orzi V, Cadena E, Imporzano GD, Artola A, Davoli E, Crivelli M, et al. Bioresource Technology Potential odour emission measurement in organic fraction of municipal solid waste during anaerobic digestion : Relationship with process and biological stability parameters. Bioresour Technol 2010;101:7330–7. doi:10.1016/j.biortech.2010.04.098.
[25] Wang X, Wu T. Release of isoprene and monoterpenes during the aerobic decomposition of orange wastes from laboratory incubation experiments. Environ Sci Technol 2008;42:3265–70. [26] Papadias DD, Ahmed S, Kumar R. Fuel quality issues with biogas energy - An economic analysis for a stationary fuel cell system. Energy 2012;44:257–77. doi:10.1016/j.energy.2012.06.031. [27] Aprea E, Biasioli F, Märk TD, Gasperi F. PTR-MS study of esters in water and water/ethanol solutions: Fragmentation patterns and partition coefficients. Int J Mass Spectrom 2007;262:114–21.
doi:10.1016/j.ijms.2006.10.016.
[28] Biasioli F, Yeretzian C, Märk TD, Dewulf J, Van Langenhove H. Direct-injection mass spectrometry adds the time dimension to (B)VOC analysis. TrAC - Trends Anal Chem 2011;30:1003–17. doi:10.1016/j.trac.2011.04.005.
[29] Staley BF, Xu F, Cowie SJ, Barlaz MA, Hater GR. Release of trace organic compounds during the decomposition of municipal solid waste components. Environ Sci Technol 2006;40:5984–91. doi:10.1021/es060786m.
[30] Demirbas A. Products from Lignocellulosic Materials via Degradation Processes. Energy Sources, Part A Recover Util Environ Eff 2007;30:27–37. doi:10.1080/00908310600626705. [31] S.C. Singhal, R.J. Ruka, J.E. Bauerle CJS. Anode Development for Solid Oxide Fuel Cells 1986.
[32] Weber A, Dierickx S, Kromp A, Ivers-Tiffée E. Sulfur poisoning of anode-supported SOFCs under reformate operation. Fuel Cells 2013;13:487–93. doi:10.1002/fuce.201200180.