I
DOTTORATO DI RICERCA IN SCIENZE DELLA TERRA
XVIII CICLO DEL CORSO DI DOTTORATO
Using radon as tracer for Non-Aqueous
Phase Liquid (NAPL) contamination.
Gabriele De Simone
__________________
Dottorando
firma
Prof.ssa Paola Tuccimei
__________________
Docente Guida/Tutor: Prof.
firma
Dr. Gianfranco Galli
__________________
Cotutor: Prof.
firma
Prof. Claudio Faccenna
__________________
II
Index
Introduction...1
Radon as a tracer of NAPL contamination...3
Radon...3
Assessment of NAPL pollution using radon...7
Layout of the thesis...9
Chapter 1 – Methods 1.1 Geochemical method...12 1.2 Permeameter...13 1.3 Flowmeter...14 1.4 Dräger X-am 700...15 1.5 RAD 7...16
1.6 Mini RAE Lite (photoionization detector) ...19
1.7 Syscal Pro Switch...20
Chapter 2 – Results of soil gas and intrinsic permeability seasonal surveys in the study site and in close areas chosen for the determination of the background…...23
Chapter 3 – Tracing NAPL contamination in the vadose zone using soil radon Abstract...26
Introduction...28
Simulation of a gasoline spill and related radon gas evolution...29
Example of radon and CO2 mapping in real contaminated site...30
Conclusions...34
References...35
Chapter 4 – Using natural radon as a tracer of gasoline contamination Abstract...36
Introduction...37
Simulation of gasoline spills...38
III
Decrease of radon exhalation rate of a volcanic material induced by addition of
gasoline...40
References...42
Chapter 5 – Laboratory simulation of recent NAPL spills to investigate radon partition among NAPL vapours and soil air Abstract...43
Introduction...45
Material and methods...46
Experimental...47
Results and discussion...52
Conclusions...57
References...59
Chapter 6 – Correcting for H2O interference using a RAD 7 electrostatic collection-based silicon detector Abstract...61
Introduction...63
Material and method...65
Experimental...66
Results and discussio...69
Conclusions...78
References...81
Chapter 7 – Soil radon survey to assess NAPL contamination from an ancient spill. Do kerosene vapours affect radon partition? Abstract...84
Introduction...86
Geological setting and previous mapping...87
Material and methods...90
Results...93
Conclusions...100
IV
Appendix...104
Chapter 8 – Geophysical investigation in the study area Methods...107
Instruments...107
Geophysical investigation in the study area...109
Discussion...116
Conclusions...118
Chapter 9 – Additional papers on new analytical methods 9.1 Calibration of Big Bottle RAD H2O set-up for radon in water using HDPE bottles Abstract...120
Introduction...122
Material and method...123
Description of physical processes...128
Calculation model...134
Conclusions...139
References...140
9.2 Our PET project: an unlimited supply of big and small water sample vials for the assay of radon in water Abstract...141
Introduction...142
Theory...142
Experimental...143
Results and discussio...144
Set A experiments...145
Set B experiments...145
Conclusions...149
V
9.3 Evaluating radon loss from water during storage in standard PET, bio-based PET, and PLA bottles
Abstract...151
Introduction...152
Material and methods...154
Results and discussion...168
Conclusions...172
References...174
9.4 A new technique to measure in situ soil gas permeability Abstract...177
Introduction...178
Theory...179
Field technique...180
Results and discussion...183
References. ...189
Chapter 10 – Conclusion...191
1
Introduction
This study is related to a new analysis technique for hydrocarbons polluted sites through the use of Radon gas.
Radon is a radioactive gas which is naturally present in the earth’s crust in variable
concentrations. Thirty six radon isotopes have been recognised, but just 222Rn and 220Rn
present a significant abundance: 222Rn (238U series) is the most abundant in confined environment because of its larger half-life (3.8 days); 220Rn (232Th series), commonly referred to as Thoron, is characterised by a shorter half-life (55.6 seconds) that makes its indoor concentration much lower.
In industrial areas and in areas where refineries and storage units for hydrocarbons are present, hydrocarbons spills in the subsoil may frequently occur. Hence the need for hydrocarbons remediation actions.
A primary problem concerning the remediation of sites contaminated by NAPL (non-aqueous phase liquids) is to assess the extent of the polluted area. The distribution, extent and amount of pollutants in the subsurface has to be properly assessed in order to arrange appropriate remediation actions.
In order to design appropriate remediation, distribution, extension and amount of pollutants in the subsoil must be well characterized. A possible approach can consist in a survey based on the direct detection of organic carbon in soil gas. This method, however, is only valid in case of soil contamination by volatile hydrocarbons;
Another method applied in the past several years is the use of CO2 and CH4 as tracers
for NAPL. Variations in percentage of these gases in the soil can be useful for the identification of the polluted area. However, even this method presents difficulties and inaccuracies especially in case of recent pollution.
2
Because of these difficulties in identification and demarcation of the land polluted by using only surface analysis, activity usually starts with vertical drillings located in the proximity of the source of contamination, or the installation of wells to collect water samples underground, picking carrots etc. within the contaminated area, if known. These methods, however, have a high cost and is almost never possible to define precisely the area of the land involved. This can lead to bad decisions relating to remediation.
In this study the importance of Rn lies in the fact that it has excellent solubility in a wide range of NAPL, so as to form negative anomalies concentration in the soil where the presence of these pollutants is observed. In this way, knowing the soil Radon concentrations in the background area, an area polluted by NAPL could be indirectly localized by making a grid of surface Radon measurements over the area where it is assumed that NAPL pollution occurred.
Radon solubility in NAPLs can be quantified for each NAPL with an individual NAPL/air partitioning coefficient (K NAPL/AIR ). The partitioning coefficient K NAPL/AIR is one of the most influential parameters governing the decrease of gas radon concentration in the soil in the presence of NAPLs.
3
Radon as tracer of NAPL contamination
Radon
Radon is an element of VIIIA Group of the periodic table: it is a noble gas, therefore, does not react with other chemical elements. It is the heaviest of the known gas (density 9.72 g / l at 0 ° C, 8 times more dense than air). it is colorless, odorless, tasteless and is
naturally present in soil. It is a radiogenic element (derived from the decay of 226Ra) and
radioactive (direct decay into 218Po). Its 26 isotopes, between 219Rn and 226Rn, are part of the uranium and thorium decay chains (Figure 1). Only three of them are found in nature:
The 219Rn (actinion), belonging to 235U decay series, 207Pb final product; The 220Rn (thoron), belonging to 232Th decay series, 208Pb final product;
The 222Rn (proper radon), belonging to 238U decay series, the final product 206Pb (Bourdon et al., 2003).
The 219Rn comes from the decay of 223Ra and in turn decays to 215Po. The 220Rn comes from the decay of 224Ra and in turn decays to 216Po. The 222Rn comes from the decay of 226Ra and in turn decays to 218Po.
The main radon source is soil or surface rocks that contain radium. Radium can reach
the surface even in deep gas emissions areas (CO2, CH4). In open spaces it is diluted by
air currents and reaches low concentrations, while in a closed environment, such as can be an home, radon can accumulate, reaching high concentrations dangerous to human health.
4
Regarding the natural concentrations of the three isotopes of radon, we can refer to the average concentration in the Earth's crust of the parent isotopes.
235 U 0.02 ppm (1.5 Bq/kg) 232 Th 8.5 ppm (34 Bq/kg) 238 U 2.7 ppm (33 Bq/kg)
The 238U is the 99,27% of the isotope uranium complex.
It should also be considered as the average life of the three isotopes of radon, expressed by the half-life parameter:
half-life parameter. 219 Rn 3.92 seconds 220 Rn 54.5 seconds 222 Rn 3.825 days.
As a consequence 219Rn has very low concentrations in nature and is therefore
considered of minor importance.
The 220Rn (thoron) is not easily detectable in the environment because of its short
half-life, despite the 232Th isotope, that generates it, is relatively abundant in nature. In any case, the distance that the thoron can travel escaping from the source material is minimal.
The 222Rn has the longest half-life and is constantly present in the environment. It is considered the most important of radon isotopes and we usually refer to it with radon-term. Most of the studies on radon and its effects on human health have focused on 222
Rn.
Emanation, migration and radon exhalation
These parameters relate to the issue of radon from the ground or from any material. The issue is the release of radon atoms from the mineral grains in the pores and fractures of the material, due mainly to the effect of recoil linked to α decay (Morawska & Phillips, 1993). Migration is the movement of the radon atoms within the material.
5
Coefficient of emanation
Ratio between the number of radon atoms which leave the solid material and the amount generated from the sample. The number of atoms that leave the solid is always less than the number of generated atoms (De Martino et al., 1998).
In order to be a common mineral can occur radon emanation, it must be formed within the first 0.02 ÷ 0.07 uM from the surface. This is the distance of recoil of a radon atom at the instant of its formation from a radio atom. Radon that is deeper form remains imprisoned and decays in place in its solid products (Sasaki et al., 2004).
The emanation coefficient depends mainly on the natural features of material, such as porosity (Morawska & Phillips, 1993). and water content (Menetrez & Mosley, 1996).
Rate of exhalation
It provides the measurement of the radon released from inside to outside of the sample, that is, into the atmosphere. It is measured in Bq h-1. Its value depends on the enactment and the concentration gradient between inside and outside of the sample (De Martino et al., 1998). Consequently, it is strongly influenced by the environmental conditions (weather conditions, pressure, temperature). The rate of exhalation can be expressed as a mass exhalation rate, measured in Bq kg-1 h-1, or still as surface exhalation rate, measured in Bq m-2 h-1.
Radon flow from the soil
It defines the amount of radon that is released from the soil into the atmosphere in the unit time (passage at the soil-atmosphere). It is therefore an exhalation rate per unit area and can be expressed in Bq m-2 h-1.
The ubiquitous presence of radon in nature
The Radium (226 Ra), parent of the element Radon (222Rn), is present in almost all the
minerals of the earth's crust, which is why his daugther nuclide is produced constantly in the environment.
The alpha decay is the most important driver for the release of radon from the mineral matrix. When an atom of radium decays, the newly formed Radon atom is displaced for the recoil effect. The distance that an atom of radon can travel for the recoil can vary from 0.02 to 0.07 microns depending on the structure of the mineral.
6
Consequently, the possibility that the newborn Radon atom entering or not in the pores space depends on the location of the radium atom with respect to the surface of the grain in which it is contained and from the direction the Recoil. The ratio between the total number of atoms of radon emitted from a mineral matrix and the total number of radon atoms in the pores is expressed by the Emanation Coefficient. This is a nodimensional coefficient and is specific for each mineral matrix. Generally varies between 0.1 and 0.7 and in accordance with an average value is taken as the standard reference: 0.25.
Apart from the presence of Ra and the Emanation Coefficient, the concentration of radon in the interstitial space of the pores precisely depends on the porosity and the density of the mineral matrix. The relationship is t5he following:
where:
C∞ : radon concentration in the soil pore space (Bq/m3) : emanation coefficient
ARa : radium activity concentration of the mineral matrix
d : bulk density of the mineral matrix n : porosity of the mineral matrix
Generally the concentrations of radon in the soil or in aquifers are comprised between 5
and 50 kBq/m3, that are mostly, almost always, detectable with modern measuring
instruments.
The concentration of radon in the soil or in groundwater remains almost constant, though with a characteristic seasonal variation, in a given place. For these reasons the radon and its lateral and temporal variations, can be used as indicator of anomalies of the subsoil. An important example of this is that the Radon can be indicator of the presence or absence of NAPL in the subsurface.
7
Assessment of NAPL pollution using radon
The Non-Aqueous Phase Liquids (NAPL) are all the liquids that are immiscible with water as fuels (kerosene, diesel and gasoline), chlorinated solvents or mineral oils. They can be lighter (LNAPL), as fuels, or denser (DNAPL), as chlorinated solvents, than water so they can respectively float on water or sink under water and the interaction between the different phases is really limited because of the immiscibility.
Most of the petroleum products are lighter than water and tend to float on it remaining on the vadose zone, but in sufficient quantity these fluids can reach the saturated zone (groundwater). Near the capillary fringe (immediately above the saturated zone) they expand horizontally and are slowly carried by the aquifer.
In industrial areas and in sites where refineries and storage units for hydrocarbons are present, hydrocarbons spills in the subsoil may frequently occur; hence, the need for hydrocarbons remediation actions. A primary problem concerning the remediation of sites contaminated by NAPL is to assess the extent of the polluted area; the distribution and the degree of contamination in the subsurface has to be properly evaluated in order to arrange appropriate remediation actions. The employment of Rn as tracer of contamination depends on its high solubility in a wide range of NAPL, so as to produce negative anomalies concentration (radon-deficit) in the soil where the presence of these pollutants is observed. Thus, the evaluation of soil Radon concentrations in a background area, compared with data from an area polluted by NAPL, may give an indirect information on the distribution of NAPL in the subsoil, through several measurements over a regular grid covering the study area (Fig.).
Radon solubility in NAPLs can be quantified for each NAPL with an individual
NAPL/AIR/WATER partitioning coefficient (K NAPL/AIR/WATER ). The partitioning
coefficient K NAPL/AIR/WATER is one of the most influential parameters governing the decrease of gas radon concentration in the soil in presence of NAPLs.
8
Fig.21. Reduction of soil radon concentration (radon-deficit) in proximity of a contaminated soil volume (from Schubert et al., 2002).
In order to use the radon as a tracer of the presence of NAPL and to obtain a result not only qualitative but also a quantitative estimate of the presence of pollutants, it' s of fundamental importance the understanding of the radon partitioning between gas and water.
If we need a quantitative evaluation of the NAPL volume, occurring in the subsoil, we can precisely measure radon partition coefficients within the specific NAPL mixture and we can use the equation proposed by Schubert (2015) to find saturation volumes of NAPL (S NAPL ).
Radon concentration at the equilibrium (C∞), and the correspondent deficit (Δ C∞)
in non-polluted areas, depends on residual NAPL share (X NAPL ), fluid saturation (S F =
S NAPL + S W ), that consider both water and NAPL, and radon partition coefficients.
Radon partition coefficients between residual NAPL and soil gas and between soil
moisture and soil gas (K NAPL/SG and K W/SG ) are needed for quantification in the vadose
zone (eq. 1) and radon partition coefficients between residual NAPL and water (K
NAPL/W ) for quantification in the aquifer (eq. 2) as shown by following equations from
9
This study moreover focuses on the role of the vaporized fraction of NAPL on changes of radon concentration in the soil gas. The phenomenon is investigated through laboratory experiments regarding either the growth of radon exhalation from material contaminated with increasing volumes of kerosene, or the determination of radon partition between liquid kerosene, water and air, with NAPL vapors enhancing radon transport in the air.
Layout of the thesis
In the first part of the study, soil radon concentrations were monitored at 80 cm depth in a contaminated site of Latium Region.
This area has been chosen because it is affected by NAPL pollution at about 2-3 meters below the ground level, in order to test the “radon-deficit technique” to trace hydrocarbon pollution. These data were compared with those obtained from two different sites located nearby and characterized by similar geo-lithological features, but not contaminated (background areas). Radon measurements have been carried out seasonally, along with measurements of other parameters:
-physical conditions of the soil (water content and temperature at 30 and 80 cm depths); -soil gas permeability (intrinsic permeability);
-concentrations of other gases in the soil, in particular CO2 , H2S and CH4 .
Maps of soil gases concentrations (radon, CO2) and intrinsic permeability were
produced, using the program Golden Surfer.
This study was conducted with a seasonal monitoring of the polluted area throughout the period of my PhD (2013-2016). In addition, various laboratory experiments were carried out in order to determine Radon partion coefficients (Kair/NAPL and Kwater/ NAPL) in a two and three phase system to approach a quantitative determination of the fraction of NAPL in soil pores. Finally, more studies not strictly connected to the main goal of this thesis, but still related to it, have been advanced to refine the measurement techniques of
10
soil Radon and Radon in water sampes. In this period it was also developed a new instrument for the measurement of the intrinsic permeability of the soil.
All these studies have been published or have been just submitted to international peer review journals. These publications and are listed below:
Chapter 1: Methods
Chaper 2: Results of soil gas and intrinsic permeability seasonal surveys in the
study site and in close areas chosen for the determination of the background
Chapter 3: Tracing NAPLs contamination in the vadose zone using soil radon
(Rend. Online Soc. Geol. It., Vol. 33 (2014), pp. 100-103)
Chapter 4: Using natural radon as a tracer of gasoline contamination (Procedia
Earth and Planetary Science 13 ( 2015 ) 104 – 107)
Chapter 5: Laboratory simulation of recent NAPL spills to investigate radon
partition among NAPL vapours and soil air (submitted to Applied Radiation and Isotopes)
Chapter 6: Correcting for H2O interference using a RAD7 electrostatic
collectionbased silicon detector (Journal of Environmental Radioactivity 162-163, 2016, 146-153)
Chapter 7: Soil radon survey to assess NAPL contamination from an ancient spill.
Do kerosene vapors affect radon partition? (Submitted to Journal of Environmental Radioactivity)
Chapter 8: Using soil radon deficit and geoelectrical data as proxy indicators for
11
Chapter 9: Additional papers on new analytical methods (This chapter is composed by papers not srictly connected to main goal of the thesis and dealing with the improvement of analytical methods to determine radon concentration in the soil gas, radon dissolved in groundwater and soil intrinsic permeability are reported).
Chapter 9.1: Calibration of Big Bottle RAD H2O set-up for radon in water using
HDPE bottles (Radiation Measurements 76, 2015, 1-7)
Chapter 9.2: Our PET project: an unlimited supply of big and small water sample
vials for the assay of radon in water(J Radioanal Nucl Chem, 2015, 307, 2277-2280)
Chapter 9.3: Evaluating radon loss from water during storage in standard PET,
bio-based PET, and PLA bottles (Radiation Measurements 84, 2016, 1-8)
Chapter 9.4: A new technique to measure in situ soil gas permeability (Journal of
Geochemical Exploration 148, 2015, 56–59)
12
A B C D E
CHAPTER 1
METHODS
1.1 Geochemical methods
For the geochemical analysis were measured concentrations of 222Rn and 220Rn with two
radonometers RAD7 from Durridge Company (one preceded by a desiccant unit, one
not), the CO2 concentration with the Dräger X-am 7000 (Dräger) and the VOCs
(Volatile Organic Compounds) concentration with a PID (Photoionization Detector) from RAE Systems.
First of all, to verify that was possible to do correctly the measures, it was indirectly estimate the intrinsic permeability of the terrain with a vacuometer and a flowmeter. All measures were made at a depth of 80 cm from ground level. In each point of measure it was driven an hollow rod in the ground utilizing an hammer and an “hitting” head applied on top of the ground rod (fig.1C). At the end of the rod was applied a mobile driving point (fig.1A) that, once the rod reached the designed depth, was driven 5 cm further down, with a thinner rod, to create a known pressure on the terrain.
At the end of analysis the hollow rods were retrieved with a crick (fig.1E) and the driving points were left in the ground.
Fig.1 : driving of the hollow rod in the ground (A,B and C), measurements (D) and recuperation of the rod (E)
13
1.2 Permeameter
The vacuometer is an instrument that makes the vacuum in the soil inspiring the air present in the soil’s pores and measuring the decompression induced.
We can indirectly calculate the intrinsic permeability of the soil trough the flow rate Q [Q = V / t (m3 · s-1)] measured by a flowmeter connected at the output of the radonometer and the pressure difference Δp (Pa) measured by the vacuometer, that are respectively directly and inversely proportional to the intrinsic permeability of the soil:
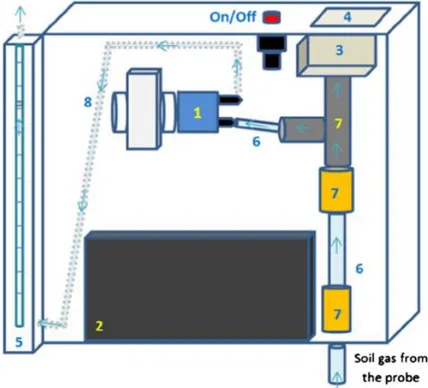
Fig. 2. New permeameter. It consists of a vacuum pump (1), a battery (2), a vacuomete (3), with digital display (4) a fluxmeter (5), vynil tubings (6), metal connectors (7) and electric cables (not shown). Tubings (8) connecting the pump output to the fluxmeter inlet were removed, along with the fluxmeter, at the end of the calibration test (see text for explanation). The arrows indicate air flow within the experimental apparatus.
14
Where:
Q : flow rate measured by the flowmeter ( m3 · s-1 ) μ : dynamic viscosity of air at 10° C ( 1.75 ∙ 10-5 Pa · s-1
)
F : shape factor of the hollow rod driven into the ground ( 0,149 m )
Δp : pressure difference between measuring depth and surface ( Pa )
1.3 Flowmeter
The flowmeter FR2A13BVBN from Key Instruments (now Brooks Instruments) can measure air flow in a range from 0.1 to 1 liter per minute (LPM) so from 1.6 ∙ 10-6 to 1.6 ∙ 10-5 cubic meter per second. It has an high quality metering valve and an easy reading screen scale that allows to measure the values with an accuracy of ± 5%.
The flowmeter can be directly connected with the output of the radonometer to measure the flow rate of the system.
Fig. 3 : Flowmeter
15
Fig. 4 : CO2 detector
1.4 Dräger X-am 7000 (CO2)
The Dräger X-am 7000 is an instrument equipped with infrared sensor that measures CO2 present in the soil. An infrared (IR) lamp releases IR radiations, through a tube filled with air, toward an IR-rays detector, which measures the amount of IR radiations that hit it. As the light passes through the tube, any gas molecules that are the same size as the wavelength of the IR waves absorb the IR radiations, while letting other wavelengths of light pass through.
The remaining waves hit an optical filter that absorbs every wavelength of light except the exact wavelength absorbed by CO2. Finally, an IR detector reads the amount of radiation that was not absorbed by the CO2 molecules or the optical filter. The difference between the amount of light radiated by the IR lamp and the amount of IR light received by the detector is measured. The difference is proportional to the number
16
hose connected with a small mask, starts when the mask is applied on top of the dispositive because the connection turns on the pump inside it.
1.5 RAD7
The radonometer RAD7 is an instrument that indirectly measures the radon (222Rn and
220
Rn), that is an electrically neutral gas, through its decay products (respectively 218Po
and 216Po) that, instead, are electrically charged.
The RAD7 is able to distinguish the different isotopic species (222Rn and 220Rn) through
the energy associated to the different alpha particles produced by the different isotopes and to measure simultaneously both of them.
The detector is an electrostatic collection-based silicon detector placed at the center of the instrument’s inner cell that is covered by a conductive material.
A power supply provides an electrical current that generates a potential difference of 2000 - 2500 V between the electric conductor and the detector. This creates an electrical field that pushes the positively charged particles on the detector, to which they are fixed.
17
Fig. 6 : Alpha energy spectrum
Radon isotopes’ decay radiates an α particle that has a 50% probability to arrive on the detector surface and to generate an electrical signal proportional to its energy. The generated electrical signals are subsequently amplified, measured, counted and converted into digital form. They are collected in a power spectrum represented by a diagram (fig.6) where the abscissa axis shows the energies of α particles (MeV) and the ordinate axis the counts on the detector. Sharing further 200 channels in 8 windows of energy, the RAD7 is able to count separately and simultaneously the decay products of 222
Rn and 220Rn, to consider separately the contribution of a single isotope and to exclude from the count the background due to the isotopes of longer average life. We are interested in the analysis of the first four energy windows in the range 6-9 MeV and
even more in the energies of 6.00 MeV and 6.78 MeV, respectively connected to 218Po
and 216Po.
The radonometer draw off air containing radon or thoron from the soil with a pumping rate of 800 ml/min. There are many different modalities of measuring. We used the "sniff" mode because in this modality the instrument measures the 222Rn and 220Rn only
18
Fig. 7 : RAD7 purging
through the direct decay of, respectively, 218Po and 216Po ignoring the α emissions of successive decays with increased half-life.
The time of response of the instrument is therefore a function of time it takes for the achievement of activity equilibrium between 222Rn and 218Po, which is approximately 15 minutes so almost 4 times radionuclide’s father half-life (3,82 minutes). The equilibrium between 220Rn and 216Po is much faster and it’s reached in less than a second. The "normal" mode includes the analysis of other isotopes so it has a better accuracy of the measurements but needs more response time. The RAD7 is able to perform a continuous monitoring of activity concentrations, with the possibility of subdividing the measures in smaller intervals. At the end of each cycle it’s provided the relative concentration value.
The instrument is provided with a suction pump that allows to draw the air from pores of the soil, within the measuring system, up to the detector cell. After any measurement, in water, air or soil, the sample cell still contains traces of radon analyzed previously, which could influence the results of subsequent measures so that, at the beginning of any new measure, a "purging" cycle is necessary to clean and dry the sensor with
19
circulation of dry air in the RAD7. This is obtained by connecting it with a drying unit
(drierite) because the 218Po must be absent in the system at starting time. The desiccant
unit is composed by a column of calcium sulfates granules (CaSO4) inside a plastic tube
of 6 cm diameter and 28 cm height and an air filter placed at the entrance of RAD7 prevents the introduction of dust particles and charged ions in the cell, which could contaminate the detector. The drierite granules, during the flowing of clean air through the entire system, absorb the relative humidity (RH) of the air reducing the humidity in the system until its values become lower than 6-7%. Normally to reach these low RH values the purging should last about 30 minutes. The activity concentration increases
until it reaches the equilibrium value with the 222Rn, corresponding to the gas
concentration in the soil. In our soil radon measurements have been established to carry out 5 cycles lasting 5 minutes, repeated until equilibration of activity.
1.6 MiniRAE Lite (Photoionization Detector)
The MiniRAE Lite is a photoionization detector (PID) that measures instantaneously the quantitative (ppmv) of the volatile organic compounds (VOCs) present in the sub-soil at a maximum depth or a maximum distance of 30 meters.
This instrument uses a radiation source, an ultraviolet (UV) lamp, to ionize gas molecules and then through an internal pump, that has a sampling flux of 400 cc/min, extracts the gases from the sub-soil by a pipe.The instrument can detect all gases with ionization potentials below 10,6 eV, such as benzene, aromatic compounds, amines, ammonia, ethanol, acetone (Chou, 1999), because the radiation source has a power of 10,6 eV .
20
Fig. 8 : VOCs detector
1.7 SYSCAL Pro Switch
Fig. 9 Geoelectrical arrays: 72 detectors + 48 detectors
Two rectangular grids made, respectively, by 15x5 and 4x12 linear spreads of steel electrodes were utilized to create a 3D image of the resistivity and the chargeability of the subsoil. The first array was oriented with the longest side WNW-ESE with a spacing between the electrodes of 7.5 m in the longest side (x axis) and 2.5 m in the shorter side, with a total size of 35x30 meters; the second one was oriented with the longest side NNE-SSW with a spacing between the electrodes of 2.5 m in both sides with a total length of 27.5 meters and a width of 7.5 meters. It was chosen to overlap the two arrays of 7.5x7.5 meters and to utilize a shorter interdistance in the second array because we
x y
21
needed a more detailed image of that area particularly in the NNE-SSW direction that was the direction of the spill already detected by previous studies.
The electrodes were connected, by multichannel cables, to a georesistivimeter Syscal PRO (Iris Instrument).IP measurements were collected using a pulse length of 1 s with integral chargeability measurements performed during voltage decay after current shut-off.
The SYSCAL Pro Switch is a ten-channels electrical resistivimeter which includes a transmitter, a receiver and a switching unit, that allows to transform linear surveys in 2D or 3D surveys combining several parallel sequences of same electrodes doing grids of measurements (fig. 12 a).
Fig. 10 Switch configuration for 3D imaging
Multi-channel acquisition of resistivity and/or IP data, up to 10 readings at the same time, is obtained using a set of electrodes (normally 24, 48, 72, 96 or 120), connected in a line or in several lines, which number is increased through Switch Pro units that allow to create 3D ground images by overlapping different planar images obtained juxtaposing linear contiguous acquisitions.
22
Fig. 11 Syscal Pro Switch resistivimeter connected with a screen that shows a single linear bi-dimensional geoelectrical profile
Time domain discharge curves due to Induced Polarisation chargeability (IP) are registered for different depths. Apparent resistivity, ρ, is directly proportional to geometrical coefficient, K [m], and to received potential, V [mV], and is inversely proportional to transmitted current, i [mA]. For the data analysis and the 3D interpretation ERTLab software is used.
23
CHAPTER 2
Results of soil gas and intrinsic permeability seasonal surveys in the
study site and in close areas chosen for the determination of the
background
The field part of my PhD study was conduced in a site of Latium Region (Italy) where a hydrocarbons spill occurred and traditional remediation techniques are accomplished. Site location and coordinates are omitted for confidentiality agreement.
The area (Fig. 1) is equipped with wells and piezometers for routine sampling and analysis of pollutants that provide an immediate feedback to this approach. The stratigraphic section from ground level downward consists of about 0.5 m of backfills, 2.5 m of medium sands and 2.5 m of medium-fine sands. The water table fluctuates in the range 0.5 – 2.5 m depth during the year.
A grid of 31 measuring stations was created over a 3000 m2 large zone, where soil 222
Rn, 220Rn, CO2, CH4 and intrinsic permeability were determined at 80 cm depth. A
survey station was installed in the central part of the study area to evaluate soil gas concentration variability as a function of meteorological parameters.
24
Fig. 1 Study area
The station acquires soil temperature and humidity at 30 and 80 cm depth, in order to assess how relevant rainfalls influence water content in the soil, reducing gas release at soil/atmosphere interface.
This study was conducted with a seasonal monitoring of the polluted area throughout the period of my PhD.
Other three sites (Fig.2), with the same geolithological characteristics, a few hundreds meters far from the polluted site, have been investigated to establish a background referring radon, to identify negative anomalies in the study area. In these areas values of concentration of 222Rn, 220Rn, CO2 and intrinsic permeability of soil, have been measured seasonally at 80cm depth.
Viaduct
25
Fig. 2 Background areas
In the study area and in the background sites, data were seasonaly collected from 2013 to 2016. A series of maps was created for each measurement campaign. They are reported in the Appendix.
26
CHAPTER 3
TRACING NAPLS CONTAMINATION IN THE VADOSE ZONE
USING SOIL RADON
Tuccimei P. (a), De Simone G. (a), Curatolo P. (b), Giorgi R. (b), Lucchetti C. (a), Castelluccio M. (a) & Calì A. (b)
(a) Dipartimento di Scienze, Università “Roma Tre”, Largo San Leonardo Murialdo 1, 00146 Roma, Italy. E-mail: [email protected]
(b) Golder Associates, Roma, Via Sante Bargellini 4, 00157 Roma, Italy
Abstract
Frequent spills of Non-Aqueous Phase Liquids (NAPLs), such as petroleum products or chlorinated solvents, occur all around the world contaminating the soil vadose zone or the aquifer. In order to trace the presence of these substances, radon concentration in soil gas can be employed because of its high solubility in NAPLs. Radon available in the soil pores accumulates in the NAPLs producing a local decrease of its concentration in the vicinity of contaminated area. Thus radon minima in the vadose zone can be used to localize NAPL plumes indirectly.
The suitability of this method is here checked by laboratory simulation of a gasoline spill within a known volume of soil. Radon activity concentration strongly drops down right after the injection of gasoline and progressively increases in the following days. This trend is compared with data from a simultaneous experiment carried out on a volume of the same soil, not contaminated by NAPL.
27
Finally, an example of field measurements within a site affected by NAPL contamination is documented. Mapping of soil radon concentration at 80 cm depth shows an area where radon deficit is evident. This region is aligned along the directions of groundwater flow induced by pumping for safety operation of the plant. Radon negative anomalies are not due to low gas permeability and are not correlated with soil
CO2. The comparison of soil gas data with those from nearby background areas confirm
28
Introduction
One of the major problems facing prior-remediation risk assessment at abandoned and/or polluted industrial sites, military bases and petrol stations is ground contamination by non-aqueous phase-liquids (NAPLs) such as fuels or mineral oils. Before appropriate clean-up measures can be designed, the distribution of the contaminants in the subsurface has to be explored and its extent traced.
Therefore on-site activities usually begin with drive point profiling, the actual examination points being located either close to the contamination source or, if known, inside the zone that covers the plume of the contamination. However, because of the given local infrastructure or due to low investigation budgets, the number of such soil sampling points is often limited. Consequently it is hardly ever possible to satisfactorily trace the shape of subsurface NAPL contamination, and this may cause wrong decisions concerning the remediation action.
In order to obtain a sufficiently detailed picture of ground contamination, a complementary detection method which allows a denser network of monitoring points should be desirable (Schubert et al., 2002).
The radioactive noble gas radon, a naturally occurring component of soil gas, exhibits very good solubility in a wide range of NAPLs (Barton, 1991; Lewis et al., 1987, Schubert et al., 2002). Consequently, and given the problems outlined above, the idea was put forward that subsurface NAPL contamination partly traps the soil gas radon, resulting in a local reduction of the soil gas radon concentration in the vicinity of the contaminated soil volume (fig. 1).
29
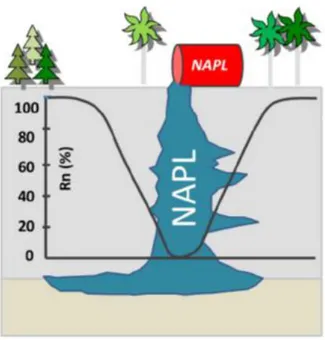
Fig.1 - Local reduction of the soil radon concentration in the area surrounding the contaminated soil volume. Modified after Schubert et al. (2002)
Provided this “NAPL-Effect” is significant, a NAPL contamination could be indirectly localized by carrying out a straightforward radon survey on a sampling grid covering the suspected area.
The aim of this investigation is to verify this principle, reproducing in the laboratory a gasoline spill within a volcanic bedrock and monitor soil radon concentration over a month–period. An example of direct application of this method to a real contaminated site is also presented.
Simulation of a gasoline spill and related radon gas evolution
A large garbage bin was filled with “Tufo di Villa Senni” ignimbrite, a volcanic product available in large quantities in the city of Rome. A PVC tubing (evidenced in blue in fig.2a) allowed us to inject gasoline at the bottom of the container.
An hollow probe was driven into the terrain at a depth of 40 cm, about 10-15 cm above the contaminated soil volume and connected via vynil tubing to a dying unit (identified
30
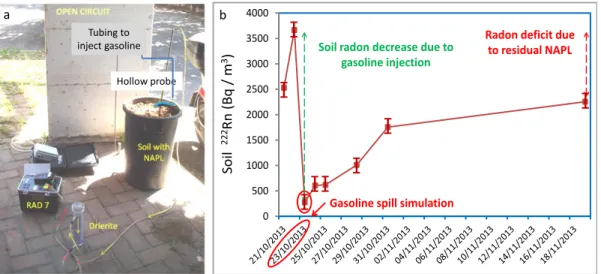
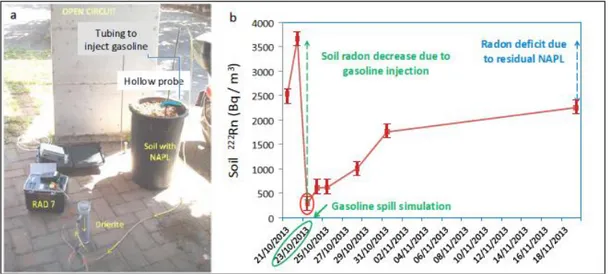
as drierite in fig.2a) and to RAD7 radon monitor (Durridge Co.).Soil radon was measured twice before the gasoline injection, immediately after the spill, and five times more in the following weeks. Figure 2b shows clearly the abrupt drop of concentration right after the NAPL input and a gradual increase of soil radon values over time due to progressive volatilization of the gasoline. The recovery of pristine concentration was not obtained indicating the presence of residual NAPL that still accumulates radon, producing a radon deficit.
This demonstrates the potential of radon in soil gas to detect the presence of residual NAPL in the vadose zone of an aquifer.
0 500 1000 1500 2000 2500 3000 3500 4000 Soil 222 Rn (Bq / m 3)
Gasoline spill simulation
Radon deficit due to residual NAPL
Soil radon decrease due to gasoline injection
a b
Tubing to inject gasoline
Hollow probe
Fig. 2 –Experimental set-up used to simulate a gasoline spill and monitor related soil radon concentration evolution (a). Radon activity concentration in soil gas during the test (b).
Example of radon and CO2 mapping in a real contaminated site
The “radon-deficit technique”, firstly called this way by Semprini et al (1998), was applied to a real contaminated site whose location and coordinates are omitted for confidentiality agreement.
The work was performed in a site of Latium Region (Italy) where a hydrocarbons spill occurred and traditional remediation techniques are accomplished. The area is equipped
31
with wells and piezometers for routine sampling and analysis of pollutants that provide an immediate feedback to this approach. The stratigraphic section from ground level downward consists of about 0.5 m of backfills, 2.5 m of medium sands and 2.5 m of medium-fine sands. The water table fluctuates in the range 0.5 – 2.5 m depth during the year.
A grid of 31 measuring stations was created over a 3000 m2 large zone, where soil 222
Rn, 220Rn, CO2, CH4 and intrinsic permeability were determined at 80 cm depth. A
survey station was installed in the central part of the study area to evaluate soil gas concentration variability as a function of meteorological parameters. The station acquires soil temperature and humidity at 30 and 80 cm depth, in order to assess how relevant rainfalls influence water content in the soil, reducing gas release at soil/atmosphere interface.
Soil gas and permeability surveys were performed at the end of the winter in the contaminated site and in a background area, located few hundred meters far away. Similar grids with multiple measuring stations were used here.
32
Soil
222Rn
(Bq
/m
3)
Soil
CO
2(%
)
a
b
c
d
Contaminated site
Contaminated site
Background area
Background area
Fig. 3 – Soil 222Rn concentration in the contaminated site (a) and in the background area (b). Soil CO2 concentration in the contaminated site (c) and in the background area (d).
33
Winter maps of soil 222Rn concentration in the contaminated area (fig. 3a) and in the background site (fig. 3b) where created using the program Surfer. Figure 2 shows that winter radon concentrations in the study area are, on average, much lower than in the background zone. In particular, radon lower concentrations in the background are around 22,000–23,000 Bq/m3, while the lowest values in the study area stay around
2,000 – 5000 Bq/m3, in spite of similar stratigraphy and measuring period. This region
is aligned along the directions of groundwater flow induced by pumping for safety operation of the plant (fig. 3a).
Radon negative anomalies in the contaminated site are not due to low soil gas permeability because this parameter is substantially constant everywhere and always reaches high values ( > 4.0 · 10-12 m2).
Another significant result is related to the spatial correlation between soil 222Rn and CO2. In the background area, the two gases are directly correlated (fig. 3b and 3d)
because CO2 works as carrier for radon. On the other hand, radon minima in fig. 3a are
not correlated with CO2 negative values (fig. 3c), because carbon dioxide is not soluble
in NAPL and is not trapped and accumulated by NAPLs. Consequently the highest CO2 concentrations are located where radon deficits and residual NAPL occur. This finding could be also due to a process of microbial degradation of the NAPL in the subsoil.
34
Conclusions
The use of the soil radon deficit to delineate the spatial extent of NAPL-bearing zones is demonstrated either by laboratory simulation of a NAPL spill, or through multi-parameter monitoring and mapping in a contaminated site in Latium Region (Italy). The use of this technique is fruitful to obtain a sufficiently detailed picture of ground contamination for the preliminary evaluation of NAPL contaminated sites to be joined with conventional investigation methods such as drive point profiling or the direct detection of organic carbons and their derivatives in the soil gas.,
In addition, it may be employed to assess the effectiveness of NAPL remediation and to provide an indicator that NAPL has been removed.
Despite the potential suitability of radon surveys as a tool for investigating subsurface NAPL contamination, the detection method presented here also has its limitations. The sensitivity depends on the depth of contamination that is within the range of the diffusion length of radon in soil (plus the depths from which the soil gas samples are taken from). The diffusion length of radon in soil is about 2 meters in dry and sandy soils and even less in more dense/impervious materials.
Finally summer season enhances gas exhalation from soil reducing and partly annealing the radon minima which are much more evident in winter when topsoil behaves as a closed system to radon release to the atmosphere.
35
References
Barton A. F. M. (1991) - Handbook of solubility parameters and other cohesion parameters 2nd ed., CRC Boca Raton/FL/USA.
Lewis C., Hopke P. K. & Stukel J. (1987) - Solubility of radon in selected perfluorocarbon compounds and water. Industrial Engineering & Chemical Research, 26, 356-359.
Schubert M., Freyer K., Treutler H. C. & Weiss H. (2002) - Using radon-222 in soil gas as an indicator of subsurface contamination by non-aqueous phase-liquids (NAPLs). Geofísica Internacional, 41, 433-437.
Semprini L., Hopkins O.S. & Tasker B.R. (2000) - Laboratory, field, and modeling studies of Radon-222 as a natural tracer for monitoring NAPL contamination." Transport in Porous Media, 38, 223-240.
36
CHAPTER 4
USING NATURAL RADON AS A TRACER OF GASOLINE
CONTAMINATION
Gabriele De Simone a, Gianfranco Galli b, Carlo Lucchetti a, Paola Tuccimei a*
a: Dipartimento di Scienze, Universit. a “Roma Tre”, Roma, Italy
b: Istituto Nazionale di Geofisica e Vulcanologia, Sezione Roma, Roma, Italy
Abstract
Radon concentration in soil gas can be employed to trace the presence of gasoline contamination because it is very soluble in hydrocarbons. Radon available in the soil pores accumulates in the contaminated volume, producing a local deficit at shallow depth that can be easily mapped. The suitability of this method is here checked by field simulation of a gasoline spill and by laboratory experiments where known amounts of a volcanic tuff contaminated with increasing gasoline show proportional drops of radon exhalation rates.
37
Introduction
Spills of gasoline, or other Non-Aqueous Phase-Liquids (NAPLs) can lead to significant contamination if not handled quickly and properly. Any appropriate actions need a good knowledge of the contaminant extension in the subsoil. Standard practice is to excavate visible contamination or to drill monitoring-wells for the purpose of collecting samples for analysis. However, it is expensive and difficult to satisfactorily trace the shape of subsurface NAPL pollution this way. In order to obtain a sufficiently detailed picture of ground contamination, a complementary detection method which allows a denser network of monitoring points should be desirable [1]. The radioactive noble gas radon, a naturally occurring component of soil gas, exhibits very good solubility in a wide range of NAPLs [1, 2, 3]. Consequently, subsurface NAPL contamination partly traps the soil gas radon,
resulting in a local reduction of the soil gas radon concentration in the vicinity of the contaminated soil volume (Fig.1).
Fig. 1. Local reduction of soil radon concentration in the area surrounding the contaminated soil volume. Modified after Schubert et al. [1]
38
Provided this “NAPL-Effect” is significant, a NAPL contamination could be indirectly localized by carrying out a straightforward radon survey on a sampling grid covering the suspected area.
The aim of this investigation is to verify the principle, reproducing a gasoline spill within a volcanic bedrock and monitor soil radon concentration over following weeks. Laboratory tests are also presented to quantify radon exhalation decrease as a function of volumes of added gasoline.
Simulation of gasoline spills
In order to verify the principle, gasoline spills were reproduced in the laboratory and in the field, choosing a volcanic bedrock because of its high radon activity concentration (100 – 200 kBq/m3). Radon in soil gas was then monitored over following weeks to assess its evolution.
Laboratory simulation of a gasoline spill
A large garbage bin was filled with “Tufo di Villa Senni” ignimbrite, a volcanic product available in large quantities in the city of Rome. A PVC tubing (evidenced in blue in Fig. 2a) allowed us to inject gasoline at the bottom of the container. A hollow probe was driven into the terrain at a depth of 40 cm, about 10-15 cm above the contaminated soil volume and connected via vinyl tubing to a drying unit (identified as drierite in Fig. 2a) and to RAD7 radon monitor (Durridge Co.).
Soil radon was measured twice before the gasoline injection, immediately after the spill, and five times more in the following weeks. Fig. 2b shows clearly the abrupt drop of concentration right after the NAPL input and a gradual increase of soil radon values over time due to progressive volatilization of the gasoline. The recovery of pristine
39
concentration was not obtained, indicating the presence of residual NAPL that still accumulates radon, producing a radon deficit. This demonstrates the potential of radon in soil gas to detect the presence of residual NAPL in the vadose zone of an aquifer.
Fig. 2. Experimental set-up used to simulate a gasoline spill and monitor related soil radon concentration evolution (a). Radon activity concentration in soil gas during the test (b).
Field simulation of a gasoline spill
A second spill was reproduced in Vallerano town (Lazio Region, Italy), where pyroclastic flow deposits (Ignimbrite D) from Vico volcano outcrop. Two liters of gasoline were poured in the center of the area at 80 cm depth and soil radon was monitored at 15 sampling stations using a grid of 3x5 m, before, just after the spill and over the following months. Soil radon concentration at the spill point fell from about
700 to 7 kBq/m3 (few hours after the contamination event). A week later the
concentration was still the same, but increased up to about 60 kBq/m3 four months later. It is worth noting that the deficit effect was closely restricted to the contaminated station, because sites located just 3 meters apart just showed slight decreases around half or one third of the starting value. Stations at five meters distance did not display any departure from initial condition (Fig. 3).
40
Fig. 3. Percent reduction of soil radon concentration in Vallerano (Lazio Region, Italy), following a simulated gasoline spill at different monitoring stations located over a 3 x 5 m grid of 15 measurements points.
The presence of gasoline is very well indicated by high concentration of H2S (up to about 370 ppm at the spill point), due to the residual sulphur component in the gasoline after the oil refining process.
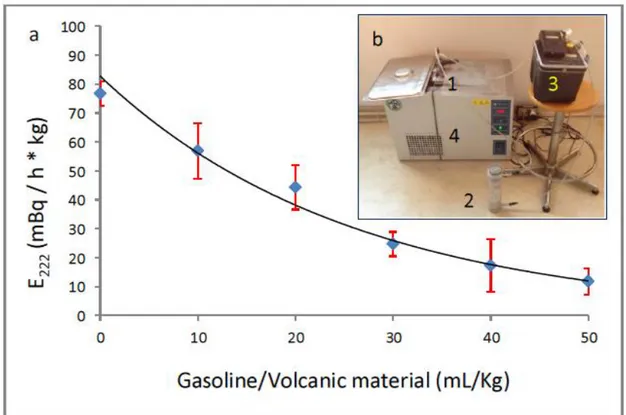
Decrease of radon exhalation rate of a volcanic material induced by addition of gasoline
Seven hundreds grams of a volcanic material (Villa Senni tuff from Colli Albani volcano, Roma, Italy) have been grounded, dried at 100°C and placed in a stainless steel accumulation chamber, connected to a drying device (drierite) and to the radon monitor in a closed-loop circuit. The chamber is located in a thermo-refrigerating bath, set at 35°C to keep constant temperature during the measurement and enhance the raon exhalation [4]. The different experiments were carried out adding different amount of gasoline (from 0 to 25 mL) to the tuff, resulting in gasoline/material ratios (mL/kg) from 0 to 50. Each tests had a duration of 24 hours, with 12 two hours long cycles,
41
keeping relative humidity below 10% inside the radon monitor. As reported in Fig, 4, radon mass exhalation rates exponentially reduce with increasing gasoline volumes, probably because more radon is progressively dissolved in gasoline. These experiments need a further control in order to assess if drierite absorbs vaporized gasoline where radon is partly dissolved.
Fig. 4. Decrease of radon exhalation rate of Villa Senni tuff induced by the addition of different volumes of gasoline (a). The experimental set-up consists of: the accumulation chamber containing the contaminated volcanic material (1), the drierite (2), the radon monitor (3), the thermorefrigerating bath (4), connected by vinyl tubing in a closed-loop circuit (b).
42
References
1. Schubert M, Freyer K, Treutler HC, Weiss H. Using radon-222 in soil gas as an indicator of subsurface contamination by non-aqueous phaseliquids (NAPLs). Geofísica Internacional 2002; 41: 433-437.
2. Barton AFM. Handbook of solubility parameters and other cohesion parameters. 2nd ed. Boca Raton/FL/USA: CRC; 1991.
3. Lewis C, Hopke PK, Stukel J. Solubility of radon in selected perfluorocarbon compounds and water. Industrial Engineering & Chemical Research 1987; 26: 356-359.
4. Tuccimei P, Castelluccio M, Moretti S, Mollo S, Vinciguerra S, Scarlato P. Thermal enhancement of radon emission From geological materials. Implications For laboratory experiments on rocks under increasing deformation. In: Benjamin V, Szigethy J, editors. Horizons in Earth Science Research, Volume 4, New York: Nova Science Publishers; 2011. p. 247-256.
43
CHAPTER 5
LABORATORY SIMULATION OF RECENT NAPL SPILLS TO
INVESTIGATE RADON PARTITION AMONG NAPL VAPOURS
AND SOIL AIR.
Gabriele De Simone a, Carlo Lucchetti a,Francesca Pompilj a, Gianfranco Galli b, Paola Tuccimei a.
a: Dipartimento di Scienze, Universit. a “Roma Tre”, Roma, Italy
b: Istituto Nazionale di Geofisica e Vulcanologia, Sezione Roma, Roma, Italy
Abstract
Soil radon is employed to trace residual NAPL (Non-Aqueous Phase Liquid) contamination because it is very soluble in these substances and is strongly depleted over polluted volumes of the subsoil. The solubility of radon into NAPL vapors, generally poorly considered, is investigated here, either as growth of radon exhalation from a material contaminated with increasing volumes of kerosene, or as radon partition between liquid kerosene, water and total air, considered ad the sum of kerosene vapors plus air.
Radon concentration in soil gas can be employed to trace the presence of gasoline contamination because it is very soluble in hydrocarbons. Radon available in the soil pores accumulates in the contaminated volume, producing a local deficit at shallow
44
depth that can be easily mapped. The suitability of this method is here checked by field simulation of a gasoline spill and by laboratory experiments where known amounts of a volcanic tuff contaminated with increasing gasoline show proportional drops of radon exhalation rates.
45
1. Introduction
In the last two decades radon has been used as environmental tracer for the localization and assessment of residual Non-Aqueous Phase Liquid (NAPL) contamination in soil (Semprini et al., 2000; Hohener and Surbeck, 2004; Schubert et al, 2001; 2005; 2015). It was shown that a local radon deficit (compared to site specific radon background concentration) corresponds to portions of the subsoil that are contaminated with NAPL, because of preferential partitioning of radon into the residual organic phase. Hence, carrying out a straightforward survey of the local radon distribution pattern in the soil gas allows to localize the contaminated zone (Schubert et al., 2015).
Nevertheless, quantitative estimation of the NAPL saturation of the soil pore space requires the knowledge of the radon partition coefficient specific for the NAPL present. This study focuses on the role of the vaporized fraction of NAPL on changes of radon concentration in the soil gas in case of recent spill, when a significant amount of vapors can be still found in the soil gas. The phenomenon is investigated through laboratory experiments regarding either the growth of radon exhalation from material contaminated with increasing volumes of kerosene, or the determination of radon partition between liquid kerosene, water and air, with NAPL vapors enhancing radon transport in the air. Many instruments employed to measure radon (such as RAD7 produced by Durridge Company Inc. or Trace Environmental Level detector by Pylon Electronics Inc.) make use of a desiccant, such as drierite (WA Hammond Drierite Co., Ltd) to avoid the interference of water molecules on the electrostatic collection of radon daughters (De Simone et al., 2016), but drierite is suspected to absorb NAPL vapors, capturing the radon dissolved in it, as well (De Simone et al., 2016), so the desiccant is not introduced in the experimental set-up. However, it is still possible to use electrostatic
collection-46
based radon monitors, provided that proper corrections for absolute humidity are applied, as in the case of RAD7 (De Simone et al., 2016).
2. Material and Methods
The soil used for the experiments is of volcanic origin and has been collected from Valle della Caffarella area (Roma, Italy) where ignimbrites from Colli Albani Volcano largely outcrop. This kind of material (known as Pozzolanelle ignimbrite) is a member of Villa Senni Unit and has been chosen for the experiments because it is enriched in 226
Ra (150 ± 5 Bq/kg) and 232Th (221 ± 5 Bq/kg), precursors of 222Rn and 220Rn, respectively (Castelluccio, 2010).
Groundwater employed for the determination of radon partition coefficient between kerosene, water and air is very rich in 222Rn (238 ± 2 Bq/L, Lucchetti et al., 2016) because it circulates within a volcanic aquifer related to Colli Albani volcano (“Complesso delle Vulcaniti Indifferenziate” hydrogeological unit, Capelli et al., 2012). Kerosene used for the experiments is distributed by PIC S.r.l., as “Petrolio Bianco”, white petroleum. It is a clear liquid formed from hydrocarbons obtained from the fractional distillation of petroleum between 150 °C and 275 °C, resulting in a mixture with a density of 0.78–0.81 g/cm3 composed of carbon chains that typically contain between 6 and 16 carbon atoms per molecule.
The accumulation chamber is a modified pressure cooker, connected to a RAD7 radon monitor (Durridge Co.) in a closed-loop circuit. The description of the experimental set-up can be found in Tuccimei et al. (2009; 2011).
47
Radon contained in water solution was captured onto charcoal canister and counted using a NaI(Tl) scintillator (3 × 3 in.), optically coupled to a photomultiplier, at INGV laboratories, Roma (see Lucchetti et al., 2016).
Volatile Organic Compounds (VOCs) concentration was determined using a MiniRaeLite (Extratech) photoionization detector, equipped with a built-in pump to sample the air in the closed-loop circuit.
3. Experimental
3.1 Measurements of radon exhalation at increasing kerosene content Experiment 1
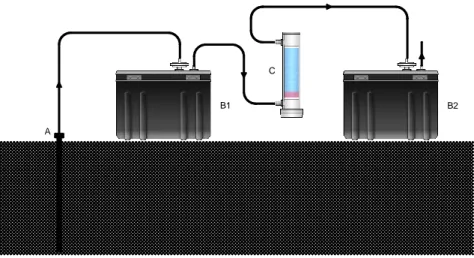
The experimental setup used for experiment 1 is reported in Fig. 1. The experiment configuration, consists of: i) an accumulation chamber where 650 g of a dried ignimbrite are placed; ii) vinyl tubing to connect the chamber to a radon monitor in a closed-loop array; iii) a RAD7 radon monitor (Durridge Co.) kept in a laboratory oven set at 43; °C and iv) a thermo-refrigerating bath hosting the accumulation chamber, set at 35°C to keep the exhalation temperature at constant condition. This procedure was planned to guarantee a nominal temperature difference of 8°C between the radon monitor and the accumulation chamber to avoid condensation effects of NAPL on the surface of the silicon detector, considering that no drierite or other traps are included in the circuit.
48 Accumulation chamber Thermo-refrigerating bath RAD7 in the oven
Fig.1. Set-up used for experiment 1. See text for explanation.
Several tests were carried out to quantify the effect of increasing kerosene content (0, 5 10, 15, 20, 25 mL) on radon exhalation. At the end of each test (24-hour long), the amount of kerosene vapors was measured by introducing a MiniRae Lite photo-ionization detector (Extratech) for total Volatile Organic Carbon (VOC) in the circuit. Proper clamps were employed to avoid the loss of air during the insertion of the Minirae Lite. Radon exhalation rate (E220, Bq h-1 kg-1) was calculated from each test using the 220
Rn (thoron) signal which was stronger than that of 222Rn and reached the equilibrium
already in the first 2-hour cycle. Exhalation rates (E220) were obtained according the following equation:
E220 = 220RnC * Vb * 220 / M (equation 1) where:
220
RnC (Bq/m3) = average thoron activity concentration (220Rn), corrected for decay
occurred during transport from the accumulation chamber to RAD7 and for the water interference
49
220 (h-1) = 220Rn decay constant
M (kg) = mass of dried material (about 0.650 kg)
The average thoron activity concentration is calculated as follows: 220
RnC (Bq/m3) = 220Rn / (W * D)
(equation 2) with
W = correction, if necessary, for the water content in RAD7 that reduces the efficiency of the silicon detector (see De Simone et al., 2016)
D = correction for decay.
3.2 Determination of radon partition coefficients between kerosene, water and air
Experiment 2 (I-type)
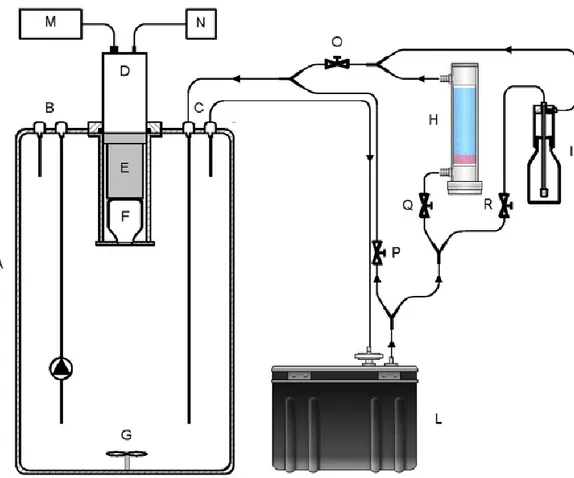
A large volume of spring water was sampled and transferred into a water enricher, to keep it well-mixed by continuous circulation. About 0.58 L were spilled into a bottle, where dissolved radon was stripped by air bubbling, absorbed onto a charcoal canister and gamma-counted (Galli et al., 1999); 0.37 L were introduced into the stopper of a 0.73 L separatory funnel placed upside down, where 0.37 L of kerosene had been previously added (Fig. 2a). Consequently, a ratio of 1 : 1 between kerosene and water was obtained, as in Schubert et al. (2005).
50 air + radon IN water IN enriched water OUT circulator pump water air + radon separatory funnel A B C
Fig. 2. Set-up used for experiment 2 (Fig. 2a). Separatory funnel for determination of radon partition coefficients between kerosene and water (I-type, Fig. 2b) and between kerosene-water-air (II- and III-type Fig. 2c).
The separatory funnel was then vigorously shaked for 3 minutes and after a time of 5 minutes, necessary for the complete separation of the phases, water was collected from the funnel (now in normal position, Fig. 2b) into another 0.58 L bottle. Radon was then stripped from the bottle, absorbed onto a charcoal canister and counted. This procedure was repeated four times for calculating radon partition coefficient between kerosene and water.
Radon partition coefficient between kerosene and water (K ker-wat ) was calculated according to the following equation: