www.nature.com/scientificreports
Fragment optimization for GPCRs
by molecular dynamics free energy
calculations: Probing druggable
subpockets of the A
2A
adenosine
receptor binding site
Pierre Matricon
1, Anirudh Ranganathan
2, Eugene Warnick
3, Zhan-Guo Gao
3, Axel Rudling
2,
Catia Lambertucci
4, Gabriella Marucci
4, Aitakin Ezzati
2, Mariama Jaiteh
1, Diego Dal Ben
4,
Kenneth A. Jacobson
3& Jens Carlsson
1Fragment-based lead discovery is becoming an increasingly popular strategy for drug discovery. Fragment screening identifies weakly binding compounds that require optimization to become high-affinity leads. As design of leads from fragments is challenging, reliable computational methods to guide optimization would be invaluable. We evaluated using molecular dynamics simulations and the free energy perturbation method (MD/FEP) in fragment optimization for the A2A adenosine receptor, a pharmaceutically relevant G protein-coupled receptor. Optimization of fragments exploring two binding site subpockets was probed by calculating relative binding affinities for 23 adenine derivatives, resulting in strong agreement with experimental data (R2 = 0.78). The predictive power of MD/FEP was significantly better than that of an empirical scoring function. We also demonstrated the potential of the MD/FEP to assess multiple binding modes and to tailor the thermodynamic profile of ligands during optimization. Finally, MD/FEP was applied prospectively to optimize three nonpurine fragments, and predictions for 12 compounds were evaluated experimentally. The direction of the change in binding affinity was correctly predicted in a majority of the cases, and agreement with experiment could be improved with rigorous parameter derivation. The results suggest that MD/FEP will become a powerful tool in structure-driven optimization of fragments to lead candidates.
Fragment-based lead discovery (FBLD) has rapidly become a well-established technique in early drug develop-ment1. Several lead candidates developed using FBLD have already reached clinical trials, resulting in two FDA
approved drugs2. In contrast to high-throughput screening (HTS), where large numbers (~105–106) of drug-sized
molecules are tested experimentally, FBLD focuses on smaller libraries (typically 1000–5000 compounds) with molecules of low molecular weight (<300 Da)2, 3. By limiting the size of the molecules in the library, fragment
screening achieves a much broader coverage of chemical space than HTS due to the astronomical number of possible drug-like molecules. The low molecular complexity of fragments also reduces the probability for steric mismatches with the receptor, leading to the discovery of ligands that optimally complement subpockets of the binding site4, 5. Consequently, screening of fragment libraries often delivers high hit-rates and diverse starting
points for lead development2, 3. However, the ligands that emerge from fragment screening typically have low
affinities and, in the second step of FBLD, these compounds need to be optimized to yield potent and selective lead candidates.
1Science for Life Laboratory, Department of Cell and Molecular Biology, Uppsala University, BMC, Box 596, SE-75124, Uppsala, Sweden. 2Science for Life Laboratory, Department of Biochemistry and Biophysics, Stockholm University, SE-10691, Stockholm, Sweden. 3Molecular Recognition Section, Laboratory of Bioorganic Chemistry, National Institute of Diabetes and Digestive and Kidney Diseases, National Institutes of Health, Bethesda, Maryland, 20892, United States. 4Scuola di Scienze del Farmaco e dei Prodotti della Salute, Università degli Studi di Camerino, Via S. Agostino 1, 62032, Camerino (MC), Italy. Pierre Matricon and Anirudh Ranganathan contributed equally to this work. Correspondence and requests for materials should be addressed to J.C. (email: [email protected]) Received: 24 November 2016
Accepted: 23 May 2017 Published: xx xx xxxx
Fragment-to-lead optimization has proved to be a very challenging step in FBLD2. Prioritization of fragments
for optimization is often guided by ligand efficiency (defined as the free energy of binding divided by the num-ber of heavy atoms of the compounds6) and access to atomic resolution information regarding binding modes7.
Recently, more intricate criteria, e.g. based on the thermodynamic binding profiles of the fragments, have also been suggested to be an important factor in the selection of starting points for optimization8. Two main
strat-egies for fragment-to-lead optimization, “linking” and “growing”, have been proposed2. Although “linking” of
compounds occupying different subpockets of a binding site has been successful in some cases, “growing” of the fragment by iterative additions of smaller chemical groups has become more widely used2, 3. In either case, access
to high-resolution crystal structures of fragments bound to the target often makes crucial contributions to the optimization process7. Whereas computational methods for structure-based ligand design are routinely used
for drug-sized molecules9, applications of such approaches to fragment optimization have been more scarce10.
The fact that fragments are weak ligands, only occupy a small fraction of the binding site, and may have multiple binding modes adds extra levels of complexity that are challenging to predict with simplified models such as empirical scoring functions. Furthermore, scoring functions developed for computer-aided ligand design have been parameterized based on drug-like compounds, and it has been suggested that these may not be suitable for fragment ligands11, 12. Molecular dynamics (MD) simulations in combination with alchemical free energy
methods, which explicitly consider contributions to binding from conformational flexibility and interactions with water molecules, could provide a rigorous approach to guide fragment optimization13, but this technique
has only recently been applied to FBLD10. Accurate predictions of relative binding affinities for analogs to ligands
identified by fragment screening could improve the efficiency of FBLD, further establishing this approach as a groundbreaking strategy for early drug development.
In this work, the utility of MD combined with alchemical free energy methods in fragment optimization was explored for the human A2A adenosine receptor (A2AAR), a G protein-coupled receptor (GPCR) relevant
for drug development14 against Parkinson’s disease15 and cancer16. Multiple high-resolution crystal structures of
the A2AAR have recently been determined17, 18 and numerous fragment-sized ligands have been identified to this
target19–21, making it an ideal test case for evaluating a computational approach. Calculation of relative binding
affinities using MD simulations in combination with the free energy perturbation (MD/FEP) method was first benchmarked retrospectively for 23 fragment-sized compounds22, 23. The MD/FEP technique was also used to
assess multiple binding modes and predict the thermodynamic signatures governing changes in binding affin-ity, which are both factors of major interest in the optimization process. In a second step, MD/FEP was applied prospectively to predict relative affinities for 12 fragment-sized compounds with unknown binding affinities, fol-lowed by experimental evaluation of these in pharmacological assays. In light of the results, the feasibility of using MD simulations in combination with alchemical free energy methods as a tool in fragment-to-lead optimization will be discussed.
Results
Mapping binding site subpockets using free energy calculations for fragment ligands.
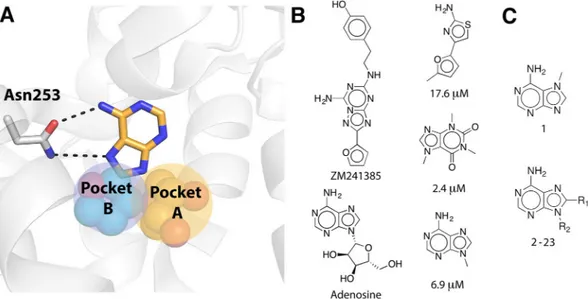
Analysis of available A2AAR crystal structures in complex with agonists18 and antagonists17, 24 revealed that the orthostericsite, i.e. the binding site of the native agonist, has several subpockets that could accommodate fragment-like ligands (Fig. 1). Hydrogen bonding to Asn253 has been identified as a key interaction for ligand recognition and this part of the binding site has also been demonstrated to be a hot-spot for fragment binding21, 24. Fragment-sized
ligands occupying this region could be further optimized by extension into two additional buried subpockets of the orthosteric site (Fig. 1). The first of these is the ribose-recognizing site (pocket A) and the second is a pocket located below the adenine moiety of adenosine (pocket B). To explore if MD/FEP could guide fragment growth into the two different subpockets, relative binding free energies (ΔΔGbind) for 20 pairs of adenine-derived
com-pounds (Table 1) were calculated using the thermodynamic cycle shown in Fig. 2. The relative binding affinity for a compound pair was calculated from alchemical transformations of one ligand into another in complex with the receptor and in aqueous solution (Fig. 2)13. Experimental binding affinities from radioligand binding assays were
available for 20 adenine derivatives (1–17, 19, 22–23)22, 23 and were determined in this work for three additional
adenine-based compounds (18, 20, and 21, Supplementary Table 1). The compound pairs differed by one to five heavy atoms and spanned up to >500-fold changes in binding affinity. Adenine-based ligands devoid of a ribose-like group are typically antagonists of the A2AAR, which was also confirmed for four selected compounds (5, 19,
22, 23) by measuring inhibition of agonist-induced cAMP production (Supplementary Figure 1). Based on these results, a high-resolution structure of the A2AAR in an inactive conformation (PDB code 4EIY)17 was used in the
simulations, and initial ligand binding modes were generated by aligning the adenine moiety to the adenine-like core of the co-crystallized antagonist. All MD simulations were performed in a spherical system centered on the binding site with explicit representation of protein, solvent, membrane, and ligand. Each MD/FEP calculation was divided into several steps, corresponding to transformations for electrostatics, Lennard-Jones, and relevant bonded force field energy terms. The number of steps and simulation length of each MD/FEP calculation were optimized to achieve convergence and the uncertainty of each step was <0.4 kcal/mol in all cases, with an average of 0.1 kcal/mol for all transformations. Three independent sets of simulations with an average total length of close to 100 ns were used to calculate the relative binding free energy for each compound pair (a total of 1.9 µs for the 20 compound pairs).
The first set of 10 pairs of adenine derivatives (Table 1) probed opportunities for growing fragments into the ribose-recognizing site (pocket A, Fig. 1) and mainly involved substitutions in the N9-position of the adenine scaffold (Table 1). The average unsigned error for this set of relative binding free energies was 0.66 kcal/mol, resulting in strong correlation with experimental binding data (Fig. 3, R2 = 0.75). Relative free energies involving
compounds 1 and 11 were not included in the analysis of correlation with experimental data as reliable Ki values
www.nature.com/scientificreports/
(Ki > 100 μM). However, it should be noted that MD/FEP correctly predicted the direction of the shift in binding
free energies in both cases. One example of successful fragment growth into pocket A was observed for addi-tion of a methyl group in the N9-posiaddi-tion of the adenine scaffold (compounds 3 and 4). This resulted in a large improvement of the binding affinity (2.0 kcal/mol), which was also reproduced by the calculated free energy change of 2.4 kcal/mol. Interestingly, substituents larger than two heavy atoms in pocket A typically reduced binding affinities. For example, replacement of a 9-ethyl substituent by 2-hydroxyethyl, isobutyl or propyl moie-ties led to losses of binding affinity, which were also captured the MD/FEP calculations.
The second compound set explored the effects of substituents in the C8-position of the adenine scaffold, which extended into pocket B. A bromine in this position (compound 3) led to a 58-fold increase in affinity compared to the unsubstituted compound 2. This effect was also captured by the free energy calculations, which predicted an improvement in binding corresponding to 2.3 kcal/mol between compounds 2 and 3, in close agreement with the experimental value (2.4 kcal/mol). Interestingly, changes in affinity from addition of a bromine in the C8-position
Figure 1. (A) Orthosteric binding site of the A2AAR shown as white cartoon with Asn253 in sticks. The adenine
group is shown in sticks with carbon atoms in gold and hydrogen bonds indicated with black dashed lines. Two adjacent subpockets are shown as spheres with yellow (pocket A, ribose group of endogenous agonist adenosine from the crystal structure with PDB code 2YDO)18 and cyan (pocket B, furan group of antagonist
ZM241385 from the crystal structure with PDB code 4EIY)17 carbon atoms. (B) Two adenine-based and three
fragment-sized ligands of the A2AAR. Ki values are provided for the fragment ligands21, 22, 24. (C) 2D structures of
compounds 1–23. The R-groups are shown in Table 1.
Figure 2. Thermodynamic cycle used to calculate relative free energies of binding (ΔΔGbind) from MD
simulations. Alchemical transformations of the ligands L and L’ were performed in aqueous solution (ΔGaq, left
panel) and bound to the receptor (ΔGprot, right panel). The protein is shown as green cartoon and the ligand is
depicted in sticks. Water molecules are shown as red spheres and membrane carbon atoms are represented by grey spheres.
were dependent on the substituent in the N9-position. This interdependency of the two substituents was also captured by the calculated binding free energies for this subset of four compound pairs (2–3, 5, 9, and 14–17). Another series of compounds with an ethyl group in the N9-position and varying substituents in C8-position (9 and 18–23) was also considered. A 10-fold increase of binding affinity compared to compound 9 was obtained for the C8-methyl substituent (compound 18) and addition of a hydroxyl group in the same position (compound
20) also resulted in improved binding. The relative binding free energies for a majority of the considered pairs
exploring pocket B were within 1 kcal/mol of the experimental value (Fig. 3). However, for the pair consisting of 8-alkoxy-9-methyladenine derivatives 23 and 21, there was a large discrepancy between the published experi-mental affinity and relative binding free energy calculated from MD simulations. The experiexperi-mentally determined values23 indicated a >1000-fold loss of binding affinity, as compound 23 showed no significant binding (reported
Ki value > 100 μM), whereas the calculated value suggested that the two compounds had similar affinity. As this
was a major outlier among the considered compound pairs, compound 23 was retested in a radioligand binding assay at the A2AAR. The Ki value was determined to be 95 nM for compound 23 (Supplementary Table S1),
lead-ing to a relative free energy of −0.8 kcal/mol, which was in better agreement with the prediction and resulted in a strong correlation with experiment for the second compound set (R2 = 0.75, Fig. 3).
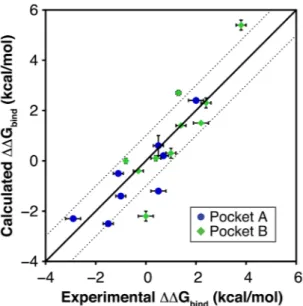
The ability of MD/FEP to predict changes in affinity was further highlighted by the strong correlation between experimental and predicted binding free energies for the full set of 18 compound pairs (R2 = 0.78, Fig. 3). To
assess the influence of experimental uncertainties on this result, the correlation was calculated for 1000 random selections of either the maximal or minimal Ki value obtained from the 95% confidence interval, which resulted
in R2 = 0.75 with a standard deviation of 0.1. It should also be noted that the correlations between the
exper-imentally determined relative binding affinities and trivial size-descriptors, e.g. the difference in the number of heavy atoms (R2 = 0.10) or predicted 1-octanol/water partition coefficients (AlogP, R2 = 0.44), were low. In
order to compare our results to an empirical scoring function, the adenine derivatives were also docked to the orthosteric site using the GLIDE docking program25 and binding free energies were calculated with the standard
precision (SP) scoring function for the 18 compound pairs. All of the docked compounds reproduced the binding mode expected from crystal structures of the A2AAR in complex with adenine-based ligands. The correlation with
experimentally determined relative binding free energies for GLIDE-SP (R2 = 0.42, Supplementary Figure 2) was
similar to that obtained for ALogP and significantly lower than for MD/FEP.
Assessment of alternative binding modes and thermodynamic signatures of fragment
bind-ing.
The use of MD/FEP in fragment optimization could be limited by the uncertainty associated with ligand binding modes if a crystal structure of the complex is not available. As fragments are small, such compounds can bind in a large number of orientations and it may be challenging to rank these with more simplified models,e.g. molecular docking scoring functions12, 26. The calculations for 9-methyl adenine derivatives 2 and 3 were
extended to explore two alternative binding modes identified by the molecular docking study carried out by Lambertucci et al.22 (Fig. 4A and B). Both proposed binding modes predicted a hydrogen bond between the
exo-cyclic nitrogen of the adenine moiety and the side chain oxygen of Asn253. The first binding mode involved an additional hydrogen bond between the N7 of the adenine-moiety and the side chain nitrogen donor of Asn253, leading to an orientation that was essentially identical to that observed in the crystal structure of the A2AAR
in complex with adenosine (Fig. 1)18. In the alternative orientation, a hydrogen bond with the N1 atom of the
Figure 3. Comparison of calculated and experimental relative binding free energies (ΔΔGbind) for 18
compound pairs. The solid line represents prefect agreement between calculated and experimental data whereas the dotted lines represent an absolute deviation of 1 kcal/mol. Experimental and computational error bars correspond to the data reported in Table 1.
www.nature.com/scientificreports/
adenine moiety was instead obtained, resulting in a second distinct binding mode. The relative binding affinity of the two poses (Fig. 4A and B) was calculated by alchemically transforming one binding mode into the other via an intermediate compound (24) to assess their probability (Supplementary Figure 3). The calculated free energies suggested that the pose derived from the binding mode of adenosine in A2AAR crystal structures, which was also
used in the MD/FEP calculations, was favored by 6.5 ± 0.1 kcal/mol. The population of the alternative binding mode was thus predicted to be very low and would not influence the experimentally measured binding affinity significantly.
The enthalpic and entropic components of the binding free energy are increasingly attracting interest in drug discovery as these can provide more information on the driving forces of ligand binding27. Although the
exper-imental binding free energy differences for compound 3 relative to compounds 2 and 4 were accurately repro-duced by the MD/FEP calculations, it was not clear from visual inspection why the addition of a single heavy atom resulted in such a large change in binding affinity in both cases. To further quantify the change in binding free energy, it was decomposed into enthalpy and entropy components using a relationship analogous to the van’t Hoff equation. MD/FEP calculations were carried out for the two compound pairs at 13 different temperatures between 270 and 330 K. The enthalpy and entropy components could then be derived from the slope and inter-cept of the relation between ΔΔGbind/T and 1/T (Fig. 4C and D)28. These calculations demonstrated that the
pre-dicted affinity increase for compound 3 relative to compound 2 was driven by entropy (−TΔΔSbind = −7.1 kcal/
mol), which was counteracted by an unfavorable enthalpy contribution (ΔΔHbind) of +4.8 kcal/mol. In contrast,
the gain in affinity for compound 3 relative to compound 4 was enthalpy driven (ΔΔHbind = −5.6 kcal/mol and
−TΔΔSbind = + 3.4 kcal/mol). Overall, there were only small differences in receptor structure between the three
complexes based on the MD simulations, suggesting that changes in the solvent network could be responsible for the distinct thermodynamic profiles. MD snapshots of the water molecules in the binding site were clustered to identify hydration sites in the vicinity of the ligands using the algorithm developed by Young et al.29. Comparison
of the solvent networks revealed that introduction of the 9-methyl group (compound 2) displaced an ordered water molecule in pocket A (Fig. 4E) whereas the 8-bromine (compound 3) replaced a different ordered water in pocket B (Fig. 4F). The large increases in binding affinity hence appeared to be connected to changes in binding site solvation in both cases, but were the result of different thermodynamic profiles.
Prospective predictions for three nonpurine fragment series.
To further challenge the MD/FEP method, calculations were extended to 12 fragment-sized nonpurine heterocycles of unknown affinity, whichFigure 4. (A) Binding mode of compound 3 based on an A2AAR crystal structure in complex with a related
ligand (PDB code 4EIY). (B) Alternative binding mode for compound 3. (C,D) Determination of entropy and enthalpy components of the relative binding free energy from MD/FEP calculations at different temperatures for compounds 3 and 4 (C), and compounds 2 and 3 (D). (E,F) Maps of binding site solvent structure from clustering of snapshots from a simulation of compound 4 (E) and 2 (F) in complex with the A2AAR. The
corresponding bromine and methyl substituents in compound 3 are represented as transparent grey sticks. In both cases, the water molecule displaced by compound 3 is shown as a red sphere. The orthosteric binding site of the A2AAR is shown as a white cartoon with a key residue in sticks. The binding modes of the ligands are
represented three series with varying levels of modeling difficulty (Fig. 5). The first two compound series were adenine-like and had substituents that explored pocket B. Compound 25, [1,2,4]triazolo[1,5-a][1,3,5] triazin-7-amine, was a substructure of the A2AAR antagonist ZM241385 (Fig. 1). Similar to the adenine
deriv-atives described in previous sections, this scaffold represented a case with high confidence regarding the frag-ment binding mode and predictions were made for three compounds in this series (25–27). The second scaffold, derivatives of [1,2,4]triazolo[1,5-a]pyridin-8-amine 28, was less similar to adenine, but was assumed to maintain hydrogen bond interactions with Asn253 (Fig. 5), and relative affinities were predicted for three 2-alkyl analogs (29–31) that probed pocket B. The third series of five variously substituted derivatives of N-(benzo[d]thiazol-2-yl) acetamide 32 was unrelated to adenine. This represented the most challenging series, as the binding mode of this scaffold was unknown. After the MD/FEP predictions had been completed, the 12 compounds were evaluated experimentally using radioligand binding assays, and Ki values were determined for the ligands that showed
>50% displacement at 300 μM (Supplementary Table S2). The computational and experimental results for the three series of fragments are summarized in Fig. 5.
The relative binding affinities for substituted triazolo-triazin-amine derivatives 26 and 27 compared to unsub-stituted 25 were calculated using the same protocol as for the series of adenine derivatives. The MD/FEP calcula-tions predicted that both compound 26 (0.6 kcal/mol) and 27 (4.3 kcal/mol) had higher affinity than compound
25, which was also confirmed experimentally. Compounds 26 and 27 had Ki values of 78.5 and 20 μM,
respec-tively, which were large improvements over compound 25 that only displayed 34% radioligand displacement at 300 μM. For the second series of analogs, the calculated relative binding free energy (ΔΔGcalc = 0.4 kcal/mol)
correctly predicted that the 2-methyl substituted triazolopyridine 29 (31% at 300 μM) had higher affinity than compound 28, which showed close to negligible radioligand displacement at 300 μM (17%). However, the 2-ethyl and 2-isopropyl substituted compounds 30 (49% at 300 μM) and 31 (223 μM) were incorrectly ranked relative to compound 29 (31% at 300 μM). Both compounds 30 and 31 were predicted to be weaker than compound 29 by 0.9 and 2.2 kcal/mol, respectively. The discrepancies for triazolopyridines 30 and 31 were intriguing considering the close agreement with experiment for the adenine-like ligands. To understand the origin of these erroneous predictions, the MD simulation trajectories for the ethyl-substituted compound 30 and methoxy-substituted compound 21 were inspected visually. The main difference between compounds 30 and 21 was found to be the torsional angles of the substituents protruding into pocket B. For compound 21, the methoxy group primarily sampled angles that were within the plane of the adenine moiety, whereas the ethyl group did not align with the plane of the aromatic ring. Torsion angle scans for compound 30 using density functional theory (DFT) revealed large errors in the force field parameters both in the location of the minimum and the energy barrier height of the potential energy curve (Fig. 5E), whereas there was reasonable agreement between OPLSAA_2005 and DFT for compound 21 (Supplementary Figure 4). MD/FEP calculations were then repeated for compounds 30 and 31 using a force field term for the torsion that reproduced the DFT calculations. The calculated relative binding free energies (to compound 29) changed from −0.9 to + 0.1 kcal/mol for compound 30 and from −2.2 to + 0.7 kcal/ mol for compound 31. These shifts in calculated values resulted in accurate ranking of the two ligands relative to
29 (Supplementary Table S2).
For the third series of compounds, 2-acetamido-benzothiazole (compound 32) was the core scaffold and had a Ki value of 79 μM. 4-Hydroxy-N-(4-methoxy-7-morpholinobenzo[d]thiazol-2-yl)-4-methylpiperidine-
1-carboxamide (tozadenant), a compound that has been in clinical trials for the treatment of Parkinson’s disease30,
could essentially be considered as a superstructure of this fragment. However, tozadenant could not be accom-modated in the crystal structure used for the adenine derivatives in a manner that allowed for hydrogen bonding with residue Asn253. Hence, prior to experimental evaluation of this fragment series, an alternative binding site conformation based on a different A2AAR crystal structure24 was used. In this conformation, alternative side chain
rotamers for His264 and Glu169 lead to a more open binding pocket, which could accommodate tozadenant and compound 32. This binding pose for compound 32 was found to be stable in MD simulations, and a representa-tive snapshot was used as starting point for the FEP calculations (Fig. 5C). The effects of adding a methyl group at three different positions (4, 5 and 6) of the benzothiazole ring of compound 32 were evaluated computationally (Fig. 5C, compounds 33–35). Improvements of affinity corresponding to 0.3 and 0.4 kcal/mol were predicted by MD/FEP for compounds 33 and 34 respectively, whereas a large loss of binding was obtained for compound
35. The predictions for compounds 33 and 34 agreed reasonably well with the subsequently determined 7-fold
increases of affinity. Compound 35 was the weakest ligand of the three analogs with only a two-fold increase of affinity, but the MD/FEP calculations had predicted a loss of binding free energy in this case (2.7 kcal/mol). To further optimize compound 33, MD/FEP calculations were carried out for the 4-methoxy-substituted com-pound 36. The experimentally determined 44-fold increase of affinity (corresponding to 2.3 kcal/mol, Fig. 5F) compared to compound 32 was partially captured by the MD/FEP calculations, which predicted a 0.8 kcal/mol improvement in binding free energy. Hence, whereas the direction of the change in binding affinity was correct, the magnitude of the improvement in affinity was underestimated. To investigate if prediction accuracy could be improved by increasing sampling, we retrospectively extended the simulations by doubling the production time for the transformation between compounds 36 and 32, which resulted in improved agreement with experimental data (ΔΔGbind = 1.3 kcal/mol).
Discussion
The focus of this work was to evaluate using MD simulations in combination with free energy calculations as a tool for fragment optimization. Three key results emerged from calculations of relative binding affinities for frag-ments ligands of the A2AAR, a GPCR that has been intensively studied as a drug target14. First, there was a strong
correlation between calculated and experimental relative binding free energies for ligands based on an adenine scaffold. Remarkably, the direction of the shift in binding free energy was correctly predicted for all of the adenine
www.nature.com/scientificreports/
derivatives that had an absolute experimental free energy change >0.5 kcal/mol. Second, the potential of MD/ FEP calculations to assess alternative binding modes and predict thermodynamic signatures of fragment binding was demonstrated, which could be used to tailor ligand properties during optimization. Finally, prospective pre-dictions for three compound series and evaluation of these in pharmacological assays highlighted opportunities and challenges for the use of MD/FEP calculations in FBLD.
The potential of MD/FEP to guide fragment optimization was clearly demonstrated by the excellent results obtained for the series of adenine derivatives22, 23. Substantial changes in affinity could be achieved by
intro-duction of substituents in the C8- and N9-positions of this scaffold. These effects were not obvious by visual inspection of the complexes and changes in affinity did not correlate with trivial descriptors such as heavy atom count. The fact that addition of diverse substituents to the same subpocket improved binding affinities likely reflects a complex interaction network involving structural water molecules, polar and non-polar side chains. These effects were accurately captured by the MD/FEP calculations, but not by docking in combination with an empirical scoring function. As previously demonstrated by Warren et al., empirical scoring functions are more suitable for screening of large chemical databases to prioritize compounds for experimental testing rather than ranking closely related ligands by affinity31. The improved accuracy for MD/FEP may be due to explicitly
tak-ing into account water molecules, induced fit effects and associated entropic contributions to the bindtak-ing9. The
Figure 5. (A–C) Binding modes and summary of MD/FEP predictions for three nonpurine compound series.
The orthosteric binding site of the A2AAR is shown as a white cartoon with key residues in sticks. The predicted
binding modes of the ligands are shown in sticks with carbon atoms in gold and hydrogen bonds indicated with black dashed lines. The experimental result for each fragment is shown as its Ki (μM) or % displacement
of radioligand binding at 300 μM. The performed MD/FEP calculations are represented with arrows in red and green, which corresponds to accurate and erroneous predictions, respectively. (D) Summary of agreement of MD/FEP calculations with experimental data. The percentage of accurate predictions of the direction of the binding free energy change is shown. (E) Potential energy curve for the indicated torsion calculated from OPLSAA_2005, DFT (QM), and a molecular mechanics potential fitted to the DFT results (QM-Derived). (F) Concentration-effect curves for displacement of radiolabeled A2AAR antagonist [3H]ZM241385 by compounds
performance of docking scoring functions can also be further improved for specific targets by considering the effects of specific water molecules22, 32, 33, but such protocols may not be readily transferred to other ligand series
or targets. Consideration of the enthalpic and entropic components of the binding free energy has recently been suggested to be an important metric to guide fragment optimization8. In addition to improved predictions of
relative affinities, MD/FEP calculations make it possible to characterize the driving forces behind a change in free energy, which has previously been applied successfully to study ion hydration28 and enzyme catalysis34. In this
work, we used the same approach to investigate the large differences in binding observed for two compound pairs from the series of adenine-based ligands. The affinity gains obtained for a substituent in the C8-position of ade-nine were found to be associated with a large increase of entropy and displacement of a binding site water mole-cule in pocket B, which appeared to be a classic example of the hydrophobic effect. Interestingly, the same hotspot has previously been identified based on MD-derived maps of the solvent network in the A2AAR binding site35, 36.
In contrast, the addition of methyl substituent in the N9-position, which involved displacement of a water mole-cule from pocket B, led to a decrease of entropy and the improvement of the binding affinity was instead driven by enthalpy. Large improvements of affinity due to the addition of a single heavy atom, which has been referred to as the “magic methyl” effect, may hence have completely different thermodynamic origins. Although the predictions of the entropy and enthalpy contributions to the relative binding free energies will need to be further tested by comparison to experimental data, our results suggest that MD/FEP is not limited to guiding affinity optimization, but can also be used to tailor the thermodynamic profile of ligands.
Application of the MD/FEP technique to fragment-sized molecules has several advantages from a methodo-logical standpoint. Molecular mechanics force fields are likely more accurate for fragment- than for drug-like com-pounds as parameters are typically developed based on fragment-sized molecules37. Furthermore, it should be more
feasible to reach convergence of the free energy calculations for fragments as such molecules typically have fewer degrees of freedom than drugs. Comparison of our results to a recent study that applied the MD/FEP technique to two series of lead-like A2AAR ligands supports this idea38. The lower correlation with experiment obtained for two
series of adenine-derived ligands may reflect that these were of lead-like size and interacted with the flexible extra-cellular loops whereas the fragments considered in this work had limited conformational flexibility and extended into a relatively rigid TM region. Interestingly, two recent benchmarks of binding free energy calculations for a large number of soluble targets showed a similar trend10, 39. It should be noted that access to information regarding the
binding mode for a representative ligand was likely a key contributor to the accuracy of the MD/FEP calculations in all cases. Hence, if a high-resolution structure of a representative complex is available, MD/FEP calculations can be a valuable technique for ligand optimization and the approach appears to be particularly suited for fragments.
The prospective predictions carried out for three different fragment series revealed potential pitfalls for the use of MD/FEP to predict ligand binding affinities. In this case, the compounds had affinities in the high micromo-lar to millimomicromo-lar range, which closely mimicked the scenario encountered in fragment-to-lead optimization3. In
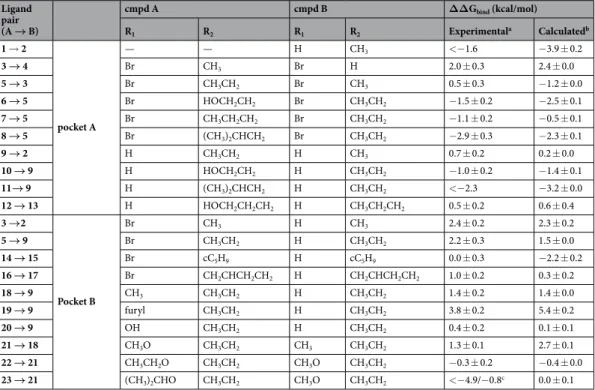
Ligand pair (A → B) cmpd A cmpd B ΔΔGbind (kcal/mol) R1 R2 R1 R2 Experimentala Calculatedb 1 → 2 pocket A — — H CH3 <−1.6 −3.9 ± 0.2 3 → 4 Br CH3 Br H 2.0 ± 0.3 2.4 ± 0.0 5 → 3 Br CH3CH2 Br CH3 0.5 ± 0.3 −1.2 ± 0.0 6 → 5 Br HOCH2CH2 Br CH3CH2 −1.5 ± 0.2 −2.5 ± 0.1 7 → 5 Br CH3CH2CH2 Br CH3CH2 −1.1 ± 0.2 −0.5 ± 0.1 8 → 5 Br (CH3)2CHCH2 Br CH3CH2 −2.9 ± 0.3 −2.3 ± 0.1 9 → 2 H CH3CH2 H CH3 0.7 ± 0.2 0.2 ± 0.0 10 → 9 H HOCH2CH2 H CH3CH2 −1.0 ± 0.2 −1.4 ± 0.1 11→ 9 H (CH3)2CHCH2 H CH3CH2 <−2.3 −3.2 ± 0.0 12 → 13 H HOCH2CH2CH2 H CH3CH2CH2 0.5 ± 0.2 0.6 ± 0.4 3 →2 Pocket B Br CH3 H CH3 2.4 ± 0.2 2.3 ± 0.2 5 → 9 Br CH3CH2 H CH3CH2 2.2 ± 0.3 1.5 ± 0.0 14 → 15 Br cC5H9 H cC5H9 0.0 ± 0.3 −2.2 ± 0.2 16 → 17 Br CH2CHCH2CH2 H CH2CHCH2CH2 1.0 ± 0.2 0.3 ± 0.2 18 → 9 CH3 CH3CH2 H CH3CH2 1.4 ± 0.2 1.4 ± 0.0 19 → 9 furyl CH3CH2 H CH3CH2 3.8 ± 0.2 5.4 ± 0.2 20 → 9 OH CH3CH2 H CH3CH2 0.4 ± 0.2 0.1 ± 0.1 21 → 18 CH3O CH3CH2 CH3 CH3CH2 1.3 ± 0.1 2.7 ± 0.1 22 → 21 CH3CH2O CH3CH2 CH3O CH3CH2 −0.3 ± 0.2 −0.4 ± 0.0 23 → 21 (CH3)2CHO CH3CH2 CH3O CH3CH2 <−4.9/−0.8c 0.0 ± 0.1
Table 1. Calculated and experimental relative binding free energies for 20 compound pairs based on adenine.
2D structures of the compounds are shown in Fig. 1C. aUncertainties are calculated as the standard error of the
mean based on the maximal and minimal affinities values obtained from the 95% confidence intervals of the experimentally determined Ki values. Experimental Ki values can be found in Supplementary Table 1. bAverage
relative binding free energy from three independent trajectories with uncertainties estimated as the standard error of the mean. cK
www.nature.com/scientificreports/
agreement with the results obtained for the adenine derivatives, the predictions were excellent for the fragments derived from a ligand co-crystallized with the A2AAR. The second fragment series illustrated the importance of
high quality torsional force field parameters for small molecule ligands. The MD/FEP calculations based on OPLSAA_2005 parameters were not in agreement with experimental data, whereas a DFT-derived torsional poten-tial resulted in correct ranking of the compounds. This result suggests that force field parameters should be used with caution even for fragment-sized molecules. As we focused only on congeneric series of compounds with mainly non-polar substituents, the performance of the partial atomic charges from OPLSAA_2005 was not assessed in this work. For example, consideration of different heterocyclic compounds could involve large changes in charge distri-bution, which may not be accurately represented by empirical partial charges. Fortunately, as fragments will have a small number of atoms and rotatable bonds, torsions and partial charges could in principle be derived using ab initio methods prior to the MD/FEP calculations to further enhance modeling accuracy. In line with these ideas, particular focus was put on improvements of torsional potentials and partial atomic charges in the recently released OPLS3 force field for organic molecules40. The last series of fragments illustrated challenges associated with lack of crystal
structure information regarding fragment binding modes. Modeling of the binding mode involved consideration of several binding site conformations and required expert knowledge regarding ligand recognition by the target. Encouragingly, the direction of the change in binding free energy was correctly predicted in three out of four cases, but the magnitude of the shift in affinity was not always captured. Considering the many uncertainties involved in modeling of fragment binding modes, fragment optimization in the absence of a crystal structure should be con-sidered to be very challenging. In these instances, the use of metadynamics41 and MD/FEP in combination with
mutagenesis studies42, 43 to identify ligand binding modes hold promise. Binding modes that reproduce the initial
structure-activity relationships could be used to guide compound selection in the following rounds of optimization. The major advances made in molecular and structural biology for GPCRs44, 45 make it possible to apply FBLD to
numerous targets of therapeutic interest. In the case of the A2AAR, fragment screening against stabilized receptor
constructs by biophysical methods19, 20 and computationally using molecular docking21 have led to the discovery of
diverse starting points for development of lead compounds. The determination of multiple high-resolution crystal structures of GPCRs in complex with fragments24, 46 provides exciting opportunities to apply computational
meth-ods in FBLD for GPCRs. Our results demonstrate that the MD/FEP approach can contribute to efficient optimiza-tion of fragment hits, which is key for successful use of FBLD in drug development. The combinaoptimiza-tion of molecular docking screening for fragment identification and efficient ligand optimization via MD/FEP has the potential to become a powerful addition to the toolbox of methods used in fragment-based drug discovery.
Methods
MD/FEP calculations.
The MD simulations were performed using a high-resolution crystal structure of the A2AAR (PDB accession code: 4EIY, 1.8 Å)17. In a first step, a hydrated 1-palmitoyl-2-oleoyl phosphatidylcholine(POPC) membrane bilayer was first equilibrated around the A2AAR structure with periodic boundary conditions
using the 4.5.5 version of GROMACS47. These simulations were setup using the GPCR-ModSim protocol48 and
the OPLS all atom (OPLSAA) force field37, TIP3P waters49, and Berger lipid parameters50. All protein atoms were
tightly restrained to their initial coordinates and the hydrated membrane was equilibrated for a total of 40 ns at 300 K. All MD/FEP calculations were carried out starting from the membrane equilibrated A2AAR system using
the program Q51 with the same force field. Ligand parameters were obtained using the OPLSAA_2005 version
implemented in the program hetgrp_ffgen (Schrödinger, LLC, New York, NY, 2017). The simulations were car-ried out at 310 K in a sphere of 18 Å radius centered on the ligand. All protein, water, and ligand atoms within 18 Å of the center of the sphere were explicitly included in the simulations. Atoms close to the sphere edge were restrained to their initial coordinates and atoms beyond the sphere edge were excluded from nonbonded interac-tions. Asp, Glu, Lys, and Arg residues within 15 Å of the sphere center were protonated according to their most probable states at pH 7 and ionizable residues closer to the sphere edge were set to their neutral state. The proto-nation states of the histidines in the binding site were set by manual inspection. His278, His250, and His264 were protonated at Nδ, Nε, and both nitrogen positions, respectively. The series of 2-acetamido-benzothiazole deriva-tives (compounds 32–36) were simulated with conformations of His264 and Glu169 obtained from an alternate crystal structure of the A2AAR24. In these simulations His264 was protonated at the Nδ position. The SHAKE52
algorithm was applied to constrain all solvent bonds and angles and the water molecules at the sphere surface were subjected to radial and polarization restraints according to the SCAAS model51, 53. A nonbonded cutoff of 10
Å was used for all atoms except the ligand, for which no cutoff was applied. Long-range electrostatic interactions were treated with the local reaction field method54. The time step was set to 1 fs and nonbonded pair lists were
updated every 25 steps. In the simulations of the ligands in aqueous solution, the compound was positioned in the center of the sphere and a weak harmonic restraint was applied to a central atom (e.g. C5 of the adenine scaffold) to prevent it from approaching the sphere edge. Clustering of the water network in the binding site was carried out based on a simulation of 8 ns with the receptor and ligand restrained to their starting coordinates, from which 8000 snapshots were extracted and processed using the algorithm of Young et al.29.
The relative binding free energy for a pair of compounds was calculated in multiple steps using MD/FEP: (i) The transformation of partial charges and (ii) combined transformation of Lennard-Jones (LJ) and parameters involving covalent bonds in several MD/FEP calculations. If multiple heavy atoms were annihilated, a separate MD/FEP calculation was carried out to remove these in a step-wise manner. A soft-core potential was intro-duced for the atom in a first step, followed by removal of the resulting van der Waals potential42, 55. The force field
parameters describing angles, bonds, and improper torsions were retained for annihilated atoms whereas the torsional potential was removed in some cases to improve convergence. The total free energy was calculated as the sum of the results obtained in each step. Each MD/FEP calculation was divided into n intermediate states that
were equilibrated separately. The potential (Um) defining each state was a linear combination of energy functions
describing the start- (A) and endpoint (B) of the transformation
λ λ
= − +
Um (1 m A)U m BU (1)
where λm varies from 0 to 1. The FEP calculations involving partial charges were performed using 11 states
whereas the number of λ values used to transform LJ and bonded parameters varied from 40 to 122 steps. Each receptor-ligand complex was equilibrated for 475 ps at each λ value. In this simulation, harmonic restraints on the protein and ligand atoms were released in several steps and the temperature was gradually increased to 310 K. The equilibration step was followed by 250 ps of unrestrained simulation, from which potential energies were extracted. The same transformation was carried out in a spherical water droplet. In this case, the system was equil-ibrated for 350 ps, followed by 100 ps of unrestrained simulation. The free energy difference between states A and
B was calculated by summing up the free energy differences of the n intermediate states using
∑
Δ → = − = − − +− G kT ln e (2) A BFEP m n U U kT m 1 1 ( m 1 m)/where 〈…〉m represents an ensemble average on the potential Um, which is calculated from the MD simulations13.
Three replicates, which were initiated from different starting velocities for the atoms in the system, were per-formed for each state and these were exponentially averaged in calculations of the free energy. The uncertainty of a transformation was quantified as the difference in free energy obtained by applying the FEP formula in the forward and reverse direction and was optimized by increasing the number of λ values or simulation length until convergence was obtained. The uncertainty of a calculated relative binding free energy was estimated as the stand-ard error of the mean of three independent trajectories.
The enthalpy (ΔΔHbind) and entropy (ΔΔSbind) contribution to the relative binding free energy were
calcu-lated from a relationship analogous to the van’t Hoff equation28. Each FEP transformation was carried out at 5
K intervals between 270 and 330 K to calculate the temperature dependence of the relative binding free energy (ΔΔGbind). The entropy and enthalpy components were then calculated from the slope and intercept of the
rela-tion between ΔΔGbind/T and 1/T:
ΔΔ = ΔΔ − ΔΔ G T T H S 1 (3) bind bind bind
Molecular docking and ALogP calculations.
The docking calculations were carried out with GLIDE25(version 6.0, Schrödinger, LLC, New York, NY, 2017) using the standard precision (SP) protocol and default set-tings. The same A2AAR crystal structure (PDB code 4EIY17) and protonation states for the ionizable residues as
in the MD simulations were used. Prior to docking, all non-protein atoms (e.g. water molecules) were removed and the binding site was defined based on the co-crystallized ligand. ALogP values were calculated using Maestro (Release 2017–1: Maestro, Schrödinger, LLC, New York, NY, 2017).
Torsion scans.
Potential energy profiles for the ethyl and methoxy substituents of compounds 21 and 30 were calculated using Gaussian0956. The torsional scans were performed using B3LYP/DFT with the 6-311++G(d,p)basis set57–60 and a full geometry optimization was carried out at each point. The corresponding force field
poten-tial energies were calculated based on the geometries obtained from the DFT optimization.
Radioligand binding and functional assays.
Radioligand binding assays for compounds 25–36 were performed as previously described61 using membrane preparations from Chinese hamster ovary (CHO) orhuman embryonic kidney (HEK)293 cells stably expressing the human A1, A2A or A3AR. The following
radioli-gands: antagonist [3H]DPCPX (0.5 nM); antagonist [3H]ZM241385 (1.0 nM); and agonist [125I]AB-MECA (0.2
nM) were used for A1, A2A, and A3ARs, respectively. Binding parameters were calculated using Prism 6 software
(GraphPAD, San Diego, CA, USA). IC50 values obtained from competition curves were converted to Ki values
using the Cheng-Prusoff equation. Data were expressed as mean ± standard error. The radioligand binding assays for compounds 18, 20, 21, and 23 were performed as previously described23. Each K
i value was determined from
at least three independent experiments.
Four adenine derivatives (compounds 5, 19, 22, and 23) were evaluated in functional assays. CHO cells, stably transfected with the human A2AAR and transiently with firefly luciferase biosensor, were grown adherently and
maintained in Dulbecco’s Modified Eagles Medium with nutrient mixture F12 (DMEM/F12 with phenol red), supplemented with 10% FBS (Fetal Bovine Serum), 100 U/mL penicillin, 100 µg/mL streptomycin, 2.5µg/mL amphotericin, 1 mM Sodium pyruvate, and 0.1 mg/mL Geneticin (G418) at 37 °C, and aerated with 5% CO2:
95% O2. Cells were harvested in CO2 independent media and counted in a Neobauer chamber. The desiderate cell
number was incubated in equilibration medium containing a 3% v/v GloSensor cAMP reagent stock solution, 10% FBS and 87% CO2 independent medium. After 2 hours of incubation cells were dispensed in wells of 384 well
plate and when a steady-state basal signal was obtained, different concentrations of antagonists were added. After 10 min, 1 µM of 5′-N-ethylcarboxamidoadenosine (NECA), the reference agonist, was injected. Responses were expressed as percentage of the Maximal Relative Luminescence Units (RLU). Inhibition-response curves were fitted by a non-linear regression using a Prism 4.0 program (GraphPad Software, San Diego, CA, USA).
www.nature.com/scientificreports/
References
1. Johnson, C. N., Erlanson, D. A., Murray, C. W. & Rees, D. C. Fragment-to-lead medicinal chemistry publications in 2015. J. Med.
Chem. 60, 89–99 (2017).
2. Erlanson, D. A., Fesik, S. W., Hubbard, R. E., Jahnke, W. & Jhoti, H. Twenty years on: the impact of fragments on drug discovery. Nat.
Rev. Drug Discov. 15, 605–619 (2016).
3. Erlanson, D. A. Introduction to fragment-based drug discovery. Top. Curr. Chem. 317, 1–32 (2012).
4. Congreve, M., Chessari, G., Tisi, D. & Woodhead, A. J. Recent developments in fragment-based drug discovery. J. Med. Chem. 51, 3661–3680 (2008).
5. Leach, A. R. & Hann, M. M. Molecular complexity and fragment-based drug discovery: ten years on. Curr. Opin. Chem. Biol. 15, 489–496 (2011).
6. Hopkins, A. L., Keseru, G. M., Leeson, P. D., Rees, D. C. & Reynolds, C. H. The role of ligand efficiency metrics in drug discovery.
Nat. Rev. Drug Discov. 13, 105–121 (2014).
7. Murray, C. W. & Blundell, T. L. Structural biology in fragment-based drug design. Curr. Opin. Struc. Biol. 20, 497–507 (2010). 8. Ferenczy, G. G. & Keseru, G. M. Enthalpic efficiency of ligand binding. J. Chem. Inf. Model. 50, 1536–1541 (2010).
9. Kitchen, D. B., Decornez, H., Furr, J. R. & Bajorath, J. Docking and scoring in virtual screening for drug discovery: methods and applications. Nat. Rev. Drug Discov. 3, 935–949 (2004).
10. Steinbrecher, T. B. et al. Accurate binding free energy predictions in fragment optimization. J. Chem. Inf. Model. 55, 2411–2420 (2015). 11. Sándor, M., Kiss, R. & Keserű, G. M. Virtual fragment docking by Glide: a validation study on 190 protein−fragment complexes. J.
Chem. Inf. Model. 50, 1165–1172 (2010).
12. Verdonk, M. L. et al. Docking performance of fragments and druglike compounds. J. Med. Chem. 54, 5422–5431 (2011). 13. Kollman, P. Free-energy calculations - Applications to chemical and biochemical phenomena. Chem. Rev. 93, 2395–2417 (1993). 14. Chen, J. F., Eltzschig, H. K. & Fredholm, B. B. Adenosine receptors as drug targets–what are the challenges? Nat. Rev. Drug Discov.
12, 265–286 (2013).
15. Armentero, M. T. et al. Past, present and future of A2A adenosine receptor antagonists in the therapy of Parkinson’s disease.
Pharmacol. Therapeut. 132, 280–299 (2011).
16. Hatfield, S. M. & Sitkovsky, M. A2A adenosine receptor antagonists to weaken the hypoxia-HIF-1alpha driven immunosuppression and improve immunotherapies of cancer. Curr. Opin. Pharmacol. 29, 90–96 (2016).
17. Liu, W. et al. Structural basis for allosteric regulation of GPCRs by sodium ions. Science 337, 232–236 (2012).
18. Lebon, G. et al. Agonist-bound adenosine A2A receptor structures reveal common features of GPCR activation. Nature 474, 521–525 (2011).
19. Chen, D. et al. Fragment screening of GPCRs using biophysical methods: identification of ligands of the adenosine A2A receptor with novel biological activity. ACS Chem. Biol. 7, 2064–2073 (2012).
20. Congreve, M. et al. Fragment screening of stabilized G-protein-coupled receptors using biophysical methods. Methods Enzymol.
493, 115–136 (2011).
21. Chen, D., Ranganathan, A., IJzerman, A. P., Siegal, G. & Carlsson, J. Complementarity between in silico and biophysical screening approaches in fragment-based lead discovery against the A2A adenosine receptor. J. Chem. Inf. Model. 53, 2701–2714 (2013). 22. Lambertucci, C. et al. 8-Bromo-9-alkyl adenine derivatives as tools for developing new adenosine A2A and A2B receptors ligands.
Bioorg. Med. Chem. 17, 2812–2822 (2009).
23. Volpini, R. et al. Adenosine A2A receptor antagonists: New 8-substituted 9-ethyladenines as tools for in vivo rat models of Parkinson’s disease. ChemMedChem 4, 1010–1019 (2009).
24. Dore, A. S. et al. Structure of the adenosine A2A receptor in complex with ZM241385 and the xanthines XAC and caffeine. Structure
19, 1283–1293 (2011).
25. Halgren, T. A. et al. Glide: a new approach for rapid, accurate docking and scoring. 2. Enrichment factors in database screening. J.
Med. Chem. 47, 1750–1759 (2004).
26. Nervall, M., Hanspers, P., Carlsson, J., Boukharta, L. & Åqvist, J. Predicting binding modes from free energy calculations. J. Med.
Chem. 51, 2657–2667 (2008).
27. Klebe, G. Applying thermodynamic profiling in lead finding and optimization. Nat. Rev. Drug Discov. 14, 95–110 (2015). 28. Carlsson, J. & Åqvist, J. Absolute hydration entropies of alkali metal ions from molecular dynamics simulations. J. Phys. Chem. B
113, 10255–10260 (2009).
29. Young, T., Abel, R., Kim, B., Berne, B. J. & Friesner, R. A. Motifs for molecular recognition exploiting hydrophobic enclosure in protein-ligand binding. P. Natl. Acad. Sci. USA 104, 808–813 (2007).
30. Hauser, R. A. et al. Tozadenant (SYN115) in patients with Parkinson’s disease who have motor fluctuations on levodopa: a phase 2b, double-blind, randomised trial. Lancet Neurol. 13, 767–776 (2014).
31. Warren, G. L. et al. A critical assessment of docking programs and scoring functions. J. Med. Chem. 49, 5912–5931 (2006). 32. Higgs, C., Beuming, T. & Sherman, W. Hydration site thermodynamics explain SARs for triazolylpurines analogues binding to the
A2A Receptor. ACS Med. Chem. Lett. 1, 160–164 (2010).
33. Lenselink, E. B., Beuming, T., Sherman, W., van Vlijmen, H. W. & IJzerman, A. P. Selecting an optimal number of binding site waters to improve virtual screening enrichments against the adenosine A2A receptor. J. Chem. Inf. Model. 54, 1737–1746 (2014). 34. Åqvist, J., Kazemi, M., Isaksen, G. V. & Brandsdal, B. O. Entropy and enzyme catalysis. Acc. Chem. Res. 50, 199–207 (2017). 35. Andrews, S. P., Mason, J. S., Hurrell, E. & Congreve, M. Structure-based drug design of chromone antagonists of the adenosine A2A
receptor. MedChemComm 5, 571–575 (2014).
36. Mason, J. S. et al. High end GPCR design: crafted ligand design and druggability analysis using protein structure, lipophilic hotspots and explicit water networks. In Silico Pharmacol. 1, 1–12 (2013).
37. Jorgensen, W. L., Maxwell, D. S. & Tirado-Rives, J. Development and testing of the OPLS all-atom force field on conformational energetics and properties of organic liquids. J. Am. Chem. Soc. 118, 11225–11236 (1996).
38. Lenselink, E. B. et al. Predicting binding affinities for GPCR ligands using free-energy perturbation. ACS Omega 1, 293–304 (2016). 39. Wang, L. et al. Accurate and reliable prediction of relative ligand binding potency in prospective drug discovery by way of a modern
free-energy calculation protocol and force field. J. Am. Chem. Soc. 137, 2695–2703 (2015).
40. Harder, E. et al. OPLS3: A force field providing broad coverage of drug-like small molecules and proteins. J. Chem. Theory Comput.
12, 281–296 (2016).
41. Clark, A. J. et al. Prediction of protein-ligand binding poses via a combination of induced fit docking and metadynamics simulations.
J. Chem. Theory Comput. 12, 2990–2998 (2016).
42. Boukharta, L., Gutierrez-de-Teran, H. & Åqvist, J. Computational prediction of alanine scanning and ligand binding energetics in G-protein coupled receptors. PLoS Comput. Biol. 10, e100358 (2014).
43. Keranen, H., Gutierrez-de-Teran, H. & Åqvist, J. Structural and energetic effects of A2A adenosine receptor mutations on agonist and antagonist binding. PloS One 9, e108492 (2014).
44. Katritch, V., Cherezov, V. & Stevens, R. C. Structure-function of the G protein-coupled receptor superfamily. Annu. Rev. Pharmacol.
Toxicol. 53, 531–556 (2013).
45. Rodriguez, D., Ranganathan, A. & Carlsson, J. Discovery of GPCR ligands by molecular docking screening: Novel opportunities provided by crystal structures. Curr. Top. Med. Chem. 15, 2484–2503 (2015).
46. Christopher, J. A. et al. Biophysical fragment screening of the beta1-adrenergic receptor: identification of high affinity arylpiperazine leads using structure-based drug design. J. Med. Chem. 56, 3446–3455 (2013).
47. Pronk, S. et al. GROMACS 4.5: a high-throughput and highly parallel open source molecular simulation toolkit. Bioinformatics 29, 845–854 (2013).
48. Rodríguez, D., Bello, X. & Gutiérrez-de-Terán, H. Molecular modelling of G protein-coupled receptors through the web. Mol.
Inform. 31, 334–341 (2012).
49. Mahoney, M. W. & Jorgensen, W. L. A five-site model for liquid water and the reproduction of the density anomaly by rigid, nonpolarizable potential functions. J. Chem. Phys. 112, 8910–8922 (2000).
50. Berger, O., Edholm, O. & Jähnig, F. Molecular dynamics simulations of a fluid bilayer of dipalmitoylphosphatidylcholine at full hydration, constant pressure, and constant temperature. Biophys. J. 72, 2002–2013 (1997).
51. Marelius, J., Kolmodin, K., Feierberg, I. & Åqvist, J. Q. A molecular dynamics program for free energy calculations and empirical valence bond simulations in biomolecular systems. J. Mol. Graph. Model. 16, 213–225 (1998).
52. Ryckaert, J. P., Ciccotti, G. & Berendsen, H. J. C. Numerical-integration of cartesian equations of motion of a system with constraints- Molecular-dynamics of N-alkanes. J. Comput. Phys. 23, 327–341 (1977).
53. King, G. & Warshel, A. A surface constrained all-atom solvent model for effective simulations of polar solutions. J. Chem. Phys. 91, 3647–3661 (1989).
54. Lee, F. S. & Warshel, A. A local reaction field method for fast evaluation of long-range electrostatic interactions in molecular simulations. J. Chem. Phys. 97, 3100–3107 (1992).
55. Beutler, T. C., Mark, A. E., Vanschaik, R. C. & Gerber, P. R. & Vangunsteren, W. F. Avoiding singularities and numerical instabilities in free-energy calculations based on molecular simulations. Chem. Phys. Lett. 222, 529–539 (1994).
56. Gaussian 09, Frisch, M. J. et al., Gaussian, Inc., Wallingford CT, 2016.
57. Raghavachari, K., Binkley, J. S., Seeger, R. & Pople, J. A. Self-consistent molecular-orbital methods. 20. Basis set for correlated wave-functions. J. Chem. Phys. 72, 650–654 (1980).
58. Mclean, A. D. & Chandler, G. S. Contracted gaussian-basis sets for molecular calculations. 1. 2nd Row Atoms, Z = 11–18. J. Chem.
Phys. 72, 5639–5648 (1980).
59. Clark, T., Chandrasekhar, J., Spitznagel, G. W. & Schleyer, P. V. Efficient diffuse function-augmented basis sets for anion calculations. Iii. The 3-21 + G basis set for first-row elements, Li-F. J. Comput. Chem. 4, 294–301 (1983).
60. Frisch, M. J., Pople, J. A. & Binkley, J. S. Self-consistent molecular-orbital methods. 25. Supplementary functions for gaussian-basis sets. J. Chem. Phys. 80, 3265–3269 (1984).
61. Carlsson, J. et al. Structure-based discovery of A2A adenosine receptor ligands. J. Med. Chem. 53, 3748–3755 (2010).
Acknowledgements
This work was supported by grants from the Swedish Research Council (2013-5708) and the Science for Life Laboratory to J.C. and by funding from the NIDDK Intramural Research Program to K.A.J. Computational resources were provided by the Swedish National Infrastructure for Computing (SNIC). J.C., P.M., A.R., A.Ru., and M.J. participate in the European COST Action CM1207 (GLISTEN).
Author Contributions
P.M., A.R., K.A.J., and J.C. designed the research project. P.M., A.R., A.E., M.J., A.Ru., and J.C. performed and analyzed the MD simulations. C.L., G.M., D.D.B., E.W., Z.G., and K.A.J. carried out and analyzed the radioligand binding and functional assays. All authors contributed to the writing of the manuscript.
Additional Information
Supplementary information accompanies this paper at doi:10.1038/s41598-017-04905-0 Competing Interests: The authors declare that they have no competing interests.
Publisher's note: Springer Nature remains neutral with regard to jurisdictional claims in published maps and
institutional affiliations.
Open Access This article is licensed under a Creative Commons Attribution 4.0 International
License, which permits use, sharing, adaptation, distribution and reproduction in any medium or format, as long as you give appropriate credit to the original author(s) and the source, provide a link to the Cre-ative Commons license, and indicate if changes were made. The images or other third party material in this article are included in the article’s Creative Commons license, unless indicated otherwise in a credit line to the material. If material is not included in the article’s Creative Commons license and your intended use is not per-mitted by statutory regulation or exceeds the perper-mitted use, you will need to obtain permission directly from the copyright holder. To view a copy of this license, visit http://creativecommons.org/licenses/by/4.0/.