U
NIVERSITÀ*DELLA*
C
ALABRIA
*
*Dipartimento*di*Elettronica,**
Informatica*e*Sistemistica*
Dottorato*di*Ricerca*in**
Ingegneria*dei*Sistemi*e*Informatica*
*XXVciclo
Settore*Scientifico*Disciplinare*INGAINF/03**
*
Tesi%di%Dottorato%
* * *Using*MultiAlayer*Social*
Networks*for*Opportunistic*
Routing**
* * **
Socievole*Annalisa*
!
!
!
!
!
!
!
!
!
!
DEIS- DIPARTIMENTO DI ELETTRONICA,INFORMATICA E SISTEMISTICA
Novembre 2012
Settore Scientifico Disciplinare: ING-INF/03
!
to my beloved sister Eleonora
and my husband Francesco with his sea waves
Acknowledgement
Thanks to my parents and grandparents for their love and support.
Thanks to my supervisors Floriano De Rango and Salvatore Marano for their suggestions throughout my studies.
Thanks to Jon Crowcroft and Eiko Yoneki for their suggestions during the time spent at Computer Laboratory in Cambridge.
Thanks to my coordinator Luigi Palopoli for his guidance throughout the PhD course.
Thanks to all my friends, in particular Elisabetta.
Thanks to my Yoga teacher Aravinda for getting me into shape physically and mentally.
Contents
1 Introduction . . . 1
1.1 Goals and approach . . . 2
1.2 Dissertation outline . . . 2
1.3 Publications . . . 3
2 The development of opportunistic networks . . . 5
2.1 MANETs . . . 5
2.2 Opportunistic networks and Delay Tolerant Networks . . . 8
2.3 DTN routing . . . 10
2.4 Performance comparison of DTN routing schemes . . . 13
2.4.1 Epidemic routing . . . 13
2.4.2 Spray and Wait . . . 15
2.4.3 PRoPHET . . . 15
2.4.4 MaxProp . . . 16
2.4.5 Bubble Rap . . . 18
2.4.6 Simulation environment . . . 19
2.4.7 Performance comparison and results . . . 20
2.4.8 Discussion . . . 26
2.5 Impact of energy consumption on routing performance . . . 26
2.5.1 Simulation environment . . . 27
2.5.1.1 Energy consumption model . . . 27
2.5.1.2 Mobility model . . . 27
2.5.1.3 Parameter settings . . . 27
2.5.2 Performance comparison and results . . . 29
2.5.3 Discussion . . . 33
2.6 Summary . . . 33
3 The usefulness of social networks and opportunistic networks . . . 35
3.1 Social networks . . . 35
3.3 Exploring sociocentric and egocentric behaviors in online and
detected social networks . . . 38
3.3.1 Data and methodology . . . 38
3.3.2 Sociocentric analysis . . . 40 3.3.2.1 Betweenness centrality . . . 40 3.3.2.2 Closeness centrality . . . 40 3.3.2.3 Eigenvector centrality . . . 41 3.3.2.4 Bonacich power . . . 43 3.3.2.5 Modularity . . . 44 3.3.3 Egocentric analysis . . . 46 3.3.3.1 Degree centrality . . . 46
3.3.3.2 Ego betweenness centrality . . . 47
3.3.3.3 Brokerage . . . 47
3.4 Discussion . . . 49
4 Multi-layer social networks . . . 53
4.1 Multi-layer social network model . . . 53
4.2 Multi-layer social network in a conference environment . . . 54
4.2.1 Lapland dataset . . . 55
4.2.2 Joint Diagonalisation for dynamic network analysis . . . . 58
4.2.3 Lapland multi-layer social network . . . 60
4.3 Lapland multi-layer social network analysis . . . 62
4.3.1 Network motifs analysis . . . 62
4.3.2 Node centrality analysis . . . 63
4.3.3 Multi-layer community detection analysis . . . 67
4.4 Discussion . . . 70
5 Multi-layer social networks for opportunistic routing . . . 71
5.1 Detected and online social networks for opportunistic routing . 72 5.1.1 MobiClique . . . 72
5.1.2 PeopleRank . . . 72
5.1.3 Social Role Routing (SRR) . . . 73
5.2 ML-SOR: Multi-Layer Social network based Opportunistic Routing . . . 73
5.2.1 ML-SOR social metric . . . 74
5.2.2 ML-SOR scheme . . . 76
5.3 Performance evaluation . . . 76
5.3.1 Simulation environment . . . 77
5.3.2 Results . . . 77
5.3.2.1 Di↵erent TTLs scenario . . . 77
5.3.2.2 Di↵erent inter-message creation intervals scenario . . . 82
5.4 Discussion . . . 88
Contents XI
List of Figures
2.1 A MANET topology for a set of laptops. Wireless connections
between nodes are indicated with bolt symbols. There is no
need of a dedicated router since every device routes packets. . . . 6
2.2 Example of epidemic forwarding: a source node A forwards the packet to the encountered nodes B and C. Node B, encountering D, forwards the packet to the destination node D. 14 2.3 Flow diagram of Epidemic forwarding scheme. . . 14
2.4 Flow diagrams of Spray and Wait (a), and Binary Spray and Wait (b) message generation. . . 16
2.5 Flow diagram of PRoPHET forwarding scheme. . . 17
2.6 Flow diagram of MaxProp forwarding scheme. . . 18
2.7 Flow diagram of Bubble Rap forwarding scheme. . . 19
2.8 Number of transmitted messages as a function of the number of nodes. . . 21
2.9 Delivery ratio as a function of the number of nodes. . . 22
2.10 Delivery ratio as a function of node speed. . . 22
2.11 Average latency as a function of the number of nodes. . . 23
2.12 Average latency as a function of node speed. . . 24
2.13 Percentage of bu↵er occupancy as a function of the number of nodes. . . 24
2.14 Percentage of bu↵er occupancy as a function of node speed. . . 25
2.15 Average hop count as a function of the number of nodes. . . 25
2.16 Overhead cost as a function of the number of nodes. . . 29
2.17 Delivery ratio as a function of the number of nodes. . . 30
2.18 Average latency as a function of the number of nodes. . . 31
2.19 CDF of hop counts for 25 nodes. . . 31
2.20 CDF of hop counts for 50 nodes. . . 31
2.21 CDF of hop counts for 100 nodes. . . 32
2.22 Average energy consumption as a function of the number of nodes. . . 32
3.1 Example of graph created with the Erd˝os-R´enyi random graph
model. . . 37
3.2 Example of graph created using Barab´asi-Albert scale-free network model. . . 37
3.3 The DSN graph for SASSY dataset. . . 39
3.4 The OSN graph for SASSY dataset. . . 39
3.5 DSN and OSN betweenness distributions. . . 41
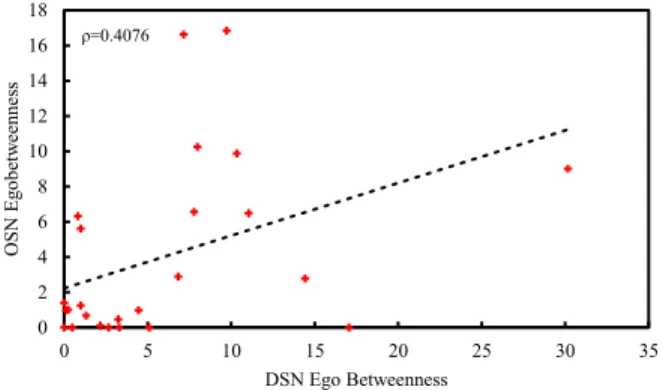
3.6 Correlation between OSN and DSN betwenness centrality values. 41 3.7 DSN and OSN closeness distributions. . . 42
3.8 Correlation between OSN and DSN closeness centrality values. . 42
3.9 DSN and OSN eigenvector centrality distributions. . . 43
3.10 Correlation between OSN and DSN eigenvector centrality values. 43 3.11 DSN and OSN Bonacich power distributions. . . 44
3.12 Correlation between OSN and DSN Bonacich power values. . . 44
3.13 Modularity community detection for DSN. . . 45
3.14 Modularity community detection for OSN. . . 45
3.15 DSN and OSN degree centrality distributions. . . 46
3.16 Correlation between OSN and DSN degree centrality values. . . . 47
3.17 DSN and OSN ego betweenness centrality distributions. . . 48
3.18 Correlation between DSN and OSN ego betweenness centrality values. . . 48
3.19 Graphic representation of the five types of brokerage roles; the white nodes are the brokers, ellipses correspond to community boundaries. . . 48
3.20 Correlation between DSN and OSN brokerage scores. . . 49
3.21 Total brokerage scores in the DSN and the OSN. . . 50
4.1 A multi-layer social network. . . 54
4.2 Facebook network graph. . . 56
4.3 Interest network graph. . . 56
4.4 Contacts duration distribution. . . 57
4.5 Number of contacts distribution. . . 57
4.6 Contacts duration versus number of contacts. . . 58
4.7 Overall graph. . . 59
4.8 Distribution of i. . . 60
4.9 Distribution of times by mode. . . 61
4.10 Mode 1 graph. . . 61
4.11 Mode 2 graph. . . 62
4.12 Degree distribution for di↵erent social networks layers (Lapland dataset). . . 65
4.13 Ego betweenness distribution for di↵erent social networks layers (Lapland dataset). . . 65
4.14 Closeness distribution for di↵erent social networks layers (Lapland dataset). . . 66
List of Figures XV
4.15 Eigenvector centrality distribution for di↵erent social networks layers (Lapland dataset). . . 66 4.16 Communities based on Fiedler clustering (Mode 1 network). . . . 68 4.17 Communities based on Fiedler clustering (Mode 2 network). . . . 68 4.18 Communities based on Fiedler clustering (Facebook network). . . 69 4.19 Communities based on Fiedler clustering (Interest network). . . . 69
5.1 Delivery ratio as a function of message TTL (Lapland dataset). 78
5.2 Overhead cost as a function of message TTL (Lapland dataset). 79
5.3 Average latency as a function of message TTL (Lapland
dataset). . . 79
5.4 Average hop count as a function of message TTL (Lapland
dataset). . . 80
5.5 Delivery ratio as a function of message TTL (Sigcomm dataset). 81
5.6 Overhead cost as a function of message TTL (Sigcomm dataset). 81
5.7 Average latency as a function of message TTL (Sigcomm
dataset). . . 82
5.8 Average hop count as a function of message TTL (Sigcomm
dataset). . . 83
5.9 Delivery ratio as a function of inter-message creation interval
(Lapland dataset). . . 84 5.10 Overhead cost as a function of inter-message creation interval
(Lapland dataset). . . 84 5.11 Average latency as a function of inter-message creation
interval (Lapland dataset). . . 85 5.12 Average hop count as a function of inter-message creation
interval (Lapland dataset). . . 85 5.13 Delivery ratio as a function of inter-message creation interval
(Sigcomm dataset). . . 86 5.14 Overhead cost as a function of inter-message creation interval
(Sigcomm dataset). . . 86 5.15 Average latency as a function of inter-message creation
interval (Sigcomm dataset). . . 87 5.16 Average hop count as a function of inter-message creation
List of Tables
2.1 Main Parameter Settings . . . 28
2.2 WDM Parameter Settings . . . 28
2.3 Routing Protocols Parameter Settings . . . 28
3.1 Structural properties of SASSY DSN and OSN graphs. . . 39
4.1 Network motifs frequencies at di↵erent network layers. . . 63
4.2 Distance of node degree, ego betweenness, closeness and eigenvector centrality values. . . 64
1
Introduction
The di↵usion of mobile devices carried by users, such as smartphones, has led to a growing interest in new network architectures without fixed infras-tructure and exploiting peer-to-peer opportunistic connectivity. In a world where people are becoming increasingly reliant on mobile communication in several aspects of their life, being unable to communicate can negatively af-fect business and personal relationships. When there is no suitable network infrastructure, an alternative system is necessary. Delay Tolerant Networks (DTNs) [25] were developed to allow communication in scenarios where fixed infrastructure is not available and existing IP and GSM/UMTS network pro-tocols are unsuitable. In such scenarios, where nodes often create sparse net-work topologies and the contacts between them are intermittent, DTNs use a store-carry-forward strategy to allow communication when a path through the network is not reliable (due to disconnections). A node receiving a packet from one of its contacts can bu↵er the message, carry it while moving, and forward it to the encountered nodes which are at least as useful (in terms of delivery) as itself. A network that routes packets using the store-carry-forward approach is also called opportunistic network, because nodes forward messages when the opportunity arises: during an encounter contact.
Opportunistic networks are a special case of DTNs in which there are fre-quent disconnections and unpredictable encounter patterns. Researchers have developed several routing protocols to deal with these scenarios. Social-based routing protocols, for example, are a class of opportunistic routing proto-cols exploiting social information. Studying the social relationship between individuals within the network, we can better understand the usefulness of encounters for forwarding.
Commonly, the social network information is extracted from encounters between Bluetooth-enabled devices. The ubiquity of smartphones permits to collect user co-presence information, which allows us to identify social ties grounded on real world interactions. However, the Internet added other social interaction techniques that are not based on physical meetings: email, chat and online social networks services such as Facebook, Twitter, MySpace, and
LinkedIn. Online social interactions may be as useful as co-presence data for improving opportunistic networks, if they provide us with insights into user behavior.
Most of the existing social-based protocols use social information extracted from real-world encounter networks. A protocol based on encounter history, however, takes time to build up a knowledge database from which to take routing decisions. An opportunistic routing protocol which extracts social information from multiple social networks, can be an alternative approach for deciding when to forward messages. While opportunistic contact information changes constantly and it takes time to identify strong social ties, online social network ties remain rather stable and can be used to augment available partial contact information.
1.1 Goals and approach
The aim of this thesis is to demonstrate that social information extracted from multiple social networks provide performance improvements to opportunistic routing. To do so, we perform extensive analysis before presenting our routing proposal.
First, we analyze the performance of di↵erent classes of existing oppor-tunistic routing protocols in order to demonstrate that social-based algorithms are advantageous. Second, we compare user social behavior detected through mobile devices interactions to online behavior by using di↵erent social network analysis tools. This comparison demonstrates that online social information can be used to improve routing. Finally, we define a multi-layer social network model composed by several social networks and construct a new opportunis-tic routing approach which exploits multiple social network layers to perform routing decisions. The performance of this protocol are evaluated by carrying out tests via trace-driven simulation, with di↵erent representative scenarios and routing protocols.
1.2 Dissertation outline
The first part of Chapter 2 provides an overview of the related literature and the current state of the art in the area of DTNs and opportunistic networks. In the second part, the performance of some representative DTN routing schemes are compared through simulations and the impact of energy consumption on routing performance is discussed.
Chapter 3 analyzes the similarity in the graph structure between a social network detected through ZigBee encounters and and the Facebook network of a set of mobile users in order to understand if the online social network can provide useful information for opportunistic forwarding. First, social network
1.3 Publications 3
models are described; second, the concepts of online and detected social net-works are defined; lastly, online and detected social netnet-works are compared using both a sociocentric and an egocentric approach for social network anal-ysis.
Chapter 4 describes the analysis performed to investigate the similarity between multiple social networks layers by introducing a multi-layer social network model. The purpose of this analysis is to provide novel insights into the comparability of dynamic contact networks (detected social networks) and online social networks, and to better understand the social contact behavior of individuals and groups by considering an overall complex system where there are multiple social networks describing their social dynamics. In particular, this chapter focuses on a joint diagonalization technique used to produce static graphs from temporal graphs and on the analysis of node centrality, network motifs and detected communities on a multi-layer network.
Chapter 5 details how multi-layer social networks can be used for oppor-tunistic forwarding by describing a proposal of opporoppor-tunistic routing that exploits a multi-layer social network. This chapter demonstrates the benefits of the new protocol through extensive simulations by comparing the perfor-mance of the proposal to other existing routing schemes.
Finally, Chapter 6 concludes with a summary of the contributions of this thesis, as well as discussing the potential future research that can emerge from this work.
1.3 Publications
Book chapters
• F. De Rango and A. Socievole. Mobile Ad-Hoc Networks: Applications. Xin Wang, Chapter 11, Meta-Heuristics Techniques and Swarm Intelligence in Mobile Ad Hoc Networks. InTech - Open Access Publisher, pp. 245-264, 2011.
Conference papers
• A. Socievole, F. De Rango, and C. Coscarella. Routing approaches and performance evaluation in delay tolerant networks. In Wireless Telecom-munications Symposium (WTS), 2011, pp. 1-6, April 2011.
• A. Socievole, F. De Rango, and C. Coscarella. Performance evaluation of distributed routing protocols over DTN stack for MANETs. In Interna-tional Symposium on Performance Evaluation of Computer and Telecom-munication Systems (SPECTS), June 2011. Poster paper.
• A. Socievole and S. Marano. Exploring user sociocentric and egocentric behaviors in online and detected social networks. In Future Internet Com-munications (BCFIC), 2012 2nd Baltic Congress on, pp.140-147, April 2012.
• A. Socievole and F. De Rango. Evaluation of routing schemes in oppor-tunistic networks considering energy consumption. In Performance Evalu-ation of Computer and TelecommunicEvalu-ation Systems (SPECTS), 2012 In-ternational Symposium on, pp. 1-7, July 2012.
• A. Socievole and S. Marano. Evaluating the impact of energy consumption on routing performance in delay tolerant networks. In Wireless Communi-cations and Mobile Computing Conference (IWCMC), 2012 8th Interna-tional, pp. 481-486, August 2012.
2
The development of opportunistic networks
In this chapter we discuss the development of opportunistic networks in sce-narios where mobile nodes are sparse and the links between them are intermit-tent. In these networks there is no guarantee that a path between source and destination nodes exists at any time, rendering traditional routing protocols for mobile networks unsuitable to deliver messages between nodes.
First, we will describe Mobile Ad Hoc Networks (MANETs) and discuss why routing protocols for MANETs are unsuitable to deliver messages in these scenarios where connectivity is intermittent and high latency might be intro-duced. Second, we will discuss the development of Delay Tolerant Networking (DTN) and opportunistic networks designed to handle intermittent connec-tivity, high latency, long queuing delays and limited resources. Third, we will discuss DTN routing and compare the performance of some representative DTN routing schemes. Lastly, we will evaluate how the energy consumption impacts the routing performance and how the di↵erent forwarding algorithms for opportunistic networks influence the energy usage in the mobile devices.
2.1 MANETs
MANETs are wireless mobile networks where no infrastructure exists and the network topology may dynamically change in an unpredictable manner forming an arbitrary graph. In such networks, nodes may be asked to route packets without connecting to access points. An example of MANET topology is showed in Fig. 2.1.
MANETs were initially developed keeping in mind the military applica-tions, such as battlefield where an infrastructure network is difficult to have. In such environments, ad hoc networks are able to self-organize and can be used where other technologies cannot be deployed. The capabilities of MANETs were suddenly used for other well-known applications such as:
• Collaborative computing - Some business environment could require col-laborative work also outside offices. In such environments, it could be more
Fig. 2.1. A MANET topology for a set of laptops. Wireless connections between nodes are indicated with bolt symbols. There is no need of a dedicated router since every device routes packets.
important for people to have a possibility to cooperate and exchange in-formation outside.
• Disaster recovery applications - After a natural disaster communications infrastructure is usually not available and there is the need to quickly restore communications. MANETs can be set up in hours instead of days or weeks required for a wired network.
• Personal Area Networking - A Personal Area Network (PAN) is short-range network where devices such as PDAs, laptops or digital cameras are usually associated with a given person. In such scenarios, the technology used to avoid the need of wires between devices is mainly Bluetooth. It is clear that routing in MANETs is intrinsically di↵erent from routing in infrastructured networks. One of the major challenges in the design of a routing protocol for MANETs is to find a packet route quickly and efficiently considering that topology rapidly changes, routers have to be selected and a request has to be initiated. Moreover, the low resource availability in these networks requires efficient utilization and hence an optimal routing scheme.
MANETs routing protocols can be classified as being proactive or reactive. Proactive (or table-driven) protocols require that a node keep track of routes to all possible destinations so that a route is ready when needed. This implies a periodic update of routing tables and does not copy well, however, in highly dynamic environments. On the other hand, reactive (or on-demand) protocols require that a node only discover routes to destinations on demand. Reactive protocols often consume less bandwidth than proactive protocols, but the delay to discover a route to a destination can be significantly high. We can
2.1 MANETs 7
conclude that there is not a protocol suited for all possible environments, while some hybrid schemes have been proposed.
Destination-Sequenced Distance-Vector (DSDV) [59] (proactive), Dynamic Source Routing (DSR) [38] (reactive) and Ad Hoc on Demand Distance Vector Routing (AODV) [60] (reactive) are some of the most cited routing protocols for MANETs.
DSDV is a hop-by-hop distance vector routing protocol where each node periodically broadcasts routing updates and maintains a routing table with all the possible destinations of the particular network and the number of hops to each destination. Each route is labelled with a sequence number in order to have updated routes. There are two possible types of route updates: full dumps (all available routing information) that are sent infrequently during periods of occasional movements or small increment packets transmitted after a full dump. The mobile nodes also sent beacon messages in order to have updated information on neighbors.
In DSR protocol, mobile nodes maintain route caches containing the known source routes. The entries of the route cache are periodically updated in order to include new routes. There are two major phases: the route discovery and the route maintenance phase. The discovery phase starts when a node does not have an entry into the route cache to send a packet to a particular destination. It initiates a route discovery by broadcasting a route request containing the destination address, along with the source nodes address and a unique ID number. All the nodes receiving the route request check if they have an entry for that destination. If they do not have it, they add their own addresses to the route record of the request and forward the packet along their outgoing links. In order to limit the number of route requests propagated along the outgoing links, each node only propagates the route requests that have not yet been seen and the requests that do not contain the nodes address in the route record. When the route request reach a node having an unexpired route to the destination or the destination node itself is reached, a route reply is generated and forwarded along the route to the initiator of the request. Route maintenance is accomplished using acknowledgements and route error packets. The AODV protocol is basically a combination of DSDV and DSR. Sim-ilar to DSR, it uses the on-demand mechanism of route discovery and route maintenance adding the use of hop-by-hop routing, sequence numbers, and periodic beacons used in DSDV. AODV is also able to minimize the number of broadcasts by creating routes on an on-demand basis without maintaining a complete list of the routes as in DSDV.
There are several other routing protocols for MANETs [85]:
• Optimized Link State Routing (OLSR) [16] - a proactive link state protocol where nodes floods routing table within the network and calculate the optimal forwarding locally.
• Location-Aided Routing (LAR) [41] - protocols that use GPS information to improve routing performances.
• EASE [31] - the history of encounters is used to improve routing perfor-mances.
• On Demand Multicast Routing Protocol (OMDRP) [43] - a reactive mul-ticast protocol using mobility prediction.
• Dynamic MANET On-Demand (DYMO) [58] - a successor to AODV work-ing both in proactive and in reactive mode.
All the MANET routing protocols mentioned above require that there exists an end-to-end path from the packet source node to the destination node. If nodes are characterized by high mobility and the deployment of nodes in the network is sparse, this condition is difficult to meet. If the path does not exist, packet transmission is delayed until a path becomes available. Moreover, if there is a large delay, transport protocols such as TCP does not work well, even is the end-to-end is still active. For a large delay, TCP congestion control mechanism assumes that a packet is lost. Another problem for TCP is that the window size might take long time to enlarge because of the time needed to wait for the ACK packets. These considerations let us conclude that a di↵erent strategy is needed when mobile networks are intermittently connected or when there is a large delay.
2.2 Opportunistic networks and Delay Tolerant
Networks
Opportunistic networks are one of the most interesting evolutions of MANETs. In opportunistic networks, nodes in transmission range opportunistically co-operate during a contact to forward data towards a destination. In a context where there are frequent disconnections and high delays, thanks to this oppor-tunistic behavior, mobile nodes are able to communicate with each other even if a route connecting them does not exist. Delay Tolerant Networks (DTNs) [25] also known as disruption-tolerant networks or intermittently connected networks can be considered a subset of opportunistic networks with few high delay links. Actually there is not in the literature a clear separation of con-cepts for opportunistic networks and DTNs and the two terms are often used interchangeably. We believe that opportunistic networks include DTNs and several concepts behind them come from studies on DTNs.
Delay tolerant networking architecture allows communication in scenarios where nodes are sparse and the contacts between them are intermittent, due to high node mobility. Examples of intermittently connected networks are: • Inter-planet satellite networks - networks where the communication
be-tween satellites and ground nodes su↵ers from long delays and episodic connectivity.
• Sensor networks - networks where battery power is limited and sensors are scheduled to be wake/sleep periodically in order to send data to the sink node.
2.2 Opportunistic networks and Delay Tolerant Networks 9
• Military ad hoc networks - networks where nodes may move randomly and are subject to being destroyed.
In the DTN domain the following assumptions of conventional IP networks are not valid:
• There exists and end-to-end path between the source and the destination node.
• The end-to-end packet drop is small.
• The maximum round trip time between nodes in the network is not high. As a result the DTN routing protocols and data-delivery architecture di↵er from traditional TCP/IP networks. The RFC 4838 [14] describes the routing and the transport layer approaches used in DTNs. In these networks, a node receiving a packet from one of its contacts can bu↵er the message, carry it while moving, and forward it to the encountered nodes which are at least as useful (in terms of delivery) as itself. This strategy is also referred as store-carry-forward. The data unit used in DTNs can be a message, a packet, or bundle, which is defined as a number of messages to be delivered together. The DTN Bundle Protocol is used to communicate between regions with high delay links. This protocol sits between the transport and application layer of the traditional TCP/IP stack.
As we have discussed, DTNs solve the problem of disconnection and delay that MANETs are not able to cope with, using the store-carry-forward ap-proach. DTNs, however, are designed for systems with a few high delay links. There are scenarios, in which the mobile nodes are subject to a high num-ber of disconnections and delays. One example is a Pocket Switched Network (PSN) [33], where humans carry small personal computing devices capable of exchanging messages. The network is weighted using the encounters between the humans carrying the mobile devices during their daily lives. A network routing packets using the store-carry-forward approach in this scenario is an opportunistic network.
Opportunistic networks and their algorithms has led to the design of new applications that were not previously carried out on mobile devices:
• Mobile file sharing [50] [63]
• Crowdsourcing and messaging [13] [52] • Opportunistic Computation [17] [55]
• Sensing [18] [21] and collaborative sensing [29] [74] • Personal sensing for healthcare monitoring [44] • Military surveillance [82] and human tracking [1] • Animal tracking [39]
• Interaction with embedded AI in pervasive environments [32].
Where connectivity to existing infrastructure networks is not present, the message passing between the mobile devices could route a particular message to the destination. This concept is related to Stanley Milgrams famous small
world experiment [75] where the letters sent between two unfamiliar individ-uals, one in Nebraska and the other in Massachusetts, were routed using six hops.
The task of the routing algorithm in an opportunistic network is to decide if a particular contact is appropriate for routing any of the outgoing messages. Studying the social relationship between individuals within the network, we can better understand the usefulness of encounters for forwarding. The Haggle architecture [73] was designed as a data-centric architecture for opportunistic networks taking advantage of brief encounters to route packets. Hui et al. showed that finding the correct groups of nodes to forward messages improve routing and node efficiency [34] [35] (we describe at length this social based routing strategy in section 2.4.5).
2.3 DTN routing
Routing in DTN or opportunistic networks is a difficult issue to deal with because the assumption of an existing end-to-end path between the source and the destination does not hold. Therefore, routing protocols have to de-liver a message to the destination using the store-carry-forward strategy. Sev-eral routing protocols were proposed to handle frequent disconnections, op-portunistic or predictable connections, high latency, long queuing delay and limited resources. In this section we classify these protocols and we briefly describe the most representative protocols belonging to each class.
Routing protocols for DTNs can be classified as follows: • Flooding- or replication-based
• History- and encounter-based • Probabilistic-based
• Social behavior-based • Knowledge-based
Flooding- or replication-based protocols employ a simple routing strategy. The source node forwards a copy of the message to all its neighbors and the neighbors do the same with their neighbors (which do not have a copy of the message). Protocols belonging to this class vary according to the spreading mechanism used and the number of copies of the packet used to flood the network.Epidemic routing [76] was historically the first flooding based rout-ing protocol. Each contact opportunity is used by the nodes to disseminate the data. When a node receives a packet, it is bu↵ered and carried by the mobile node and all the packets kept by the node are forwarded to all the other encountered nodes. Clearly, a message spreads quickly throughout the network and this reduces the delivery delay. Moreover, considering that there are many copies of a message within the network, Epidemic routing increases the delivery ratio as well. Unfortunately, as the number of messages increases, Epidemic routing do not scale well due to its high resource requirement (i.e.,
2.3 DTN routing 11
storage and battery) and consequently, some complementary mechanisms are needed to overcome this problem. More details on Epidemic routing will be given in section 2.4.1. Spray and Wait protocol [71] is another well-known flooding-based routing protocol controlling the amount of copies of a packet to be spread in the network. Di↵erently from Epidemic routing, the number of messages copies to be spread is fixed. The source node sprays L message copies to L distinct neighbors and then waits with the hope that one of these nodes will meet the destination. During the wait phase all L nodes storing a copy of the message perform direct delivery. Direct Delivery [70] is a single-copy routing technique where the message is forwarded by the current node only directly to the destination node. Spray and Wait obviously has an over-head lower than Epidemic routing and it can be adjusted to meet specific deadlines as well. For example, using a shorter wait phase, lower delays can be achieved. This controlled flooding-based protocol will be better described in section 2.4.2.
History- and encounter-based routing protocols are an alternative to flood-ing schemes considerflood-ing history information on the past encounters in order increase the system’s performance. A representative history-based routing pro-tocol is PRoPHET (Probabilistic Routing Propro-tocol using History if Encoun-ters and Transitivity) [46]. Lindgren et al. assume that if a user visited a place several times in the past it is much likely that will visit this place again in the future. A delivery predictability indicating how likely it is that a node will be able to deliver a packet to a destination is calculated at each node and packets are forwarded accordingly. With MaxProp [12] routing, Burgess et. al also use history of the node’s encounters to drive routing decisions. The path likelihood metric based on historic information is the metric used to decide whether to transmit (if time runs short) or delete a packet (if storage space is not enough). PRoPHET and MaxProp will be further described in sections 2.4.3 and 2.4.4 respectively.
Probabilistic-based routing protocols aim to reduce the cost of forwarding while retaining good performances by forwarding packets only to nodes that have high delivery probabilities. With the term ”probabilistic-based” rout-ing protocols we refer to the probabilistic ones that do not utilize history information. (p-q) routing [49] is an example of probabilistic scheme where a relay node encountering the source node accepts a copy of the message with
probability q (0 p 1) and encountering another potential relay, the
lat-ter accepts a copy with probability p (0 q 1). The destination accepts
the copy of the message with probability 1. In [77] and [78], Wang and Wu propose a Delay-/Fault-Tolerant Mobile Sensor Network for Pervasive Infor-mation Gathering (DFT-MSN). Their proposal define a delivery scheme based on the delivery probability to forward a message to the appropriate neighbor nodes and a queue management scheme deciding on whether to transmit or drop a stored message, based on the message’s importance.
To improve routing performance further, many protocols use social net-work information. There exist several recent studies studies that investigate
the impact of human mobility and the potential of social relations on the design of a routing protocol. Social behavior-based protocols usually extract social information from a contact network (also called detected social net-work ). In [15], Chaintreau et al. analyze a large number of traces related to di↵erent human-mobility environments and find that their inter-contact time distribution is heavy-tailed. Consequently, routing algorithms for oppor-tunistic networks have to be tested under di↵erent mobility models than the Random Way-Point. Bubble-Rap [34] is a social based routing protocol where nodes are ranked according to their centrality and their belonging to a par-ticular community. This protocol allows nodes to ”bubble up” a message to a node it has a higher rank within the same community, or is a member of a com-munity that is closer to the destination. This protocol will be better analyzed in section 2.4.5. The SimbetTS [19] routing protocol is another example of social based protocol where a node forward a message to an encountered node according to three social metrics: betweenness (the number of shortest path on which a node lies), similarity (the number of ties that two nodes share), and tie-strength (the recency, duration and number of contacts between two nodes). In another work [81], Xu et al. also use centrality as metric for oppor-tunistic forwarding. However, this approach overloads the most central nodes which have to perform a large percentage of the forwarding (63% of traffic by the 10 % of nodes). Boldrini et al. [7] use social information extracted from users’ connections to users outside their home group to improve opportunis-tic routing and construct a middleware using history information on the past encounters to improve opportunistic services. In another work [48], Mashhadi et al. define a social-based routing scheme where messages are forwarded to nodes that are interested in the specific content of the message.
As we have seen, most protocols use social information extracted from de-tected social networks, however there exists the possibility to perform oppor-tunistic routing using the information extracted from online social networks
such as Facebook1, Twitter2, LinkedIn3, etc. The protocols using this strategy
will be described in Chapter 5.
Another class of routing protocols for DTNs, known as knowledge-based or deterministic routing protocols, assumes to have partial or full knowledge of either the network topology or the inter-contact times. In an early study [37], Jain et al. evaluate the performance of di↵erent routing algorithms varying their network knowledge, also known as oracles. The knowledge of the meeting times of DTN nodes or the storage space availability at each node are exam-ples of oracles. The simexam-plest algorithm, which has zero knowledge is called First Contact (FC). According to this scheme, a message is forwarded along an edge chosen randomly between all the current contacts. Other algorithms, such as the Earliest Delivery (ED) have oracles related to the contact times
1 www.facebook.com 2 www.twitter.com 3 www.linkedin.com
2.4 Performance comparison of DTN routing schemes 13
and durations, while the most sophisticated one, called Linear Programming, has oracles regarding contacts, queuing and traffic. In [86], using topology in-formation and group membership, Zhao et al. conclude that even with partial knowledge, multicast routing algorithms can perform efficiently. Demmer et al. [20] adjust Link State Routing for DTN environments such as connection-isolated villages in developing countries, assuming some knowledge regarding the approximate contact times and contact durations. Since the connectivity carrier to the Internet is a public transport vehicle, whose timetable can be known in advance, this knowledge is used to improve routing.
2.4 Performance comparison of DTN routing schemes
In this section we compare the performance of some of the DTN routing proto-cols described in section 2.3. This work was conducted with Prof. Floriano De Rango and Carmine Coscarella and published in [67] and [66]. The purpose of these first works on DTNs was to investigate the behavior of a set of routing protocols belonging to di↵erent classes in terms of number of transmitted mes-sages, message delivery ratio, average latency, bu↵er occupancy and average number of hops. In section 2.3.2 we extend our analysis considering energy consumption as well. We first describe in a deep way some of the routing schemes we considered and the simulation environment, and subsequently we discuss the results of our performance comparison.
2.4.1 Epidemic routing
Epidemic routing [76] is a flooding based protocol where each contact oppor-tunity is used by the nodes to forward the messages. When a node receives a packet, it is bu↵ered and carried by the mobile node and all the packets kept by the node are forwarded to all the other encountered nodes (Fig. 2.2).The basic idea of epidemic routing is equivalent to the spread of an infection. When a node carrying a packet has a contact with a new node that does not have a copy of that packet, the carrier infects the new node forwarding a copy of the packet. Each node stores in a bu↵er the messages it has originated and that ones it is carrying on behalf of other nodes. A summary vector is kept by the nodes as an index of these messages, and when two nodes meet they ex-change their summary vectors in order to understand which messages stored remotely have not been seen by the local node. Each message of the summary vector has a globally unique message ID which is used to establish if it has been previously seen. Fig. 2.3 shows a flow diagram of Epidemic forwarding scheme.
It is important to note that, in routing schemes adopting the store-carry-forward paradigm, many packets could remain in the network when a packet reaches its destination node. Those packets not only waste bu↵er resources but also continue to scatter packet copies. Since the nodes storage capacity
!
Fig. 2.2. Example of epidemic forwarding: a source node A forwards the packet to the encountered nodes B and C. Node B, encountering D, forwards the packet to the destination node D.
2.4 Performance comparison of DTN routing schemes 15
is limited,recovery scheme has to be combined with the forwarding scheme in order to delete unnecessary packets from the network. In [84] several recovery approaches are discussed. A timer-based approach deletes all packets from the network in a finite time interval. However, it is not simple to set the lifetime of packets because if the lifetime is too short, packets may not reach their desti-nations, while if it is too long, many unnecessary packets remain in the network for a long time. Another approach, referred as VACCINE, is based on explicit notification. When a packet reaches the destination node, this node generates the corresponding anti-packet. Moreover, when a node successfully delivers a packet to the destination node, it generates an anti-packet as well. These anti-packets are then flooded to the other nodes according the conventional epidemic scheme. When the anti-packet is received, the corresponding packet, if any, is deleted from the node. It is important to note that anti-packets also act as acknowledgements, so that source nodes can know the successful delivery of packets they transmitted. The recovery process terminates when anti-packets spread over all nodes. In the performance comparison described in section 2.4.7, we consider both classic Epidemic routing and Epidemic with the VACCINE scheme.
2.4.2 Spray and Wait
Spray and Wait protocol [71] is a di↵erent kind of epidemic routing which floods the network with a fixed number of copies of a packet. The source node sprays L message copies to L distinct neighbors and then waits hoping that one of these nodes will carry the message to the destination. If the destination node is not found during the spraying phase, each of the L nodes carrying a message copy will forward the message only to the destination node (direct delivery). It has been defined a binary version of Spray and Wait protocol. This version allows a source node A to start with L copies of the packet. Then, when any node L having n > 1 copies of the packet encounters another node B (with no copies), it forwards to B L/2 copies. When node A has only one copy left, it forwards the packet only to the destination. In Fig. 2.4, the flow diagrams describing these protocols are showed.
2.4.3 PRoPHET
PRoPHET (Probabilistic ROuting Protocol using History of Encounters and Transitivity) [46] is a routing scheme which estimates a node metric using the information on the number of meetings between nodes. When there is a contact between two nodes, they increase their link weight towards each other and towards the nodes met by the other node. In order to indicate how likely it is that a node will be able to deliver a packet to a destination, PRoPHET defines a metric called delivery predictability. When there is a contact between two nodes, they exchange their summary vectors containing the delivery pre-dictability information. This information is used to choose which messages to
!
Fig. 2.4. Flow diagrams of Spray and Wait (a), and Binary Spray and Wait (b) message generation.
exchange and to update the internal predictability vector. In PRoPHET, a node forwards a packet to its encounter, only if this encounter’s delivery pre-dictability is higher. In Fig. 2.5, a flow diagram for this scheme is presented.
2.4.4 MaxProp
In a study similar to PRoPHET, nodes are weighted using historic information of the contacts between nodes. MaxProp [12] is a flooding-based DTN routing protocol, where each node keeps a particular vector listing estimations of meeting probabilities between nodes. In other words, this vector defines the likelihood a node has of encountering each of the other nodes of the network. During a contact between two nodes, each node increments the corresponding element of the vector and they exchange their node-meeting likelihood vectors. With this information they are able to compute the shortest paths to the
2.4 Performance comparison of DTN routing schemes 17
!
Fig. 2.5. Flow diagram of PRoPHET forwarding scheme.destinations desired. The messages are then ordered and sent considering the cost to a particular destination. In order to do that, MaxProp keeps an ordered queue for the messages, based on the destination of each message and ordered by the path likelihood to that destination. During a meeting between two nodes, all messages not held by the encounter are transferred. Moreover, in MaxProp nodes that successfully receive a message use acknowledgements to be injected into the network in order to instruct the other nodes to delete
extra copies of a message from their bu↵ers. In Fig. 2.6, the flow diagram of MaxProp forwarding scheme is presented.
!
Fig. 2.6. Flow diagram of MaxProp forwarding scheme.2.4.5 Bubble Rap
Bubble Rap [34] is among the most widely referenced social-based routing protocols for this class of mobile networks. Fig. 2.7 shows the flow diagram for this forwarding scheme. In Bubble Rap a node is characterized by two social metrics, namely centrality and community. A minimum of two central-ity measures are associated to each node. One measure is based on the nodes global popularity (GP) in the whole network and the other measure is based
2.4 Performance comparison of DTN routing schemes 19
on the local popularity (LP) within its community or communities. A mes-sage is forwarded to nodes with higher global popularity (centrality) until the carrier node meets a node with the same community label (CL) as the desti-nation node. In this case, the message is forwarded to nodes with higher local popularity until successful delivery.
!
Fig. 2.7. Flow diagram of Bubble Rap forwarding scheme.2.4.6 Simulation environment
Our simulations are carried out on the Opportunistic Network Environment (ONE) simulator [40]. In this simulation environment each node is modeled with a radio interface, persistent storage, several movement models, several
routing capabilities, a basic energy consumption module and application in-teractions. We compare the routing performance of First Contact, Direct De-livery, Epidemic Routing, Epidemic Routing with VACCINE recovery mech-anism (we extend the simulator including this mechmech-anism), Spray and Wait, PRoPHET and MaxProp.
The chosen mobility is the Random Waypoint [38], where the node move-ment is free of restrictions, both temporal and spatial, with a node speed selected between 0.5 m/s and 20 m/s. Nodes have a transmission range of 50 meters and move in an area of 2000m x 2000m. In the scenarios where the number of nodes is fixed, we have selected 50 nodes.
Message size varies from 5 to 15 kB, each message is generated at a ran-dom time with 3 second intervals [t, t+3s] and is sent to a ranran-dom selected destination node. The TTL is set to 1800s.
The transmit speed of radio devices is 250 kBps and the bu↵er size is set to 20 MB. We run the simulations with Spray and Wait with 5 message copies for the scenarios with 50 nodes and choosing a number of copies equal to the 10% [72] of the number of nodes in the other scenarios. For the simulation of
PRoPHET we choose Pinit = 0.75, = 0.25 and = 0.98, as suggested in
[46]. Finally, the simulation time is always 15000 seconds. 2.4.7 Performance comparison and results
We have focused on comparing the performance of the chosen DTN protocols with regard to the following metrics:
• number of transmitted messages
• message delivery ratio, i.e. how many of the transmitted messages the protocol is able to deliver to destination;
• average latency, i.e. how long time it takes a message to be delivered (even though applications using these protocols are relatively delay tolerant, it is still of interest to consider this performance metric);
• bu↵er occupancy, in order to analyze the resource utilization which is so crucial;
• average number of hops to reach the destination node.
Fig. 2.8 shows the number of transmitted messages as a function of the num-ber of nodes. Direct Delivery sends the smallest amount of messages and this is not very surprising, since according to this scheme the sending node de-livers a message only if it meets the destination. On the contrary, Epidemic routing generates the highest number of transmitted messages because of the unlimited replication of messages. Applying the VACCINE recovery mecha-nism,however, the number of messages sent by Epidemic routing is less than classic Epidemic routing and comparable to the number of messages sent by PRoPHET and MaxProp. It is important to underline that in PRoPHET and MaxProp, messages are only sent to better nodes, while epidemic routing sends all possible messages to the encountered nodes.
2.4 Performance comparison of DTN routing schemes 21
A single-copy routing protocol like First Contact decreases the number of transmitted messages, since a packet is delivered to the first encountered node trying to reach the final destination. Looking at Spray and Wait rout-ing protocols, which use a fixed number of copies, the number of transmitted messages are reduced. Another thing that can be seen from the graph is that increasing the number of nodes PRoPHET increases the number of transmit-ted messages overcoming MaxProp and epidemic with VACCINE. This is due to the fact that the higher probability of two nodes meeting each other forces PRoPHET to more frequent computations and therefore the number of copies placed in the network is high.
! 0 100000 200000 300000 400000 500000 600000 700000 800000 900000 1000000 10 20 30 40 50 60 70 80 90 100 Number'of'nodes N um be r'o f't ra ns m itt ed 'm es sa ge s Epidemic2+2Vaccine Epidemic MaxProp Prophet Spray2&2Wait Binary2Spray2&2Wait Direct2Delivery First2Contact
Fig. 2.8. Number of transmitted messages as a function of the number of nodes.
Fig. 2.9 the delivery ratio as a function of the number of nodes is showed. MaxProp and Epidemic routing protocols perform better and similarly be-cause they make use of best path selection mechanisms and flooding respec-tively. Moreover, the VACCINE mechanism, combined with Epidemic routing outperforms the classic Epidemic routing because the deleted packets decrease the bu↵er occupancy allowing other transmissions. Looking at PRoPHET, based on local mobility information, it presents a better delivery ratio than Spray and Wait protocols but lower than MaxProp and epidemic protocols. Direct Delivery and First Contact are characterized by low delivery perfor-mance, since the first protocol delivers a message only if the encounter is the destination, while the second delivers a message to the first node encountered trying to reach the destination.
Fig. 2.10 shows the delivery ratio as a function of node speed. This per-formance metric increases with respect to speed for all the routing protocols and this behavior is closely related to the encounter process. The more the frequency of the encounters, the more the number of message exchange and hence delivery. The single-copy protocols as Direct Delivery and First Con-tact are characterized by the lowest delivery ratio. When the node speed is
! 0 0,1 0,2 0,3 0,4 0,5 0,6 0,7 0,8 0,9 1 10 20 30 40 50 60 70 80 90 100 Number'of'nodes De live ry' ra tio Epidemic3+3Vaccine Epidemic MaxProp Prophet Spray3&3Wait Binary3Spray3&3Wait Direct3Delivery First3Contact
Fig. 2.9. Delivery ratio as a function of the number of nodes.
low, the best performance is reached by MaxProp and Epidemic routing with VACCINE, followed by classic Epidemic, PRoPHET, Spray and Wait proto-cols and finally by Direct Delivery and First Contact. When the node speed is high, the frequency of the encounters is so high that the di↵erence between the performances of MaxProp, epidemic protocols, PRoPHET, and Spray and Wait protocols is not significant.
! 0 0,1 0,2 0,3 0,4 0,5 0,6 0,7 0,8 0,9 1 0 2 4 6 8 10 12 14 16 18 Node%speed%(m/s) De live ry% ra tio Epidemic3+3Vaccine Epidemic MaxProp Prophet Spray3&3Wait Binary3Spray3&3Wait Direct3Delivery First3Contact
Fig. 2.10. Delivery ratio as a function of node speed.
The average latency as a function of the number of nodes is showed in Fig. 2.11. First Contact and Direct Delivery take about 800 seconds to de-liver a message, both with a small number of nodes and with a large number of nodes. The motivation is the same as the previous one: the two protocols deliver a message to a single node, so the low delivery ratio leads to a higher latency. Spray and Wait protocols behave similarly between 20 and 40 nodes simulations, but when the number of nodes increases the binary version of
2.4 Performance comparison of DTN routing schemes 23 ! 0 100 200 300 400 500 600 700 800 900 1000 10 20 30 40 50 60 70 80 90 100 Number'of'nodes Ave ra ge 'la te ncy' (s ) Epidemic2+2Vaccine Epidemic MaxProp Prophet Spray2&2Wait Binary2Spray2&2Wait Direct2Delivery First2Contact
Fig. 2.11. Average latency as a function of the number of nodes.
the protocol delivers a message in a smaller amount of time. It is important to note that the two versions of epidemic protocols start with a high average latency for 20 nodes when the number of nodes increases there is a significant di↵erence between them. The mechanism of anti-packets operates in a good way if many nodes try to communicate with each other, increasing the level of propagation of anti-packets. Consequently, the version without VACCINE o↵ers the highest average latency as a result of the large distribution of mes-sages within the network. Looking at PRoPHET, this protocol does not o↵er a fulfilling performance: predicting good forwarding nodes in this scenario is difficult because of the randomness in the mobility of nodes, leading to a higher latency. Nevertheless, MaxProp is always the best protocol: the higher delivery ratio leads to a lower average latency.
Looking at the average latency as a function of node speed (Fig. 2.12), it can be seen that the more the node speed increases, the more the nodes have the possibility to encounter di↵erent nodes. Hence, the delivery ratio increases and the average latency decreases. At low speeds, First Contact and Direct Delivery protocols are characterized by the lowest average latency, since the contacts between nodes are more sporadic; protocols causing a high average latency are classic Epidemic and PRoPHET, since they send messages to all the encountered nodes and during this process it is not sure that one of these nodes is the final destination (especially for Epidemic protocol) or that the delivery predictability of the destination may enable the transmission of the message (in the case of PRoPHET). At higher speeds, MaxProp, epidemic protocols, PRoPHET and Spray and Wait protocols outperform Direct Deliv-ery and First Contact. Classic epidemic protocol and PRoPHET, according to their epidemic nature, have the highest average latency, followed by Spray and Wait protocols. A lower average latency is guaranteed by Epidemic with VAC-CINE and MaxProp. The reason is that the mechanism based on anti-packets provided by VACCINE and the bu↵ering process provided by MaxProp allow a better management of the bu↵er space leading to a lower average latency.
! 0 200 400 600 800 1000 0 2 4 6 8 10 12 14 16 18 Node%speed%(m/s) Ave ra ge %la te ncy% (s ) Epidemic.+.Vaccine Epidemic MaxProp Prophet Spray.&.Wait Binary.Spray.&.Wait Direct.Delivery First.Contact
Fig. 2.12. Average latency as a function of node speed.
Fig. 2.13 and Fig. 2.14 show the bu↵er occupancy percentage as a func-tion of the number of nodes and node speed respectively. In Fig. 2.13, it is intuitive to see that the classic Epidemic protocol shows the higher bu↵er occupancy percentage and this is due to the flooding process and the absence of a recovery mechanism deleting unnecessary packets from the network. In PRoPHET, when two nodes meet, a message is transferred to the other node only if the delivery predictability of the destination of the message is higher at the other node, so a message may have to stay in the bu↵er for a longer period. Analyzing the behavior of MaxProp and epidemic with VACCINE, it can be seen that it is similar. The mechanism of assigning priorities to bu↵ered packets and the recovery mechanism guarantee a lower and acceptable per-centage of bu↵er occupancy. In the case of Spray and Wait protocols, where the number of message copies is fixed, the percentage of bu↵er occupancy fur-ther decreases. Similarly, Direct Delivery and First Contact, using only one copy of the message, provide a lower percentage.
! 0 5 10 15 20 25 30 35 40 45 10 20 30 40 50 60 70 80 90 100 Number'of'nodes Bu ffe r'o cc up an cy' (% ) Epidemic2+2Vaccine Epidemic MaxProp Prophet Spray2&2Wait Binary2Spray2&2Wait Direct2Delivery First2Contact
2.4 Performance comparison of DTN routing schemes 25 ! 0 5 10 15 20 25 0 2 4 6 8 10 12 14 16 18 Node%speed%(m/s) Bu ffe r%o cc up an cy% (% ) Epidemic/+/Vaccine Epidemic MaxProp Prophet Spray/&/Wait Binary/Spray/&/Wait Direct/Delivery First/Contact
Fig. 2.14. Percentage of bu↵er occupancy as a function of node speed.
In Fig. 2.14 the bu↵er occupancy increases with respect to speed for pro-tocols that rely on flooding or a probabilistic forwarding, such as the classic Epidemic protocol and PRoPHET respectively. For protocols that rely on path selection and a better bu↵er management, such as MaxProp, and on the use of anti-packets, such as Epidemic with VACCINE, the bu↵er occupancy decreases with respect to speed. This is intuitive, since the recovery mecha-nism allows a node to refuse or delete a message from its bu↵er in case of successful delivery to the destination. For protocols using a fixed number of copies of the message, such as Spray and Wait protocols, Direct Delivery and First Contact, the percentage of bu↵er occupancy can be considered constant. The behavior of the di↵erent routing approaches can be further explained looking at Fig. 2.15 where the average hop count as a function of the number of nodes is showed. ! 0 2 4 6 8 10 12 14 16 18 10 20 30 40 50 60 70 80 90 100 Number'of'nodes Ave ra ge 'h op 'co un t Epidemic2+2Vaccine Epidemic MaxProp Prophet Spray2&2Wait Binary2Spray2&2Wait Direct2Delivery First2Contact
Direct Delivery maintains a hop count of 1 in any case, since it delivers a message only to the final destination. In the case of First Contact, increasing the number of nodes increases the average number of hops, since a node de-livers a message to the first encountered node. Similar is the behavior of the other protocols where the average number of hops slightly increases with the increase in the number of hops.
2.4.8 Discussion
Considering a set of DTN routing protocols composed by Direct Delivery, First Contact, Epidemic routing (both without a recovery mechanism and with VACCINE), Source Spray and Wait, Binary Spray and Wait, PRoPHET and MaxProp, we compared their routing performance in di↵erent scenarios in terms of delivery ratio, average latency, bu↵er occupancy and average hop count. Our simulations show that MaxProp and epidemic routing with VAC-CINE give better performance than the other protocols. Moreover, MaxProp and Epidemic with VACCINE perform very similarly considering delivery ratio, average latency, the percentage of bu↵er occupancy and average hop count. The use of best path selection mechanisms with an appropriate bu↵er management, as in the case of MaxProp, and flooding combined with the VACCINE recovery scheme, as in the case of epidemic routing, succeed in the goal of providing communication between nodes in a intermittently con-nected network with di↵erent forwarding strategies, and better performance than other examined protocols.
2.5 Impact of energy consumption on routing
performance
After analyzing many DTN routing protocols in the literature, we observed that authors compare the performance of their routing algorithm in order to show the improvement of their proposal with regard to others in the litera-ture, focusing on performance metrics like delivery ratio and delivery latency. A DTN system should attempt to achieve high delivery ratio and low delivery delay, but it is very difficult to achieve both targets, considering that the sys-tem is constrained with regard to energy consumption and storage space. As a result, we believe that the choice of a DTN routing protocol should be based on the desired performance outcome, taking also into account system constraints. Starting from this consideration, we extended our performance comparison of a set of representative DTN routing protocols (Epidemic routing, Spray and Wait, MaxProp, PRoPHET and Bubble Rap) considering energy consump-tion, in order to study if their behavior vary when the energy consumption constraint is considered. This work was conducted with Prof. Floriano De Rango and Prof. Salvatore Marano and published in [65] and [69].
2.5 Impact of energy consumption on routing performance 27
2.5.1 Simulation environment
In order to test the di↵erent protocols considering energy consumption, we carried several simulations using again the Opportunistic Network Environ-ment (ONE) simulator. This simulator has been especially designed to test routing protocols for DTN networks including Epidemic routing, Spray and Wait, PRoPHET and MaxProp. We extended the simulator implementing the social based protocol Bubble Rap.
2.5.1.1 Energy consumption model
In ONE, each node is modeled with a battery characterized by a limited energy budget. Energy is subtracted from the budget every time a node transmits a packet or scans the area looking for other nodes. If a node has not enough energy level is not allowed to perform scanning or forwarding.
For our simulations we consider each node as a smartphone with a 1200 mAh battery, using Bluetooth to connect to the other nodes and the en-ergy consumption for Bluetooth as derived in [4]. In this last work, authors measured energy depletion for a Nokia N95 smartphone (loss per second con-sidering scanning and energy consumption per send), using the Nokia Energy Profiler v1.2.
2.5.1.2 Mobility model
For this performance evaluation considering energy consumption, we choose a more realistic mobility model: the Working Day Movement (WDM) [22] with the Helsinki Map available in ONE. Although the Random Waypoint mobility model is popular to use in evaluations of mobile ad hoc protocols, real users are not likely to move around randomly. If a node has visited a location several times before, it is likely that it will visit that location again. WDM model increases the reality of human node mobility by modeling some of the major activities performed by humans during a working week: working at the office, going out with friends in the evening and sleeping at home. Nodes can also move alone or in groups by walking, driving or riding a bus. In [22], it has been shown that the inter-contact time and contact time distributions generated by the WDM model follow closely the ones found in real-world traces. 2.5.1.3 Parameter settings
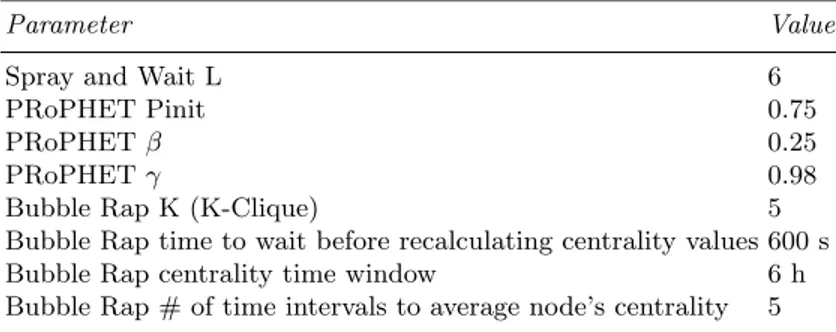
The main parameters used in our simulations are showed in Table 4.1. ble 4.2 lists the parameters for the Working Day Movement model. In Ta-ble 2.3 , the parameters for the routing protocols are specified. In particular, we choose for PRoPHET the values suggested in [46], while for Bubble Rap we use K-Clique as community detection algorithm and CWindow as centrality algorithm [36]. As in [22], the Helsinki map is divided into 4 main districts,
with 3 additional overlapping districts simulating movements between the city center and the other districts, and one district covering the whole map. This last district has 4 buses, while the other districts have 2 buses. Moreover, each district has 10 offices (100 m x 100 m) and 4 meeting spots, and nodes are randomly distributed over these districts.
Table 2.1. Main Parameter Settings
Parameter Value Simulation area 7800 m x 8500 m Transmission range 10 m Message size [5k,15k] Transmit speed 250 kBps Bu↵er size 20 MB Simulation time 43200 s
Table 2.2. WDM Parameter Settings
Parameter Value
Pedestrian speed [0.5, 1.5] m/s Pedestrian pause time [0, 120] s
Car speed [2.7, 13.9] m/s
Car pause time [0, 120] s
Bus speed [7, 10] m/s
Bus pause time [10, 130] s Working day length 28800 s Pause time inside office [10, 10000] s
Table 2.3. Routing Protocols Parameter Settings
Parameter Value
Spray and Wait L 6
PRoPHET Pinit 0.75
PRoPHET 0.25
PRoPHET 0.98
Bubble Rap K (K-Clique) 5
Bubble Rap time to wait before recalculating centrality values 600 s
Bubble Rap centrality time window 6 h
2.5 Impact of energy consumption on routing performance 29
2.5.2 Performance comparison and results
The focus of this analysis is to study the routing performance of Epidemic, Spray and Wait, PRoPHET, MaxProp and Bubble Rap protocols when en-ergy consumption is taken into account. Our performance comparison starts with the overhead cost as a function of the number of nodes. This metric is calculated as the number of packets transmitted across the air divided by the number of unique packets created. When a node transmits a packet, its available energy is decremented. Consequently we believe that determining the ratio of the packets transmitted across the air to the number of unique packets created is important. Fig. 2.16 indicates that MaxProp protocol has the lowest overhead cost. Epidemic routing, Spray and Wait and PRoPHET behave very similarly, showing higher overhead costs than MaxProp. Even if MaxProp is flooding-based in nature, it orders packets by destination costs and it is able to transmit and drop packets in that order. Moreover, it allows the use of acknowledgements after a successful reception in order to instruct the other nodes to delete extra copies of the packet from their bu↵ers. PRoPHET, which is forwarding-based in nature, do not blindly forward packets to every encounter and has an overhead cost slightly lower than the flooding-based Epidemic routing and Spray and Wait protocols. It is interesting to note that the social-based routing protocol Bubble Rap shows the highest overhead cost but comparable to flooding-based schemes. In this case, the higher number of packets transmitted across the air is due to the community structures and contact opportunities of the particular simulation scenario we considered.
!
0 10 20 30 40 50 60 25 50 75 100 125 150 175 200 Ov er hea d C os t Number of Nodes Epidemic Spray&Wait MaxProp PROPHET Bubble-RapFig. 2.16. Overhead cost as a function of the number of nodes.
The delivery ratio as a function of the number of nodes is showed in Fig. 2.17. This metric is calculated as the number of delivered packets di-vided by the number of unique packets created. The results of our simulations show the close relationship between the overhead cost and this performance metric. In the scenario with 25 nodes, the delivery cost is quite similar for
all the protocols and is about 0.45. As the number of nodes increases, Bub-ble Rap shows the highest delivery ratio, while Epidemic routing, Spray and Wait, and PRoPHET have a lower and similar delivery ratio. As expected, MaxProp performs the worst, showing the lowest delivery ratio.
!
0.1 0.15 0.2 0.25 0.3 0.35 0.4 0.45 0.5 25 50 75 100 125 150 175 200 Deliv er y R atio Number of Nodes Epidemic Spray&Wait MaxProp PROPHET Bubble-RapFig. 2.17. Delivery ratio as a function of the number of nodes.
In Fig. 2.18, the average latency (the average time it takes a packet to be delivered) as a function of the number of nodes is presented. This metric mea-sures the time it takes a message to be delivered. Even though applications using these protocols are relatively delay tolerant, it is still of interest to con-sider this performance metric when energy consumption is taken into account. Our results highlight that Bubble Rap is characterized by the highest average latency, while the other protocols show a similar and lower delay. These re-sults confirm that in opportunistic networks is very difficult to achieve both high delivery ratio and low delivery latency considering energy consumption. Based on the above, we assert that the choice of a routing protocol for oppor-tunistic network has to be based on the desired performance outcome, taking into account system constraints.
Figs. 2.19, 2.20, and 2.21 show the CDF of hop counts for 25, 50 and 100 nodes, respectively. We compute the hop count distribution for the deliv-eries in order to show the hop distance between sources and destinations. In Fig. 2.19, Epidemic routing delivers the better performance with 30% of hop counts within less than 2 hops. It also reveals that Bubble Rap delivers the worst performance with 26% of hop counts within less than 2 hops. The other protocols perform very similarly and better than Bubble Rap. As the number of nodes increases, all the protocols give similar results and perform worse than the scenario with 25 nodes. Figs. 2.20 and 2.21illustrate that there are 26% and 19% of packets delivered within 2 hops, respectively.
Fig. 2.22 exhibits the average energy consumption as a function of the number of nodes. This metric is calculated as the average percentage of the