UNIVERSITÀ DEGLI STUDI DI MESSINA
Dottorato di Ricerca in Fisica
“Earthquake kinematics and seismogenic stress
fields in the Calabrian Arc region”
Tesi di Dottorato di:
Silvia Scolaro
Tutor:
Prof.ssa Barbara Orecchio
III
ABSTRACT
L’obiettivo di questa tesi è contribuire al miglioramento delle conoscenze sismotettoniche e geodinamiche relative all’area dell’Arco Calabro, fornendo stime accurate dei meccanismi focali e dei campi di sforzo sismogenetico e proponendo nuovi approcci per lo studio dei terremoti storici.
L’Arco Calabro è uno dei settori a più alto rischio sismico in Italia, colpito nei secoli scorsi da numerosi terremoti distruttivi. Inoltre, l’alta eterogeneità cinematica che lo caratterizza, dovuta alla coesistenza di diversi domini tettonici, lo raffigura come uno dei domini geodinamicamente più complessi del Mediterraneo, oggetto di vari dibattiti nella letteratura scientifica recente.
In questa tesi viene utilizzata la tecnica di inversione CAP per il calcolo dei meccanismi focali dei terremoti dell’Arco Calabro. La qualità delle soluzioni ottenute con questo metodo, anche per terremoti di
magnitudo relativamente bassa (2.5≤Mw≤3.5), è stata dimostrata tramite
vari test di stabilità appositamente costruiti che hanno anche permesso di stimare errori dei parametri focali minori di 10°. L’applicazione di questa tecnica ha consentito la realizzazione del database, ad oggi più aggiornato, dei meccanismi focali dei terremoti dell’Arco Calabro espandendolo in un range di magnitudo non incluso nei cataloghi ufficiali. Il nuovo database, composto da più di 400 meccanismi focali, ha fornito un quadro della cinematica dei diversi settori dell’area in studio ed è stato fondamentale per il calcolo dei campi di sforzo sismogenetico effettuato tramite la tecnica di Arnold e Townend (2007). I risultati ottenuti hanno permesso di ben vincolare il dominio estensionale lungo la catena e quello compressivo nel Tirreno meridionale. Inoltre, è stato caratterizzato per la prima volta un dominio trascorrente nel settore del Mar Ionio.
A fronte di una sismicità storica energeticamente significativa lo studio della sismicità recente dell’Arco Calabro evidenzia l’assenza di
IV
terremoti di particolare rilevanza energetica (M>5), in grado di fornire informazioni più dirette sui processi tettonici a scala regionale. I recenti sviluppi dei metodi di localizzazione e di inversione delle forme d’onda e le nuove tecniche di processamento delle registrazione analogiche forniscono l’opportunità di analizzare gli eventi del passato e di recuperare, quindi, un patrimonio di informazioni particolarmente significativo. A tal proposito è stato analizzato il terremoto avvenuto in
Calabria l’8 Settembre 1905 (Mw≥7), identificato da alcuni autori come il
più forte terremoto italiano. La rilocalizzazione tramite la tecnica Bayloc ha consentito di ottenere per la prima volta una stima ipocentrale dell’evento, collocandolo nella zona off-shore della Calabria ad una profondità compresa tra 35-55 km. Tale risultato e l’attenta valutazione delle informazioni da letteratura suggeriscono che il terremoto sia avvenuto nella zona di flessione dello slab ionico in subduzione e che la sua magnitudo sia dell'ordine di 7.5. Tale risultato permette, inoltre, di fare nuove valutazioni sulla possibile relazione causale fra il terremoto del 1905 e quello verificatosi nello Stretto di Messina nel 1908.
Un differente approccio è stato applicato per analizzare il
terremoto di Ferruzzano dell’ 11 Marzo 1978, il più recente evento Mw>5
dell’area di studio, verificatosi prima dell’avvento della rete sismica digitale e per il quale la letteratura propone soluzioni focali e localizzazioni alquanto discordanti tra loro. Lo studio qui riportato mostra i risultati di una complessa modellazione dei sismogrammi analogici raccolti, la rilocalizzazione e l’analisi tramite inversione delle forme d’onda per il calcolo del meccanismo focale e del momento sismico. La soluzione ottenuta indica una profondità focale di 8 km ed un orientamento circa N-S per il piano di faglia normale, in buon accordo con il regime estensionale riconosciuto in Calabria meridionale
da dati sismologici, geodetici e geologici. La magnitudo stimata, Mw=4.7,
denota una sovrastima delle precedenti analisi dimostrando la capacità dell’algoritmo di inversione di analizzare terremoti del passato anche di magnitudo medio-bassa.
CONTENTS
ABSTRACT ... III
CONTENTS ... 1
INTRODUCTION ... 4
CHAPTER 1 ... 9
GEODYNAMIC AND SEISMOTECTONIC FRAMEWORK OF THE CALABRIAN ARC REGION ... 9
1.1 Geodynamic setting ... 9
1.2 Historical and recent seismicity ... 13
CHAPTER 2 ... 17
ESTIMATING STABILITY AND RESOLUTION OF WAVEFORM INVERSION FOCAL MECHANISMS... 17
2.1 Introduction ... 17
2.2 Data and method... 19
2.3 Stability tests and resolution estimates ... 20
2.4 Results and Discussion... 23
2.5 Concluding remarks ... 30
CHAPTER 3 ... 32
SEISMOGENIC STRESS FIELD ESTIMATION IN THE CALABRIAN ARC REGION FROM A BAYESIAN APPROACH ... 32
3.1 Introduction ... 32
3.2 Data and Methods... 33
3.3 Discussion of Results ... 36
CHAPTER 4 ... 61
THE 1905 CALABRIA, SOUTHERN ITALY, EARTHQUAKE: HYPOCENTER LOCATION, CAUSATIVE PROCESS, AND STRESS CHANGES INDUCED IN THE AREA OF THE 1908 MESSINA STRAITS EARTHQUAKE ... 61
4.1 Introduction ... 61
4.2 Earthquake Locations: Analysis of Data and Results ... 65
4.3 Discussion ... 69
4.4 Conclusion ... 76
CHAPTER 5 ... 79
MOMENT TENSOR INVERSION OF THE 1978 FERRUZZANO EARTHQUAKE (SOUTHERN CALABRIA) ... 79
5.1 Introduction ... 79
5.2 Seismotectonic framework ... 80
5.3 The Ferruzzano earthquake: previous knowledge ... 83
5.4 Non-linear hypocenter location ... 85
5.5 Moment tensor inversion of digitized seismograms ... 89
5.5.1 Data collection... 89
5.5.2 Waveform inversion ... 93
5.6 Results and discussion ... 97
5.7 Conclusions ... 99
CONCLUSIONS ... 101
REFERENCES ... 106
4
INTRODUCTION
The present PhD thesis was carried out in the framework of research activity of the geophysical team of the Mathematical and Computer Sciences, Physical Sciences and Earth Sciences Department of the University of Messina, and it was developed thanks to the close cooperation with teams of University of Granada, Cartographic and Geological Institute of Catalonia, University of Malta and Istituto Nazionale di Geofisica e Vulcanologia.
The results of my work have been published on international journals and were also discussed in the framework of national and international congresses.
The main aim of this thesis is to improve the knowledge of the seismotectonics of the Calabrian Arc region (South Italy) through a more accurate investigation of earthquake focal mechanisms and seismogenic stress fields. In particular new approaches for the inversion of seismogenic stress fields and for the study of individual historical earthquakes have been carried out.
The Calabrian Arc, (Chapter 1), is one of the more interesting area of the central Mediterranean because of a complex geodynamic scenario due to the coexistence of Africa-Eurasia plate convergence and rollback of the Ionian subduction slab. In historical times a relevant number of destructive earthquakes (up to 7-7.5 magnitude and XI–XII MCS intensities) occurred in the Calabrian Arc region, for example in 1638, 1783, 1905, 1908 (Rovida et al., 2016). Furthermore, the 1905 Calabria earthquake and the 1908 Messina Straits earthquake are among the largest events occurred in Italy. These events provoked thousands casualties, the destruction of many towns and cities in northeastern Sicily and Calabria, and also triggered environmental effects (Baratta, 1910). Despite the large amount of geological and geophysical studies
5
carried out in this area, the seismotectonic scenario is still argued, in particular concerning the actual setting of the rollback process of the Ionian subducting slab, the fault geometry of the strongest earthquakes and the relationship between large-scale geodynamics and more localized seismogenic processes (Neri et al., 2004; Galli et al., 2008; Billi et al., 2010; Palano, 2015; Presti et al., 2017; Tiberti et al., 2017).
In this framework earthquake focal mechanisms are a very powerful tool for studing the interactions among earthquakes, seismic faults and active tectonics. Focal mechanisms are geometrical representations of the faulting during an earthquake then, they provide essential information on local tectonic styles and they are prerequisite to compute the seismogenic stress fields of a region. The inversion of earthquake waveforms is a widely used approach, based on wave-field modeling, to extract quantitative information from seismograms and to estimate focal mechanism solutions. However, the reliability of focal mechanisms may decrease for low magnitude earthquakes (M<4) and their analysis is limited to the temporal range of earthquake instrumental recording. It follows that continuous processing and improvements of earthquake focal mechanisms are necessary to increase their reliability and to expand the temporal and magnitude range of focal mechanism databases.
In this thesis, the “Cut and Paste” (CAP) waveform inversion method of Zhao and Helmberger (1994) and Zhu and Helmberger (1996) has been used to estimate the focal mechanisms, moment magnitude and depths of the earthquakes of the Calabrian Arc region (Chapter 2). For its features this technique can be considered as a step forward on source parameters determination allowing to obtain reliable and high-quality focal mechanism solutions also for relatively low-magnitude earthquakes (down to a minimum of 2.6), usually not reported in the official catalogues (see e.g. CMT, RCMT, TDMT). In Chapter 2 new resolution and stability tests are shown with the aim to properly verify robustness and reliability of the focal mechanism parameters estimated for the study region by the CAP method. The obtained results reveal
6
that focal mechanism solutions are robustly determined also in very unfavourable conditions, then they respesent useful high-quality constraints for the analysis of the regional stress fields acting in southern Italy.
As shown in Chapter 3, thanks to the application of the CAP method the number of available solutions for the Calabrian Arc region is more than doubled by adding earthquakes of magnitude as small as 2.6 without overlooking the reability of results. The resulting focal mechanism database furnishes previous lacking data and basic information for investigating the actual dynamics of southern Italy by the computation of seismogenic stress. Taking benefit from the enhanced focal mechanism set, the seismogenic stress tensor variations over the study region have been investigated by a Bayesian technique (Arnold and Townend, 2007) deployed for estimating tectonic stress parameters from primary seismological observations. The stress distributions allowed to identify the subvolumes characterized by homogeneous behaviors, thus providing a detail picture of the main regional engines acting in this very complex area.
The focal mechanisms of relatively small earthquakes (Mw>2.6)
have then furnished an important contribution for characterizing local tectonics and constraining stress orientation; moreover,
moderate-to-major earthquakes (e.g., Mw≥5) may also provide a more direct evidence
of regional-scale processes and main structural systems. Especially in a complex area as Calabrian Arc, the study of these events is crucial to fix new constraints in order to better characterize regional seismotectonics and seismic hazard. A quite small number of moderate-to-major earthquakes occurred in the Calabrian Arc region in the last ca. thirty
years while numerous Mw≥5 earthquakes were recorded in the early
phases of instrumental monitoring (e.g. 1900-1980; Rovida et al., 2016) and this makes very precious every effort aimed to accurately investigate past earthquakes. In the last years many authors have proven the effectiveness to analyze original seismograms by means of modern techniques to obtain quantitative information (e.g. Okal and
7
Reymond, 2003; Pino et al., 2008; Batlló et al., 2010; Vannoli et al., 2016; Stich et al., 2018). The efforts to recover and analyze past earthquakes through modern seismological techniques, main goal of Chapters 4 and 5 of the present thesis, allow obtaining information actually not available from the recent seismicity of southern Italy.
Chapter 4 is focused on the study of the September 1905 earthquake that several investigators identified as the strongest earthquake ever occurred in Italy, and for which quite different views exist concerning location, magnitude, and the causative process. The Bayloc location method proposed by Presti et al. (2004, 2008) has been used to estimate hypocenter location of the event. Bayloc is a Bayesian non-linear algorithm that estimates a probability density function for the location of a seismic event by using body wave arrival times. This method furnishes more accurate estimates of hypocenter parameters and location uncertainties with respect to the more commonly used linearized techniques. For this study, Bayloc has been applied to the original seismic wave arrival times recorded at the seismic observatories existing at that epoch. Despite the limitations of the seismometric network existing at the beginning of the past century, the hypocenter location obtained for the 1905 earthquake have suitable quality to investigate the process that generated the earthquake itself. Then, the obtained results allowed to examine possible generation process of the event and to estimate the stress perturbation that it may have induced in the area of the forthcoming 1908 Messina Straits earthquake. In particular, the study highlights that gravity pull of the Ionian subducting slab may have determined the 1905 earthquake rupture in the bending zone of the slab and this rupture has likely perturbed the shallow normal faults of the Tyrrhenian overriding plate in the Messina Straits area favoring the occurrence of the other major earthquake three years later.
The approach proposed in Chapter 5 is based on instrumental data recovering and on analysis and modelling of original recorded
8
Calabrian, that is the 11 March 1978 Ferruzzano earthquake. The information available from literature for this event is quite contrasting and not well framed in the local seismotectonic scenario. A relevant work of data collection through the SISMOS (Michelini et al., 2005) and EuroSismos (Ferrari and Pino, 2003) archives has been carried out and a careful processing of the seismograms was needed for successful vectorialization. Thanks to the quality of the obtained data it was possible to re-analyze this event by applying the Bayloc technique and a modern-standard time-domain algorithm to determine hypocentral location, focal mechanism and seismic moment of the event. The time-domain waveform inversion analysis of Stich et al., (2005) has been applied for the first time in Italy. This technique allows a more stable waveform modeling of original analog data by directly processing the original un-rotated horizontal component seismograms and by applying the convolution of the corresponding instrument response to the synthetic Green’s Functions. This procedure reduces errors due to the uncertainties of estimated transfer functions, to the misalignment of time signals from component to component, uneven drum speed and wrong polarities. In order to prove feasibility and effectiveness of both the inversion procedure and the results obtained in this study several tests have been performed. Thanks to the application of these advanced modern techniques it has been possible to re-evaluate the 1978 Ferruzzano earthquake furnishing a new hypocenter location and focal mechanism better framed in the local seismotectonic scenario, and a new moment magnitude estimate.
9
CHAPTER 1
GEODYNAMIC AND SEISMOTECTONIC FRAMEWORK OF
THE CALABRIAN ARC REGION
1.1 Geodynamic setting
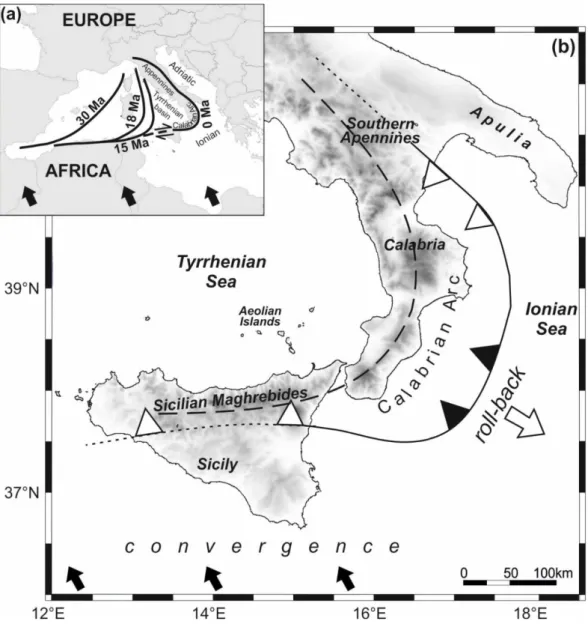
The Calabrian Arc (South Italy) is a Cenozoic-Quaternary curved orogenic belt shaped during the opening of the Tyrrhenian Sea, and running from the NW–SE-trending Southern Apennines to the E–W-trending Sicilian Maghrebides (Fig. 1.1. Malinverno and Ryan, 1986; Carminati et al., 1998; Wortel and Spakman, 2000; Rosenbaum and Lister, 2004; Billi et al., 2011; Faccenna et al., 2011). The geodynamic evolution in this area of the Central Mediterranean is the result of different and very complex geodynamic processes driven in the last 30-35 Ma by the NW-trending Nubia-Eurasia convergence and the residual southeastward rollback of the Ionian slab beneath the Tyrrhenian lithosphere (Fig. 1.1; Malinverno and Ryan, 1986; Catalano et al., 1996; Gueguen et al., 1998; Faccenna et al., 2001, 2004; Rosenbaum and Lister, 2004; Billi et al., 2011). Current plate convergence velocity in this region has been estimated to be on the order of ~5 mm/yr (Palano et al., 2012; Nocquet, 2012 and references therein) while subduction trench retreat has been progressively decreasing in the last million years until reaching at present time values as small as 2 mm/yr (Hollenstein et al., 2003; Devoti et al., 2008; D’Agostino et al., 2011; Palano et al., 2012).
The complex geodynamic scenario of the Calabrian Arc is also reflected in the different deformation patterns of the whole region (Fig. 1.2). Geological, seismological and geodetic observations highlight a
10
Figure 1.1 (a) Map of the Mediterranean region with the western
Mediterranean plate boundary evolution in the last 30 Myrs (redrawn from Wortel and Spakman, 2000). The space-time evolution of the boundary marks the process of rollback of the subducting lithosphere and the related trench retreat until the present-day location near the Ionian shoreline of Calabria. Black arrows indicate the present motion of Africa relative to Europe (Nocquet, 2012; Nocquet and Calais, 2004). (b) Map view of the study area. The solid curve with the sawtooth pattern, pointing in the direction of subduction, indicates the present-day location of the Ionian subducting system. According to recent literature (see, among others, Neri et al. 2009, 2012 and Orecchio et al., 2014), black sawteeth indicate the continuous subducting slab while white sawteeth the plate boundary segments where slab has already undergone detachment. The white arrow shows the sense of the subducting slab rollback. The black arrows indicate the present motion of Africa relative to Europe (Nocquet, 2012 and references therein). The large dashed curve running from Southern Apennines to Sicilian Maghrebides through Calabria indicates the Apennine-Maghrebian chain.
11
Figure 1.2 Simplified tectonic map of the study area and surrounding areas
(redrawn by Palano et al., 2015).
crustal shortening accommodated in southern Tyrrhenian and an extensional deformation in northern Sicily and southern Calabria, perpendicular to the direction of the Calabrian Arc (Neri et al., 2004, 2005; Pondrelli et al., 2006; Serpelloni et al., 2010; Presti et al., 2013; Totaro et al., 2016). The compressional domain, in agreement with NW-SE Africa-Eurasia plates convergence, reveals a broadly E-W trending thrust belt parallel to the north Sicily coast while the extensional one, in northeastern Sicily and southern Calabria, is controlled by southeastward rollback of the Ionian subducting slab (Figure 1.2; Neri et al., 2004, 2012; Palano et al., 2012, 2015; Orecchio et al., 2014,
12
2017). The transition between these main seismotectonic domains seems to be mainly accommodated along a heterogeneous fault system running from the Aeolian Islands to the Ionian Sea (Figure 1.2; Neri et al., 2005; Argnani, 2009; Polonia et al., 2011; Gallais et al., 2013; Palano et al., 2015).
According to the regional geodynamic models the rollback of the Ionian lithospheric slab has been identified as the primary tectonic source for the (i) southern Tyrrhenian basin opening, the (ii) SE-ward kinematics of the southern Tyrrhenian unit and (iii) its thinning and over thrusting onto the Ionian lithosphere (e.g. Malinverno and Ryan 1986; Barberi et al., 2004; Faccenna et al., 2004; Pepe et al., 2005; Billi et al., 2011). The question on whether and eventually where the subduction slab is still continuous in depth or already detached beneath the Calabrian Arc is subject of debate in literature (Spakman and Wortel, 2004; Guarnieri, 2006; Pontevivo and Panza, 2006; Chiarabba et al., 2008; Monna and Dahm, 2009; Neri et al., 2009, 2012). The most recent analyses of different geophysical data (gravity anomalies, seismotomographic structure, and seismicity of crust and uppermost mantle) argue that the Ionian subducting slab is still in-depth continuous beneath the central part of the Calabrian Arc corresponding approximately to southern Calabria, while detachment of the deepest portion of descending lithospheric body has already occurred with tear processes propagating from the edges of the Arc itself (i.e. northern Calabria and northeastern Sicily) to the center (Neri et al., 2009, 2012; Orecchio et al., 2011, 2014). This scenario identify the Messina Straits and the Sila Massif as transitional areas from continuous to detached subduction mode along the Arc (Neri et al., 2012). Moreover, several analyses of the GPS velocity fields seem to indicate a very slow residual trench retreat compatible with the ongoing subduction process (e.g. Hollenstein et al., 2003; Devoti et al., 2008; D’Agostino et al., 2011; Palano et al., 2012). In this framework subduction activity is now close to end but the very slow trench retreat is considered however still capable of causing strong normal faulting
13
earthquakes especially in southern Calabria region (Argnani, 2000; D’Agostino et al., 2011; Neri et al., 2009, 2012; Orecchio et al., 2014).
In this framework the earthquake kinematics and dynamics may help to better understand the geodynamic engines acting in different domains of the Calabrian Arc region. In particular, earthquake focal mechanisms are key-element to properly estimate the stress tensor variations and to study the deformation zones and related boundaries. This seismological contribution is particularly useful in region like the Calabrian Arc characterized by wide offshore area and therefore lacking of GPS data usually furnishing essential information for defining the different kinematic regimes (Serpelloni et al., 2010; D’Agostino et al., 2011; Devoti et al., 2008; Billi et al., 2011; Palano et al., 2012, 2017).
1.2 Historical and recent seismicity
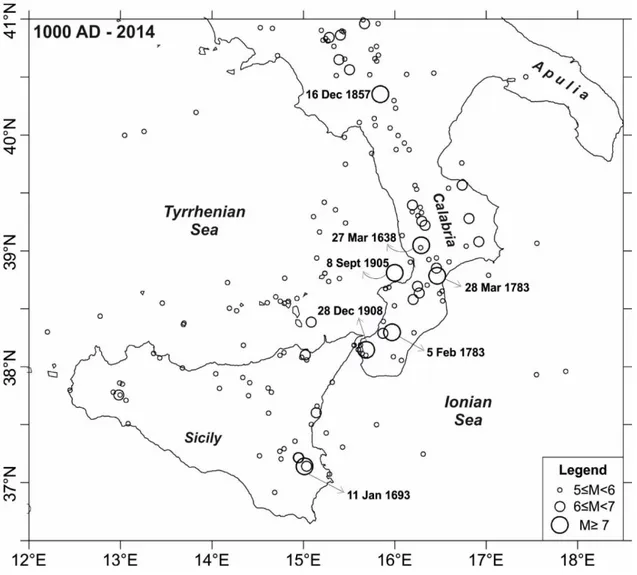
The Calabrian Arc represent one of the most seismically active regions of the entire Mediterranean area, with magnitudes of up to 7.1 and intensities of up to XI–XII MCS (Amoruso et al., 2006; Galli et al., 2008; Guidoboni et al., 2007; Monaco and Tortorici, 2000; Neri et al., 2006; Rovida et al., 2016). In the complex tectonic settings that characteryze the Calabrian Arc area the role of moderate-to-major earthquake (e.g. M≥5), directly related to the regional scale processes, can be crucial to clarify regional seismotectonics and seismic hazard of the area. To furnish an overall view of the seismotectonic settings of the Calabrian Arc we focus both on the historical and recent seismic activity. For this purpose, in Figure 1.3 are reported the moderate-to-large earthquakes (M≥5) occurred in the study region from 1000 AD to 2014 included in the Italian Parametric Earthquake Catalogue (CPTI15; Rovida et al., 2016). The epicentral distribution of the M≥5 earthquakes delineates a seismic belt which runs along the Tyrrhenian side of Calabria and, southward, along the Ionian coast of Sicily. Normal faults located along the belt are considered to be major seismogenic faults
14
believed to have generated the largest earthquakes ever occurred in
southern Italy: the June 1638 Calabrian earthquake (Mw 7.0; Galli and
Bosi, 2003); the January 1693 Sicilian earthquake (Mw 7.3; Piatanesi
and Tinti, 1998; Visini et al., 2009); the Calabrian seismic sequence of
February-March 1783 (up to Mw=7.1; Jacques et al., 2001; Tiberti et al.,
2017); the December 1857 Val D’Agri earthquake (Mw 7.0; Cello et al.,
2003; Burrato and Valensise, 2008) the September 1905 earthquake in
the Tyrrhenian shore (Mw 7.0; Riuscetti and Shick, 1975; Galli and
Molin, 2009; Presti et al., 2017), and the last catastrophic event the
December 1908 earthquake in the Messina Straits (Mw 7.1; Billi et al.,
2008; Pino et al., 2009).
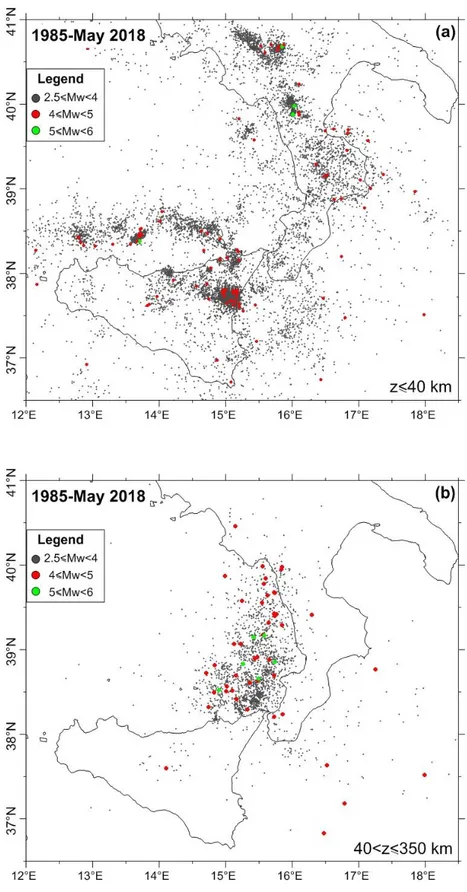
To characterize the seismicity of the study area is necessary to evaluate also the recent active tectonics. In spite of the strong historical seismicity a light to moderate seismic activity has been recorded in the Calabria Arc region with no M>5 earthquakes in the last thirty years (Figure 1.4). Figures 1.4(a) and (b) show the epicenter distribution of the M≥2.5 earthquakes occurred between January 1985 and May 2018 at different depths in the Calabrian Arc area, included in the Italian Seismological Instrumental and Parametric Data-Base (www.ingv.it). In Figure 1.4(a) a very wide diffusion of low-energy earthquakes (M<4) is evident at shallow depths (z ≤ 40 km). The crustal seismicity is mainly distributed i) along the whole Calabrian Arc, ii) in the offshore Tyrrhenian region along the northern coastal area of Sicily up to the central Aeolian archipelago, and iii) in eastern Sicily and its associated offshore area. On the contrary, the earthquakes in the higher magnitude ranges are few and sparse. Deep and intermediate-depth seismicity (40 < z ≤ 350), shown in Figure 1.4(b), is mainly concentrated in the Tyrrhenian side of the Calabrian Arc, delineating a well-defined Benioff zone (Selvaggi and Chiarabba, 1995), and more diffused in the Ionian Sea. This epicenter distribution is expression of active processes within the Ionian slab (Selvaggi and Chiarabba, 1995; Neri et al., 2009; Orecchio et al., 2014).
15
Figure 1.3 Circles show the locations of the M≥5 earthquakes that have
occurred in the investigated area after 1000 A.D. according to the CPTI15 catalogue (Rovida et al., 2016;). The symbol size is proportional to earthquake magnitude range (see legend). Labels indicate the date of occurrence of M≥7 earthqaukes.
16
Figure 1.4 The maps (a) and (b) show the epicenter locations of the
earthquakes of M≥ 2.5 occurring between 1985 January and 2018 May at different depths ‘z’ (kilometres b.s.l.) in the investigated area. Colors are for different magnitude ranges (see legend). Data are from the Italian Seismological Instrumental and Parametric Data-Base.
17
CHAPTER 2
ESTIMATING STABILITY AND RESOLUTION OF
WAVEFORM INVERSION FOCAL MECHANISMS
2.1 Introduction
In this chapter several tools for testing the stability and resolution of waveform inversion focal mechanisms of crustal earthquakes occurred in the Calabrian Arc region (Figure 1.1) are described. It is well known that focal mechanism quality can decrease for low magnitude earthquakes and that, on overall, several factors can influence the results of seismic waveform inversion, for example seismic network coverage, earth model uncertainties and inaccurate earthquake location (Valentine and Trampert, 2012; Brandmayr et al., 2013; Chen et al., 2013; Silwal and Tape, 2016).
The methods traditionally used to compute focal mechanism solutions are based on the polarity of P-wave first motion. First-motion focal solutions reflect only the initial stages of faulting and strongly suffer from both uncertainty on velocity models used to reconstruct the wave path and inadequate azimuthal coverage of seismic networks (Lay and Wallace, 1995; Pondrelli et al., 2006; Scognamiglio et al., 2009; D'Amico et al., 2010; Presti et al, 2013). Moreover, errors in first-motion observations may occur because of station polarity reversals or incorrect direct P-arrival picks due to low signal-to-noise ratio. Much more powerful methods capable to furnish more stable and reliable focal mechanisms with respect to the traditional techniques are those based on waveform inversion. On this regards, the most relevant catalogues furnishing waveform inversion solutions for the Italian
18
region are Harvard Centroid Moment Tensor, Regional Centroid Moment Tensor and Time Domain Moment Tensor. The Harvard Centroid Moment Tensor (CMT, hereafter) is one of the most popular methodologies for calculating moderate to strong earthquake focal mechanisms and ideally suited to study global seismicity (Dziewonski et al., 1981; Ekström et al., 2012). It provides robust and reliable seismic source mechanisms through the inversion of long period (T > 45 s) body-waves and very-long period (T > 125 s) surface waves recorded at the global scale and, starting from 2003, even teleseismic surface waves with period 50-150 s (Hjörleifsdóttir and Ekström, 2010; Ekström et al., 2012). The CMT catalog includes focal mechanism parameters of
worldwide earthquakes with Mw>4.5 occurred since 1976. The Regional
Centroid Moment Tensor (RCMT, hereafter) procedure is instead based on the inversion of intermediate and long period surface waves recorded at regional and teleseismic distances (Pondrelli et al., 2002, 2004, 2006, 2007, 2011). The RCMT catalog collects focal mechanisms for earthquakes with magnitude approximately between 4.5 and 5.5 occurred in the Euro-Mediterranean region since 1997 and not well studied at global scale. The Time Domain Moment Tensor (TDMT, hereafter) algorithm performs long-period full waveform inversion for
local and regional events with magnitude Mw≥3.5 using broadband
recordings (T=40 s) from the seismic network of Istituto Nazionale di
Geofisica e Vulcanologia since 2006 (Dreger and Helmberger, 1993;
Dreger, 2003; Scognamiglio et al., 2009).
During the last years, the research team of University of Messina made continuous processing and improvements on Calabrian Arc earthquake focal mechanisms in order to increase their reliability and to expand the temporal and magnitude range of focal mechanism database. Several studies have proven the capability of the “Cut and Paste” waveform inversion method (CAP hereafter; Zhao and Helmberger, 1994; Zhu and Helmberger, 1996) to furnish reliable and high-quality focal mechanism solutions also for relatively low-magnitude earthquakes (down to a minimum of ca. 2.6) not reported in
19
the national catalogues and often not well resolved by using P-wave first motions (Neri et al., 2003, 2004, 2005; D’Amico et al., 2010, 2011; Orecchio et al., 2015; Presti et al., 2013; Totaro et al., 2013, 2015, 2016). Because of their frequent occurrence, these small earthquakes are particularly important for characterizing local tectonics and constraining stress orientations, especially in the Calabrian Arc region characterized by high heterogeneity in terms of seismotectonics and kinematics.
2.2 Data and method
Since it is widely accepted that waveform inversion focal solutions are much better constrained than P onset polarity ones (see, among others, Pondrelli et al., 2006; Scognamiglio et al., 2009; Presti et al., 2013), we are going to use only waveform inversion solutions in order to build a new focal mechanism database of the Calabrian Arc region (which will be shown in the next chapter of this thesis). In addition to the solutions reported by the official national and international catalogues we will include in the new database focal mechanisms estimated by the CAP method. The CAP algorithm has been applied to
earthquakes of magnitude Mw≥2.6 that originated at depths shallower
than 40 km in the study region between January 2006 and October 2015.
We carried out several analyses on CAP focal mechanisms aiming to evaluate stability and resolution of the used algorithm. In addition, we also performed different tests in order to estimate error on focal mechanism parameters.
In the CAP method (Zhao and Helmberger 1994; Zhu and
Helmberger 1996) each waveform is broken up into Pnl (Pn waves
followed by train of crust-trapped reflected/converted P-SV) and surface wave segments, which are weighted differently during the inversion procedure. Besides, each segment of synthetic seismogram is allowed to
20
be time-shifted to better match the observed seismogram and a misfit error between observed and synthetic data is define. The use of different portions of the waveform increases the stability of the final solution since different phases are sensitive to different parts of crustal structure and have different amplitude decay with distances. The surface waves, although large in amplitudes, are easily influenced by shallow crustal
heterogeneities whereas Pnl waves are controlled by the averaged crustal
velocity structure and are therefore more stable.
For the data inversion procedure, waveforms are converted in ground velocity and preferred to ground displacement in order to avoid the influence of long-period noise embedded in ground displacements. Furthermore, working with ground velocity rather than ground displacement reduces the influence of a low frequency site or instrument noise on the deconvolution. The same frequency bands have been used to filter synthetic and observed ground velocities, in detail
0.02–0.1 Hz for surface waves and 0.05–0.3 Hz for Pnl waves. All these
features make the CAP method effective for earthquakes over a wide range of magnitudes (down to a minimum of 2.6; D'Amico et al., 2010, 2011; Zhu et al., 2006) as also proven by several tests and comparisons (Zhao and Helmberger, 1994; Tan et al., 2006; D'Amico et al., 2010, 2011; Totaro et al., 2016).
2.3 Stability tests and resolution estimates
The use of the CAP method in the Calabrian Arc region has allowed to estimate focal mechanism solutions also for low magnitude events (down to a minimum of 2.6) and therefore to significantly increase the number of focal mechanisms based on waveform inversion method. A relevant increase of focal mechanism solutions has important implications for better constraining local stress conditions and geodynamic interpretations in the study area (Totaro et al., 2016
21
and references therein). Hence it is necessary to carefully check quality and stability of waveform inversion solutions estimated by CAP method. Starting from these considerations and by also taking into account concerned literature information (see e.g., D'Amico et al., 2010, 2011; Presti et al., 2013; Orecchio et al., 2014) several resolution and stability tests have been performed to properly verify the robustness of CAP results.
In this chapter are reported the tests performed on a subset of 5 earthquakes chosen as representative of different network condition, magnitude value, location area and focal depth. For each earthquake we observed how the moment tensor varies as function of focal depth in order to evaluate its stability around the global misfit minimum. The depth increment in the grid search is 5 km and for each depth we report the best-fit solution obtained by searching over the full space of orientations and magnitudes and the relative misfit value. Then, we repeated the inversion procedure by considering different seismic network distributions. Seismic network geometry is fundamental in the earthquake analysis. In particular, in our study region the network configuration is often limited by the presence of wide off-shore sectors and the substantial lack of OBS (Ocean Bottom Seismometer) data. This factor can reduce the quality of solutions and therefore we verify CAP results even with not-optimal azimuthal coverage and few available records by using earthquake located both on-shore and off-shore in the Calabrian Arc area. Also, we investigated the influence of epicentral errors on the waveform inversion. Non-linear earthquake locations performed in the study area using the method by Presti et al. (2004, 2008) and consequent hypocentral error evaluation indicate that the mean epicentral uncertainty is in the range of 4-6 km (Orecchio et al., 2014). Then we forced the epicenter to lie 5 km away from the true location in order to test the solution even taking into account the mean uncertainty on earthquake location.
An important role in waveform inversion procedure is also played by the seismic velocity model that is used for the calculation of Green's
22
Functions basically for the double-couple mechanism estimates. Each focal mechanism considered in this study has been computed by using a specific 1D velocity model for each target area. To take into account the lithospheric heterogeneities of the Calabrian Arc region we used the most detailed 3D velocity models available from the literature (Barberi et al., 2004; Orecchio et al., 2011; Totaro et al., 2014) to compute theoretical travel times for properly defined target area and to build from these specific 1D velocity models (D'Amico et al., 2011). Even if the time-shift allowed in the CAP algorithm can partly reduce the influence introduced by the velocity model uncertainties, we further verified the stability of the solution with respect to velocity structure by using different velocity models representative of structure heterogeneities of the study region (Figure 2.1). Generally, waveform inversion methods give a standard error for each focal mechanism parameter (e.g., strike, dip and rake) derived from linearized techniques. It provides an important and useful measure of quality of focal mechanism solution but, as shown by several authors, linearized inversion methods tend to underestimate formal errors on focal mechanism parameters (Bevington and Robinson, 2003; Tan et al., 2006). In this study a procedure aimed to assess more reliable confidence limits of estimated strike, dip and rake is presented. Following the approach described by Stich et al., (2003a), we used a grid search for error analysis in the full range of focal parameter space. For each earthquake a set of “artificial” focal mechanisms have been obtained by moving around the best-fit solution in all directions of the focal parameter space with a sampling step of 10°. Then we estimated the misfit for all artificial focal mechanisms and compared these values with the global minimum misfit of the best solution obtained by CAP. In this way it is possible to observe how the misfit value changes with respect to strike, dip and rake, respectively. This comparison can assess the confidence limits and the range of potential alternative solutions over fault plane parameters, allowing us to define the accuracy of the focal mechanism solution. According to Stich et al., (2003a), we assumed that the uncertainty region of the
23
solution includes all the artificial focal mechanisms having misfit < 10% above the global minimum. By application of this procedure to CAP moment tensor solutions we are able to estimate that our focal mechanism solutions are characterized by fault parameter errors of the order of 8°-10°.
Figure 2.1. Different velocity models used to compute the Green’s functions
for tests on the influence of possible crustal structure heterogeneities in the study area.
2.4 Results and Discussion
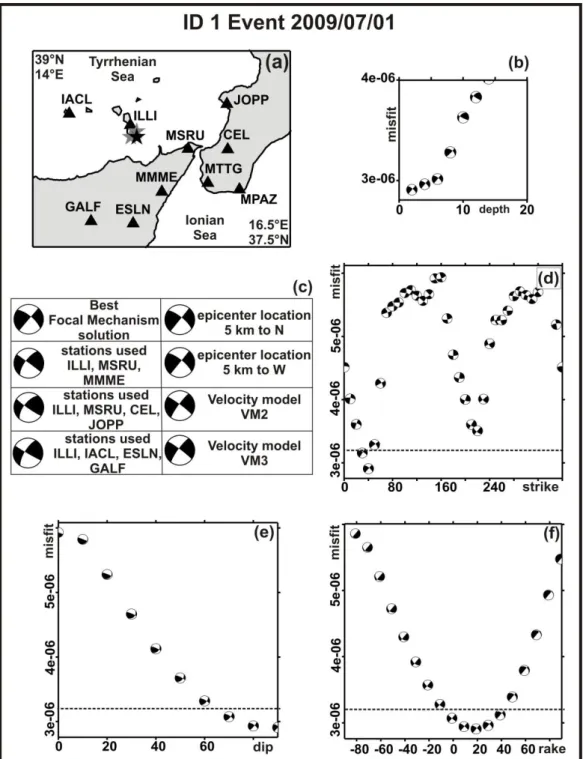
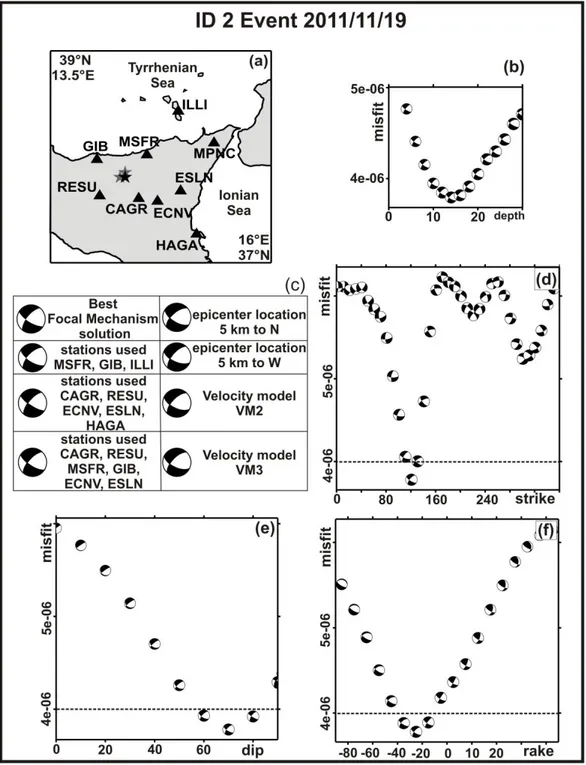
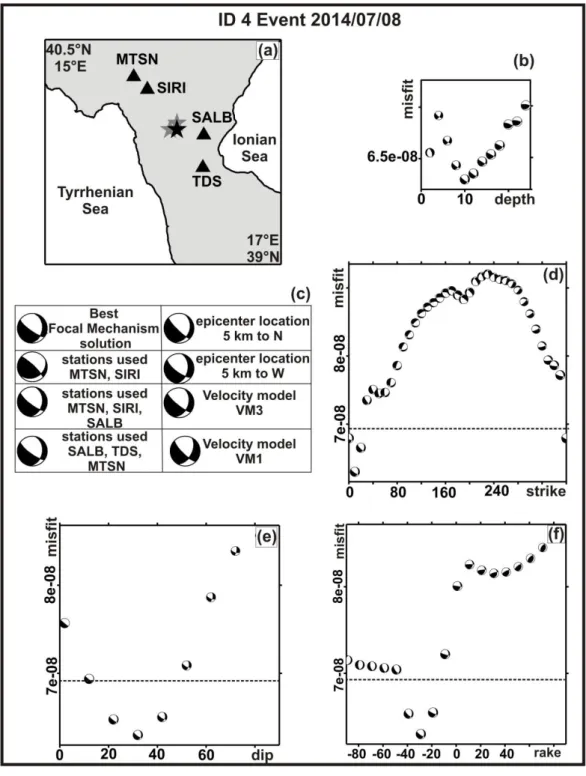
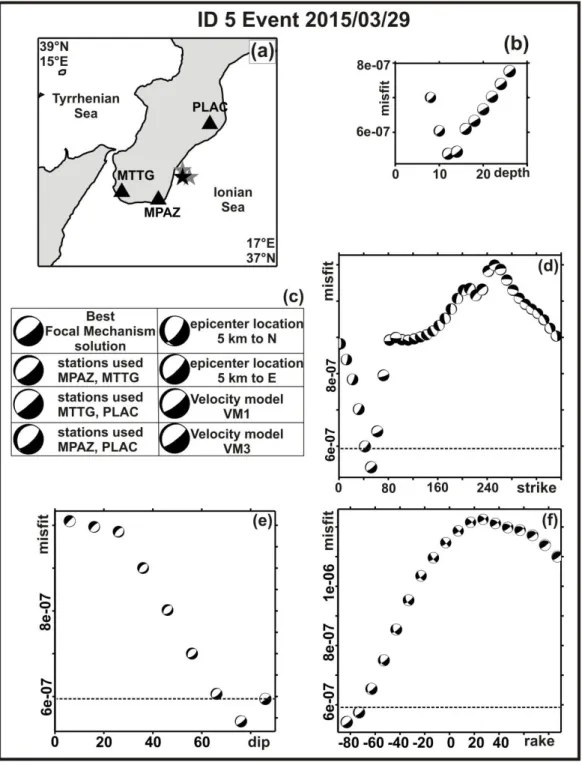
In Figure 2.2 the results of the above described tests are reported for the 5 events listed in Table 2.1 and chosen to fairly represent dataset heterogeneities. For each event the epicenter location (black star) and the recording seismic network (triangles) are shown on plots (a). The earthquakes are located both on-shore and off-shore (ID 2,4 and 1,3,5 in Figure 2.2, respectively) in the Calabrian Arc area and they are also characterized by different network coverage. We display on plots (b) thebest focal mechanism solution in the waveform misfit versus depth curve obtained by the grid search procedure. From plot (b) we can observe that, in general, the focal solution does not change significantly
24 ID event DATE yy/mm/dd TIME hh:mm:ss Lat (°) Lon (°) Depth
Km Strike Dip Rake Mw
1 20090701 17:58:54 38.34 15.01 2 40 90 19 3.1 2 20111119 10:19:16 16.00 37.81 14 121 70 -25 3.4 3 20140323 18:31:52 37.47 16.48 38 177 61 21 3.6 4 20140708 05:02:43 39.90 16.12 2 347 51 -83 2.9 5 20150329 10:48:46 38.09 16.21 12 52 76 -83 3.5
Table 2.1. Events used in this study.
near the minimum misfit value. Only for the earthquake ID 3, located in the Ionian Sea, the curve of waveform misfit is almost flat around the minimum indicating that the network coverage does not provide a tight depth constraint. As already mentioned, we assess inversion results also by using different station configurations as indicated in the left column of plots (c) of Figure 2.2 where we also report the respective best focal mechanism solution. In all cases the focal mechanisms are very similar to that obtained from the inversion with the real station network. Even in this case some differences between the focal mechanisms calculated by test and the true one are visible for earthquake ID 3 and may be probably related to the position of the epicenter with respect to the recording stations. By also taking into account these small differences, this test shows the good stability of CAP results even in case of poor station distribution or quite low magnitude. By way of example see events ID 3, ID 4, and ID 5: for these earthquakes, in fact, the seismic network configuration has an azimuthal gap as large as 180° and also the simulation in extremely bad conditions characterized by only 2 recording stations show very stable solutions. Plots (c) of Figure 2.2 also report (right side) the focal mechanisms obtained by varying of 5 km the epicenter location (grey star in plots a). It clearly appears that a mislocation compatible with the hypocenter location uncertainties does not produce significant differences between true and simulated solution, further supporting the
25
Figure 2.2. The figure shows results obtained after tests performed to verify
the stability and the error on CAP focal mechanism solutions. Plot (a): map reporting recording stations (black triangles) and epicentral location (black star) used in the waveform inversion procedure together with two biased epicentral locations used for synthetic tests (grey stars) for each event. Plot (b): misfit error as function of depth. Plot (c) reports the best focal mechanisms solution for each earthquake and the results of different tests performed by changing the recording networks (also using very unfavourable conditions), the velocity models for the study area (see Figure 2.1) and by forcing the epicenters to lie 5 km away from the “true” locations. Plots (d), (e), (f) reports the graph of RMS versus strike, dip and rake, respectively. The dashed line marks the 10 % threshold of RMS. The minimum shown in each diagram is the best solution of the event.
26
27
28
29
30
stability of our results. In the same plots we compare the solutions estimated using different 1D velocity models, VM1, VM2 and VM3 (Figure 2.1), used for computation of the focal mechanisms. Even in these examples the high stability of the mechanisms is evident. More pronounced differences affect the results of event ID 3, probably due to inaccuracy of the model VM2 and VM3 for the Ionian Sea area. Plots (d), (e) and (f) of Figure 2.2 report the misfit values versus strike, dip and rake respectively. These diagrams useful to study the uncertainties of the focal mechanism solution have been built by estimating the misfit values throughout the space of moment tensor orientations. As the uncertainly volume is defined by misfit lower than 10% respect to the best moment tensor solution all the focal mechanisms under the dashed line are acceptable solutions. Usually, relying on focal mechanisms that follow the 10% threshold we can estimate that our focal parameter errors are on average of 8°-10°, like in the examples here reported.
2.5 Concluding remarks
In order to check the method robustness, the quality and stability of CAP focal mechanism solutions have been proven by mean of several tests also for low magnitude earthquakes. We performed tests taking into account (1) recording station geometry, (2) different velocity models, (3) the misfit error as a function of depth, (4) epicenter uncertainty, and (5) strike, dip and rake variations as function of waveform misfit. Through these tests we verified that CAP solutions are robustly determined and just a few stations provide enough information to properly constrain the earthquake focal mechanism. Furthermore, the application of CAP method can provide good-quality solutions in a magnitude range (i.e. 2.6 ≤ Mw ≤3 .5) not properly represented in the
official catalogues and where the solutions estimated from P-onset polarities are often poorly constrained. The procedures described in this
31
study could be applied to different datasets in order to verify the robustness of estimated focal mechanisms and, consequently, to properly improve the knowledge of the seismotectonic regime, regional stress field features as well as the seismic hazard of different investigation areas.
Analyses and results reported in this chapter have been also published by Scolaro S., Totaro C., Presti D., D’Amico S., Neri G., & Orecchio B. (2018). Estimating Stability and Resolution of Waveform Inversion Focal Mechanisms. In Moment Tensor Solutions, 93-109, Springer.
32
CHAPTER 3
SEISMOGENIC STRESS FIELD ESTIMATION IN THE
CALABRIAN ARC REGION FROM A BAYESIAN APPROACH
3.1 Introduction
Seismic faulting is strictly related to tectonic stress acting in the lithosphere (Dziewonski et al., 1981; Anderson et al., 1993). Various seismological methods and analyses for determining the components of tectonic stress tensor have been reported in the literature, and stress fields in many regions of the world are today known (see, e.g., Heidbach et al., 2010). Earthquake focal mechanisms are among the most used data for stress inversion (McKenzie, 1969 and Gephart and Forsyth, 1984 among many others). However, relatively low accuracy of focal mechanisms of older and/or lower magnitude earthquakes due in particular to limitations of seismic monitoring systems has prevented accurate stress estimates in many regions, and southern Italy is one of these. In this chapter a new database of shallow earthquake focal mechanisms relative to the Calabrian Arc region is compiled. The new database has been compiled by adding 146 waveform inversion solutions estimated in this work to 292 selected from literature and official catalogs (see Table 3.1).
The inclusion of original solutions computed by the CAP method (Zhao and Helmberger, 1994; Zhu and Helmberger, 1996) has permitted us to expand the existing set of data adding earthquakes of magnitude as small as 2.6 still keeping high quality of data (see Chapter 2; D'Amico et al., 2010, 2011; Orecchio et al., 2015). Taking benefit from the enhanced set of focal mechanisms, we have investigated the
33
seismogenic stress tensor variations over the study region. For this purpose, we have used a very effective Bayesian technique introduced for estimating tectonic stress parameters from primary seismological observations (Arnold and Townend, 2007) never applied in southern Italy before the present study. This technique allows to incorporate nodal plane ambiguity and observational errors in the computational process and furnishes the posterior density function for the principal components of stress tensor and the stress-magnitude ratio (Townend et al., 2012). The main aim of the present work is that of improving the knowledge of seismotectonic domains of Calabrian Arc and surrounding areas in south Italy.
3.2 Data and Methods
An updated high-quality database of 438 crustal earthquake focal solutions has been compiled by taking from literature and catalogs the highest-quality waveform inversion solutions and adding 146 solutions computed in the present study (Figure 3.1). All the focal mechanisms we selected are waveform inversion solutions (i) computed by the CAP method or (ii) coming from Italian centroid moment tensor (CMT), Regional CMT, and time domain moment tensor catalogs (Pondrelli et al., 2006, 2011). Focal mechanisms estimated by CAP are for
earthquakes of magnitude Mw≥2.6 that originated at depths shallower
than 40 km in the study region between January 2006 and October 2015 (Figure 3.1).
As shown in Chapter 2, the robustness of CAP in our applications has been verified through rigorous tests in which recording network configuration, velocity model, focal depth, and epicenter location are varied. Furthermore, additional tests has been performed following the approach by Stich et al. (2003a) for estimating formal errors on focal mechanism parameters. By application of this procedure to the solution
34
Figure 3.1. Database of crustal earthquake focal mechanisms for the study
area. Different colors identify different types of mechanisms following Zoback's (1992) classification based on values of plunges of P and T axes: red = normal faulting (NF) or normal faulting with a minor strike-slip component (NS); green = strike-slip faulting (SS); blue = thrust faulting (TF) or thrust faulting with a minor strike-slip component (TS); black = unknown stress regime (U). “U” includes all focal mechanisms which do not fall in the other five categories (Zoback, 1992). The beach ball size is proportional to the earthquake magnitude (see legend). “N.C.” and “S.C.” stand for Northern Calabria and Southern Calabria, respectively.
35
estimated by CAP in the present study, we found that uncertainties of solutions estimated by CAP in the present study, we found that uncertainties of focal mechanisms of our data set are of the order of 8°– 10°. These solutions have been combined with the focal mechanisms selected from literature and official catalogs for earthquakes occurring at depth <40 km in southern Italy between 1977 and 2015 (Figure 3.1 and Table 3.1). In order to estimate the stress distribution over the study region, this high-quality database has been used for stress tensor inversion by applying, for the first time in south Italy, the method by Arnold and Townend (2007). These authors developed a Bayesian method for tectonic stress computation which furnishes the posterior density function of the principal components of stress tensor (maximum σ1, intermediate σ2, and minimum σ3 compressive stress, respectively)
and the stress-magnitude ratio (R). The parameter R is used to
determine the axis of maximum horizontal compressive stress (SHmax).
Each focal mechanism is characterized by four parameters: strike, dip, rake, and a weight factor or precision τ. The τ value estimate is based on the assumption that fault parameter errors follow a Matrix-Fisher distribution (see, for more details, Arnold and Townend, 2007 and Mazzotti and Townend, 2010). This Bayesian approach enables to incorporate nodal plane ambiguity, focal mechanism uncertainties, and similarity of the focal mechanisms included in each seismic zone (Arnold and Townend, 2007). The latter criterion is important because additional similar solutions add little to the constraints on the stress than is provided by a single solution (McKenzie, 1969; Hardebeck, 2006; Townend et al., 2012). Some of the most common algorithms for stress computation (see, e.g., Gephart and Forsyth, 1984) tend to be misleading in this regard (Hardebeck and Michael, 2004; Townend, 2006). Before starting with stress computations, we applied the k-means nonhierarchical clustering algorithm (see, e.g., Hartigan, 1975) to subdivide the focal mechanism data set according to hypocentral locations. This algorithm is not guaranteed to furnish a globally optimal, or even unique, solution, but by fixing the number of clusters
36
“k,” it assures that each event is closer to the centroid of the cluster to which it is assigned than to the ones of all k-1 other clusters. It has already been applied by other investigators to focal mechanism data specifically (see, e.g., Holt et al., 2013). Since clustering obtained by the k-means algorithm is based only on earthquake locations and not on faulting type, this approach allows identifying the sectors to be investigated without any “a priori” constraint from focal mechanism distribution. For our data set we have tested several values of k and run the k-means algorithm 1000 times randomly selecting various starting points for each k. At last, we have chosen k = 12 which appeared the most appropriate number of clusters for our data set according to the “elbow criterion” based on analysis of data variance versus k (Thorndike, 1953). We therefore report in Figure 3.2 the results obtained by using k=12 clusters: the clusters contain on average 37 focal solutions and a minimum of 20, with the only exception of two clusters containing, respectively, 15 and 5 focal solutions (boxes 7 and 12 in Figure 3.2). For each cluster the stereonet reporting the contours
of the σ1, σ2, and σ3 axes at the 90% confidence level is shown (Figure
3.2b). The confidence areas of obtained stress fields appear, in general, quite concentrated, indicating a high level of resolution in most cases (Figure 3.3). Additional inversion runs have been performed by partitioning each cluster according to earthquake magnitude or focal depth, in order to identify (i) eventual local effects of stress recognizable by low-magnitude earthquakes or (ii) stress changes between different tectonic domains distinguishable by depth. No change of stress as function of magnitude or depth has been detected.
3.3 Discussion of Results
In the recent literature different kinds of data and methods have been used in order to depict the present-day crustal stress in southern Italy (Musumeci et al., 2014; Palano, 2015; Montone and Mariucci, 2016).
37
Figure 3.2. (a) Epicenters of the focal mechanisms shown in Figure 3.1
clustered by the k-means algorithm reported with a color code relative to focal depth. Numbers 1 to 12 indicate the clusters, N and R are the number of events and the stress-magnitude ratio relative to each cluster, respectively. (b) Stereonets showing the orientations of the principal stress axes estimated for each cluster (lower hemisphere projection; north is up, east is right). Red, green, and blue contours denote the positions of the σ1, σ2, and σ3 axes,
respectively, and the corresponding orientation of SHmax is marked as a black
dashed line with the 90% confidence intervals shaded in gray. The numbers associate each stereonet to the relative cluster. The stereonet of cluster 12 is omitted because the low number of focal solutions available in the cluster (five) has not permitted to constrain the stress tensor.
38
Figure 3.3. Posterior density distributions of azimuth (a) and plunge (b) of the
principal stress axes estimated for clusters 1 to 11 investigated in the present study by application of the method by Arnold and Townend (2007). The numbers associate each plot to the relative cluster. The curves appear in general very peaked, highlighting a good level of resolution of the results. Note that the less peaked azimuth curves are relative to vertical stress axes (see e.g., σ1 in sectors 2 and 4, σ3 in sector 9 of Figure 3.2).
39
Musumeci et al. (2014) and Palano (2015) have focused their attention on specific sectors of our study region and used focal solution data sets where lower quality P onset polarity solutions are dominant with respect to poor numbers of better quality waveform inversion ones. Montone and Mariucci (2016) have used a data set mainly consisting of CMT waveform inversion solutions, but the number of solutions available to them in our study region (slightly more than a hundred) has not permitted to detect more than the gross features of the regional stress, such as extension in the Apennine-Calabria region and compression in the northern offshore of Sicily. More accurate detection of stress tensor variations in the region including the Apennine- Maghrebian chain from south Italy to western Sicily and the Tyrrhenian and Ionian offshores has, conversely, been possible in the present study by means of inversion of a high-quality robust data set including 438 waveform inversion focal solutions. Earthquake focal mechanisms and stress tensor distributions obtained in the present study (Figures 3.1 and 3.2) clearly indicate tectonic domains and suggest geodynamic engines. With their good level of constraint witnessed by posterior density errors as low as 5°–15° (Figures 3.2b and 3.3) our results clarify the stress patterns along the Apennine-Maghrebian chain and also allow improving the knowledge of stress regimes in the forearc area of the Ionian subduction zone, a sector not adequately investigated to date. The extensional dynamics and their changes along the Apennine-Maghrebian arcuate chain, where the Calabrian Arc roughly corresponds to the sector of maximum curvature, are well depicted by our results from the southern Apennines to western Sicily (Figure 3.4). Normal faulting solutions are mainly concentrated along the chain (Figures 3.1 and 1.2) and the opening direction detected by stress inversion is more or less perpendicular to the chain and follows with some approximation its curvature (boxes 1, 2, 4, 5, 8, and 10 in Figures 3.2 and 3.4). The Southern Apennines sector (Figure 3.1 and boxes 1 and 2 in Figure 3.4), which shows a predominance of normal faulting
40
Figure 3.4. Synthesis of the stress orientations estimated in the present study
for the southern Italy region. Numbers 1 to 11 indicate the focal mechanism clusters. The main extensional domains are depicted by red boxes reporting the orientation of σ3 (red arrows). The compressional ones are indicated by
blue boxes showing the orientation of σ1 (blue arrows). Transcurrent domains
identified in the Ionian offshore of the study region are indicated by green boxes for which both σ1 and σ3 are reported (green arrows). Black arrows
indicate the present motion of Africa relative to Europe (Nocquet, 2012, and references therein) and the white one shows the sense of the residual subducting slab rollback.
41
is presently undergoing extension probably related to postorogenic collapse tectonics (Catalano et al., 2004; Barchi et al., 2007; Li et al., 2007; Reitz and Seeber, 2012; Totaro et al., 2013, 2015). The extensional regime of Calabria and Messina Straits area Figure 3.1 and boxes 4, 5, and 8 in Figure 3.4) highlighted by high concentration of
normal faulting solutions and stress patterns showing vertical σ1 and
horizontal SE trending σ3, can be ascribed to southeastward rollback of
the Ionian subducting slab (Neri et al., 2005; D'Agostino et al., 2011; Presti et al., 2013). Looking in detail at the stress pattern of box 8, slight differences can be noted with respect to boxes 4 and 5. Box 8, in
fact, is characterized by a σ1 less steep than those detected for sectors 4
and 5. This reflects a mainly extensional stress pattern with a minor component of dextral strike-slip kinematics possibly due to local transition between collisional domains 9 and 11 and rollback-induced extension of sectors 4 and 5 (Presti et al., 2013; Palano et al., 2015). The compressional tectonics active in the Southern Tyrrhenian Sea offshore Sicily is evidenced by predominance of thrust faulting leading
to vertical σ3 and ~NNW trending horizontal σ1 (Figure 3.1 and boxes 9–
11 in Figure 3.4) referable to Africa-Eurasia convergence in the central Mediterranean (Pondrelli et al., 2004; Billi et al., 2007, 2011; Neri et al., 2014). We also obtained well-constrained stress fields in three large sectors located in the Ionian offshore of the study region (boxes 3, 6, and 7 in Figure 3.4) showing almost pure transcurrent regimes (Figure 3.4). In particular, the Ionian Calabria sector (box 3) is characterized by strike-slip solutions indicating left-lateral kinematics with NNW
trending horizontal σ3 and ENE trending subhorizontal σ1 implying a
minor extensional component. The obtained stress field probably reflects the transition between the area where southeastward rollback of the Ionian subducting slab is still active (south; Figure 3.4) and the area where the subduction slab has already undergone detachment (north) (see also Neri et al., 2012). Strike-slip solutions are also predominant in boxes 6 and 7 in the Ionian offshore. The stress field computed in sector
42
pure transcurrent regime which can be ascribed to Africa-Eurasia convergence that is found oriented NW-SE in this sector of the Mediterranean (Nocquet, 2012). In the Hyblean region and its immediate offshore (box 7) strike-slip solutions are also predominant and the obtained stress field, very similar to the one derived for box 6, reflects again the NW-SE Africa-Eurasia convergence. It seems also reasonable to suppose that relatively low level of seismicity detectable in the Ionian offshore of southern Calabria (Figure 3.1; see also Orecchio et al., 2014) can be an effect of southeastward rollback of the subducting slab active in the same zone (Figure 3.4) which locally reduces the compressional stress due to NW oriented plate convergence. Finally, at the westernmost corner of Sicily (box 12 in Figure 3.4), the five focal mechanisms available for inversion do not guarantee an acceptable estimate of stress tensor orientations and these are therefore omitted in Figure 3.2b and in Figure 3.4.
3.4 Conclusions
The compilation of an updated waveform inversion focal mechanism database and the application of the Bayesian stress inversion algorithm by Arnold and Townend (2007) have permitted us (i) to strongly improve the knowledge of seismotectonic stress regimes in the Calabrian Arc region and (ii) to start exploring seismogenic stress in the Ionian offshore, an area where many investigations have provided other geological and geophysical information. The obtained stress distribution covers with good accuracy the whole arcuate region corresponding to the Apennine-Maghrebian chain from south Italy to western Sicily and the relative Tyrrhenian and Ionian offshores (Figure 3.4). Our analysis highlights, in particular, a more or less perpendicular to - chain extensional process along the chain, compressional effects of Africa-Eurasia slow convergence mainly detected in the Tyrrhenian and Ionian offshores, and NW-SE extension along the Calabrian Arc that jointly
43
with seismicity distribution in the Ionian offshore of the Arc can be related to southeastward retreat of the Ionian subducting slab. More in
detail, the well constrained NNW trending σ1 in the main east trending
seismogenic belt located offshore northern Sicily, and the quite diffused transcurrent regimes in southeastern Sicily and Ionian offshore driven by NW trending σ1, mark clearly continental plate convergence. At the
same time, relatively low level of seismicity in the Ionian offshore of southern Calabria and the extension of Calabrian Arc parallel to southeastward rollback of the Ionian subduction slab, may reflect the superposition of a quite localized residual subduction process onto the continental-scale process of convergence. Our results consisting of a strongly enhanced focal mechanism database and more accurate local-to-regional scale stress distributions throw new light on the kinematics and dynamics of this still widely debated region and furnish useful tools
44
Id Data O.T. Lat Lon Depth Strike Dip Rake M Source
1 19770605 13:59:23 37.840 14.460 11.3 61 26 -139 4.6 Italian CMT 2 19780311 19:20:49 38.100 16.030 33.0 270 41 -72 5.6 Italian CMT 3 19780415 23:33:47 38.390 15.070 14.0 135 60 -176 5.5 Italian CMT 4 19790120 13:49:59 38.670 12.860 9.0 72 29 53 5.2 Italian CMT 5 19800220 02:34:03 39.300 16.210 12.0 14 43 -78 4.8 Italian CMT 6 19800309 12:03:40 39.940 16.120 19.0 157 35 -80 4.6 Italian CMT 7 19800514 01:41:04 40.460 15.850 24.0 119 38 -112 4.5 Italian CMT 8 19800528 19:51:19 38.480 14.250 14.0 83 43 99 5.7 Italian CMT 9 19800601 02:32:52 38.390 14.330 10.0 65 39 91 4.9 Italian CMT 10 19801123 18:34:54 40.910 15.370 10.0 135 41 -80 6.9 Italian CMT 11 19801124 00:24:00 40.890 15.260 10.0 131 29 -110 4.9 Italian CMT 12 19801124 03:03:54 40.900 15.330 10.0 115 44 -125 5.1 Italian CMT 13 19801125 17:06:44 40.700 15.470 10.0 122 30 -119 5.1 Italian CMT 14 19801125 18:28:21 40.650 15.400 10.0 129 26 -65 4.9 Italian CMT 15 19801203 23:54:24 40.740 15.480 10.0 148 36 -76 4.9 Italian CMT 16 19810116 00:37:47 40.950 15.370 15.0 115 30 -93 5.0 Italian CMT 17 19810607 13:00:57 37.670 12.470 18.0 48 29 48 4.9 Italian CMT 18 19810622 09:36:18 38.490 14.090 13.0 71 47 116 4.8 Italian CMT 19 19811129 05:06:47 40.740 15.640 33.0 104 41 -138 4.9 Italian CMT 20 19820321 09:44:00 39.700 15.640 18.9 15 39 -127 5.0 Italian CMT 21 19820815 15:09:50 40.810 15.360 10.0 158 48 -45 4.8 Italian CMT 22 19870128 05:33:22 40.950 15.470 10.0 160 45 -79 4.6 Italian CMT 23 19870813 07:22:10 37.900 15.060 35.9 352 42 -10 4.8 Italian CMT 24 19880108 13:05:46 40.080 16.010 10.0 148 30 -86 4.8 Italian CMT 25 19900505 07:21:19 40.750 15.850 26.0 184 73 13 5.3 Italian CMT