U
NIVERSITY OF
N
APLES
F
EDERICO
II
P
H
.D.
P
ROGRAM IN
C
LINICAL AND
E
XPERIMENTAL
M
EDICINE
CURRICULUM IN ODONTOSTOMATOLOGICAL SCIENCES
XXXI Cycle
(Years 2015-2018)
Chairman: Prof. Francesco Beguinot
P
H
.D.
T
HESIS
T
ITLE
DIAGNOSTIC
DEVICES
FOR
THE
EVALUATION
OF
MASTICATORY
MUSCLES:
ELECTROMYOGRAPHY
AND
ALGOMETER
T
UTORP
H.D.
S
TUDENTTable of contents
Overview
1
Chapter 1. EMG in the evaluation of masticatory muscles:
a standardized Protocol
3
Chapter 2. Jaw muscle activity patterns in patients with
chronic TMD myalgia during standardized clenching
and chewing tasks
7
2.1 Materials and methods
2.1.1 Study sample
9
2.1.2 Questionnaires
9
2.1.3 EMG assessment 10
2.1.4 Statistical analysis 11
2.2 Results
2.2.1 Questionnaires
12
2.2.2 EMG indices 12
2.3 Discussion
14
2.4 Conclusions
17
Chapter 3. Evaluation of masticatory muscle activity in patients
with unilateral posterior crossbite before and after
rapid maxillary expansion
18
3.1 Materials and methods
3.1.1 Study sample 20
3.1.2 Rapid Maxillary Expansion 20
3.1.3 Data collection 21
3.1.4 Sample size calculation and
Statistical analysis 21
3.2 Results
3.2.1 EMG indices at baseline: within-group
And between-group comparisons
23
3.2.2 EMG indices in the UPCB group
before and after orthodontic
treatment (T
0-T
2)
23
3.3 Discussion
26
3.4 Conclusions
30
Chapter 4. Evaluation of masticatory muscle activity in patients with
juvenile idiopathic arthritis (JIA)
31
4.1 Materials and methods
4.1.1 Study sample
33
4.1.2 Anamnesis and clinical examination
34
4.1.4 Sample size calculation and
statistical analysis
35
4.2 Results
4.2.2 EMG indices evaluation
38
4.2.3 Comparison between all study subgroups
39
4.3 Discussion
41
4.4 Conclusions
43
Chapter 5. Evaluation of masticatory muscles and temporomandibular joint
pressure pain threshold in patients with juvenile idiopathic
arthritis compared to healthy subjects: a case control study
44
5.1 Materials and methods
5.1.1 Study sample
47
5.1.2 Anamnesis and clinical examination
47
4.1.3 Pressure pain threshold measurement
48
4.1.4 Statistical analysis
49
5.2 Results
50
5.3 Discussion
53
5.4 Conclusions
55
Chapter 6. General conclusions
56
1 | P a g .
OVERVIEW
The issue of masticatory muscles impairment diagnosis in the field of the evaluation of temporomandibular disorders (TMD) represents one of the most controversial theme among dentists (McNeill, 1997).
According to previous studies analyzing the diagnostic efficiency for TMD, an accurate anamnesis and the clinical examination of the dysfunctional patient seems to be the gold standard especially for muscular pathologies (AADR, 2010). As showed by different
systematic reviews (Lund et al., 1995; Petersson, 2010), the electronic devices can give only additional information for the assessment of masticatory muscles because of the areas not well understood such as the biological variation, the grade of adaptability of each muscles (Lund et al., 1995). However, the evaluation of masticatory muscles activation in terms of asymmetry and/or bite force could be useful in growing patients because of the possible onset of skeletal asymmetries and TMD related to a pathological condition affecting temporomandibular joint or to a malocclusion (Iodice et al., 2013; Iodice et al., 2016; Michelotti et al., 2016).
The activity of muscles is commonly investigated by using surface electromyography (sEMG) in order to identify possible muscular impairment. However, the assessment of jaw muscles activity by means of sEMG has been questioned for its low reliability (Al-Saleh et al., 2012). Indeed, biological variations, low repeatability in electrode placement, and artefacts can account for possible discrepancies between studies and conflicting results (Castroflorio et al., 2006; Castroflorio et al. 2008). To overcome this limit, EMG protocols using standardized EMG signals or indices were introduced (Ferrario et al., 2000).
Masticatory muscles evaluation can include measurements of muscle tenderness, pain detection thresholds, pain tolerance thresholds, pain response to suprathreshold stimuli and temporal summation (Bezov et al., 2011). The study of pain perception could be the key in understanding that sensitization of central nociceptive pathways is a relevant mechanism involved in the physiopathology of muscular pain (Bezov et al., 2011).
Pain perception can be assessed by pain pressure threshold (PPT) measurement. Pressure algometry is a useful technique to quantify the mechanical sensitivity of a muscle, in which pressure is registered through an algometer (Ylinen et al., 2007). PPT has been shown to be a valid method to measure mechanical pain threshold in human muscles, including craniofacial ones (Bezov et al., 2011; Chesterton et al., 2007; Farella et al., 2000).
2 | P a g .
The chapter 1 reports the standardized electromyographic protocol used in all reported
experimental studies. Chapter 2 analyzes the jaw muscle activity in patients affected by TMD chronic myalgia. In the chapter 3 is reported the EMG evaluation of masticatory muscles in children affected by cross bite malocclusion. The chapter 4 explains the use of EMG in patients affected by a chronic autoimmune disease, i.e. Juvenile Idiopathic Arthritis (JIA). Chapter 5 includes the PPT evaluation in patients suffering from JIA. In the chapter 6 are reported the general conclusions about the use of the reported diagnostic instruments. The work contained in this thesis has led to the following publication:
Michelotti A, Rongo R, Valentino R, et al. Evaluation of masticatory muscle activity in patients with unilateral posterior crossbite before and after rapid maxillary expansion. Eur J Orthod. 2018 Apr. doi: 10.1093/ejo/cjy019.
3 | P a g .
CHAPTER 1
EMG in the evaluation of masticatory muscles: a standardized
protocol
To overcome the limits related to electromyography, different standardized protocols were proposed. The EMG protocol (Ferrario et al., 2000) proposed by Ferrario et al. has been largely used (De Felício et al., 2012; Ferrario et al., 2007; Michelotti et al., 2018; Santana-Mora et al., 2009; Tartaglia et al., 2008; Tartaglia et al. 2011;). This protocol allows computing indices of jaw muscles activity by using standardized EMG signals recorded during maximum voluntary contraction in maximal intercuspation and on cotton rolls. This method reduces biological and technical noise, and allows comparing the activity of paired jaw muscles by providing indices of asymmetric jaw muscles activation during function. In all reported experimental studies, we referred to a standardized protocol reported below.
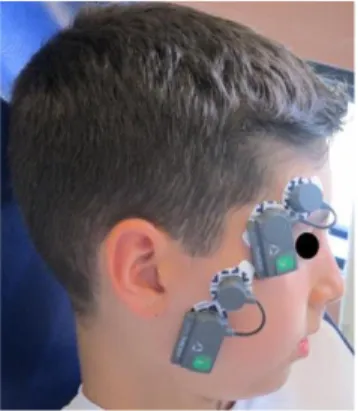
The electrical activity of the right and left AT and MM muscles was recorded simultaneously during standardized tasks via sEMG. Silver-silver chloride bipolar surface pre-gelled
electrodes (Kendall, Mansfield, MA, USA) with a diameter of 24 mm were placed on the skin along the main direction of the muscular fibres. To minimize electrode impedance, the skin was thoroughly cleaned with an abrasive preparation gel (Everi, Spes Medica, Genova, Italy) before electrode placement. For the TA, electrodes were placed vertically over the anterior border of the muscle, on the area corresponding to the fronto-parietal suture; for the MM, the upper pole of the electrode was placed at the intersection between the tragus-labial
commissure and the exocanthion-gonion (mandibular angle) lines (Figure 1.1).
4 | P a g .
Recordings were performed at least 5–6 minutes after the application of the electrode to allow the conductive gel to adequately moisten the skin surface. All subjects sat in a dental chair. The position of the seatback was fixed, while the vertical excursion of the dental chair could be adjusted by the operator. The EMG analysis was performed using a wireless EMG device (TMJOINT, BTS SpA, Garbagnate Milanese, Italy). The EMG signals were acquired at 1KHZ, amplified (gain 150) and filtered via hardware (low-pass filter 500Hz; high-pass 10Hz). A software program (Dental Contact Analyser, BTS SpA) processed the raw electrical signals and generated root mean square (RMS) values. Thereafter, RMS values were
processed by an algorithm to generate indices of muscle activity and asymmetry.
The EMG protocol included two static and two dynamic tests. The static tests included the following:
1. Maximum voluntary contraction (MVC) in intercuspal position (CLENCH)—subjects clenched their teeth as hard as possible for 5 seconds;
2. MVC in intercuspal position on cotton rolls (COT)—subjects clenched as hard as possible for 5 seconds on 10 mm thick cotton rolls (Intermedical, Terlano, Bolzano, Italy) positioned from the mandibular first molar to the canine on both sides.
For the 5-second static tests, two hundred 25 msec RMS samples were collected. The 120 samples, corresponding to 3 second, with the highest RMS values were used to compute the indices. The EMG waves of each muscle (120 samples) with and without cotton rolls were superimposed sample by sample, and the ratio between the superimposed areas and the total areas was computed automatically via software. Hence, for each subject, the EMG potentials recorded during the MVC were expressed as percentage of the mean RMS potential recorded during the MVC on the cotton rolls (EMG standardized potentials).
The dynamic tests included the following:
1. Chewing gum (Air Action Vigorsol, Lainate, Italy) on the right side for 15 seconds. 2. Chewing on the left side for 15 seconds.
Between the static and the dynamic tests, participants were asked to rest for 3 minutes.
The following standardized EMG indices were calculated via software:
5 | P a g .
1. POC (percentage of overlapping coefficient). The standardized EMG waves of the left and right AT and MM were compared by computing a percentage overlapping
coefficient (POC, unit: %, range: 0–100 per cent, norm values 85 per cent ≤ POC ≤ 100 per cent) (11, 13, 24). If the muscles contract with perfect symmetry, a POC of 100 per cent (perfect symmetry) is expected. Conversely, a value corresponding to 0 per cent indicates the absence of concurrent activation of paired muscles (no
symmetry). Three indices were computed for each subject (POC AT, POC MM and POC medium).
2. TC (torque coefficient). This index is obtained by measuring the overlapping activity (standardized EMG waves) between the left MM and right AT and the right MM and left AT. The higher muscular activity of one couple (i.e. left MM and right AT) over the other (i.e. right MM and left AT) results in a torqueing effect on the lower jaw. TC ranges between 0 per cent (no symmetric activation of the couples, greatest torqueing effect) and 100 per cent (perfect symmetric activation of the couples, no torqueing effect). Normal values are 90 per cent ≤ TC ≤ 100 per cent (De Felício et al., 2009; Ferrario et al., 2000; Ferrario et al., 2006).
3. IMPACT (total standardized muscle activity). This index is computed as the integrated area of the EMG standardized potentials of both MM and AT over time (5 seconds MVC). Norm values are 85 per cent ≤ IC ≤ 115 per cent (Ferrario et al., 2000). Lower values indicate that the EMG standardized potentials were reduced during the
clenching tasks, and that the maximal EMG activity could not be expressed.
4. ASIM (asymmetry index). This index is calculated by comparing the activity of the right couple (right AT and right MM) to the left couple (left AT and left MM). ASIM ranges from −100 per cent and +100 per cent; a value of 0 per cent depicts a perfect symmetric activation of the two couples. A negative value indicates greater activity of the left couple; conversely, a positive value indicates a greater activity of the right couple. Norm values are −10 per cent ≤ ASIM ≤ +10 per cent (Botelho et al., 2010).
Computed indices (dynamic tests).
1. SMI(symmetrical mastication index) was computed to assess whether the left- and the right-side chewing tests were performed with symmetrical muscular patterns. It
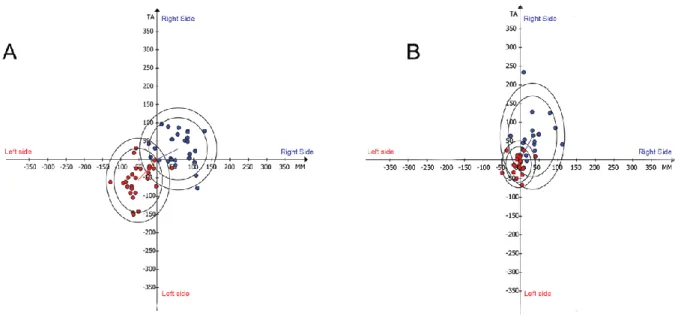
indicates the distance between the centre of the chart and the centre of the ellipse in a graph that describes the prevalence of one side over the other during mastication (Figure 1.2). SMI ranges between 0 per cent (no symmetry) and 100 per cent
6 | P a g .
(symmetrical muscular pattern). Normal values are 70 per cent ≤ SMI ≤ 100 per cent (Ferrario et al., 1999) (Figure 1.2).
Figure 1.2. Determination of the symmetrical mastication index (SMI). x-axis: differential masseter (left (-) versus right); y-axis: differential temporal (left (-) versus right) (μV). Red dots and the corresponding ellipse depict data recorded during the task ‘chewing on the left side’. Blue dots and the corresponding ellipse depict data recorded during the task ‘chewing on the right side’. In an ideal condition (complete symmetric activity between right and left sides during chewing), the centre of the ellipse describing the task ‘chewing on the right side’ will be located in the first quadrant (top left) and the centre of the ellipse describing the task ‘chewing on the left side’ in the third quadrant (bottom right). The symmetrical mastication index (SMI, %) is calculated using the distance between the centres of the two confidence ellipses and the origin of the axes. If the right and left chewing tasks are symmetric, the right and left ellipses will have the same distance from the origin of the axes, and a 180 degree difference between phase angles (angle between the x-axis and the segment connecting the centre of the ellipse and the axis origin). Symmetric patient (A). Similar distances between the system origin and the centre of the ellipse, and similar phase angle between the two tasks. Asymmetric patient (B). The blue ellipse has a bigger distance respect to the centre and the difference between the angles is lower than 180 degree.
2. SPM (side of prevalent mastication) in case of SMI values lower than 70 per cent, the dominant side of mastication was identified as side of prevalent mastication (Figure 1.2). Three categories could be identified, that is right, left and symmetric.
3. FREQ (frequency index) measures the frequency of masticatory cycles during the chewing experimental tasks and was reported in hertz (Hz: bites per second).
The EMG protocol and the algorithm used for the standardization of the EMG signals and the computation of the indices have been used and described in several research studies (De Felício et al., 2009; Ferrario et al., 1999; Ferrario et al., 2000; Ferrario et al., 2006).
7 | P a g .
CHAPTER 2
Jaw muscle activity patterns in patients with chronic TMD myalgia
during standardized clenching and chewing tasks
Temporomandibular disorders (TMD) include a set of different pathological
conditions affecting masticatory muscles and/or temporomandibular joint with a multifactorial etiology (Slade et al., 2016). Previous studies have reported that jaw muscle activity during rest and functional tasks is different between patients with TMD and healthy subjects (De Felício et al., 2012; Ferrario et al., 2007; Santana-Mora et al., 2009; Tartaglia et al., 2008). A recent study has revealed that patients affected by TMD have an average greater
electromyographic (EMG) activity of masticatory muscles compared to individuals without pain because of the high frequency of oral parafunctions (Cioffi et al., 2017). On the other hand, other studies have shown that jaw muscle activity is decreased in TMD patients
(Kogawa et al., 2006; Santana-Mora et al., 2009; Tartaglia et al., 2008), in agreement with the pain adaptation model, which suggests that muscular activity decreases to limit movements and protect the sensory-motor system from further muscle tissue injury (Lund et al., 1991; Peck et al., 2008; Tucker et al., 2009).
The extent of jaw muscles asymmetry during maximum contraction of elevator muscles has been measured in normo-occlusion subjects suffering from TMD (De Felício et al., 2012; Ferrario et al., 2007; Tartaglia et al., 2008). Some studies found a larger asymmetry of temporalis and masseter muscles activity in TMD subjects as compared to TMD free controls as result from increased temporalis or relatively reduced masseter activity (Santana Mora et al., 2009; Tartaglia et al., 2011). On the other hand, a recent study by Da Silva and co-workers (da Silva et al., 2017) has shown that TMD patients do not present a greater masticatory muscles asymmetry than healthy controls.
8 | P a g .
This experiment aimed at examining jaw‐muscles activity patterns of patients with chronic TMD myalgia using standardized EMG indices, which evaluate jaw muscles asymmetry during function, muscular work, and chewing rate to determine whether
asymmetric or abnormal activation of paired muscles is associated with chronic TMD pain. It was hypothesized that patients with chronic TMD myalgia have more asymmetric muscular activity and increased muscular work during experimental isometric clenching, and abnormal chewing frequency.
9 | P a g .
2.1 Materials and methods
2.1.1 Study sample
Adults seeking for a TMD consultation at the Department of Neuroscience, Section of Orthodontics and Temporomandibular Disorders of the University of Naples Federico II, Italy were examined using the Diagnostic Criteria for TMD (DC/TMD) clinical examination protocol (Schiffman et al., 2014). Those with a diagnosis of TMD myalgia with self-reports of pain from at least 6 months were recruited.
One hundred subjects contacted at the Hospital, including employees and students, were invited to fill in the TMD pain screener (Gonzalez et al., 2011). Individuals reporting pain in the jaws and/or temples in the last 30 days were excluded. For both groups exclusion criteria were neurological disorders, craniofacial syndromes, and current orthodontic or dental treatment.
The total sample included fifty-two individuals: twenty-nine patients with TMD myalgia (mTMD, 2 males, 27 females, mean age ± standard deviation: 37.8±12.6 years) and twenty-three pain-free subjects (Ctr, 5 males, 18 females, mean age ± standard deviation: 34.4±11.9 years).
The Research Ethics Board at University of Naples “Federico II” approved the research protocol (protocol 22616). The research was conducted in accordance with The Code of Ethics of the World Medical Association (Declaration of Helsinki) for experiments involving humans. All subjects gave written informed consent to participate before entering the experiment.
2.1.2 Questionnaires
Patients with mTMD filled in the Graded Chronic Pain Scale included in the DC/TMD instrument (Schiffman et al., 2014). All subjects filled out the following
questionnaires:
The Oral Behavior Checklist (OBC) questionnaire was used to identify and quantify the frequency of self-reported oral behaviors (Markiewicz et al., 2006). The OBC investigates nocturnal bruxism (2 items) and different
wake-10 | P a g .
time oral behaviors (19 items). Each participant chooses among five response options: “none of the time,” “a little of the time,” “some of the time,” “most of the time” and “all of the time,” which are scored from 0 to 4. In this study, authors analyzed a reduced 6-items version (OBC-6). It includes items 3 (“grind teeth together during waking hours”), 4 (“clench teeth together during waking hours”), 5 (“press, touch or hold teeth together other than while eating –that is, contact between upper and lower teeth”), 10 (“bite, chew, or play with your tongue, cheeks, or lips”), 12 (“hold between the teeth or bite objects such as hair, pipe, pencils, pens, fingers) and 13 (“use chewing gum”) (Cioffi et al., 2016; Cioffi et al. 2017; Michelotti et al., 2012).
The State Trait Anxiety Inventory (STAI X1- STAI X2) was used to assess the state-trait anxiety of individuals. Twenty items assess the state anxiety and 20 assess the trait anxiety. Trait anxiety includes constructs such as “I fell
inadequate”, “I lack self-confidence”, and “I have disturbing thoughts”.
Individuals selects one of the following options: “almost never”, “sometimes”, “often”, or “almost always”. Each answer is graded as a score from 1 to 4 (Spielberger et al., 1983).
The Somatosensory Amplification Scale (SSAS) questionnaire was used to assess the degree of somatic awareness. It encloses ten claims used to analyze individual sensitivity to bodily sensations such as “I hate to be too hot or too cold”, “I have a low tolerance for pain” and “I am often aware of various things happening within my body”. Each participant chooses among the following options: “not at all,” “a little,” moderately,” “quite a bit,” or “extremely”. Each answer is graded as a score from 0 to 4 (Barsky et al., 1990).
2.1.3 EMG assessment
The activity of masseter (MM) and temporalis anterior (TA) muscles of both sides (left and right) was recorded during standardized tasks by means of sEMG according to the EMG protocol previously described.
11 | P a g .
2.1.4 Statistical analysis
All data were analyzed by using SPSS 21.0 software. Independent Student T-Test was used to assess difference between groups. Statistical significance was set at p<0.05. A sample including 21 subjects per group was sufficient to detect 5 %(SD = 4.55 per cent) (Ferrario et al., 2000) between-group differences in POC medium index (α= 0.05 and 1-β= 0.9).
12 | P a g .
2.2 Results
2.2.1 Questionnaires
TMD participants reported a mean pain intensity in the last 30 days of 50.5 ± 30.4 mm on a 100 mm Visual Analogue Scale (left endpoint: no pain; right endpoint: “the worst pain I can imagine”). Eleven patients had GCPS grade II and 18 grade III. A
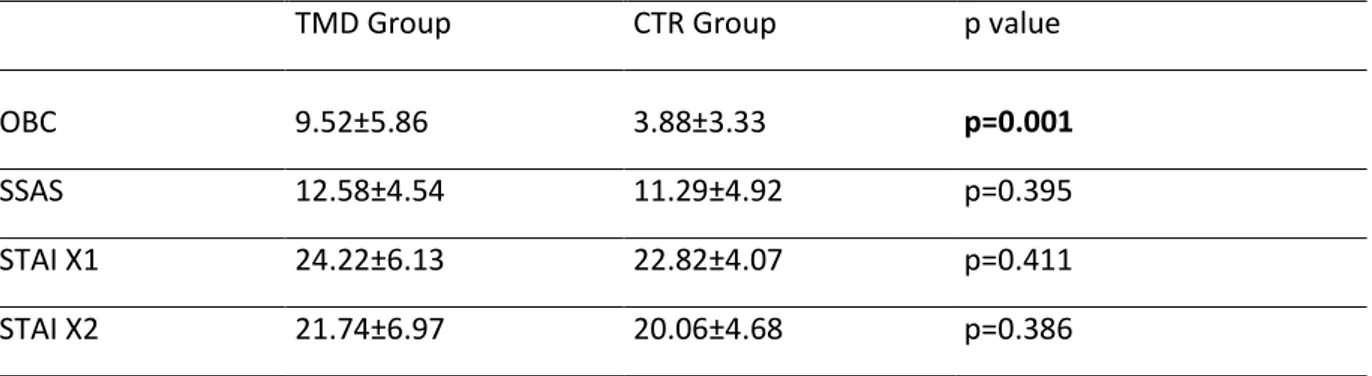
significant difference for self-reported oral behaviors was found between groups: mTMD group reported a higher frequency of oral parafunctions than CTR group (p=0.001). No differences were found both for the somatosensory amplification and for the anxiety between groups (Table 2.1).
TMD Group CTR Group p value
OBC 9.52±5.86 3.88±3.33 p=0.001
SSAS 12.58±4.54 11.29±4.92 p=0.395
STAI X1 24.22±6.13 22.82±4.07 p=0.411
STAI X2 21.74±6.97 20.06±4.68 p=0.386
Table 2.1. Comparisons for OBC, SSAS, STAI scores. Bold type: statistically significant.
2.2.2 EMG indices
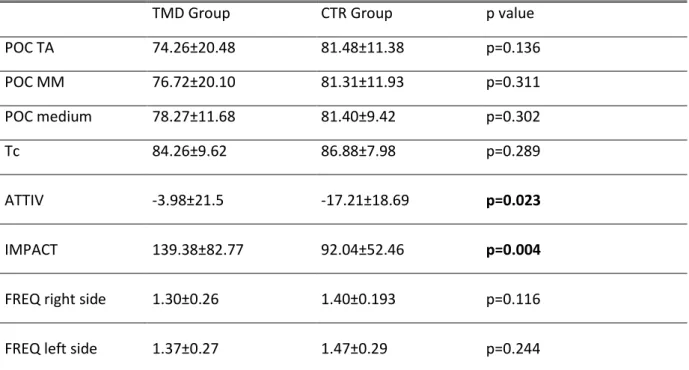
Both groups showed a similar asymmetric contraction pattern comparing right and left TA muscles (POC TA, Table 2.2, p value= 0.136) and right and left MM muscles (POC MM, Table 2.2, p value=0.311). No significant differences between right and left sides for both groups were found for the POC medium index (POC medium, Table 2.2, p value= 0.302). Tc index was similar between mTMD patients and healthy subjects (Tc, Table 2.2, p value= 0.289).
When comparing TA and MM muscles activities, a significantly higher MM muscles activity in mTMD patients compared to healthy subjects was found (ATTIV, Table 2.2, p value= 0.023).
13 | P a g .
Muscular work was significantly different between groups with a higher muscular work (mV/sec) in mTMD group compared to CTR group during experimental clenching (IMPACT, Table 2.2, p value= 0.004).
The frequency of chewing did not differ between groups both for right and left side (FREQ right side, Table 2.2, p value=0.116; FREQ left side, Table 2.2, p value= 0.244).
TMD Group CTR Group p value
POC TA 74.26±20.48 81.48±11.38 p=0.136 POC MM 76.72±20.10 81.31±11.93 p=0.311 POC medium 78.27±11.68 81.40±9.42 p=0.302 Tc 84.26±9.62 86.88±7.98 p=0.289 ATTIV -3.98±21.5 -17.21±18.69 p=0.023 IMPACT 139.38±82.77 92.04±52.46 p=0.004
FREQ right side 1.30±0.26 1.40±0.193 p=0.116
FREQ left side 1.37±0.27 1.47±0.29 p=0.244
14 | P a g .
2.3 Discussion
The present study demonstrated that both individuals with TMD myalgia and healthy controls present a slight asymmetric activation of jaw muscles during clenching, as compared to reference values (Ferrario et al., 2000). However, there were no significant differences between the study groups. Masseter muscles were significantly more active than temporalis muscles in TMD myalgia patients than controls. Furthermore, patients with TMD myalgia had a greater muscular work and self-reported frequency of oral parafunctions (OBC-6 scores) than controls. The lack of a significant difference in masticatory muscles asymmetry between mTMD patients and CTR reported in our study is consistent with Tartaglia et al (Tartaglia et al., 2008). Authors showed that only arthrogenous patients (group II and III according to RDC/TMD) were significantly asymmetric as compared to controls (Tartaglia et al., 2008), whereas the degree of asymmetry during activation was similar between myogenous patients (group I according to RDC/TMD) and controls (Tartaglia et al., 2008). In contrast, other studies found higher asymmetric activity both for temporalis and masseter muscles activity in both patients and healthy subjects (De Felício et al., 2012; Ferrario et al., 2007). In the current experiment, the activation of the couples right temporal-left masseter and left temporal-right masseter was not difference between groups (Tc index). An altered Tc index value may suggest the presence of a fulcrum that is the expression of unbalanced masticatory muscle activity in search of occlusal stability (Tartaglia et al., 2008). Hence, it is possible to hypothesize that both patients and controls had good occlusal stability, i.e. a proper intercuspation between the upper and lower dental arches. This result is in agreement with other studies, which showed that the Tc coefficient did not differ between TMD group and the CTR one (Ferrario et al., 2007; Tartaglia et al., 2008; Tartaglia et al., 2011). However, De Felício and co-workers found a significant larger unbalanced activity in TMD group
compared to healthy subjects (De Felício et al., 2012). These inconsistent findings could be explained by the different criteria adopted for the selection of samples (De Felício et al., 2012). In the current study, the authors found a significant difference between the two groups for ATTIV index that compares the differential recruitment of temporalis and masseter muscles, with a negative value implying a greater differential recruitment of the temporal muscles. From the present study, a greater activation of masseter muscles than temporalis muscles was found in the mTMD group. These results were not in agreement with other studies reporting an increased activity of the temporalis muscles (Santana-Mora et al., 2014; Tartaglia et al, 2011). However, also in this case, discrepancies in diagnostic criteria may
15 | P a g .
explain the differences between the studies (Santana-Mora et al, 2014; Tartaglia et al., 2011). In order to assess the relative activation of MM and AT muscles as a function of different oral behaviors, Farella and co-workers evaluated the effects of induced non-functional oral tasks on the pattern of activity of the masticatory muscles of healthy subjects (Farella et al., 2008). Results reported a changing of the relative activity of each couple of muscles depending on the examined tasks (Farella et al., 2008). A rather symmetric activation was reported in most of oral task. However, masseter muscles showed a higher activation during tasks involving incisal biting, conversely the activity of anterior temporalis predominated when tasks in intercuspal position were performed (Farella et al., 2008). It could be supposed that in the current study mTMD patients showed a higher masseter activity and a relative anterior temporalis reduced one because of the muscle fatigue of AT related to a higher frequency of oral parafunctions performed in intercuspal position. Indeed, in the present experiment it was analyzed oral behavior by calculating OBC-6 score, which includes six items concerning intercuspal position tasks (Cioffi et al., 2016; Cioffi et al., 2017; Michelotti et al., 2012).
Finally, a significant difference was found for IMPACT index with higher values in mTMD patients compared to healthy subjects. IMPACT index expresses the muscular work represented geometrically by the area under the curve of electrical activity of the muscles examined over time. The authors can assume that in mTMD group, during a short lasting session (5 seconds) of clenching, there is a greater muscular work. This could be related to a greater tone of masticatory muscles in mTMD patients or it is likely that mTMD patients have an abnormal recruitment of muscular fibers as compared to healthy controls with a consequent alteration of muscular electrical activity. Clinical practice reports the feeling that the painful muscles commonly show an increased muscular hardness (Fricton, 1999; Murayama et al., 2012). A recent review analyzed the scientific evidence about the correlation between the hardness of masticatory muscles and myofascial TMD: some studies reported a significant difference in masseter muscles hardness between TMD patients and healthy subjects showing a higher elasticity index and higher elasticity modulus in TMD patients at resting position (Ariji et al., 2013; Takashima et al, 2017). It was suggested that the association between muscular pain and hardness could be related to a combination of sustained tonic contractions, tissue edema and metabolic alterations (Ashina et al., 1998; Sakai et al., 1995).
With respect to the frequency of chewing, the present study did not find any difference between groups. In addition, frequency for both sides was not different for mTMD patients compared to the CTR subjects. This finding suggests that mTMD did not limit jaw movement in the analyzed sample.
16 | P a g .
The STAI and SSAS were collected to account for the possible effect of psychological factors on outcome measures. Indeed, psychological factors may play a role in influencing the association between pain and motor activity (Brandini et al., 2011). However, both
parameters were not different between mTMD and CTR groups; therefore, the authors did not adjust the comparisons using these values.
Although some studies reported that sEMG assessment of masticatory muscles gives additional value compared to clinical examination alone (Bodéré et al., 2005; Tartaglia et al., 2008), the evaluation of the asymmetry of the masticatory muscles activity in subjects affected by TMD showed controversial results reporting only in some cases differences between TMD patients and controls ( De Felício et al., 2012; Ferrario et al., 2007). Manfredini and co-workers reported a low accuracy of the assessment both of the EMG activity at rest and ratio of EMG activity between paired muscles for the diagnosis of TMD pain patients (Manfredini et al., 2011). However, the outcome with the highest diagnostic accuracy for the identification of myalgia TMD patients, seems to be the evaluation of
muscular force during clenching tasks (Manfredini et al., 2011; Tartaglia et al., 2008). Also in the current study, the main outcome discriminating mTMD patients and healthy subjects was the muscular work, which represents the electrical activation of muscular fibers during a clenching task.
Further longitudinal studies could be useful to understand better the role of muscular asymmetry as etiological factor in development of TMDs.
17 | P a g .
2.4 Conclusions
Myalgia TMD patients reported a greater muscular work. There was no association between asymmetric muscular activity and mTMD. Current findings suggest that an
asymmetric pattern of contraction of the masticatory muscles during static and dynamic tasks is an intrinsic characteristic of each individual. So different activation patterns of masticatory muscles are not necessarily associated with a pathological condition.
18 | P a g .
CHAPTER 3
Evaluation of masticatory muscle activity in patients with unilateral
posterior crossbite before and after rapid maxillary expansion
Posterior crossbite (PCB) is a common malocclusion, which affects 8–22 per cent of orthodontic patients in the primary and early mixed dentition (Shalish et al., 2013) and 5–15 per cent of the general population (Farella et al., 2007). Unilateral posterior crossbite (UPCB) with a functional shift of the mandible occurs in 71–84 per cent of individuals with PCB (Thilander et al., 2002). UPCB has been suggested to determine an asymmetrical activation of the masticatory muscles and therefore might contribute to the onset of skeletal asymmetries and temporomandibular joint disorders (TMD) (Iodice et al., 2013; Iodice et al., 2016; Michelotti et al., 2016). Based on these assumptions, early treatment of UPCB by maxillary expansion (Agostino et al., 2014; Bucci et al., 2016; Rongo et al., 2017) is commonly
recommended to reduce the risk of developing craniofacial anomalies and TMD in adulthood (Iodice et al., 2013; Iodice et al., 2016).
The effects of the correction of UPCB on the activity of anterior temporalis (AT) and superficial masseter (MM) muscles have been evaluated using sEMG, with controversial findings (Andrade et al., 2010; Arat et al., 2008; De Rossi et al., 2009; Kecik et al., 2007; Martìn et al., 2012; Maffei et al., 2014; Piancino et al., 2016). One study (Martìn et al., 2012) concluded that the degree of asymmetry of masticatory muscles during function is not
affected by the presence of crossbite. Others reported that the treatment of crossbite
contributes to a more symmetric pattern of activation of the chewing muscles during function only to a slight extent (Kecik et al., 2007; Piancino et al., 2016). Finally, findings included in other reports may be questionable since they lack of untreated subjected acting as controls (De Rossi et al., 2009; Maffei et al., 2014). A recent review has reported that the treatment of crossbite contributes to increasing the activity of masticatory muscles, approaching levels similar to subjects with normal occlusion (Tsanidis et al., 2016). Differently from other
19 | P a g .
studies, this research has investigated the relationship between crossbite and asymmetry in the activity of the chewing muscles by using a standardized EMG protocol and indices.
The relationship between crossbite and asymmetric jaw muscle activity has been subject of debate in several studies. An early treatment of crossbite is commonly recommended to reduce the risk of developing skeletal asymmetries as a consequence of abnormalities in masticatory function between the right and left sides. A better understanding of both the possible relationship between UPCB and asymmetric muscular function and the effect of RPE on the extent of muscular asymmetry during function might contribute to clarifying whether an early treatment of UPCB with RPE should be recommended.
This study aimed at evaluating the AT and MM muscle activity of children with UPCB before and after RME by means of sEMG and a standardized EMG sampling protocol. The null hypotheses to be tested were: the UPCB patients do not present more asymmetric AT and MM muscle activity compared to UPCB-free controls during standardized tasks; and
maxillary expansion does not determine a more symmetric activation of AT and MM muscles during functional tasks.
20 | P a g .
3.1 Materials and methods
3.1.1 Study sample
Twenty-nine children with UPCB (UPCB-group: 13 males, 16 females, mean age ± SD = 9.6 ± 1.6 years) and 40 UPCB-free controls (Control-group: 17 males, 23 females; mean age 10.5 ± 1.1 years) seeking an orthodontic consultation were recruited consecutively. For both groups, exclusion criteria were genetic or
congenital abnormalities, craniofacial anomalies, systemic diseases affecting growth and development, clinical signs or symptoms of TMD (Schiffman et al., 2014), reporting of oral parafunctions (Schiffman et al., 2014), and previous or current orthodontic treatment. Inclusion criteria were an Angle Class I relationship, presence of the four first permanent molars, mixed dentition stage, and the absence of tooth mobility or decayed teeth. The experimental group included subjects with UPCB and lateral shift towards the UPCB side as assessed by Dawson’s manoeuvre (Dawson, 1995).
The control group included subjects without UPCB. Parents or guardians received information about the research protocol and signed an informed consent. The research protocol was designed in accordance with The Code of Ethics of the World Medical Association (Declaration of Helsinki) for experiments involving humans and was reviewed and approved by the Research Ethics Board (protocol 22616).
3.1.2 Rapid Maxillary Expansion
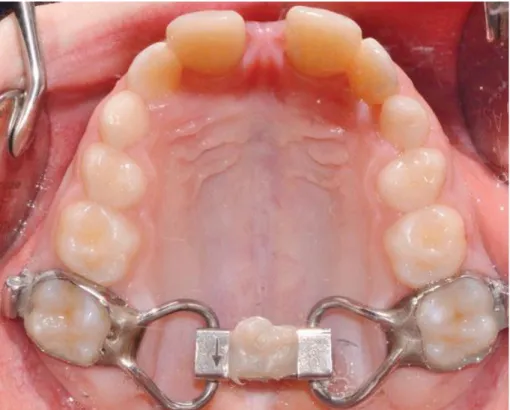
All subjects of the UPCB group were treated with a two-band palatal expander and rapid maxillary expansion (RME, Figure 3.1) (Martina et al., 2012). The appliance was banded to the maxillary first permanent molars and placed using glass ionometer cement (Multi-Cure Glass ionomer Cement; Unitek, Monrovia, CA, USA). The screw was initially turned eight times (2.0 mm) at chair side 2 hours after curing. Thereafter, the patients’ parents were trained to turn the screw three times per day (0.75 mm). During the expansion phase, subjects were monitored once a week. The screw was activated until a 2-mm molar transverse overcorrection was achieved. After the active expansion phase, the screw was locked with light-cure flow composite resin (Premise Flowable; Kerr Corporation, Orange, CA, USA). The active treatment (expansion)
21 | P a g .
ranged between 10 and 16 days. The patients wore the appliance as fixed retainer for 6 months.
Figure 3.1. Two-band palatal expander at the end of the expansion phase
3.1.3 Data Collection
The EMG activity of the AT and MM of both sides (left end right) was recorded at baseline after recruitment (T0) for both the UPCB and Control-group. For the UPCB group, EMG activity was recorded also when the UPCB was corrected (T1), and 6 months after when the appliance was removed (T2). EMG indices for both static and dynamic tests were computed at each time point.
3.1.4 Sample size calculation and statistical analysis
A sample size calculation was performed before recruitment. The primary outcome measure of this study was the POC medium index. Based on a previous investigation (12), it was assumed that a difference in POC medium values of 5 per cent (SD = 4.55 per cent) between the UPCB and the Control-group could be considered of clinical
22 | P a g .
relevance. A sample including 21 subjects per group was sufficient to detect between-group differences in POC medium (α = 0.05 and 1 − β = 0.9).
The Shapiro–Wilk test was used to check whether data were normally distributed. Mean and standard deviation (SD) for data distributed normally, and median with first and third interquartile range for data not normally distributed were calculated.
Between-group differences in standardized EMG indices, except ASIM and SPM, were tested by means of an unpaired t-test or Mann–Whitney U test for between-group comparisons. Repeated measures ANOVA or the Friedman test was used to test the effect of orthodontic treatment on EMG indices (POC AT, POC MM, Tc, IMPACT, SMI) and to detect differences between the time points in the UPCB group. The post hoc Tukey’s test with Bonferroni’s correction or the Wilcoxon signed-rank test was used. For FREQ, the differences between the crossbite side minus the non-crossbite side, in the UPCB group, and between the right side minus the left side in the Control-group, were calculated. This variable, normally distributed, was analyzed for each group and for each time point by means of a paired t-test for within-group
comparisons and by means of an unpaired t-test for between-group comparisons. ASIM and SPM were reported as frequencies. ASIM and SPM values were used to categorize participants in two groups (symmetric and asymmetric) based on normative values (symmetric: −10 per cent ≤ ASIM ≤ +10 per cent; asymmetric: ASIM ≥ +10 per cent or ASIM ≤ −10 per cent; symmetric: SPM > 70 per cent; asymmetric: SPM < 70 per cent). A chi-squared test was performed to examine whether the distribution of ASIM and SPM categories was similar between the study groups. Moreover, for patients that showed symmetrical jaw muscle activity, the prevalent side was recorded, and a chi-squared test was done to assess whether there was an association between the side of prevalent muscular activity and the side of the UPCB (UPCB group) at both T0 and T2.
Standard statistical software package (SPSS version 22.0, SPSS IBM, Armonk, NY, USA) was used for statistical analysis.
23 | P a g .
3.2 Results
3.2.1 EMG indices at baseline: within-group and between-group comparisons
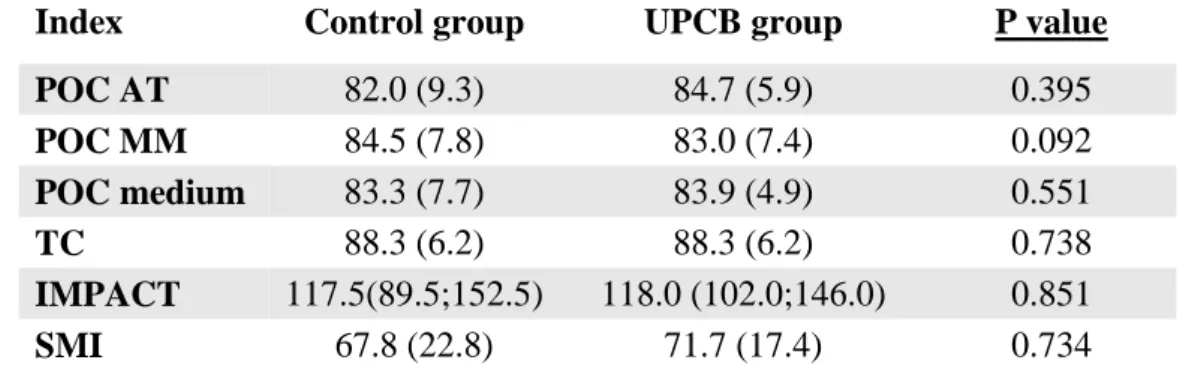
All the indices of the static tests (POC, TC, IMPACT) did not differ between groups at T0 (Table 3.1). Based on the assessment of ASIM values, 20 out of 29 patients from the UPCB group and 29 out of 40 individuals presented symmetric EMG activity. The ASIM index was not associated with the presence of UPCB (P = 0.749). During the chewing tasks, SMI did not differ between the two groups (Table 3.1); moreover, 19 out of 29 patients in the UPCB group and 25 out of 40 individuals had a side of prevalent mastication (SPM). The chi-square test showed that SPM was independent from the presence of the UPCB (P = 0.736).
Finally, FREQ (T0) was not different both between sides (UPCB: UPCB side 1.6 ± 0.2 Hz; no UPCB side 1.6 ± 0.3 Hz—P=0.052; Control-group: Right 1.4 ± 0.3 Hz; Left 1.5 ± 0.3 Hz—P = 0.072) and between groups (P = 0.614).
Table 3.1: Standardized EMG indices of control and UPCB group at T0. Values are expressed in
%, mean and standard deviation (SD), for data distributed normally and median with 1st and 3rd interquartile for data not distributed normally. For all variables, no significant differences were found.
3.2.2 EMG indices in the UPCB group before and after orthodontic treatment ( T0-T2)
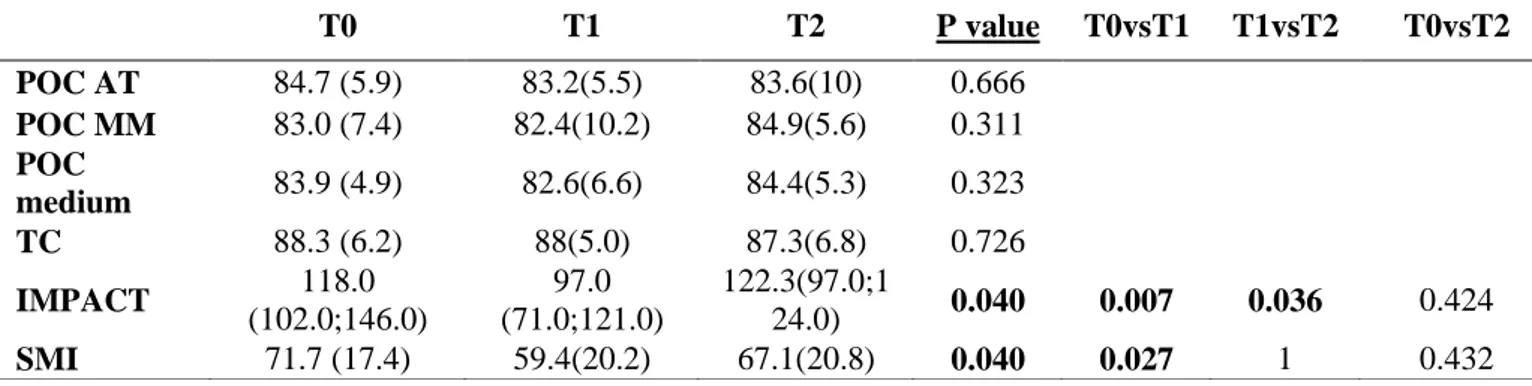
POC and TC values did not change significantly throughout the three time points of the study (All P > 0.05; Table 3.2). IMPACT changed significantly with time (P = 0.040); it decreased at T1 (P = 0.007), and returned to baseline values at T2 (P = 0.424).
Index Control group UPCB group P value
POC AT 82.0 (9.3) 84.7 (5.9) 0.395 POC MM 84.5 (7.8) 83.0 (7.4) 0.092 POC medium 83.3 (7.7) 83.9 (4.9) 0.551 TC 88.3 (6.2) 88.3 (6.2) 0.738 IMPACT 117.5(89.5;152.5) 118.0 (102.0;146.0) 0.851 SMI 67.8 (22.8) 71.7 (17.4) 0.734
24 | P a g .
Table 2: Standardised EMG indices of UPCB group at T0, T1, T2. Values are expressed in %, mean and standard deviation (SD) (for data distributed normally) and median with 1st and 3rd interquartile (for data not distributed normally) are reported. Bold text indicates statistically significant differences between time points. Post hoc tests with Bonferroni’s correction was used.
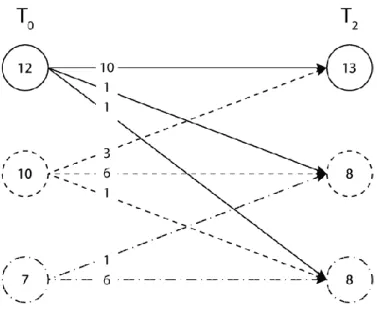
The ASIM categories varied considerably over the three time points (Figure 3.1).
Figure 3.1. Changes in the asymmetry index (ASIM) 6 months after UPCB correction (T2). The numbers of subjects are reported. A solid line indicates an asymmetric
muscular activity coincident with the side of the PCB. A dashed line indicates symmetric muscular activity. A dot-dash line indicates an asymmetric muscular activity not
coincident with the side of the PCB.
SMI varied significantly across the time points (P = 0.040). It decreased immediately after the PCB correction (T1), indicating a greater asymmetry of the chewing pattern, and returned to values similar to the baseline at T2. SPM varied considerably across the time points in children with UPCB (Figure 3.2).
T0 T1 T2 P value T0vsT1 T1vsT2 T0vsT2 POC AT 84.7 (5.9) 83.2(5.5) 83.6(10) 0.666 POC MM 83.0 (7.4) 82.4(10.2) 84.9(5.6) 0.311 POC medium 83.9 (4.9) 82.6(6.6) 84.4(5.3) 0.323 TC 88.3 (6.2) 88(5.0) 87.3(6.8) 0.726 IMPACT 118.0 (102.0;146.0) 97.0 (71.0;121.0) 122.3(97.0;1 24.0) 0.040 0.007 0.036 0.424 SMI 71.7 (17.4) 59.4(20.2) 67.1(20.8) 0.040 0.027 1 0.432
25 | P a g .
Figure 3.2. Changes in the side of prevalence mastication index (SPM) 6 months
after UPCB correction (T2). The numbers of subjects are reported. A solid line indicates a prevalent side of mastication coincident with the side of the PCB. A dashed line indicates a symmetric mastication. A dot-dash line indicates a prevalent side of mastication not coincident with the side of the PCB.
FREQ did not differ significantly between the UPCB side and the no UPCB side (T0: UPCB side 1.6 ± 0.2 Hz; no UPCB side 1.6 ± 0.3 Hz—P=0.052; T1: UPCB side 1.5 ± 0.3 Hz; no UPCB side 1.5 ± 0.4 Hz—P = 0.773); T2: UPCB side 1.5 ± 0.3 Hz; no UPCB side 1.5 ± 0.2 Hz—P = 0.276) and between the time points (P = 0.255).
26 | P a g .
3.3 Discussion
The present study investigated whether individuals with UPCB have more asymmetric
activity of the jaw muscles, and assessed whether the correction of UPCB contributes to more symmetric jaw muscle activity during standardized functional tasks. The findings of this study confirm the null hypotheses, that is patients with UPCB do not present more asymmetric AT and MM muscle activity as compared to UPCB-free controls, and that maxillary expansion does not determine a more symmetric activation of both AT and MM. In this study, an innovative EMG approach was used. This method, through the standardization of the EMG signals and normalizing the data as a percentage of the MVC effort on cotton rolls, reduces the biological noise, allows comparisons between subjects (Castroflorio et al., 2008) and is widely used and validated in normal subjects and in patients with TMD (Botelho et al., 2010; Castroflorio et al., 2008; De Felício et al., 2009; Ferrario et al., 1999; Rongo et al., 2017). The data reveal that EMG indices (POC, TC, IMPACT and SMI) were similar between groups at baseline (T0). Also, the asymmetry of muscle contraction was not associated with the presence of UPCB (ASIM index and SPM index) both in static and dynamic tasks. This suggests that a crossbite does not contribute to more asymmetric activity of the masticatory muscles during functional tasks.
Hence, all the indices used to assess the symmetry in the activity of masticatory muscles showed consistent results, reinforcing the concept that the presence of a UPCB in children is not associated with asymmetric muscular activity during both clenching and chewing. The mean indices (POC, TC and SMI) measured in the current study for both groups were lower than the mean values reported in literature for healthy adults (i.e. POC = 86.6, Tc = 91 and SMI = 79.2) (De Felício et al., 2009; Ferrario et al., 1999; Ferrario et al., 2000; Ferrario et al., 2006), suggesting that adolescents (our sample included individuals younger than 13 years old) may have slightly more asymmetric activity of the masticatory muscles than adults. Developmental changes in musculotendinous structures and jaw muscle compartments may account for this slight discrepancy. Indeed, the adaptation of jaw muscles to functional and non-functional demands may be dependent on dental development and diet, which differ substantially between children and adults (Cioffi et al., 2012). However, further studies are needed to address this point. Our data reveal that the EMG indices (POC, TC, IMPACT and SMI) were similar between groups at baseline (T0). Also, the asymmetric activity of muscles during both static and dynamic tasks was not associated with the presence of UPCB. This suggest that a UPCB does not contribute to more asymmetric activity of the masticatory
27 | P a g .
muscles during functional tasks, and that a certain degree of asymmetric activation of jaw muscles during function has to be considered a physiological characteristic of the
stomatognathic system (Ferrario et al., 1999; Ferrario et al., 2000; Ferrario et al., 2006). Our indices cannot be compared with other studies, since they were never used before in children. Nonetheless, many studies evaluating the contraction pattern of masticatory muscles of children with and without PCB by using conventional EMG assessments reported
inconsistent data with questionable clinical relevance (Alarcón et al., 2000; Kecik et al., 2007; Lenguas et al., 2012; Martìn et al, 2012; Piancino et al., 2016). Some studies concluded that children with UPCB have greater asymmetry in muscle activity than normocclusive children, finding differences of just 2 μV between groups (Kecik et al., 2007); or found one statistical significant difference among several statistical tests (Martìn et al, 2012); on the other hand some studies did not find any differences between the two groups (Alarcón et al., 2000; Lenguas et al., 2012).
Maxillary expansion did not significantly affect POC and TC indices. ASIM and SPM indices were highly variable across the time points. These results are in contrast with other studies analysing the effects of PCB correction on masticatory muscle activity (Andrade et al., 2010; Arat et al., 2008; De Rossi et al., 2009; Kecik et al., 2007; Maffei et al., 2014; Martìn et al, 2012; Piancino et al., 2016; Tsanidis et al., 2016).
A systematic review summarizing the functional changes occurring after an early treatment of UPCB has recently suggested that orthodontic treatment of UPCB could improve both
occlusal contact quality and occlusal stability (Tsanidis et al., 2016). However, whether the correction of UPCB contributes to a more symmetric activation of jaw muscles during function is still questionable. Indeed, the increased symmetry of the muscle activity reported in some studies, which ranges between 20 and 50 μV (Andrade et al., 2010; Arat et al., 2008; De Rossi et al., 2009; Kecik et al., 2007; Maffei et al., 2014; Martìn et al, 2012; Piancino et al., 2016), although statistically significant, must be considered of limited clinical relevance because of discrepancies in research designs, inclusion criteria (i.e. bilateral PCB or no functional shift) (Arat et al. 2008; De Rossi et al., 2009; Maffei et al., 2014), treatment duration (De Rossi et al., 2009; Kecik et al., 2007; Maffei et al., 2014; Piancino et al., 2016), treatment protocol (De Rossi et al., 2009; Kecik et al., 2007; Martìn et al, 2012; Piancino et al., 2016) and EMG assessment (Andrade et al., 2010; Arat et al., 2008; De Rossi et al., 2009; Kecik et al., 2007; Maffei et al., 2014; Martìn et al, 2012; Piancino et al., 2016). In spite of this, in our study the EMG records were performed only after the expansion phase, without the interference of any other appliances (braces, retention plate), and the follow up of the
28 | P a g .
patients for just 6 months avoided any interference by the growth in the muscular function due to the brief period assessed (Sabashi et al., 2009). Finally, Di Palma et al. (Di Palma et al., 2017) used the same standardized indices in a group of 21 children with UPCB to evaluate the modifications of the RME on the AT and MM activity. They included only children that did not have an asymmetrical muscular activation and they found that 3 months after the
correction achieved with the RME, patients did not show any significant change in the EMG activity. This study used a four bands hyrax that is more bulky than the two-band palatal expander used in our study, however, in the middle term there were not differences in the EMG activity due to the appliance design between the two studies. Immediately after UPCB correction (T1), IMPACT and SMI decreased significantly. The transient decrease in
muscular recruitment (IMPACT) and the increased asymmetry during the chewing tasks (SMI) might be due to many factors, such as tooth soreness caused by the stimulation of the periodontium of the posterior teeth during expansion, the lack of adaptation of the
neuromuscular system to the new occlusal condition, and the discomfort created by sudden changes in the maxilla-mandibular relationship (Dong et al., 2008). In fact, occlusal
instability, modifications in dentition, and the repositioning of bones or skeletal configuration may cause transient effects on jaw muscles (Leung et al., 2001). The neuromuscular
adaptation of the stomatognathic system to the new mandibular position does not occur immediately after treatment but only when a satisfactory occlusal engagement is achieved (Martín et al., 2012; Pirttiniemi, 1994; Sonnesen et al., 2007).
Our data suggest that an asymmetric activation of the jaw muscles during functional tasks is an ordinary aspect in children. It must be stressed that all body segments present with a certain degree of asymmetry, which should be regarded as a physiological characteristic of each individual. Healthy subjects should not be expected to have a perfect symmetric activation of masticatory muscles, which is a man-made construct, during normal function (Dong et al., 2008). This was shown in several studies analyzing healthy subjects without signs of dysfunction, in which the standardized indices POC and TC were never close to 100 per cent (Ferrario et al., 1999; Ferrario et al., 2000; Ferrario et al., 2006; De Felicio et al., 2009).
The aim of this study was testing the effect of cross bite with mandibular side shift on masticatory muscle asymmetry. This occlusal condition is characterized by a discrepancy between centric occlusion (CO) and centric relation (CR), which determines an asymmetrical position of the condyles in the glenoid fossa (Pinto et al., 2001). Hence, in the current study, the clinical manoeuvre described by Dawson (Dawson, 1995) was used to select study
29 | P a g .
participants. This clinical manoeuvre is commonly used to distinguish between functional and morphologic crossbite, and to detect the CR position and the discrepancy between CO and CR. In this study, all participants had a posterior unilateral crossbite in CO but not CR, with a shift CR–CO. This study has a few limitations. First, most of the EMG indices were computed using the MVC. MVC is dependent on the participant’s compliance. Although all the
participants were verbally encouraged during the experimental tasks, MVC values recorded may be slightly different across the time points. However, the RMS algorithm, used for the computation of the indices, analyzed the 3 seconds of the test with the highest EMG
amplitude, providing a normalized estimate of the MVC. Therefore, it may be assumed that variations of MVC across the conditions did not significantly affect the outcome measures. Second, in this study, the dental contacts were not recorded, although interferences between the upper and dental arches were reported to influence the EMG indices (Augusti et al., 2015). Third, ASIM and SMI analysis were performed using adult normative values. This may raise questions concerning the validity of the analysis and the interpretation of the data. However, on the other hand there is no evidence suggesting that the threshold of muscular asymmetry is or should be different between adults and children.
30 | P a g .
3.4 Conclusions
In conclusion, the present study has shown that children with and without UPCB present slight asymmetric activity of AT and MM during functional tasks and these muscles of children with UPCB are not more asymmetric than healthy children without crossbite. Furthermore, the treatment of UPCB with RME does not reduce the asymmetry of MM and AT activity; hence, the symmetrization of the muscular activity cannot be an indication of maxillary expansion. Early treatment of UPCB by maxillary expansion should not be advocated to promote a more symmetric activation of the MM and AT in the short-medium term. Longitudinal studies with a term follow-up are still required to evaluate the long-term effects of the treatment.
31 | P a g .
CHAPTER 4
Evaluation of masticatory muscle activity in patients with juvenile
idiopathic arthritis (JIA)
Juvenile idiopathic arthritis (JIA) represents the most common childhood rheumatic disease. It is characterized by the chronic inflammation of one or more joints, onset before 16 years and a minimum duration of 6 weeks (Petty et al., 2004). The prevalence is of 1 in 1000 children worldwide aged 0–15 years (Schneider and Passo, 2002). The pathogenesis is poorly understood, but interaction between environmental (infection, trauma, immunological phenomena) and genetic factors has been proposed (Calabro et al., 1976; Calabro, 1986). All joints may be affected, including the temporomandibular joint (TMJ), known as “the forgotten joint”. It may be the first joint affected both uni- and bilaterally, or may be affected during the course of JIA (Ringold and Cron, 2009). The frequency of TMJ involvement varies from 17 to 87% depending on subtypes involved, diagnostic criteria reported and ethnicity (Cannizzaro et al., 2011; Kuseler et al., 1998; Pedersen et al., 2001; Ringold and Cron, 2009; Twilt et al., 2006; Weiss et al., 2008). JIA can interfere with the craniomandibular joint and muscle function (Karhulahti et al., 1993). JIA is characterized by destructive changes in the mandibular condyle that seem to lead to a change in mandibular position. A reduced vertical condylar growth leads to a posterior rotation of the mandible, mandibular retrognathia (Twilt et al., 2008), micrognathia (Arvidsson et al., 2010a, 2010b; Pearson and Ronning, 1996) and dental malocclusion with a significantly greater prevalence of anterior open bite (Kjellberg, 1995). Children with TMJ arthritis may have restricted condylar motion in the open-mouth position (Argyropoulou et al., 2009), and/or reduced condylar motion at maximally opened mouth (Stabrun et al., 1987). Furthermore, they could be affected by jaw pain, dysfunction, facial asymmetry, psychological disturbances and a reduced quality of life (Bakke et al., 2001; de Carvalho et al., 2012; Engstrom et al., 2007; Ringold and Cron, 2009). Muscle weakness may contribute to craniofacial growth deviations probably in association with poor function (Kreiborg et al., 1990; Lindehammar and Backman, 1995; Lindehammar and Sandstedt, 1998; Stabrun et al., 1987;Pearson and Ronning, 1996). Many children with JIA have reduced muscle
32 | P a g .
strength and they show structural and immunological changes in muscles such as the presence of inflammatory cells and expression of MHC class II on muscle fibers that may be a sign of inflammatory myopathy (Lindehammar and Lindvall, 2004). Muscle strength in JIA has been assessed in few studies with different methods, e.g., an isokinetic dynamometry, a hand-held dynamometry (HHD), ultrasound and a computerized dynamometer (Bröstrom et al., 2004; Giannini and Protas, 1993; Hedengren et al., 2001; Lindehammar and Backman, 1995; Vostrejs and Hollister, 1988). These studies have suggested that children with JIA have reduced muscle strength. On the other hand, Öberg et al., (Öberg et al., 2004) reported no difference in muscle strength between children with JIA and healthy controls. Muscle strength in children with JIA can be near to normal when the disease is not active (Saarinen et al., 2008). Among the studies that analyzed the masticatory muscle activity in JIA patients, there are no works evaluating the electromyographic (EMG) activity.
There are not studies using EMG standardized protocols to assess the activity of masticatory muscle in children with JIA but assessing the symmetry in muscle activity could give information on the growth pattern (Iodice et al., 2013). Hence, the aim of this study was to evaluate the muscular activity of masticatory muscles in subjects with JIA compared to subjects without JIA to evaluate any differences in terms of muscular asymmetry and/or the overall muscular activity. The null hypothesis is that patients with JIA do not present more asymmetric AT and MM muscle activity as compared to healthy controls.
33 | P a g .
4.1 Materials and methods
4.1.1 Study sample
This research protocol was approved by the Ethical Committee of University of Naples “Federico II” of Naples (protocol 16918), in accordance with The Code of Ethics of the World Medical Association (Declaration of Helsinki) for experiments involving humans. In this study, 50 patients affected by JIA (JIA group: 10 males, 40 females, mean age±SD = 11.12±2.85 years) and 69 healthy subjects (CTR group: 30 males, 39 females, mean age±SD = 10.0±1.7 years) seeking an orthodontic consultation were recruited at the Department of Neuroscience, Section of Orthodontics and Temporomandibular Disorders of the University of Naples, Federico II.
The sample was divided in four subgroups:
1. patients with JIA with asymmetry (Symmetric JIA) 2. patients with JIA without asymmetry (Asymmetric JIA)
3. patients with posterior crossbite with functional sliding without JIA (UPCB)
4. healthy control patients without crossbite and without JIA (Healthy) The inclusion criteria, for the first and second subgroups were:
JIA diagnosis according to the ILAR criteria for study groups the age range between 8 to 16 years old
The exclusion criteria for all participants were: incomplete medical records
presence of congenital/ acquired facial anomalies (eg, hemifacial microsomia, cleft lip/palate, Treacher-Collins syndrome, TMJ ankylosis) history of facial fractures
previous intra-articular TMJ interventions (eg, steroid injections, operations) inability to verbalize or indicate pain or discomfort (eg, developmental
delay)
presence of medical comorbidities not allowing for a comprehensive clinical examination (eg, severe scoliosis limiting neck movement)
orthodontic treatment in course or within the past 12 months.
Patients with JIA were recruited from the Clinic of Rheumatology of the Paediatric Department at the University of Naples “Federico II” and were diagnosed by a paediatric
34 | P a g .
rheumatologist according to the ILAR criteria. During the first visit, age, gender, subtype of JIA, disease onset date, year of diagnosis and administered systemic therapy were collected.
4.1.2 Anamnesis and clinical examination
A specialist in orofacial pain and temporomandibular disorders visited all patients according to the DC/TMD protocol (Schiffman et al., 2014) and collected all data.
The clinical examination according to the DC/TMD protocol included the following: Opening pattern: the examiner asked the patient to open slowly three times,
observing from a position directly in front of the patient. The opening patterns were recorded as straight if there was no or minimally perceptible deviation (<2mm) during mouth opening; corrected deviation if the mandible exhibited a perceptible deviation (≥2mm) to the right or left but returned to the midline before or upon reaching the maximum unassisted opening; uncorrected deviation if the deviation of the mandible was of ≥2mm to either the right or the left from the midline with maximum unassisted opening. Opening movements: measurements were taken between the incisal edges of
the maxillary and mandibular reference teeth. Pain free opening: the patient opened without feeling pain; maximum unassisted opening: the patient opened as wide as possible, even if feeling pain and the examiner asked the patient about presence and location of any pain produced by this procedure; maximum assisted opening: the patient opened maximally, and the examiner helped the patient to open wider, asking about any pain produced by this procedure. In paediatric patients the cut-off value for restricted mouth opening was ≤ 40 mm (Müller et al., 2013; Zwir et al., 2015).
Lateral and protrusive movements: right and left lateral excursion, and protrusion. During these movements, the examiner asked the patient to move the mandible as far as possible in each direction, even if it was painful, and recorded presence and location of any reported pain.
TMJ noises during jaw movements: using palpation the examiner recorded joint noises during opening, closing, lateral and protrusive movements. The
35 | P a g .
patient also reported whether they heard or felt a joint sound. Click: a distinct noise of brief and very limited duration, with a clear beginning and end. Crepitus: a noise that is continuous, over a longer period of jaw movement. Muscle and TMJ pain with palpation: Pain on palpation of the masseter and temporalis muscles and the TMJ were assessed. The examiner pressed on specific sites using the pad of one finger with standardized pressure: 1.0 kg force over the nine sites of each muscle and around the lateral pole of the TMJ, and 0.5 kg over the lateral pole of the TMJ.
The examiner evaluated molar and canine relationship, on the right and on the left side, overbite, overjet and presence of posterior and anterior crossbite.
Finally, an experienced orthodontist examined the patients using frontal facial photographs to evaluate the presence of chin deviation and level of asymmetry. A picture, with a ruler for the calibration on the background, was taken with the patient in the upright sitting posture with teeth in centric relation and lips at rest. For each patient, on the photograph, the facial midline (a perpendicular to the inter-pupillary plane passing for the glabella) was identified and the direction and severity of chin deviation was recorded. The orthodontist recorded a chin deviation when the chin shift from the facial midline was >2 mm to right or left side. The photographs did not present patient name and were recorded by an ID number, hence the observer did not know patient name and did not know the findings of the clinical examinations.
4.1.3 EMG assessment
The activity of masseter (MM) and temporalis anterior (TA) muscles of both sides (left and right) was recorded during standardized tasks by means of sEMG according to the EMG protocol previously described.
4.1.4 Sample size calculation and statistical analysis
A sample size calculation was performed before recruitment. The primary outcome measure of this study was the POC medium index. Based on a previous investigation (Ferrario et al., 2000), it was assumed that a difference in POC medium values of 5% (SD=4.55%) between two groups could be considered of clinical relevance. A sample
36 | P a g .
including 21 subjects per group was sufficient to detect between-group differences in POC medium (α=0.05 and 1-β=0.9).
The Shapiro Wilk test was used to check whether data were normally distributed. Mean and standard deviations (SD) for data distributed normally, and frequencies and percentages for nominal data were calculated.
Between-group differences in standardized EMG indices, except ASIM, ATTIV and TORS, were tested by means of an unpaired t test. Subgroup comparisons for the same EMG indices were performed by means of one-way analysis of variance (one-way ANOVA).
ASIM, ATTIV and TORS were reported as frequencies. ASIM and TORS, values were used to categorize participants in three groups (symmetric -10%≤ASIM/TORS≤+10%; prevalence of right activity ASIM/TORS≥+10%, prevalence of left activity ASIM/TORS≤-10%) based on normative values. Also, the ATTIV index was used to categorize patients in three groups (symmetric -10%≤ATTIV≤+10%; prevalence of masseter activity ATTIV≥+10%, prevalence of temporalis activity ATTIV≤-10%). A Chi squared test was performed to examine whether the distribution of ASIM, TORS and ATTIV categories was similar between the study groups.
Standard statistical software package (SPSS version 22.0, SPSS IBM, Armonk, NY, USA) was used for statistical analysis.
37 | P a g .
4.2 Results
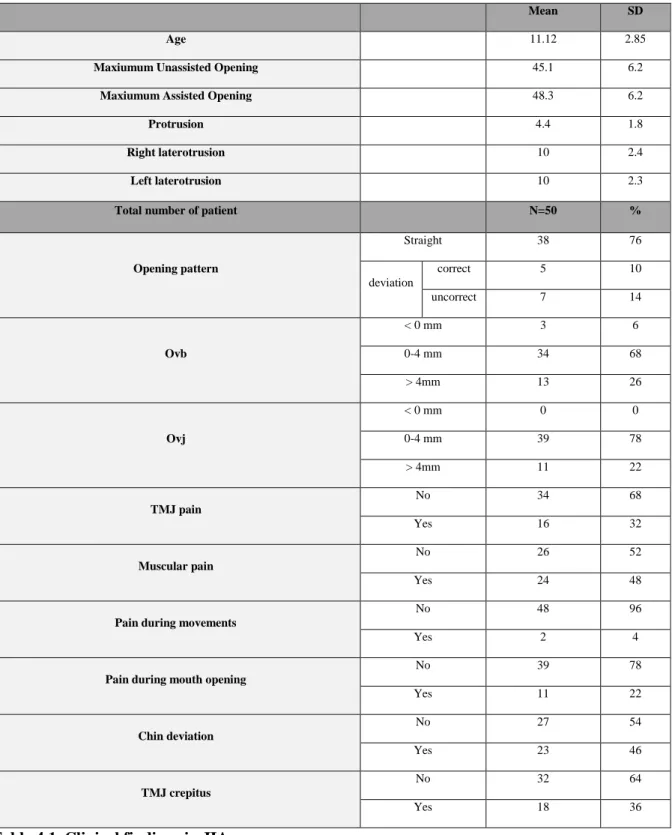
Only the 50 with JIA were evaluated according to the DC/TMD protocol (Schiffman et al., 2014) and the results are reported in Table 4.1. The clinical examination showed that out of the 50 initial patients, 23 presented chin deviation and 18 had crepitus ( Table 4.1).
Mean SD
Age 11.12 2.85
Maxiumum Unassisted Opening 45.1 6.2
Maxiumum Assisted Opening 48.3 6.2
Protrusion 4.4 1.8
Right laterotrusion 10 2.4
Left laterotrusion 10 2.3
Total number of patient N=50 %
Opening pattern Straight 38 76 deviation correct 5 10 uncorrect 7 14 Ovb < 0 mm 3 6 0-4 mm 34 68 > 4mm 13 26 Ovj < 0 mm 0 0 0-4 mm 39 78 > 4mm 11 22 TMJ pain No 34 68 Yes 16 32 Muscular pain No 26 52 Yes 24 48
Pain during movements
No 48 96
Yes 2 4
Pain during mouth opening
No 39 78 Yes 11 22 Chin deviation No 27 54 Yes 23 46 TMJ crepitus No 32 64 Yes 18 36