Politecnico di Milano
Polo di Como
Scuola di Ingegneria dell’Informazione
Laurea Specialistica in Ingegneria Informatica
An Algorithm Derived from the Literature to
Detect Ischemia on ECG Recordings and
Implemented by MATLAB
Tutor universitario: Prof. Giuseppe Pozzi
Elaborato finale di WANG Jingxuan
matr. 851663
INDEX
1. Introduction...6
1.1 Description of the problem... 6
1.2 Arithmia and ischemia... 12
1.3 The ECG signal...12
1.4 Research relevance...14
1.5 Tesina outline... 15
2. State of the Art... 17
2.1 Research on QRS complex detection...17
2.2 Research on ST segment detection... 17
2.3 Research on T wave detection... 19
3. Signal Preprocessing...20
3.1 Noise contained in ECG waveform... 20
3.1.1 Baseline drift...20
3.1.2 Powerline interference... 20
3.1.3 EMG interference...21
3.2 Wavelet transform introduction... 21
3.3 The principle of wavelet transform...22
3.3.1 Wavelet Transform definition... 22
3.3.2 Discrete wavelet transform (DWT)... 23
3.3.3 Mallat algorithm...24
3.4 Correcting baseline drift... 26
3.5 Removal of powerline and EMG interference...28
3.5.1 The principle of wavelet threshold denoising...28
4. ECG Feature Detection...31
4.1 QRS complex detection... 31
4.1.1 Extremum point detection and the boundary detection for QRS complex detection ...31
4.1.2 The singularity of wavelet detection...34
4.1.3 Wavelet transform for QRS complex detection... 36
4.2 T wave detection... 39
4.2.1 The local transform algorithm... 39
4.2.2 Wavelet transform for the T wave detection... 41
4.3 ST segment detection...43
4.3.1 ST segment morphology... 43
4.3.2 The offset direction of the ST segment...44
4.3.3 The curve type of the ST segment... 45
4.3.4 The concave-convex direction of the ST segment...46
4.3.5 The slope direction of the ST segment...47
4.3.6 Morphological recognition of the ST segment... 47
5.2 Confusion matrix... 51
5.3 Diagnostic results...53
6. Conclusions...54
6.1 Further reasearch activities... 56
Abstract
It has been more than 100 years since Einthoven used electrocardiogram to diagnose in clinical medicine. During these years, the continuous development of ECG technology for human health and survival has made a great contribution. Electrocardiogram has also become the most important index to evaluate and diagnose the heart health condition of patients. In the processing of ECG signal analysis, the program has been developed on Matlab, based on the research of ECG processing technology. It not only can realize the ECG signal preprocessing, feature detection and analysis, but also make a simple medical report after reading the input ECG.
Firstly, based on multi-scale decomposition of ECG signal, wavelet approximation is applied to the signal and after an adaptive wavelet threshold denoising method, the original ECG signal is preprocessed.
Secondly, during feature detection of the electrocardiogram, wavelet transform method is improved in QRS complex detection. It makes use of not only wavelet coefficients, but also ECG signals to locate accurately the QRS complex. After QRS complex detection, the T wave is detected by the amplitude and the slope in certain section. This method works well for normal signals. For ST segment morphological analysis, a method is proposed. Once the ST segment analysis region is detected, the offset level, the curve type, the slope and the camber are adopted to the essential morphological features of the ST segment. Meanwhile, the classification of ST segment morphology is carried out gradually. This method can detect different shapes of the ST segment.
Finally, the ECG diagnosis of myocardial ischemia is achieved by a logical method with clinical knowledge: the logical method is like the way the physician observes the ECG recording, which is simple in principle, clear in clinical classification, effective in diagnostic realization. The evaluation of the results is measured by a confusion matrix which evaluates the precision of the algorithm in detecting ischemia in the ECG signal by some useful and common equations.
Sommario
Sono passati più di 100 anni da quando Einthoven utilizzava l'elettrocardiogramma per le diagnosi in medicina clinica. In questi anni, il continuo sviluppo della tecnologia ECG ha dato un grande contributo per la salute e la sopravvivenza umana. L'elettrocardiogramma è anche diventato l'indice più importante per valutare e diagnosticare le condizioni di salute del cuore dei pazienti. Nel processo di analisi del segnale ECG, il programma è stato sviluppato su MATLAB, basato sulla ricerca di tecnologia di elaborazione ECG. Non solo è in grado di realizzare la preelaborazione del segnale di ECG, rilevamento ed analisi della caratteristica, ma anche di creare un semplice referto medico dopo aver letto input ECG.
In primo luogo, sulla base della decomposizione multi-scala del segnale ECG, l'approssimazione wavelet viene applicata al segnale e dopo una analisi della riduzione di rumore della soglia wavelet adattativa, il segnale ECG originale è preelaborato.
In secondo luogo, durante il rilevamento delle caratteristiche dell'elettrocardiogramma, il metodo di trasformazione delle wavelet è migliorato nel rilevamento complesso QRS. Utilizza non solo i coefficienti wavelet, ma anche i segnali ECG per localizzare accuratamente il complesso QRS. Dopo la rilevamento complessa del QRS, l'onda T viene rilevata dall'ampiezza e dalla pendenza in determinata sezione. Questo metodo funziona bene per i segnali normali. Per l'analisi morfologica del segmento ST, viene proposto un metodo. Una volta rilevata la regione di analisi del segmento ST, il livello di offset, il tipo di curva, la pendenza e la camber sono adottati per le caratteristiche morfologiche essenziali del segmento ST. Nel frattempo, la classificazione della morfologia del segmento ST viene effettuata gradualmente. Questo metodo può rilevare forme diverse del segmento ST.
Infine, la diagnosi ECG dell'ischemia miocardica è realizzata da un metodo logico con conoscenza clinica: il metodo logico è come il modo in cui il medico osserva la registrazione ECG, che è semplice in linea di principio, chiara nella classificazione clinica, efficace nella realizzazione diagnostica. La valutazione dei risultati è misurata da una matrice di confusione che valuta la precisione dell'algoritmo nel rilevare l'ischemia nel segnale ECG mediante alcune equazioni utili e comuni.
Parole chiave: rilevamento ischemia, segnale ECG, rilevamento delle caratteristiche,
1. Introduction
1.1 Description of the problem
Measuring the number of dead people per year and the reason is one of the most important means – along with gauging how diseases and injuries are affecting people – for assessing the effectiveness of a country’s health system.
Cause-of-death statistics help health authorities determine the focus of their public health actions. A country where deaths from heart diseases and diabetes rise rapidly over a period of a few years, for example, may have a strong interest in starting a vigorous programme to encourage lifestyles to help prevent these illnesses. In the other words, they could pay much attention to the common reason that will cause death, and give more budget on that prevention.
According to the fact sheets from World Health Organization, of the 56.4 million deaths worldwide in 2015, more than half (54%) were due to the top 10 causes (Figure 1). Ischemic heart disease and stroke are the world’s biggest killers, accounting for a combined 15 million deaths in 2015. These diseases have remained the leading causes of death globally in the last 15 years.
Figure 1. Top 10 causes of death globally 2015
Ischemic heart disease, 8.76 Stroke, 6.24 Lower respiratory infections,3.19
Chronic obstructive pulmonary disease, 3.17 Trachea, bronchus, lung cancers, 1.69
Diabetes mellitus, 1.59
Alzheimer disease and other dementias, 1.54 Diarrhoeal diseases, 1.39
Tuberculosis, 1.37 Road injury, 1.34
communicable diseases, maternal causes, conditions arising during pregnancy and childbirth, and nutritional deficiencies. By contrast, less than 7% of deaths in high-income countries were due to such causes.
According to Figure 2, 3, 4 and 5, non-communicable diseases (NCDs) caused 70% of deaths globally, ranging from 37% in low-income countries to 88% in high-income countries. Through these sheets, the leading causes of NCD deaths in 2015 were absolutely is the Ischemic heart disease.
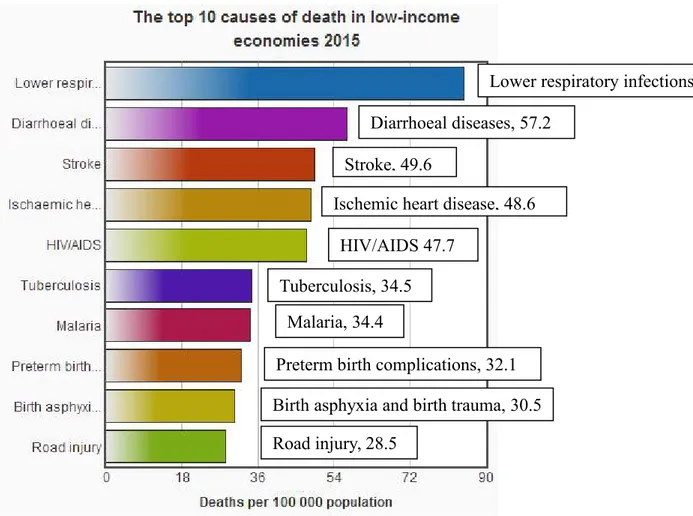
Figure 2. The top 10 causes of death in low-income economies 2015 Ischemic heart disease, 48.6
Stroke, 49.6
Lower respiratory infections,84.9
Birth asphyxia and birth trauma, 30.5 HIV/AIDS 47.7
Malaria, 34.4
Preterm birth complications, 32.1 Diarrhoeal diseases, 57.2
Tuberculosis, 34.5
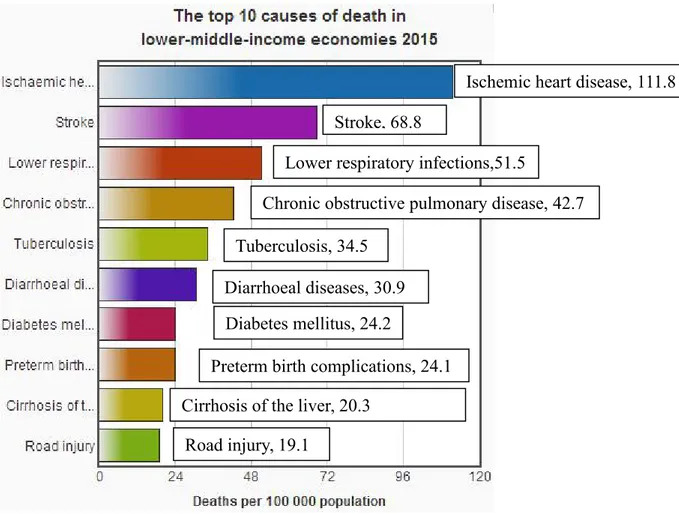
Figure 3. The top 10 causes of death in lower-middle-income economies 2015
Ischemic heart disease, 111.8 Stroke, 68.8
Lower respiratory infections,51.5
Chronic obstructive pulmonary disease, 42.7
Cirrhosis of the liver, 20.3 Diabetes mellitus, 24.2
Preterm birth complications, 24.1 Diarrhoeal diseases, 30.9
Tuberculosis, 34.5
Figure 4. The top 10 causes of death in upper-middle-income economies 2015
Ischemic heart disease, 133.4 Stroke, 120.9
Lower respiratory infections,26.5
Chronic obstructive pulmonary disease, 50.4 Trachea, bronchus, lung cancers, 33.3
Diabetes mellitus, 20.6
Alzheimer disease and other dementias, 19.5
Stomach cancer, 17.4 Liver cancer, 18.2 Road injury, 19.5
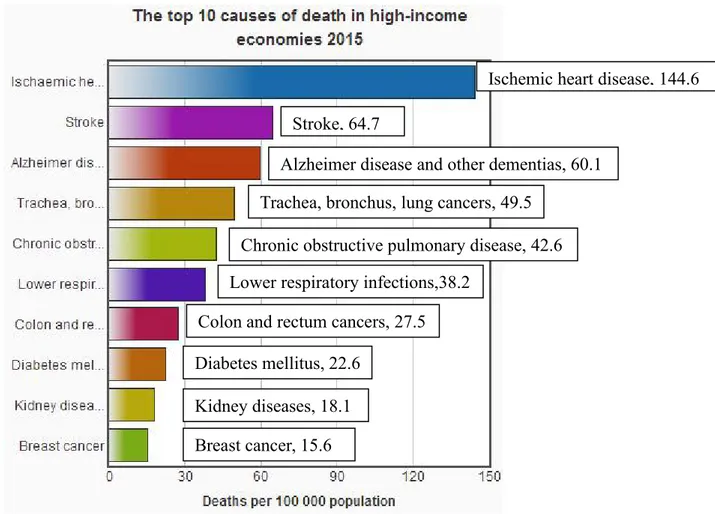
Figure 5. The top 10 causes of death in high-income economies 2015
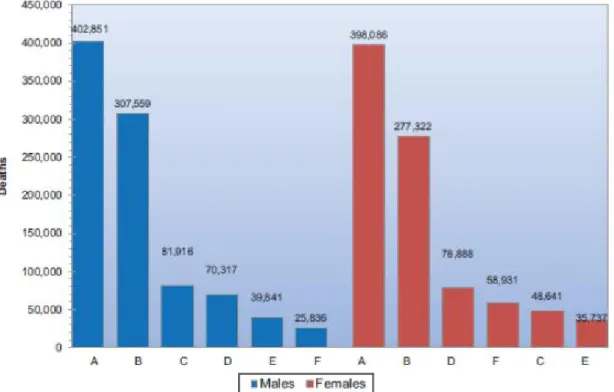
In addition, according to the report from American Heart association and National Vital Statistics Report (Figure 6), heart disease, which refers to several types of heart conditions, is No.1 leading cause of death for both men and women. In the United States, that’s 1 in every 4 die from heart disease, someone has a heart attack every 42 seconds. Each minute, someone in the United States dies from a heart disease-related event. Coronary heart disease is the most common, worst type of Cardiovascular disease (CVD) which is a class of diseases that involve the heart or blood vessels, killing about 800,937 people in 2013 (Figure 7).
Ischemic heart disease, 144.6 Stroke, 64.7
Lower respiratory infections,38.2
Chronic obstructive pulmonary disease, 42.6 Trachea, bronchus, lung cancers, 49.5
Diabetes mellitus, 22.6
Alzheimer disease and other dementias, 60.1
Colon and rectum cancers, 27.5
Kidney diseases, 18.1 Breast cancer, 15.6
Figure 6. Age-adjusted death rates for selected leading causes of death: United States, 1958-2014
Figure 7. CVD and other major causes of death (United States: 2013, Source: NCHS and NHLBI.). A indicates CVD; B, cancer; C, accidents; D, CLRD; E, diabetes; and F, Alzheimer’s disease
1.2 Arithmia and ischemia
One of the most common causes of CVD morbidity and mortality is ischemic heart disease (IHD). IHD occurs when the heart’s blood supply is blocked due to the buildup of fatty substances and cholesterol in the coronary arteries, causing their free-flowing passages to narrow. Such blockages inhibit oxygen and nutrient supplies to the heart muscles, hampering the functioning of the heart. Eventually, the affected heart dies, resulting in a heart attack. Myocardial ischemia is an intermediate condition in coronary artery disease during which the heart tissue is slowly or suddenly starved of oxygen and other nutrients. Eventually, the affected heart tissue will die and when blood flow is completely blocked to the heart, ischemia can lead to a heart attack. Additionally, acute myocardial infarction (AMI) is the total occlusion of a major coronary artery with a complete lack of oxygen and nutrients leading to cardiac muscle necrosis. Ischemia can be silent or symptomatic. According to the American Heart Association, a large numbers of Americans may have ischemic episodes without knowing it, it means at high risk of having a heart attack with no prior warning.
Chest pain called angina pectoris is the characteristic pain of IHD, also of Symptomatic ischemia. It is caused by atherosclerosis leading to stenosis (partial occlusion) of one or more coronary arteries. The American Heart Association estimates that nearly seven million Americans have angina pectoris, which occurs more frequently in women than in men.
An arrhythmia is an abnormal heart rhythm. It may feel like fluttering or a brief pause. Some are so brief, like a premature beat, a temporary pause that it doesn’t affect greatly on your overall heart rhythm. But if arrhythmia last longer, it can cause the heart rate to be too slow, too fast or erratic. Some arrhythmias don’t cause any symptoms, may be completely harmless. Others can make you feel lightheaded or dizzy, may be life-threatening. There are two basic types: One is the heart rate is too slow, called Bradycardia — less than 60 beats/minute. The other is the heart rate is too fast, called Tachycardia — more than 100 beats/minute. Many things can lead to, or cause, an arrhythmia, such as coronary artery disease(blocked arteries in your heart), a heart attack that's occurring right now or Scarring of heart tissue from a prior heart attack, changes to your heart's structure, high blood pressure and so on.
1.3 The ECG signal
The surrounding heart tissue and body fluids can be conductive, so the human body can be seen as a long, wide, thick three-dimensional volume of the conductor, the heart is like a power supply. The sum of the changes in myocardial potential can be transmitted and reflected to the body surface. There are potential differences among many points on the body surface, there are also no potential differences between each other. This point is the key basis for the ECG applications.
The ECG application has been more than 100 years of history. At the end of the 19th century, firstly, people found that the animal’s heart beat accompanied by weak electrical activity, and later gradually realized that the human body has a similar change. In 1903, the Dutch Wilhelm Einthoven recorded the first electrocardiogram with string currents. At that time it is referred to as EKG, which is from German Elektrokardiogramm. In 1905 the formal application of electrocardiogram technology was used in the clinic. In 1942, in the United States, a group of scholars led by Wilson presented six cardiac leads in the American Journal of Cardiology. In the same year, Goldberger improved and completed the 12-lead ECG, which has been used ever since.
time easily recorded using noninvasive electrodes on the chest or limbs, is used to measure the heart’s electrical conduction system. It is for the detection of arrhythmia, ventricular atrial hypertrophy, myocardial infarction, myocardial ischemia and others related to the heart disease. It picks up electrical impulses generated by the polarization and depolarization of cardiac tissue and translates into a waveform. Then, the waveform is for measuring the rate and regularity of heartbeats, as well as the position and size of the chambers, the presence of any damage to the heart, and effects of drugs or devices used to regulate the heart.
The ECG as an indirect method [1] is the most commonly used clinical detection to diagnose myocardial ischemia and myocardial infarction. Around 70% heart attacks can be detected through the ECG, the remaining 30% is because of different reasons, like multiple or small infarction. Its correct interpretation, particularly in the emergency department, is always the basis for immediate therapeutic interventions and/or subsequent diagnostic tests. As we knows, early diagnosis of acute heart attacks, within 1 hour of the onset of symptoms, is crucial part to determine whether the treatment will be succeed or not.
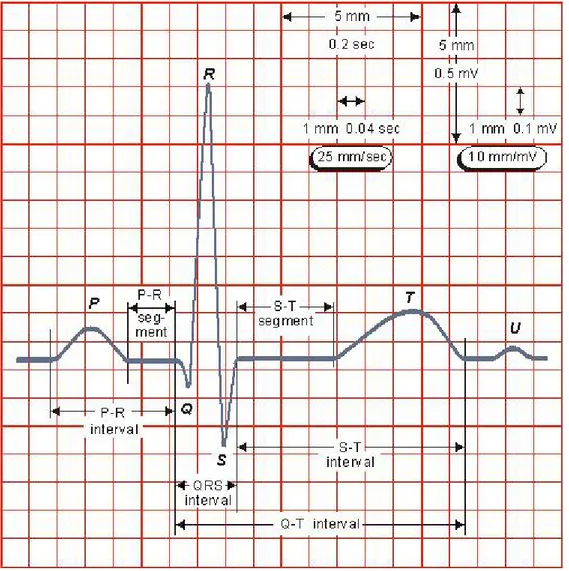
A typical ECG tracing of the cardiac cycle (heartbeat) comprises a P wave, a QRS complex, a T wave, and a U wave, which is normally invisible in 50 to 75% of ECG signals because it is hidden by the T wave and upcoming new P wave. The ECG signal change that occurs in association with acute ischemia and infarction includes the large T wave, referred to as hyperacute T wave change, ST segment elevation and/or depression, the change in the QRS complex, and inverted T wave. Then diagnosing ischemia normally main depends on the ST segment change, even if the abnormal T wave also has the meaning for diagnosis, however, there is not much information provided by the T wave and less experience on it.
A typical normal ECG tracing is shown in Figure 8.
1) The P wave: a small semi-circular wave is at the beginning of the ECG waveform, reflecting the left and right atrial depolarization process of electrical excitement. The first half is mainly from the right atrium, the latter half is mainly from the left atrium. A good place to look at P waves is in II, where the P shouldn't be more than 2.5mm tall, and 0.11 seconds in duration.
2) The QRS complex: after the P wave, there is a sharp narrow, large wave, which is often composed of several waves. The QRS complex reflects the left and right ventricular depolarization process of electrical excitement. An initial downwards deflection is a Q, any negative deflection after this is an S. An upward deflection is an R. Depending on the patient and the lead, the QRS complex may be in multiple forms. Generally, upper case is for main wave, lower case is for smaller waves. The width of the QRS complex represents the duration of all ventricular myocardium excitement. The normal one is not more than 0.11s.
3) The T wave: At the end of the QRS complex, there is a low-blunt and wide wave called the T wave, which reflects ventricular recovery or repolarization. In the R wave based ECG, T wave amplitude should not be less than 1/10 of the R wave.
4) The U wave: in the some leads, after the T wave there is a wave with the same direction of the T wave, known as the U wave, the general amplitude is not more than 0.3mv, which probably reflects the potential change after the excitement. Anyway, it is still In the discussion.
5) The PR interval (PR segment): it extends from the P wave to the beginning of the QRS complex, representing the excitement from the atrium to the ventricle. It is an important indicator to measure the relationship between the atria and ventricle, generally between 0.12 ~ 0.20s. This duration will increase with age. Moreover, it is often used as the baseline to measure the ST segment offset.
6) The ST segment: it is from the end of the QRS complex to the beginning of the T wave, which represents the slow phase of ventricular repolarization. The ST segment usually merges smoothly and imperceptibly with the T wave. The normal ST segment is close to the baseline, ST segment elevation not exceed 0.3mv in V3, V4 lead, otherwise, no more than 0.10mv. Then, ST segment depression is not more than 0.10mv.
7) The QT interval: from the beginning of the Q wave to the end of the T wave. It represents the duration of the ventricular depolarization and repolarization, generally around 0.30 ~ 0.47s, affected greatly by the heart rate.
Figure 8. A typical normal ECG tracing
1.4 Research relevance
After we are clear that CVDs are one of the most important diseases that threaten human life, and IHD is the single largest cause of death in the developed countries and is one of the main contributors to the disease burden in developing countries. Myocardial ischemia (MI) is the main symptom during its occurrence and development. Continuous and severe myocardial ischemia will lead to myocardial infarction. Early detection and intervention has a great impact on the prognosis. The timely and accurate detection of myocardial ischemia is critical to the treatment of patients.
coronary angiography, myocardial radionuclide imaging, myocardial magnetic resonance imaging, echocardiography, 64 rows of CT, and electrocardiogram detection. Among them, ECG detection with low prices, non-invasive and easy operation becomes the most commonly used and basic method in myocardial ischemic detection. Because of the long-term detection of electrocardiogram, it is beneficial to evaluate myocardial ischemia in daily life especially for the diagnosis and evaluation of asymptomatic myocardial ischemia [2]. Therefore, the relevant scholars follow this topic which is one of the hot spots in the electrocardiogram research field.
The ECG is the main basis method to diagnose CVDs, the characteristic analysis has become a hot topic in the medical profession, particularly the ECG helps experts easily quickly and accurately know the patient's condition. With the development of network technology and multimedia technology, the data structure is getting more complex, and there is a popular tendency that the computer is used to complete that intelligent data collection, storage, management, processing and transmission. The traditional ECG analysis is done by the physician, The physician make a diagnosis based on the patient's ECG waveform and other auxiliary information. But sometimes the physician has to face thousands of heartbeat data, obviously, the number of physicians is limited with great pressure, in such circumstances, the development of the intelligent computer application, automatic ECG analysis, can save them much time and labour, which can definitely improve the above situation, so as to assist physicians to make accurate and efficient diagnoses, reduce misdiagnoses and missed diagnoses
Importantly, automatic analysis helps to detect real diseases, real emergency situations from false alarms. To improve health and reduce preventable deaths, the faster detect diseases, the sooner save patients’ lives. Therefore, the goal of this tesina is to develop a program in MATLAB to automatically analyze the ECG signal and diagnose ischemia preliminarily through ST segment and T wave morphology classification, based on reviewing research of the current state of the art. The program not only can realize the ECG signal denoising, feature detection and analysis, but also make a simply medical report about ischemia with medical knowledge after reading the input ECG.
1.5 Tesina outline
The main research work and structure of this tesina are as follows.
Chapter 2 describes the state of the art of the QRS, the ST segment and the T wave analysis involved in the diagnosis of myocardial ischemia.
Chapter 3 describes the main noise distribution in the ECG signal, the basic knowledge of wavelet transform and the denoising principle, to select the appropriate wavelet function and threshold to denoise the original ECG signal is to get the ECG signal after denoising.
Chapter 4 describes the essential knowledge of extracting characteristics from ECG signals. Extremum point and the boundary detection, or wavelet transform method can be used to detect the QRS complex, the local transform algorithm or wavelet transform method can be used to detect the T wave. In this tesina, wavelet transform method is selected to locate the QRS complex, the T wave. First of all, the improved method based on the modulus maxima pair is used for R peak detection, then Q peak and S peak detection, the QRS onset and offset are detected based on R peak location. Then, the T wave is detected effectively by removing the QRS complex on the basis of QRS complex detection. What’s more, morphological analysis of the T wave was made. For ST segment morphological analysis, a method is proposed. The 4 morphological features of the ST segment, the offset level, the
curve type, the slope and the camber, are used as identified criteria. Meanwhile, the morphological classification of the ST segment is carried out gradually.
In Chapter 5, according to the feature analysis combined with clinical knowledge, the ECG diagnosis of myocardial ischemia is achieved by logical method: the logical method describes the way the physician observes the ECG recording, which is simple in principle and clear in clinical classification.
Chapter 6 summarizes the work and the existing problems of this tesina, and puts forward the future research work according to the ideas and drawbacks occurred in the research.
2. State of the Art
With the development of computer technologies, the ECG automatic analysis has become a hot topic in the field of biological signal processing, and the function has been enhanced, which not only can analyze the heart rate, but also extract the feature value, and finally classify and diagnose various heart diseases. It plays an important role in the prevention and diagnosis of some heart diseases. However, the ECG automatic analysis is still a minority in practical clinical application. The main reason is that automatic analysis algorithm is difficult to meet requirements of clinical diagnosis when dealing with special waves of all kinds of diseases. So improving the accuracy of automatic analysis algorithm still has a long way to go.
There is no accepted uniform standard for ECG detection of myocardial ischemia as yet, but the clinical physician mainly examines the morphological changes of the ST segment and the T wave when diagnosing myocardial ischemia with the electrocardiogram. Therefore, ST segment change and T wave change are the most common characteristics in the detection of myocardial ischemia. However, QRS complex detection is directly related to the acquisition of R-R interval, that is, the accuracy of heart rate calculation. Then generally, only after the QRS complex is determined, it is easy to correctly locate the T wave and ST segment in the ECG signal.
2.1 Research on QRS complex detection
Currently, QRS complex detection usually is divided into 2 parts, the hardware method and the software method. The hardware method is mainly based on the difference of the frequency characteristics among the QRS complex, other waveforms and noise [3]. The software methods are as follows: the PT algorithm [4] can be used to detect the location and the QRS complex coverage, and a special digital bandpass filter is to eliminate the wrong detection in the ECG waveform. The differential threshold method [5, 6] is to compute the sum of the forward difference and the backward difference of the ECG signal, get a bimodal signal, and highlight the R wave of the original signal, finally by choosing the appropriate threshold to locate the R wave. This method is simple and fast, but the efficiency of R wave detection is not good. After the Hilbert transformation [7] of the original signal, the envelope of the signal can be computed by the function of the original signal and the transformed one, and the QRS complex can be located by analyzing the envelope signal, but it is susceptible to the noise. Wavelet transform [8 - 10] can be used to weaken other waves and highlight characteristics of the QRS complex, and get a good QRS complex detection rate. Neural network algorithm [11] is to train, learn and classify the input signal. For all kinds of waves, it has a good detection rate, but the appropriate training algorithm is in demand, mostly for non-linear prediction. There are also variable threshold methods [12], difference operation method [13], adaptive threshold method [14], master-slave coordinated QRS detection method [15], template matching method [16] and so on.
2.2 Research on ST segment detection
The ST segment is normally parallel to the equipotential line or has a slight upper and lower shift. For myocardial ischemia, the ST segment can be elevated or depressed, and the corresponding changes in various forms can occur.
Measuring the shift level is one of the most important elements in the analysis of ST segment change. There is no uniform standard for measuring the shift level at which point to
measure the offset level. The methods of measuring the ST segment shift level are frequently used including J + X method [17], R + X method [17], window search method [17] and the turning point detection method [18] and so on. J + X method and the R + X method are used to measure the ST segment offset at X (ms) after the J point or the R peak, The precision of X selection in this method basically determines the accuracy of detection point. Window search method is to select a search window in the ST segment, in this window to search its lowest or highest point as a measurement point. The turning point detection is to get the turning point between the ST segment and the T wave, usually the starting point of the T wave, as the measurement point of the ST segment offset.
The analysis of ST segment morphology also has very important significance. ST segment morphological changes often vary from diseases, not only help to analyze the reasons for ST segment change, but also to provide more accurate bases for ECG diagnoses. Then, there are a few researches on the effective morphological recognition of the ST segment.
Skordalakis et al. proposed a ST segment morphological recognition algorithm in 1986 [19]. But its essence is to determine the endpoint of the ST segment by function regression, which does not involve the concrete analysis of ST segment morphology. Function regression [20] is to adopt the principle of digital fitting to identify and classify the signal, and the polynomial function is often used to fit the signal by the least squares. Sometimes, exponential function is also used [21]. But due to the variety of ECG signal, it is very difficult to fit well, and its reality is poor. The slope method [22], a combination of the slope and the function regression [23] are used in the ST segment morphological recognition as well, and the combination method are found to achieve the relative good effect, which is simple and quick, also can meet the real-time system. But it has big limitation. First of all, the calculation of the slope is affected by the noise, this method can achieve better results in the case of large signal-to-noise ratio. Secondly, the method is greatly affected by the accuracy of the feature point, especially the J point.
Jeong et al. [24, 25] proposed four slope method, which was to divide the ST-T segment, easier to locate part, according to a certain rule into four segments, then complete the classification of ST segment morphology through slopes of four segments. In addition, some scholars put forward secondary curve fitting the ST segment, and analyzed ST segment morphology [26], while it was easy to be affected by the noise and with a large computational quantity.
Shen Zhao et al. [27] computed the end direction and waveform of the ST segment by wavelet and morphological method, and applied the change trend of the ST segment to the detection of myocardial ischemia.
Kwok et al. [28] used PCA method to extract main characteristic components of single heart beat in the ECG signal, and used it as the input signal to realize the recognition of various ST segment depression by LVQ Neural network. LIU Hai-long et al. [29] directly used the signal at 150ms backwards the R wave as the input signal, and adopted RBF neural network to realize ST segment morphological recognition. The ST morphological analysis based on neural network has good fault-tolerant ability, but this kind of method needs a large number of training samples to be modeled. It is tedious and difficult to be implemented with large computational capacity, and it is easy to be disturbed by the noise. Moreover, it cannot properly recognize the new pattern which has not appeared in training samples.
On account of the variety of the ST-T segment, its detection is far less mature than the QRS complex detection, and it is difficult to have a method that can both has universality and accuracy.
2.3 Research on T wave detection
Due to the low frequency component of the T wave, much noise, and the variety of the T wave morphology, it is inevitable that some threshold detection methods [30 - 33] used in time domain are false detection and missed detection. Some more robust methods of T wave detection have been developed. Based on principal component analysis [34], T waves were detected by multi-lead signals. Yu et al. [35] used the genetic algorithm to obtain the approximate value of the global optimal solution, and took it as the initial value of the neural network to obtain the exact value of the global optimal solution. However, this method does not consider the diversity of the T wave morphology comprehensively.
Considering the diversity of T wave morphology, the improved wavelet transform detection method [36, 37] establishes a corresponding relationship between T wave morphology and the modulus maxima pair, and it can detect T wave more comprehensively, but it is prone to false and missed detection of abnormal T wave.
Vila et al. [38] established a mathematical model of the T wave, and then finished T wave detection and classification according to that model. But it is very difficult to detect the T wave by using mathematical template because of noise interference and T wave morphological change, In fact, so far, T wave detection is still a difficult problem in the field of ECG signal processing. Wang Yun-He et al. [39] used support vector machines (SVM) to achieve T wave classification. Hadjem et al. [40] designed an abnormal T wave detection algorithm based on classifier integration. Firstly, they detected the QRS onset and the T wave endpoint, then extracted the morphological features of the QT segment, finally integrated decision tree, support vector machine and logistic regression classifier to judge whether the T wave is abnormal.
Bernardo et al. [41] used the computer model to analyze T wave changes with heart rate. Zhang Qinghua et al. [42] proposed a real-time effective algorithm for the T wave endpoint, which is related to the area covered by the T wave, but it required good T wave morphological classification. Other methods of T wave endpoint detection are not only dependent on the threshold, such as based on area [43, 44], template matching [45], wavelet transform [46, 47], curvature [48], statistical pattern recognition (KNN) [49] and so on. Among them, template matching, statistical pattern recognition are both more computational, time-consuming methods.
3. Signal Preprocessing
Since the ECG signal is relatively weak with mV, collected ECG signal is usually with much noise, causing the signal distortion and blur, which greatly affects the correctness of the signal analysis results. Therefore, ECG signal preprocessing is significant to the automatic diagnosing recognition. Frequency range of the normal ECG signal is mainly around 0.0 ~ 100Hz, about 90% of the ECG signal spectrum energy concentrated in 0.25 ~ 45Hz [77]. During the ECG signal acquisition and A/D conversion process, ECG signals are inevitably interfered by various kinds of noise, mainly including powerline interference, electromyographical (EMG) interference and baseline drift [50, 51].
This Section describes how the signal is processed: the noise of the signal is removed (Section 3.1); then by the wavelet transform the signal is preprocessed (Sections 3.2 and 3.3); the signal is the filtered by removing its baseline (Section 3.4) and the interference from the electric network (Section 3.5).
3.1 Noise contained in ECG waveform
3.1.1 Baseline drift
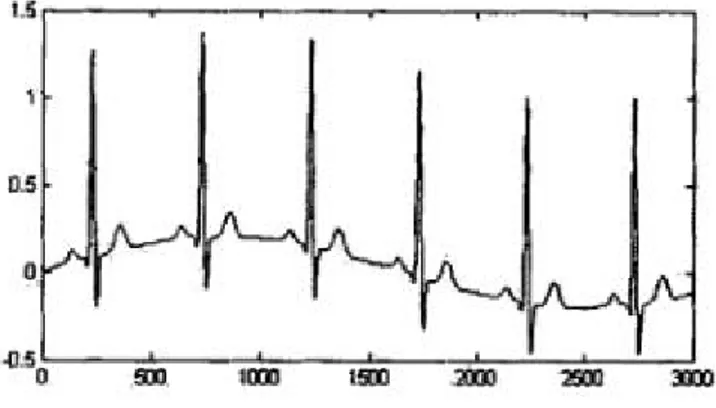
In general, using the body surface paste electrode to collect the ECG signal, so there is such a contact resistance between the electrode and the skin. However, changes in space position of the electrodes in contact with the skin caused by respiratory movement, temperature drift of the amplifier, postural activity and other factors will lead to ECG baseline drift and amplitude fluctuations, even may also lead to serious ECG distortion in severe cases (Figure 9). Frequency of the baseline drift is generally considered to be less than 0.5 Hz, low frequency interference, which is similar to the characteristic of the ST segment. In fact, it is difficult to completely suppress such noise on the hardware, so baseline drift is mainly removed by the software.
Figure 9. The ECG signal with baseline drift
3.1.2 Powerline interference
ECG detection box usually uses AC power supply, there is a power circuit system around it, no wander it will introduce powerline interference that affects the ECG analysis (Figure 10). Filtering out the powerline interference is a necessary step in ECG signal preprocessing. The frequency band of the powerline interference is narrow, generally 50Hz ~ 60Hz, high frequency interference. The task of removing powerline interference is to remove the signal in
Figure 10. The ECG signal mixed with powerline inference
3.1.3 EMG interference
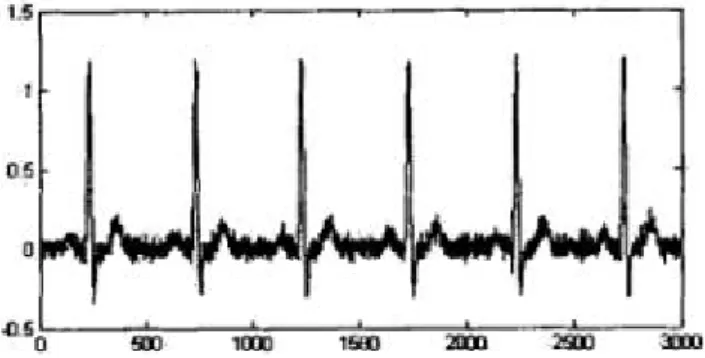
In the human epidermis, there is a typical skin potential of 30mV. When the skin is stretched, the skin potential drops to about 25mV that means the electrical noise produced by the muscle contraction in the ECG signal. Therefore, when human muscle contraction and relaxation happen, EMG interference, high-frequency interference, will exist (Figure 11). The frequency range of this interference is very wide, about 30-2000Hz.
Figure 11. The ECG signal with EMG interference
3.2 Wavelet transform introduction
Since 1822, Fourier transform (FT) is a kind of effective analytical method which is widely used in signal processing field. However, FT is a analytical method only in frequency domain, which means the resolution in frequency domain is the highest, but the weakest in time domain. That is to say, FT is a reflection of the complete characteristics the whole time in frequency domain, but not with the capability of getting frequency information in the local time period. That will make each signal point mutation on the time axis will affect the whole frequency domain. In order to solve this problem, Short Time Fourier Transform (STFT) is developed. Although it can realize the signal analysis in time domain, but still cannot accomplish effective analysis of the abrupt and non-stationary signals.
For the purpose of realizing the effective analysis of the abrupt non-stationary signal, the wavelet transform comes into being, which not only inherits the advantages of Fourier transform, but also compensates for the shortage. It has been widely used in many fields, such as signal denoising, image compression, feature extraction, edge detection and so on. The main idea of wavelet transform is extension and translation, and make the time signal into the linear superposition of the wavelet function group, which has better time-frequency localization and multi-resolution characteristics. So it can effectively distinguish the abrupt
part and the noise part in different decomposition levels, and realize signal preprocessing. Therefore, the wavelet transform is applied to the ECG signal preprocessing and feature extraction, and satisfactory results are obtained.
Owing to the multi-resolution characteristic, wavelet transform can decompose the signal at different scales, which means it decomposes the mixed signals into different frequency bands, so wavelet transform can produce good results in the ECG signal denoising. In the original ECG signal waveform, the useful parts and the noise parts have different frequencies, so the wavelet coefficients have various characteristics at different scales in the wavelet transform. After the wavelet transform, for useful parts, the energy of its mutation points (singularities) is mainly concentrated in a few sparse, larger wavelet coefficients with larger amplitude that are also modulus maxima at each scale. Besides, for the noise part, it is still white noise after wavelet transform, and the wavelet coefficients are irrelevant and widely distributed on the time axis of each scale with small amplitudes. Finally, taking advantage of this type of characteristic that decomposition coefficients of useful signal are different from and noise’s ones is to realize the ECG signal preprocessing. The ECG signal denoising process by wavelet transform is actually the process of signal decomposition and reconstruction. The main idea is shown in Figure 12.
Figure 12. The flowchart of ECG signal preprocessing
3.3 The principle of wavelet transform
In this tesina, wavelet transform is used for the ECG signal preprocessing. First of all, there are some important theories that need to be introduced.
3.3.1 Wavelet Transform definition
There is a basic function
a b t a t b a , 1 (3.1)Where a, b are constants, a > 0.
Obviously, a,b
t is obtained after (t) shifts firstly and stretches later, if a, b areconstantly changing, a set of functions a,b
t can be obtained. If a square integratable signalx(t) is given, the wavelet transform of x(t) is defined as:
dt x
t
t dt x
t
t a b t t x a b a a,b a,b x , 1 , WT
(3.2)Where b indicates the time shift, a, the scaling factor, (t), mother wavelet function,
Input ECG signals
Multi-resolution wavelet decomposition Manipulate the wavelet coefficients Wavelet Reconstruction
WT can be seen as the inner product of x(t) and a set of wavelet basis functions.
3.3.2 Discrete wavelet transform (DWT)
In practice, the signal is always discrete, and DWT is a kind of wavelet transform with a, b and t are discrete values. The space Vj,is defined by the orthogonal basis
ajtk
, and Pjx(t) is the projection of x(t) in the space Vj,. The space Wjis formed by the orthogonal basis
2jtk
and Dj,x(t) is the projection of x(t) in the space Wj
, k ( ) ( ) ( ) j j j k P x t a k t (3.3) , ( ) ( ), ( ) j j k a k x t t (3.4)
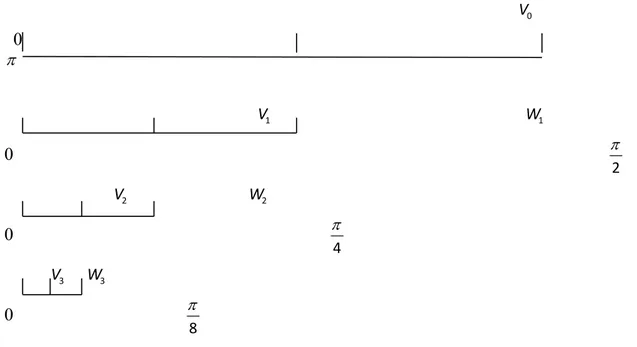
, k ( ) ( ) ( ) j j j k D x t d k t (3.5) , ( ) ( ), ( ) j j k d k x t t (3.6) 1 ( ) ( ) ( ) j j j P x t P x t D x t (3.7)If we define the band (0 ~ ) of the signal x(n) to the space V0, it is divided into two subspace after the first decomposition, a low-frequency band V1(0 ~
2 ) and a high frequency
band W1 (
2 ~ ). According to this method V1 further will be divided into two parts, one
is low-frequency band space V2(0 ~
4 ), another is high-frequency band space
2(4 2)
W .
According to the above method, continue to decompose, at the end, the frequency band decomposition of the signal can be realized, as shown in Figure 13.
0 V 0 1 V W1 0 2 2 V W2 0 4 3 V W3 0 8
Figure 13. Signal band decomposition
1) The constant Q property of each high-pass space Wjand the low-pass space Vj, that is, time-bandwidth product is independent of the scale factor.
2) The consistency of filter at all levels. The filter is designed on the grounds of the normalized frequency, so the low-pass filter H0 and high-pass filter H1at all levels use the same filter bank, which not only embodies the consistency in the tree-structured filter bank, but also embodies the characteristics of the frequency band decomposition.
3.3.3 Mallat algorithm
A breakthrough result of the discrete wavelet transform is the fast algorithm--Mallat algorithm, which is proposed by S. Mallat on the basis of multi-resolution in 1989 [78].
3.3.3.1 Decomposition algorithm
h hh
h 䁠 hh
(3.8)
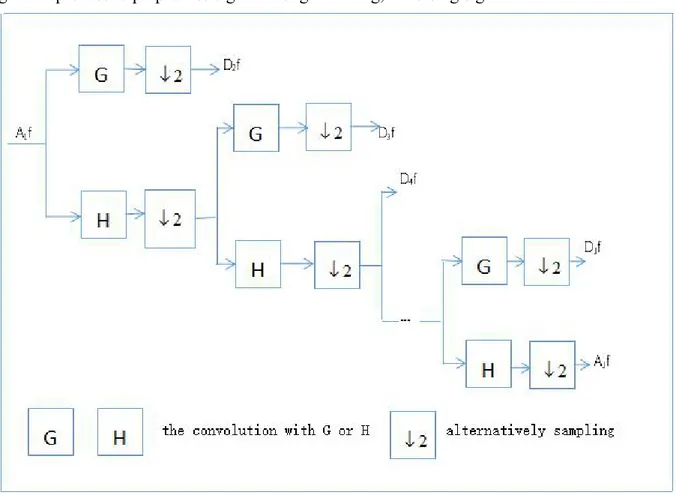
Where t indicates a discrete time sequence, t = 1, 2, ... N; f (t) indicates the original signal; j indicates the layer, j = 1, 2, ..., j, jlog2N; H, G indicate wavelet decomposition filters in time domain, namely filter coefficients. For signal f (t), Ajindicates the approximate part of the layer j, the low-frequency part of the wavelet coefficient, and Djindicates the detail part of the layer j, the high-frequency part of the wavelet coefficient.
The meaning of the formula (3.8): assuming that the detected discrete signal f (t) is A0, making the convolution of the wavelet appropriation coefficients Aj-1at scale 2j-1(layer j-1) and decomposition filter H, the approximate portion of the signal f (t) at scale 2j(layer j), the low-frequency portion of the wavelet coefficients Aj is obtained through the convolution result alternately sampling. Similarly, Making the convolution of the wavelet appropriation coefficients Aj-1 at scale 2j-1(layer j-1) and decomposition filter G, the detail portion of the signal f (t) at scale 2j (layer j), the high-frequency portion of the wavelet coefficients Dj is obtained through the convolution result alternately sampling. By decomposition, at each scale 2j , the signal f (t) is decomposed into approximation coefficients Aj (low-frequency) and the detail coefficients Dj(high-frequency). The process is shown in Figure 14.
3.3.3.2 Reconstruction algorithm
k j k j j[f(t)] 2 h(t 2k)A [f(t)] g(t 2k)D [f(t)] A 1 1 (3.9)Where j indicates the layer of decomposition, if the depth of decompostion is J, j = J-1, J-2,..., 1, 0; h, g indicate wavelet reconstruction filters in time domain, namely filter coefficients.
The meaning of the formula (3.9): The convolution of reconstruction filter h and the wavelet appropriation coefficients Aj+1 at scale 2j+1 (layer j+1) which is after zero insertion, the convolution of reconstruction filter g and the wavelet detail coefficients Dj+1 at scale 2j+1 (layer j+1) which is after zero insertion, the low-frequency portion of the wavelet coefficients
signal can be obtained until scale 20.The process is shown in Figure 15. What’s more, h(1 n) ) 1 ( ) n ( g g(-n) G(n) h(-n) H(n) 1 n (3.10)
Mallat algorithm can decompose the signal into approximation signal and detail signal of different levels, then analyze and process them to reconstruct new coefficients. That is the general process to preprocess signal through filtering, denoising signal.
Figure 15. The flow chart of Mallat reconstruction algorithm
3.4 Correcting baseline drift
For removal methods of baseline drift, there are chiefly median filtering methods [52, 53], neural network based adaptive matched filter [54], combining method based on interpolation, extraction and linear filter [55], adaptive method [56], cubic spline method [57, 58], wavelet transform [45, 46] and so on.
The effect of the median filtering method is closely related to the width of the filter window. If the filter window is too narrow, the fitting baseline still contains more high-frequency components, which leads to the ECG signal distortion; if the filter window is too wide, it will not only influence the filtering effect, but also result in increasing computational complexity. Cubic spline method is based on the correct recognition of the band feature points and the slow variation of the baseline drift, which can degrade the performance seriously if the waveform recognition is inaccurate or the baseline drift has a high frequency. Wavelet transform has a good time-frequency resolution. For baseline drift which is mostly less than 0.5Hz caused by respiration, as long as removing the wavelet coefficients at the corresponding scale, and then making the wavelet reconstruction, the problem will be smoothly solved.
Based on the comprehensive basic principle and algorithm of wavelet transform, it found that the decomposition of the original signal at different layers corresponds to signal components of different frequency bands, and Mallat algorithm can conveniently realize the wavelet decomposition and reconstruction of the signal.
A noisy one-dimensional signal model is as follows:
] [ ] [ ] [n f n W n X (3.11)
Where X [n], f [n] and W [n] indicates respectively the signal with noise, the useful signal, the noise. Making wavelet decomposition of the signal, then processing the wavelet
coefficients and wavelet reconstruction to the signal can achieve the purpose of denoising signal. That is, the process is to suppress the useless part and restores the useful part of the signal.
The specific steps of eliminating the baseline drift by wavelet transform are as follows: 1) The ECG signal used in this tesina is S (250Hz), and the frequency of the baseline interference is mainly low frequency (<0.5Hz), so the ECG original signal is decomposed into 8 layers successively(MATLAB wavedec function, the wavelet is db6). Then the corresponding detail coefficients (high-frequency component, highpass, CD) and approximation coefficients (low-frequency component, lowpass, CA) are obtained.
The reason for choosing wavelet function db6 is that, through theoretical analysis and experimental comparison, the discrete wavelet Haar makes the detail signal and the approximation signal both discontinuous, and the baseline drift is continuous, thus the reconstructed signal cannot completely eliminate the baseline drift and damage partial detail information. The approximation signal obtained by bior3.1 decomposition is continuous, but it produces a new baseline drift due to the high frequency components which are not included in the baseline drift. For rbio3.1, the approximation signal does not have any similarity with the baseline drift, and the result of the reconstructed signal also completely loses the information of the ECG signal. For these three kinds of wavelet, the satisfactory approximation signal can not be obtained even though changing the decomposition level, so that no favorable effect of removing the baseline drift can be obtained. In conclusion, db6 is one of the wavelet functions that can better meet the requirements. There are scaling function, wavelet function for db6 in Figure 16.
Figure 17. Three-layer wavelet decomposition example
As shown in Figure 17., S is the ECG signal with 250Hz (that is, the sampling rate), the most recoverable frequency is 125hz, then S is decomposed into CA1: 0 ~ 62.5Hz, CD1: 62.5 ~ 125Hz. CA1 continues to be decomposed into CA2: 0 ~ 31.25Hz and CD2: 31.25 ~ 62.5Hz. And so on, until CA8: 0 ~ 0.4883Hz, CD8: 0.4883 ~ 0.9766Hz.
2) The frequency range of CA8 is basically consistent with the range of baseline drift. Hence, the corresponding signal is set to 0 to eliminate the information of baseline drift.
3) Finally, according to the 8th layer low frequency coefficient and high frequency coefficients of the 1st to the 8th layer, one-dimensional reconstruction is performed, the wavelet reconstruction. Finally, the corrected ECG waveform is obtained. This method eliminates the baseline drift, the DC component introduced in the measurement is removed as well.
3.5 Removal of powerline and EMG interference
A useful signal is usually a low frequency signal or a relatively smooth one. Since EMG interference and powerline interference in the ECG signal are considered as zero mean Gaussian white noise with higher frequency relative the ECG signal, they can be solved by removing high-frequency noise. Because a single cut-off frequency filter is hard to meet the needs of various circumstances, many scholars have put forward a variety of methods. Through the corresponding operation of discrete digital signal processing, the digital filter[61, 62] changes the signal spectrum. The Gaussian filter (LPF) [63] obtains the high signal-to-noise ratio smoothing signal by using the Gaussian function to make convolution. What’s more, there are nonlinear filtering methods based on average filtering [64], adaptive filter, wavelet threshold denoising [65] and so on.
3.5.1 The principle of wavelet threshold denoising
In view of the favorable characteristics of wavelet transform, it is better to use wavelet threshold denoising to remove powerline and EMG interference.
Wavelet threshold denoising is to compress the signal according to a certain preset threshold, and then reconstruct the signal with the compressed coefficient to reach the aim of noise elimination. So far the most widely used are hard-thresholding method and
T indicates the threshold, WT, the signal after processing with the threshold. Soft-thresholding method: T W T W T W W gn s T 0 |, | | | ), | )(| ( i W (3.12) Hard-thresholding method: T W T W W | |, 0 | |, WT (3.13)
Figure 18. (a) The original signal, (b) The signal with hard-thresholding method, (c) The signal with soft-thresholding method
It is shown in Figure 18 that hard-thresholding method corresponds to the simplest processing way that is more risky, while the threshold method is more risky. Soft-thresholding method reduces the noise by slightly reducing the amplitude of all coefficients with less risk and strong mathematical characteristics.
One of the most critical problems is to estimate the noise level of the signal when threshold denoising is performed. Recently, several estimation methods have been proposed for wavelet denoising:
1) Rigrsure: a threshold selection rule based on Stein’s Unbiased Estimate of Risk (SURE, quadratic loss function). One gets an estimate of the risk for a particular threshold value (t). Minimizing the risks in (t) gives a selection of the threshold value.
2) Sqtwolog: global or fixed thresholding denoising method uses a fixed-form threshold to get better denoising performance. The threshold value is 2 nln( ) , n is the length of the noisy signal, is Median Absolute Deviation(MAD).
3) Heursure: combination of Rigrsure and global thresholding method is the optimal threshold selection of the predictive variables. As a result, if the signal to noise ratio is very small, the SURE estimate is very noisy. In such case, fixed form threshold of Sqtwolog method gives better threshold estimation
4) Minimax thresholding method: this method finds threshold using minimax principle. It uses a fixed threshold to yield minimax performance for mean square error against an ideal procedure. The Minimax principle is used in statistics to design estimators. Since the de-noised signal can be assimilated to the estimator of the unknown regression function, the minimax estimator is the option that realizes the minimum, over a given set of functions of the maximum Mean Square Error (MSE). This procedure finds optimal thresholds [66].
In general, because powerline and EMG interference contain a large number of high-frequency components, the wavelet adaptive threshold is used to eliminate them simultaneously. The above analysis shows that in order to ensure that ECG signal characteristics are not damaged, soft-thresholding method must be used to remove the noise. Rigrsure and Minimax thresholding method are both conservative (only some coefficients are set to zero), so it is impossible to obtain better filtering effect when little high-frequency information of the signal is in the noise range. Others are more effective in removing noise, although the R peak has a small attenuation, it does not affect the follow-up work. It is found that using Heursure is slightly better than Sqtwolog, so Heursure is adopted. For the wavelet function, db6 is used continuously.
Since the main components of the signal are concentrated in the frequency bands below 45Hz. Therefore, signal of the 1stlayer detail coefficient (high-frequency coefficient) is set to zero. Then using Sqtwolog, soft-thresholding method, db6 wavelet function to denoise CD2. Lastly, after the wavelet reconstruction, denoising signal can be obtained.
At last, Figure 19 is the comparison diagram that using the above methods to remove baseline drift and high-frequency noise, it can be seen that after preprocessing, the ECG waveform is more smooth than the original one. Furthermore, the oscillation has been basically eliminated, and the waveform is not obviously distorted, which preferably reflects the main information of the original ECG signal.
Figure 19. Sample e0106 in European ST-T Database: the original ECG signal and the denoised ECG signal
4. ECG Feature Detection
In the process of ECG signal analysis, first step is usually filtering the ECG signal, then detecting waveform, and the correlative parameters of waveform are calculated. Eventually, they are combined with pathological knowledge to determine the variation of the ECG signal, thus automatically diagnosing myocardial ischemia. Consequently, the waveform detection, that is, the accuracy and reliability of feature extraction, the waveform detection, will directly affect diagnostic results. The ECG signal has been preprocessed before, this section will mainly accomplish QRS complex detection, ST segment morphological detection, T wave location and morphological detection.
Generally speaking, compared with the ECG signal features of the same cardiac cycle, the QRS complex has the most obvious one, and the location of the R wave with high amplitude is the key to calculate the heart rate and detect the characteristics of the ST segment, thus distinguishing between normal and abnormal shape. Hence, universally, QRS complex detection is the first step in ECG feature extraction. Then other waves or segments are located on the basis of the R wave.
This Section describes how the features of the signal are detected: the QRS complex is detected (Section 4.1); the T wave is detected (Section 4.2); then the ST segment is detected (Section 4.3).
4.1 QRS complex detection
4.1.1 Extremum point detection and the boundary detection for QRS complex detection
4.1.1.1 R peak detection and QRS onset detection
At a matter of fact, in the ECG signal, peak points of P, Q, R wave must be extreme points, but not necessarily the maximum. if we determine extremum points in all sample points before we detect the characteristic points of the ECG signal, only the extreme points are analyzed to avoid searching all sample points. This can save time and reduce the cumbersome process. The main idea is to determine all extremum points in the sample by the appropriate threshold, then the R wave is detected in extremum points in response to the situation. After that, the Q wave can be detected forwards, and the S wave is detected backwards. The flow chart is shown in Figure 20.
Figure 20. The flow chart of extremum point detection for the QRS complex
According to the characteristic of the normal ECG, the R peak is the most prominent: 1) Maximum amplitude
2) The most sharp waveform
Therefore, the R peak is determined by the maximum of the amplitude or the minimum of the second derivative. Then, the R peak can be determined by the average of 5 maximum values. After R peak detection, QRS onset and offset detection are carried out by using the boundary detection algorithm. First of all, the R wave is the center of the detection, the R peak is R1. In the window [R1-100ms, R1-40ms], Searching for a flat interval of 20ms and the slope of the signal is less than or equal to 25. The rightmost point of the interval is the QRS onset.
4.1.1.2 Q peak detection and S peak detection
For the Q peak detection and S peak detection, the process is as follows:
1) Determine the search period 1: for a normal EDG, QRS complex is between 0.04 ~ 0.11s , so the search period 1 is defined as 20 sampling points. In the search period 1, the minimum before the R peak is Q1, the minimum after the R peak is S1.
3) Determine the Q peak position. qq= +q1 v
MV V T (4.1)
Where MVqqindicates the maximum between Q1and Q2, Vq1is the amplitude of Q1, Tv= 0.18mv, which is based on a large number of experiments.
Vq2> Vq1 (4.2)
Where Vq1and Vq2are the amplitudes of Q1and Q2respectively. The process is as shown in Figure 21.
Figure 21. Specific flow chart for Q peak detection by extremum point detection
equation (4.3) is established, S1is the S peak, otherwise, S2is the S peak.
Vs2> Vs1 (4.3)
Where Vs1and Vs2are the amplitudes of S1and S2respectively.
The final example result of QRS complex detection is shown in the following figure (Figure 20).
Figure 20. Sample e0127 in European ST-T Database: QRS complex detection by extremum point detection and the boundary detection
Because the extremum point detection needs to use the appropriate threshold value to determine all the extremum points in the sample, this method is too sensitive to singularities, if there is a super large value, the threshold will increase a lot, resulting in failure of QRS complex detection, which means the large T wave may be considered to be a R wave, or a slightly smaller R wave is missed. Because in the terms of the ECG signal, after the extraction of extremum points, there are two main types can be confused with the R wave, one is the large T wave, the other is the notch appeared on the R wave. The missed or wrong detection of the R peak will definitely influence subsequent detection of the ST segment and the T wave. So the improved method is to use multi-scale wavelet transform to detect the QRS complex, which has a good detection rate for most kinds of the abnormal QRS complex. It can accurately distinguish various waves, and also detect the P wave and the T wave.
4.1.2 The singularity of wavelet detection
In the signal, irregular mutations and singular points often contain more important information, which is one of important features of the signal. As described in section 3.2, Fourier transform is the main method to study singularity of the function. However, Fourier
distribution of singularities in space. Wavelet analysis has the property of spatial locality, so it is more effective to analyze the singularity, the location and the degree of singularities by using wavelet analysis.
For the singularity, it is necessary to give a precise quantitative description of the regularity for the signal f (t). Lipschitz exponent can be used to measure the regularity of a signal. If f is at v point and Lipschitzα < l , then f is not differentiable at v point and α depicts its singular type.
Mallat and others have shown that when f is at v point, the local Lipschitz regularity is dependent on the decay of |Wf(u,s)| at fine scales, which is the neighborhood of v. Measuring this asymptotic decay is equivalent to focusing the fine structure of a signal with a scale tending to zero. It is unnecessary to measure the decay directly in the time-scale plane (u, s). In practice, the decay of |Wf(u,s)| can be controlled by its local maxima, then using modulus maxima to represent them.
At a certain scale s0, if there is a point (u0,s0) makes W ( 0, 0) 0
y s u
f . Then the point
(u0,s0) is the local extremum, and there is a modulus extremum on
y s u f W ( 0, 0) when u = u0.
If there is |Wf(u,s0)||Wf(u0,s0)|, when any point u in the neighborhood of u0, then the
point (u0,s0) is the modulus maximum for wavelet transform. The connection of all of them is called a modulus maximum line.
If and only if there is a wavelet maximum sequence (up,sp)pN converges to v at fine scales, that is,
0 s lim lim p p p p u v (4.4)
Then f is singular at point v. The result ensures that all singularities can be detected by searching abscissa values that make modulus maxima converge at fine scales. In order to better understand the significance of these maxima, the wavelet transform is written into a multi-scale differential operator. If the wavelet with compact support has the n vanishing moments, it can be proved that wavelet transform is equivalent to a n-order multi-scale differential operator, which is a function with compact support set, so that
n n n dt t d t) ( 1) ( ) ( (4.5) Then Wf( , ) (f * s)(u) du d s s u n nn (4.6) Where ( ) 1/2 ( / ) s t s t s
If the wavelet has only the one vanishing moment, the wavelet modulus maximum is the maximum of the first derivative after f is smoothed with . If the wavelet has two vanishings moments, the modulus maximum corresponds to the high-order curvature. If Wf(u,s) has no modulus maximum at fine scales, then f must be local regular.
4.1.3 Wavelet transform for QRS complex detection 4.1.3.1 Wavelet function selection
The Gaussian function can be used to construct a wavelet series, and any order derivative of Gaussian function is an infinite smooth wavelet, and the nth derivative has n vanishing moments. Therefore, using modulus maxima of the signal f (t) by wavelet transform, the singularity of f (t) can be detected until the (n-1)th derivative. Through the above analysis, there is a QRS complex randomly extracted from sample e0106 in European ST-T Database, using the first derivative and the second derivative of Gaussian function as wavelet function respectively to transform it, and the comparison result is shown in Figure 21.
Figure 21. Using coefficient gaus1 and gaus2 to make wavelet transform in the ECG signal All singularities of the signal f (t) are located along the modulus maximum line at the scale-time space when the scale tends to zero. That is, the smaller the scale, the closer the singularity and the modulus maximum position. So in Figure 21, the modulus maximum corresponding to the singularity at scale 1 is selected. This QRS complex is a common one with a upward R peak. For the sake of facilitating comparison, the coordinates of coefficient gaus1 and coefficient gaus2 are identical. It can be seen that the results of the wavelet transform in the ECG signal using the first derivative and the second derivative of Gaussian function as the wavelet function are consistent with the previous analysis. Therefore, the peak position can be obtained by finding the zero crossing on the signal with gaus1 wavelet transform, or finding the extremum on the signal with gaus2 wavelet transform. Here the difference between the two wavelet functions for determining the peak position need to be compared.
It can be seen from Figure 21, compared with coefficient gaus2, coefficient gaus1 is more sensitive to the mutation of the signal, and its modulus maxima pair is sharper than the extremum in coefficient gaus2, which is convenient to be detected. Meanwhile, the noise will make the waveform with the wavelet coefficients near the modulus maximum have a certain oscillation, so it is very difficult for coefficient gaus2 to select a uniform threshold to determine whether the local extremum is the required modulus maximum. If the local
* *
this contradiction is much smaller. Moreover, the modulus maxima pair has more constraints on itself, in other words, it is necessary to ensure it with inverse amplitudes. This can greatly improve the accuracy of detection. Therefore, the wavelet gaus1 is used to detect the QRS complex in the ECG signal.
4.1.3.2 Peak detection of the QRS complex
In the aspect of ECG feature extraction, it is feasible to locate mutation by using the modulus maxima pair of continuous wavelet transform. In the existing peak detection and calibration, the wavelet function is more of the first differential wavelet. After the wavelet decomposition of the ECG signal, various signal parts can be found at different scales to correspond with a pair of modulus maxima. Since in the continuous wavelet transform, the modulus maxima pair, a positive one and a negative one, corresponds to the singularity(mutation). The singularity position can be determined by searching zero crossings between the modulus maxima pair. The core strategy of the detection algorithm is to search the zero crossing between the modulus maxima pair at a certain scale or some scales. The R wave corresponds to a modulus maxima pair at each scale, and zero crossing between them is its peak position, R peak.
Then, based on these, some strategies are put forward to improve the detection, also making a time shift correction between the peak position and zero crossing of the modulus maxima pair, but it is still unable to accurately locate the peak point. In this tesina, the first derivative of Gaussian function, which belongs to the first differential wavelet as well, is used as the wavelet function. Then the zero crossing in the ECG signal with wavelet transform corresponds to the peak position. However, in this tesina, the method of peak detection has further improved that can be used to locate the peak accurately.
The specific process of R peak detection is: making wavelet transform in the ECG signal at scale 1, in which the wavelet function is the first derivative of Gaussian function. Detection of the modulus minimax pair with zero crossing property is made on it, each detection of such the modulus minimax pair means that the ECG signal has a peak within the interval. Then, the local extremum, the peak position, is searched in the interval which is determined by each modulus minimax pair. Furthermore, because the Q wave and the S wave are the mutation with smaller amplitude in the ECG signal, also can be detected by wavelet transform with the signal mutation characteristic. According to the R peak, it is reasonable to forward and backward search for the Q peak and the S peak in the ECG signal. As shown in Figure 21, "*" indicates the modulus minimax pair with zero crossing property, the interval between the leftmost and the rightmost line is the scope where the R peak exists, and "O" is the R peak detected in that scope.
The optimization of this method is not to directly find the zero crossing of the modulus minimax pair, but only to use it to determine the range of the peak, then return to the ECG signal to search the peak. Completely taking advantage of time domain information from wavelet transform, that can avoid the time shift between the peak position and the zero crossing of the modulus maxima pair, which greatly improves the accuracy of peak detection.
4.1.3.3 QRS onset and offset detection
In general, the method of QRS onset and offset detection is basically the slope threshold detection. This method is forward and backward respectively to search the point with the slope close to zero using the R peak, the Q peak or the S peak as the center, that is, the location is determined as the QRS onset and the QRS offset once the curve changes into a horizontal line. The method is not ideal to realize in programming, and the result of detection