A
fluorogenic cyclic peptide for imaging and
quanti
fication of drug-induced apoptosis
Nicole D. Barth
1,7
, Ramon Subiros-Funosas
1,7
, Lorena Mendive-Tapia
1
, Rodger Duf
fin
1
, Mario A. Shields
2
,
Jennifer A. Cartwright
1
, Sónia Troeira Henriques
3,6
, Jesus Sot
4
, Felix M. Goñi
4
, Rodolfo Lavilla
5
,
John A. Marwick
1
, Sonja Vermeren
1
, Adriano G. Rossi
1
, Mikala Egeblad
2
, Ian Drans
field
1
✉
&
Marc Vendrell
1
✉
Programmed cell death or apoptosis is a central biological process that is dysregulated in
many diseases, including inflammatory conditions and cancer. The detection and
quantifi-cation of apoptotic cells in vivo is hampered by the need for
fixatives or washing steps for
non-
fluorogenic reagents, and by the low levels of free calcium in diseased tissues that
restrict the use of annexins. In this manuscript, we report the rational design of a highly stable
fluorogenic peptide (termed Apo-15) that selectively stains apoptotic cells in vitro and in vivo
in a calcium-independent manner and under wash-free conditions. Furthermore, using a
combination of chemical and biophysical methods, we identify phosphatidylserine as a
molecular target of
Apo-15. We demonstrate that Apo-15 can be used for the quanti
fication
and imaging of drug-induced apoptosis in preclinical mouse models, thus creating
opportu-nities for assessing the in vivo ef
ficacy of anti-inflammatory and anti-cancer therapeutics.
https://doi.org/10.1038/s41467-020-17772-7
OPEN
1Centre for Inflammation Research, University of Edinburgh, EH16 4TJ Edinburgh, UK.2Cold Spring Harbor Laboratory, Cold Spring Harbor, NY 11724, USA. 3Institute for Molecular Bioscience, The University of Queensland, Brisbane, Queensland 4072, Australia.4Instituto Biofisika (CSIC, UPV/EHU) and Departamento de Bioquímica, Universidad del País Vasco, Campus de Leioa, 48940 Leioa, Spain.5Laboratory of Medicinal Chemistry and Institute of Biomedicine U. Barcelona (IBUB), Faculty of Pharmacy, University of Barcelona, 08028 Barcelona, Spain.6Present address: School of Biomedical Sciences,
Queensland University of Technology, Translational Research Institute, Brisbane, QLD 4102, Australia.7These authors contributed equally: Nicole D. Barth,
Ramon Subiros-Funosas. ✉email:i.dransfi[email protected];[email protected]
123456789
P
rogrammed cell death (apoptosis) is pivotal for
main-tenance of tissues and the regulation of inflammatory
dis-eases. In contrast to necrosis, plasma membrane integrity is
preserved during apoptosis, preventing the release of intracellular
contents that can damage tissue and trigger inflammatory
responses. Tissue phagocytes recognize apoptotic cells, providing
a mechanism for the safe disposal of apoptotic material. Critically,
excessive apoptosis or failure to clear apoptotic material results in
secondary necrosis with the release of pro-inflammatory
intra-cellular contents. Therefore, the presence of apoptotic cells
represents a biomarker of the extent of tissue injury and
corre-lates to the progression, resolution, and treatment of
inflamma-tory conditions and cancer
1,2.
A sequence of morphological and biochemical changes occurs
during apoptosis (e.g., phospholipid exposure, caspase activation,
mitochondrial dysfunction, DNA fragmentation)
3–6. Optical
reagents for the detection of these events have been reported, but
many probes alter cellular behavior, limiting their use for
non-invasive detection of apoptosis in vivo. In particular, these
lim-itations impede studies under physiological conditions (e.g.,
intravital imaging) and in situ assessment of therapy-induced
apoptosis in preclinical models. At early stages of apoptosis, the
plasma membrane undergoes profound remodeling and the
activation of the scramblase Xkr8 promotes external exposure of
phospholipids containing phosphatidylserine (PS)-headgroups
and other phospholipids, which are normally restricted to the
intracellular leaflet
7. Reagents that bind to PS exposed on the
plasma membrane (e.g., annexins)
4,8have advantages over those
monitoring intracellular changes (e.g., caspase activation, DNA
fragmentation) because they do not require cell permeabilization
or
fixation. However, fluorescently-labeled annexins and
polarity-sensitive annexins (pSIVA) require high concentrations of free
Ca
2+(>1 mM) to permit optimal phospholipid binding
4,5,
lim-iting their performance in the hypocalcemic regions that are
common in diseased tissues. Furthermore, annexins inhibit the
engulfment of apoptotic cells by phagocytes
9, which precludes
quantitative analysis of therapy-induced apoptosis in vivo.
In this study, we describe the rational design, optimization and
validation of a
fluorogenic peptide (termed Apo-15) to bind
negatively-charged phospholipids exposed on apoptotic cells.
Apo-15
behaves as a universal apoptosis probe in that it detects
apoptotic cells from multiple origins and in a broad range of
experimental conditions. Furthermore, we demonstrate that
Apo-15
enables
fluorescence imaging of apoptosis in vivo and
quan-tification of drug-induced apoptosis in two different preclinical
mouse models of acute lung injury (ALI) and breast cancer.
Results
Rational design and synthesis of
fluorogenic peptides. We
designed cyclic amphipathic peptides (termed apopeptides) which
we predicted would bind to phospholipids translocated to the outer
leaflet of apoptotic cell membranes. We focused on small cyclic
peptides because they offer several advantages: (1) resistance to
proteolytic cleavage and oxidative conditions for in vivo studies,
(2) tunability of the properties by changing the amino acid
sequence, which would allow us to optimize binding to apoptotic
cells, (3) compatibility with
fluorogenic amino acids for wash-free
imaging, and (4) smaller size than proteins for improved tissue
accessibility. Apopeptides were designed to contain combinations
of polar and hydrophobic amino acids to identify sequences
that would bind to apoptotic cell membranes and remain unable
to bind viable cells. All the apopeptides incorporated the
environmentally-sensitive Trp-BODIPY
fluorophore
10–12, which
emits bright
fluorescence after binding to provide optimal
dis-crimination between viable and apoptotic cells (Fig.
1
a, c).
A total of 15 apopeptides were prepared using solid-phase and
solution peptide synthesis (Fig.
1
b). In addition to Trp-BODIPY,
apopeptides included tryptophan (W), phenylalanine (F), leucine
(L), valine (V), and isoleucine (I) as hydrophobic residues, and
lysine (K), glutamic acid (E), and arginine (R) as polar residues. In
all cases, one glycine was included at the C-terminal end to facilitate
head-to-tail cyclization (for enhanced resistance to proteolysis
13,14),
and to avoid stereoisomeric mixtures. Unprotected amino acids
were used for the hydrophobic residues, whereas protected amino
acids [e.g., Fmoc-Lys(Z)-OH, Fmoc-Glu(Bzl)-OH, Fmoc-Arg
(NO
2)-OH] were used for the polar residues. The solid-phase
peptide elongation was performed on 2-chlorotritylchloride
poly-styrene resin using conventional protocols and mild acidic cleavage
conditions [i.e., TFA:DCM (1:99)]
15. Peptides were cyclized in a
head-to-tail fashion using COMU as the condensation reagent
16,
and side-chain protecting groups were removed to afford all
apopeptides in high purities (>97%) after HPLC purification
(Supplementary Table 1).
The sequences and physicochemical properties of all apopeptides
are summarized in Fig.
1
b. We sought to identify those sequences
that would rapidly binding to apoptotic cells with minimal labeling
of viable cells. cLac-BODIPY, a cyclic peptide able to bind apoptotic
bodies but not apoptotic cells
11, was included for comparison.
Using a
flow cytometry-based assay, we examined the
time-dependent emission of apopeptides in mixtures of both apoptotic
and viable cells. We used human neutrophils cultured in vitro for
18 h, in which a large fraction of the cells (≥50%) undergo tissue
culture-induced apoptosis
17. Apoptotic and viable populations were
defined by positive and negative staining with AF647-Annexin V in
media containing 2 mM CaCl
2, respectively. First, we assessed how
polar residues influenced binding by comparing two peptides with
similar molecular weight and clog P (Supplementary Table 1 and
Fig.
1
b), but with either negatively-charged (Apo-0) or
positively-charged (Apo-2) residues. We chose glutamic acid (E) as a
negatively-charged amino acid over aspartic acid to avoid synthetic
complications due to the potential formation of aspartimides
18.
Apo-2
showed selective binding to apoptotic cells over viable cells
when compared with Apo-0, indicating the importance of positive
charges for binding to negatively-charged phospholipids on
apoptotic cell membranes. Next, we generated amphipathic peptides
containing positively-charged amino acids and other residues that
would alter binding to apoptotic cell membranes
19,20. Specifically,
we synthesized apopeptides to examine the influence of (1)
aromatic vs non-aromatic hydrophobic residues (Apo-3, 4, and
Apo 9
–10), (2) alternate vs sequential charges (Apo 5–8), and (3)
overall polarity as determined by clog P values (Apo 11–14).
Temporal analysis indicated that recognition of apoptotic cells
occurred rapidly, with most apopeptides showing
≥80% of full
binding in <4 min (Supplementary Table 2). From the screening,
we quantified parameters that defined the selectivity and affinity of
apopeptides: (1) preferential binding to apoptotic vs viable cells as
fluorescence fold increase (Ff), (2) background fluorescence on
viable cells (Bf), and (3) retention of binding upon washing (Rt)
(Fig.
1
b). Several apopeptides showed good discrimination between
apoptotic and viable cells (Ff
≥ 10: Apo-2, 3, 6, and 8), negligible
fluorescence on viable cells (Bf ≤ 3: Apo-0, 4, 11, 12, 13, and 14)
and reasonable resistance to washing (Rt
≥ 40%: Apo-2, 3, 6, 8, and
11). Overall, peptide polarity or clog P was related to retention of
labeling (Fig.
1
b). Although markedly polar peptides (clog P <
−4,
Apo-13
and Apo-14) bound with fast kinetics, their signal was lost
after washing. In contrast, less polar peptides (clog P >
−1, Apo-11
and Apo-12) displayed slower binding rates but their binding was
relatively resistant to washing. These analyses suggested that
apopeptides with balanced polarity (clog P between
−1 and −4)
exhibited better labeling. Apo-8 presented the highest retention of
signal but also showed the highest binding to viable cells. Our
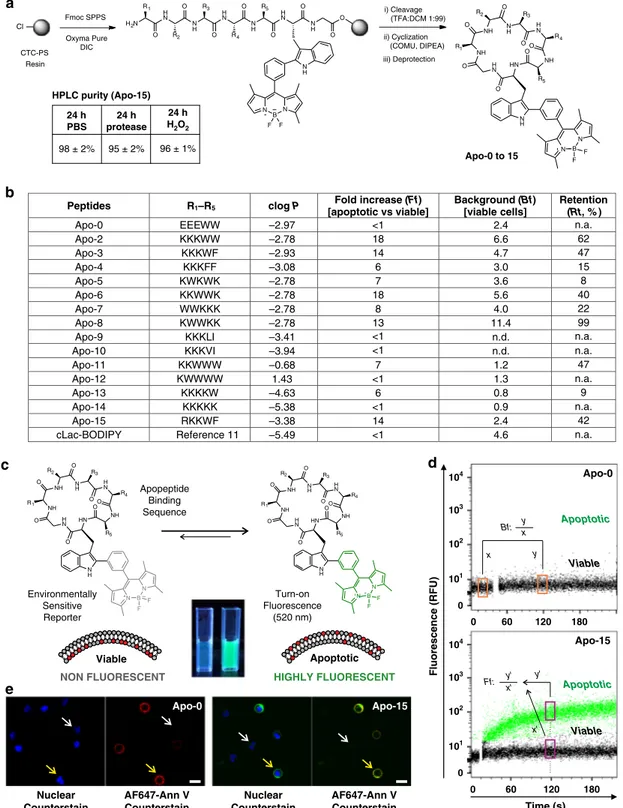
NH NH NH H N NH HN H N R1 R3 R5 R2 R4 O O O OO O N H O N B N F F i) Cleavage (TFA:DCM 1:99) Cl N H N B N H N N H O O O O N H O R5 H N O R4 N H R3 O H N R2 H2N R1 O ii) Cyclization (COMU, DIPEA) F F Fmoc SPPS NH NH NH H N NH HN H N R1 R3 R5 R2 R4 O O O O O O N H O N B N F F CTC-PS Resin Oxyma Pure DIC iii) Deprotection NON FLUORESCENT Apoptotic HIGHLY FLUORESCENT NH NH NH H N NH HN H N R1 R3 R5 R2 R4 O O O O O O N H O N B N F F Turn-on Fluorescence (520 nm) Viable
a
b
Fluorescence (R FU) Apo-0 Bf: x y x y Apoptotic Viable 0 104 103 102 101 0 104 103 102 101 60 120 180 0 Apoptotic Viable Ff: x' y' y' x' Time (s) 60 120 180 0 Apo-15c
d
Nuclear Counterstain AF647-Ann V Counterstain Nuclear Counterstain AF647-Ann V Counterstain Apo-0 Apo-15e
24 h PBS 24 h protease 24 h H2O2 HPLC purity (Apo-15) 98 ± 2% 95 ± 2% 96 ± 1% Environmentally Sensitive Reporter Apopeptide Binding SequencePeptides R1–R5 clog P Fold increase (Ff)
[apoptotic vs viable] Background (Bf) [viable cells] Retention (Rt, % ) Apo-0 EEEWW –2.97 –2.78 –2.93 –3.08 –2.78 –2.78 –2.78 –2.78 –3.41 –3.94 –0.68 1.43 –4.63 –5.38 –3.38 –5.49 <1 2.4 6.6 4.7 3.0 3.6 5.6 4.0 11.4 n.d. n.d. 1.2 1.3 0.8 0.9 2.4 4.6 n.a. Apo-2 KKKWW 18 62 Apo-3 KKKWF 14 47 Apo-4 KKKFF 6 15 Apo-5 KWKWK 7 8 Apo-6 KKWWK 18 40 Apo-7 WWKKK 8 22 Apo-8 KWWKK 13 99
Apo-9 KKKLI <1 n.a.
Apo-10 KKKVI <1 n.a.
Apo-11 KKWWW 7 47
Apo-12 KWWWW <1 n.a.
Apo-13 KKKKW 6 9
Apo-14 KKKKK <1 n.a.
Apo-15 RKKWF 14 42
cLac-BODIPY Reference 11 <1 n.a.
Apo-0 to 15
Fig. 1 Design, synthesis, and in vitro screening of apopeptides. a Synthetic scheme for the preparation of apopeptides (CTC-PS: 2-chlorotritylchloride polystyrene resin). Stability analysis ofApo-15 (50μM) under different proteolytic and oxidative environments. b Sequences, physicochemical and binding properties of apopeptides and cLac-BODIPY. In vitro screening of the peptides (100 nM) was performed by real-timeflow cytometry in mixtures of apoptotic (AF647-Annexin V positive) and viable (AF647-Annexin V negative) neutrophils (n ≥ 3, biologically independent experiments). c Fluorescence activation of apopeptides in apoptotic (right) over viable cells (left), with Trp-BODIPY as the environmentally-sensitive reporter. Pictograms ofApo-15 under 365 nm light excitation.d Representativeflow cytometry plots of Apo-0 and Apo-15 binding to mixtures of apoptotic (highlighted in green dots) and viable cells (highlighted in black dots). Fluorescence emission was recorded for around 4 min after addition of apopeptides (100 nM) without washing. Backgroundfluorescence (Bf) was calculated as the ratio of fluorescence recorded before (x) and 2 min after (y) peptide addition. Fold increase (Ff) in apoptotic cells was calculated as a ratio offluorescence recorded for apoptotic cells (y′) to that of viable cells (x′) after 2 min. e Representative fluorescence confocal microscopy images (from three independent experiments) of viable (white arrows) and apoptotic cells (yellow arrows) after incubation withApo-0 (left, green) and Apo-15 (right, green) (both at 100 nM). Cells were co-stained with Hoechst 33342 (7μM, blue) and AF647-Annexin V (5 nM, red) as nuclei and apoptosis markers, respectively (λexc.: 405, 488, 633 nm:λem.: 450, 525, 670 nm). Scale bars: 10μm. Source data
analyses also revealed the importance of non-electrostatic
interac-tions, with apopeptides lacking hydrophobic aromatic residues
(Apo-9, 10, and 14) exhibiting poor retention of labeling. Besides,
among aromatic amino acids, tryptophan increased specificity
when compared with phenylalanine (Apo-2 vs Apo-4).
Considering all these results, we decided to further optimize the
Apo-3
sequence (Ff: 14; Bf: 4.7; Rt: 47%) to reduce its background
fluorescence on viable cells while retaining full binding to
apoptotic cells. Arginine-rich peptides have been described to
strongly bind molecular targets in other amphipathic sequences,
partially due to the larger polar surface area of arginine compared
with lysine
21. Therefore, we synthesized Apo-15 by replacing one
lysine with an arginine residue. Apo-15 [sequence: c(RKKWFW
(BODIPY)G)] displays high selectivity for apoptotic cells (Ff: 14),
marginal background
fluorescence on viable cells (Bf: 2.4) and
good retention of signal after three washes with PBS (Rt: 42%).
Representative
flow cytometry plots for Apo-0, which does not
bind to apoptotic cells, and Apo-15 are shown in Fig.
1
d. We also
examined Apo-0 and Apo-15 for imaging apoptotic cells in the
presence of viable cells (Fig.
1
e). Apo-15 displays
fluorescence in
the green region of the visible spectrum, being compatible with
conventional GFP and FITC
filters (λ
abs.: 500 nm;
λ
em.: 530 nm;
Supplementary Fig. 1). Notably, Apo-15 displays around 10-fold
brightness (25,000 M
−1cm
−1) over other
environmentally-sensitive probes for apoptosis [e.g., pSIVA (2500 M
−1cm
−1), N,
N′-didansyl-L-cystin (3000 M
−1cm
−1) (Table
1
)], which allows
the staining of apoptotic cells at nanomolar concentrations
(30–100 nM, Supplementary Fig. 2). Apo-15 also exhibits high
chemical stability under proteolytic and oxidative conditions.
HPLC analysis confirmed >95% of Apo-15 remained stable after
incubation with a protease cocktail or the oxidizing agent H
2O
2(Fig.
1
a and Supplementary Figs. 3, 4). Altogether, these properties
made Apo-15 an optimal candidate for further characterization.
Apo-15 delineates apoptotic cells in diverse environments.
Next, we evaluated Apo-15 for the general detection of apoptotic
cells from different species and lineages. We observed that
Apo-15
selectively stained apoptotic cells regardless of their origin.
Specifically, we examined myeloid cells (neutrophils, both human
and mouse, Supplementary Fig. 5), lymphoid cells (BL-2, Burkitt
lymphoma) and primary epithelial cells. We performed these
experiments in the presence of AF647-Annexin V to corroborate
that Apo-15 stains apoptotic and not viable cells. Notably, we
observed very similar staining for Apo-15 and AF647-Annexin V
in media containing 2 mM CaCl
2(Fig.
2
a, b). Furthermore,
Apo-15
labeling proved to be independent of the method used to
induce apoptosis [e.g., myeloid: tissue culture-induced apoptosis
by culture at 37 °C for 18 h; lymphoid: irradiation with a CL-1000
Ultraviolet Crosslinker UVP at 254 nm; epithelial: treatment with
staurosporine (1 µM) for 6 h], which highlights the compatibility
of Apo-15 with multiple experimental conditions.
A limitation of annexins is their dependence on high
concentrations of free Ca
2+(>1 mM), which affects their use in
hypocalcemic environments in diseased tissues
22. Therefore, we
decided to assess whether Apo-15 was able to delineate apoptotic
cells independently of the concentration of free divalent cations.
Notably, we observed robust binding of Apo-15 to myeloid and
lymphoid apoptotic cells in the presence of the divalent cation
chelator EDTA (2.5 mM), whereas AF647-Annexin V failed to
bind under the same experimental conditions (Fig.
2
b–d). Ca
2+-dependent binding to apoptotic cells was also observed for
polarity-sensitive annexins (pSIVA)
8(Supplementary Fig. 6). The
divalent cation-independence of Apo-15 represents a major
advantage over annexins and allows direct monitoring of
apoptosis in most conditions likely to be encountered in vivo.
Table
1
Comparative
analysis
of
Apo-15
and
commercially
-a
vailable
fl
uorescent
probes
for
the
detection
of
apoptosis.
Probe Apo-15 Annexins pSIVA N,N ′-Didansyl-L-cystin JC1 Nonyl acridine orange Active caspase-3/7 PI Fluorescence wavelengths (λexc. /λ em. , nm) 500/520 Variable 465/540 365/530 488/ 530 –590 495/519 Variable 535/617 Brightness (φ × ε) 25,000 Variable 2500 3000 n.a. 20,000 Variable <100 Molecular weight 1.3 kDa ~36 kDa ~35 kDa 707 Da n.a. 473 Da Variable 668 Da Molecular target PS PS PS n.a. Mito memb potential Cardiolipin Activated caspases 3/7 DNA Early /late apoptosis Early Early Early Early Mid Mid-late Late Late Divalent cation-independence Yes No No Yes Yes Yes Yes Yes Wash-free imaging Yes High Ca 2+ High Ca 2+ Yes No No No No Apoptotic cell sorting Yes High Ca 2+ High Ca 2+ No No No No No Functionally neutral Yes No No n.a. No n.a. No Yes Phagocytic engulfment marker Yes No No No No No No No Applications FC, IHC, CM, FP, intravital FC, IHC, CM (high Ca 2+ ) FC, IHC, CM (high Ca 2+ ) FC, CM FC, CM FC, CM FC, IHC FC, IHC References This work 4 , 59 8 , 60 19 , 61 5 , 62 63 , 64 3 , 65 66 , 67 CM confocal microscopy ,FC fl ow cytometry, FP fl uorescence polarization, IHC immunoh istochemistry, PI propidium iodid e.To confirm that cells stained by Apo-15 under divalent
cation-free conditions were apoptotic, we sorted a mixed population of
apoptotic and viable human neutrophils (gating strategy in
Supplementary Fig. 7) according to Apo-15 labeling and examined
their morphology by microscopy. Apo-15-positive neutrophils
exhibited a pyknotic nucleus characteristic of chromatin
con-densation and degradation, together with cell shrinkage, which are
hallmarks of apoptosis (Fig.
2
c)
23. In contrast, Apo-15-negative
cells showed the typical multilobed nuclear morphology of viable
neutrophils (Fig.
2
c). The morphological appearance of
Apo-15-positive cells was examined by scanning electron microscopy.
Apo-15-positive neutrophils showed evidence of
apoptosis-associated blebbing and pitting of the plasma membrane
(Supplementary Fig. 8)
24,25. On the other hand, the presence of
microvilli-like structures, which are typical of viable cells, were
observed on the plasma membrane of Apo-15-negative cells
(Supplementary Fig. 8). Apo-15 also discriminated between
different types of cell death by
fluorescence lifetime imaging
(FLIM). Human BL-2 cells were induced into apoptosis or
necrosis by differential UV irradiation, incubated with Apo-15
and imaged under a FLIM microscope to reveal that apoptotic and
necrotic cells could be discriminated by their
fluorescence lifetimes
(Supplementary Fig. 9). Altogether, these results demonstrate that
Apo-15
is a generic marker of apoptotic cells under different
physiological environments and compatible with multiple
biolo-gical studies.
Apo-15 rapidly binds PS for real-time and wash-free imaging.
In view of the specific labeling of apoptotic cells by Apo-15, we
examined whether the amphipathic nature of Apo-15 conferred
Apo-15 Merged (+Hoechst)
Myeloid L ymphoi d Epithelial AF647-Annexin V AF647-Annexin V Apo-15 AF647-Annexin V FACS sorting Percentage stained cells (% ) p < 0.0001 p < 0.0001 p < 0.0001 p = 0.6738 p = 0.0505 p = 0.0776 Apo-15
a
b
d
c
AF647-Annexin V Apo-15 103 102 101 101 102 103 AF647-Annexin V 0 103 102 101 101 102 103 0 Apo-15 p = 0.0125 p = 0.7129 t (h) UV (mJ cm–2 ) Ca2+ (2 mM) Apo-15 Annexin V0 0 18 18 18 18 n.a. n.a. n.a. n.a.
n.a. n.a. n.a. n.a. n.a. n.a. 0 0 300 300
+ + + + – + + + + + – + – + – + – + – + – – + – + – + – + – n.a. n.a. 300 300 + – – + – – Staurosp. Ca2+(2 mM) Apo-15 Annexin V + + + + – + – + – + – + – – + – + – + + + + – – Percentage stained cells (% ) p < 0.0001 p = 0.7563 p = 0.0016 p = 0.040 +2 mM Ca2+ (annexin binding) 103 102 101 101 102 103 0 103 102 101 101 102 103 0 +2 mM Ca2+ (annexin binding) +2.5 mM EDTA (annexin not binding) +2.5 mM EDTA (annexin not binding)
Lymphoid Myeloid Epithelial 0 10 20 30 0 20 40 60 80 100
Fig. 2 Apo-15 binds to apoptotic cells of different origin in multiple environments. a Representativefluorescence confocal microscopy images (from three independent experiments) human apoptotic (yellow arrows) and viable (white arrows) cells from different lineages: BL-2 (lymphoid), neutrophils (myeloid), and primary airway epithelial cells (epithelial). Cells were incubated withApo-15 (100 nM, green), AF647-Annexin V (5 nM, red), and Hoechst 33342 (7μM, blue) for 10 min and imaged under a fluorescence confocal microscope (λexc.: 405, 488, 633 nm:λem.: 450, 525, 670 nm). Scale bars: 10µm.
b Divalent cation-independent binding of Apo-15 to apoptotic cells of different origin (top plots: lymphoid cells, bottom plots: myeloid cells). Mixtures of apoptotic (highlighted in green dots) and viable cells (highlighted in black dots) were stained with AF647-Annexin V (25 nM) andApo-15 (100 nM) in the presence of 2 mM CaCl2(left) or 2.5 mM EDTA (right). Representative histograms showingApo-15 binding (x-axis) vs AF647-Annexin V binding (y-axis)
acquired on 5L LSRflow cytometer (n = 5). c Cells were sorted on their Apo-15 positivity (green populations in panel b) or negativity (black populations in panelb). Gating strategy in Supplementary Fig. 7. Morphological analysis (four independent images from two independent experiments) of cytocentrifuge preparations ofApo-15-positive and Apo-15-negative cells under brightfield microscopy (scale bar: 10 µm). d Quantification of fluorescence staining of neutrophils (myeloid,n ≥ 5), BL-2 cells (lymphoid, n ≥ 3) and primary airway epithelial cells (epithelial, n = 5) before and after induction of apoptosis and upon treatment withApo-15 and AF647-Annexin V. Data acquired on 5 L LSRflow cytometer and presented as mean values ± SEM. P values obtained from two-tailedt tests. Source data (in d) are provided as a Source data file.
binding to negatively-charged phospholipids (e.g., containing
PS-headgroups) that are exposed on the plasma membrane of
apoptotic cells but are inaccessible in most viable cells. We used
giant unilamellar vesicles (GUVs, 1–10 μm) composed of neutral
phospholipids (containing only phosphatidylcholine
(PC)-head-groups, 0.2 mM) or mixed with negatively-charged
PS-phospho-lipids
(PC:
0.14 mM,
PS:
0.06 mM).
Using
fluorescence
microscopy, we observed that Apo-15 stained PC:PS GUVs with
brighter intensity than PC GUVs of similar size (Fig.
3
a, b).
Binding to PS in PC:PS GUVs was confirmed by co-staining with
the positive control AF647-Annexin V in 2 mM CaCl
2. On the
other hand, we did not observe significant differences in
fluores-cence intensity between PC:PS GUVs and PC GUVs when stained
with the lipid marker Lissamine-Rhodamine DOPE. Furthermore,
we analyzed the specificity of Apo-15 for PS over other
phos-pholipids [i.e., cardiolipin, PC, phosphatidylglycine,
phosphati-dylethanolamine (PE)] and also phosphatidic acid. Apo-15
exhibited dose-dependent and significantly stronger binding to PS
(Fig.
3
b and Supplementary Fig. 10) and showed preferential
binding to PS over PE, which is also known to localize on the
outer leaflet of the plasma membrane following induction of
apoptosis
26. Apo-15 proved compatible with anisotropy readings,
104 103
Time (apoptosis progression)
Apo-15 AF647-Ann V Time (min) 0' 4' 13 ' 0' 9' Apo-15 Fluorescence Lissamine Apo-15 AF647-Ann V Merged
PC PC:PS
b
a
d
f
e
g
c
p-values PS vs. PG: 0.0040 PS vs. PE: 0.0017 PS vs. CL: 0.0019 PS vs. PA: 0.0048 PS vs. PC <0.0001 BL-2 (PS exposure) PLB-985 (lack of PS exposure) 40 ± 3 % Apo-15+ 1.0 ± 0.3 % Apo-15+ 0 3.6 ± 1 % Apo-15+ 4 ± 1 % Apo-15+ 104 104 103 103 102 102 101 101 0 104 103 102 101 AF647-A nnexin V AF647-A nnexin V Apo-15 Fluorescence 0 Viable Apoptotic Counts [Annexin V] no Annexin 5 nM 20 nM 85 nM270 nM 5 nM 20 nM 85 nM 270 nM p = 0.0006 p = 0.0458 Apo-15 only PS PG PE CL PA PC 4000 8000 12,000 16,000 Fluorescence Apo-15 (R FU) 0 2000 4000 6000 8000Fluorescence Apo-15 (RFU
) 0 0 200 400 Time (s) 600 800 1000 10,000 20,000 30,000 40,000 Fluorescence intensity (RFU )
showing concentration-dependent
fluorescence polarization in
PS-containing liposomes due to the environmentally-sensitive nature
of Trp-BODIPY (Supplementary Fig. 11).
Next, we examined whether Apo-15 could bind PS in cell
membranes. First, we performed competitive assays between
AF647-Annexin V and Apo-15 at different concentrations in
co-cultures of viable and apoptotic cells. We observed that high
concentrations of AF647-Annexin V could reduce binding of
Apo-15
to apoptotic cells (Fig.
3
c) and also that Apo-15 reduced
Annexin V binding (Supplementary Fig. 12), suggesting that
Annexin V and Apo-15 compete for binding sites on the surface
of apoptotic cells. Secondly, we used a human cell line (i.e.,
PLB-985) that is unable to translocate phospholipids to the outer
leaflet of the plasma membrane during apoptosis due to lack of
scramblase Xkr8
27. As a control, we used human BL-2 cells,
which expose PS on their membrane upon induction of apoptosis.
Apoptosis in both PLB-985 and BL-2 cells was induced by
treatment with staurosporine, followed by incubation with
Apo-15
and
flow cytometry analysis. Apo-15 stained around 40% of
BL-2 cells, which were also stained with AF647-Annexin V,
confirming that they were apoptotic (Fig.
3
d). In contrast, only
1% of PLB-985 cells were Apo-15-positive under the same
experimental conditions (Fig.
3
d). We corroborated that the
treatment with staurosporine induced apoptosis in PLB-985 cells
by detection of cleaved caspase-3/7 (Supplementary Fig. 13)
28,29.
Taken together, these results indicate that the selective binding of
Apo-15
occurs at early stages of apoptosis when PS is
translocated to the outer leaflet of apoptotic cells.
Given the rapid binding and
fluorogenic properties of Apo-15,
we evaluated its application for real-time imaging of cells actively
undergoing apoptosis. BL-2 cells were induced to apoptosis by
exposure to UV light and treated with Apo-15 just before
time-lapse movies were acquired under wash-free conditions in a
live-cell spinning-disk microscope. We observed minimal background
fluorescence suggesting that the Apo-15 is compatible with
wash-free imaging with similar signal-to-noise ratios to annexin-based
reagents (Supplementary Fig. 14). We also observed cells that
transitioned from being non-fluorescent (i.e., viable) to
Apo-15-labeled (i.e., apoptotic), confirmed by simultaneous staining with
AF647-Annexin V (Fig.
3
e and Supplementary Movies 1 and 2).
Furthermore, time-lapse quantification of the fluorescence
intensity in multiple transitioning cells demonstrated that
Apo-15
bound rapidly to apoptotic cells, with more than 90% of the
association occurring in <10 min (Fig.
3
f). Next, we exploited
these features of Apo-15 to non-invasively image the dynamics of
formation of apoptotic bodies and vesicles, which have a critical
role in intercellular communication
30, and are difficult to image
with annexins due to the formation of two-dimensional crystal
lattices that alter membrane dynamics
31. Time-lapse imaging
following induction of apoptosis in the presence of Apo-15
revealed rapid release (<10 min) of subcellular vesicles and, in
some cases, reintegration of vesicles back into the plasma
membrane (Fig.
3
g and Supplementary Movie 3). These results
confirm the utility of Apo-15 for wash-free imaging of early
apoptotic events at both cellular and subcellular levels.
Apo-15 enables imaging of apoptotic cell clearance. Functional
neutrality is an essential requirement for probes that enable
imaging of biological processes under live-cell conditions. First,
we tested whether Apo-15 affected the rate at which apoptosis
occurs in vitro. For these experiments, we cultured human
neu-trophils in the presence of different concentrations of Apo-15 and
examined the extent of tissue culture-induced apoptosis at
dif-ferent timepoints. Even when used at higher concentrations than
those required for imaging or
flow cytometry, Apo-15 did not
affect the detection or the quantification of apoptosis, as
mea-sured by staining with AF647-Annexin V (Fig.
4
a).
One potential limitation to the use of annexins for imaging
apoptosis is their interference with the clearance of apoptotic cells
by phagocytes. This is important for in vivo imaging studies, since
the perturbation of apoptotic cell clearance could result in over- or
under-estimation of the extent of apoptosis within a tissue. We
examined whether Apo-15 affected the engulfment of apoptotic
cells using a well-established in vitro assay to quantify the extent of
phagocytosis in human monocyte-derived macrophages (MDMs)
in the presence of the PS-opsonin protein S (Fig.
4
b)
32,33. Unlike
Annexin V, which significantly reduces (~50%) the phagocytic
capacity of MDMs, Apo-15 did not inhibit the phagocytosis of
apoptotic cells, even when it was used at high concentrations
(Fig.
4
c). These observations were further corroborated by
fluorescence microscopy assays in co-cultures of human MDMs
and apoptotic neutrophils, where we clearly observed engulfment
of Apo-15-labeled apoptotic cells and retention of Apo-15 staining
after phagocytosis (Fig.
4
d). This result opens the possibility of
using Apo-15 as a probe for tracking phagocytosis under live-cell
conditions.
Apo-15 detects drug-induced apoptosis in mouse models.
Preclinical and clinical studies have shown that low levels of free
Ca
2+are common in disease
22, with many studies (e.g., intravital
imaging, in vivo therapy evaluation) being hampered by the lack
of specific apoptosis reagents that are effective in those
physio-logical environments. Given the rapid, specific and divalent
Fig. 3 Apo-15 rapidly binds exposed PS on the surface of apoptotic cells. a Fluorescence microscope images (three independent images from two independent experiments) of GUVs with differential lipid content (PC and PC:PS). Vesicles were stained with 0.3 mol% Lissamine-Rho-DOPE (blue), Apo-15 (100 nM, green) and AF647-Annexin V (5 nM, red) (λexc.: 488, 561, 633 nm:λem.: 525, 593, >650 nm). Scale bar: 10µm. b Binding specificity ofApo-15 upon incubation with different phospholipids (PS: phosphatidylserine, PG: phosphatidylglycine, PE: phosphatidylethanolamine, CL: cardiolipin, PA: phosphatidic acid, PC: phosphatidylcholine). Data acquired on a spectrophotometer (λexc.: 450 nm,λem.: 520 nm,n > 10, except for PA) and presented as
mean values ± SEM.c Representative histograms showing Apo-15 (100 nM) labeling of mixed populations of viable and apoptotic neutrophils upon competition with increasing concentrations of AF647-Annexin V, together with quantification of the mean fluorescence intensity of Apo-15-stained apoptotic cells (n ≥ 3) presented as mean values ± SEM. d Representative histograms of BL-2 and PLB-985 cells after treatment with staurosporine (1 µM for 3 h) and staining with AF647-Annexin V andApo-15 (n = 3). Apo-15-stained cells are highlighted as green dots and Apo-15-negative cells are highlighted as black dots. Gating strategy in Supplementary Fig. 7.e Time-lapsefluorescence snapshots (from three independent experiments) of apoptotic BL-2 cells after UV irradiation (300 mJ cm−2) (Supplementary Movies 1 and 2). BL-2 cells were treated withApo-15 (green) and AF647-Annexin V (red) and imaged every 30 s for 15 min without washing. Arrows point at a cell when viable (white) and when undergoing apoptosis (yellow). Scale bar: 10µm. f Quantification of Apo-15 fluorescence intensity and presented as mean values ± SEM over time from Supplementary Movie 1 (n = 3 independent measurements).g Time-lapsefluorescence images (from five independent cells) of subcellular apoptotic bodies (white arrow) in apoptotic neutrophils stained withApo-15 (green). Images were acquired every 1 s for 15 min (Supplementary Movie 3). Scale bar: 2µm. For (b) and (c), P values were obtained from two-tailedt tests. Source data (in b, c, and f) are provided as a Source data file.
cation-independent binding of Apo-15, together with its
wash-free capabilities and functional neutrality, we examined whether
Apo-15
could be used for imaging of apoptotic cells in vivo in a
mouse model of ALI. This model allows temporal control
of neutrophil recruitment by intratracheal administration of
lipopolysaccharide (LPS), which is followed by neutrophil
apop-tosis and subsequent clearance by phagocytic macrophages
34.
Importantly, this is a preclinical model in which the extent of
apoptosis can be modulated by cyclin-dependent kinase
inhibi-tors (CDKi)
35. CDKi have profound effects on inflammatory cells
and some are under development as anticancer therapies
36,37.
First, we confirmed that Apo-15 could detect CDKi-induced
apoptosis in vitro. Neutrophils incubated with the CDKi
R-roscovitine exhibited increased apoptosis by
flow cytometry (as
defined by Annexin V-positive staining) with a concomitant
increase in the proportion of Apo-15 stained cells (Fig.
5
a).
Apo-15
staining of CDKi-induced apoptosis was also
caspase-dependent as confirmed by a significant reduction in the
fluorescent signal after treatment with the caspase inhibitor
QVD
34(Fig.
5
a). Next, we induced ALI in vivo in mice by
intratracheal administration of E. coli-derived LPS (1
μg per
mouse), and the apoptotic load in the lungs relative to saline
control was increased by intraperitoneal administration of CDKi
AT7519
38(Fig.
5
b). In all mice, we administered Apo-15 in vivo
and, 30 min later, we collected bronchoalveolar lavage
fluid
(BALF) together with lung tissues. BALF and lung slices from
LPS-only and LPS
+ CDKi mice were analyzed by
multipara-meter
flow cytometry to determine the proportion of apoptotic
cells that had been stained by Apo-15 in vivo (gating strategy in
Supplementary Fig. 15). Notably, a proportion of CD45
+ Ly6G+
a
d
c
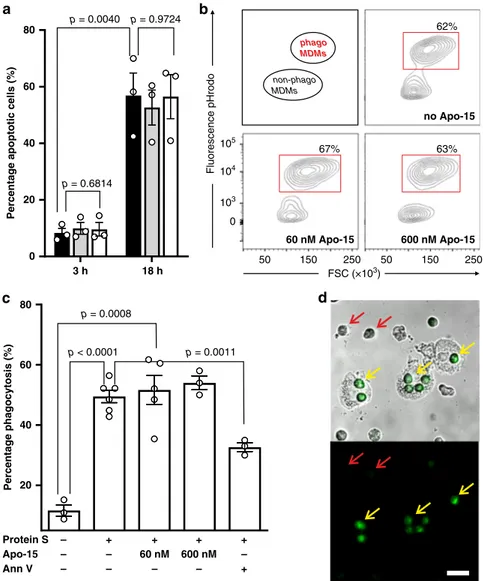
0 20 40 60 80Percentage apoptotic cells (%
) 3 h 18 h p = 0.9724 p = 0.0040 p = 0.6814 Protein S Apo-15 Ann V – – – p = 0.0008 p = 0.0011 p < 0.0001 – – + – + – – + + 20 40 60 80 Percentage phagocytosis (% ) 60 nM 600 nM
b
phago MDMs non-phago MDMs 0 105 104 103 50 150 250 50 150 250 FSC (×103) Fluorescence pHrodo no Apo-15 60 nM Apo-15 600 nM Apo-15 62% 67% 63% +Fig. 4 Apo-15 does not interfere with the phagocytosis of apoptotic cells. a Percentages of human neutrophils undergoing apoptosis, as indicated by AF647-Annexin V staining, induced after culture at 37 °C for different times (3 h: left; 18 h: right). Neutrophils were cultured in the absence (black) or presence ofApo-15 (gray: 100 nM, white: 300 nM). Data presented as mean values ± SEM (n = 3). b Representative histograms of glucocorticoid-treated human MDMs after phagocytosis of pHrodoTM-labeled neutrophils in the presence of different concentrations ofApo-15. Cells were analyzed using a 5L LSR cytometer with MDM identified based on their distinctive forward and side scatter properties (n = 4). Gating strategy in Supplementary Fig. 15A. c Flow cytometric quantification of phagocytosis of pHrodoTM-labeled neutrophils by human MDMs. Human MDMs and neutrophils were co-cultured in the absence or presence of protein S (25 nM) andApo-15 (60 or 600 nM) or AF647-Annexin V (25 nM). Data presented as mean values ± SEM (n ≥ 3). d Representative brightfield and fluorescence microscope images (from four independent experiments) of Apo-15-treated human neutrophils (green) in co-culture with human MDMs. Red arrows identifynegative viable neutrophils, and yellow arrows indicate MDM that have engulfed Apo-15-labeled apoptotic neutrophils. Scale bar: 20µm. For (a) and (c), P values were obtained from two-tailed t tests. Source data (in a and c) are provided as a Source datafile.
neutrophils in BALF were stained with Apo-15 (Fig.
5
d).
Furthermore, we quantified the effects of CDKi-induced
apop-tosis in vivo by measuring the percentages of apoptotic
neutrophils in total cell counts. BALFs from LPS
+ CDKi-treated
mice showed a significantly larger population of Apo-15-labeled
cells than BALFs from LPS-treated mice (29% vs. 5%, Fig.
5
d).
We confirmed that CD45 + Ly6G+ cells labeled by Apo-15
in vivo were apoptotic by co-staining with AF647-Annexin V
ex vivo (Fig.
5
d). Next, we acquired
fluorescence microscopy
images of lung tissue sections from mice under different regimes
(Fig.
5
c, e). We observed increased numbers of Apo-15-positive
cells in lungs from LPS
+ CDKi-treated mice when compared
with lungs of LPS-treated mice (90 vs 32 cells per
μm
2tissue,
Fig.
5
c) and with lungs from mice that had not been treated with
Apo-15
(Supplementary Figs. 16 and 17). Notably, the signal of
Apo-15-labeled cells was stable following processing with 10%
formalin, suggesting compatibility with
fixed tissue samples.
Furthermore,
flow cytometric analysis demonstrated that Apo-15
could stain CD45
+ CD11c + Annexin V− phagocytic
macro-phages in vivo (gating in Supplementary Fig. 15 and results in
Supplementary Fig. 18). Since viable macrophages were not
stained when BALFs were incubated with Apo-15 ex vivo
(Supplementary Fig. 18), we suggest that these macrophages
acquire
fluorescence because of internalization of Apo-15-labeled
cells, further highlighting the potential utility of Apo-15 for the
identification of cell populations that have phagocytosed
apoptotic cells.
We used Apo-15 for intravital imaging of mice undergoing
ALI using optical windows providing direct access to lungs in
living mice
39. Following direct intratracheal administration of
Apo-15, we performed
fluorescence imaging in vivo to compare
the signals in the lungs of healthy and ALI mice. In healthy,
saline-injected control mice, we observed negligible Apo-15
staining whereas we observed bright stable staining in the lungs of
mice undergoing ALI (Fig.
5
f). Furthermore, we examined the
staining of Apo-15 following drug-induced apoptosis in the
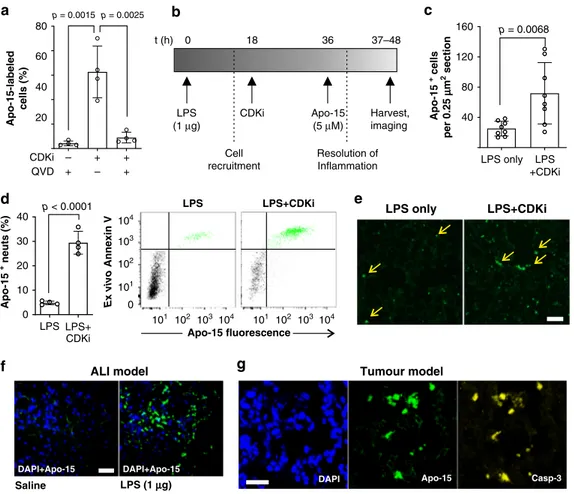
Apo-15 + neuts (% ) LPS+ CDKi 10 30 40 0 20 LPS LPS+CDKi LPS only LPS +CDKi Apo-15 + cells per 0.25 µµ m 2 section 40 120 160 80 LPS only LPS+CDKi
d
e
c
f
g
p = 0.0068 p < 0.0001 Salinea
Apo-15-labeled cells (% ) CDKi QVD – – + + + 20 40 60 80 +b
p = 0.0015 p = 0.0025ALI model Tumour model
DAPI Apo-15 Casp-3
t (h) 0 18 36 37–48 LPS (1 g)µ CDKi Apo-15 (5 M)µ Harvest, imaging Cell recruitment Resolution of Inflammation 101 102 103104 101 102 103 104 104 103 102 101 0 Apo-15 fluorescence Ex vivo Annexin V LPS LPS LPS+CDKi LPS (1 µg) DAPI+Apo-15 DAPI+Apo-15
Fig. 5 In vivo administration of Apo-15 labels drug-induced apoptosis in different mouse models. a Human neutrophils were treated withR-roscovitine (20µM) in the absence or presence of QVD (10 μM). Apo-15-positive cells were determined by flow cytometry (n = 4). b Experimental protocol for acute lung injury: LPS (20μg mL−1) was instilled intratracheally and mice received CDKi (30 mg kg−1) or saline intraperitoneally 18 h later.Apo-15 was administered intratracheally at 36 h.c Double-blind quantification of Apo-15-positive cells in lung tissue from mice that received LPS or LPS and CDKi (n = 8 per group).d Flow cytometric analysis of BALF from mice that received LPS (20μg mL−1) or LPS (20μg mL−1) and CDKi (AT7519, 4 mg mL−1). Both groups were administeredApo-15 (5μM) in vivo and incubated with AF647-Annexin V (25 nM) ex vivo. Data presented as mean percentages ± s.d. of Apo-15-positive CD45+ LY6G+ apoptotic neutrophils (n = 4). Representative dot plots of CD45 + LY6G+ neutrophils with Apo-15 positive cells highlighted in green andApo-15-negative cells in black. Gating strategy in Supplementary Fig. 15B. e Fluorescence microscope images of sections of lung tissues from mice that received LPS or LPS and CDKi. Yellow arrows identifyApo-15-positive events (green) from images withn = 8 per group. Scale bar: 100µm. f Low-magnification intravital images of lungs of saline-treated and LPS-treated mice (LPS: 20 μg mL−1).Apo-15 was administered in vivo (5μM, green) and nuclei were counterstained with DAPI (18μM, blue) (λexc.: 405, 488 nm;λem.: 450, 525 nm). Representative pictures fromn = 3 per group.
Scale bar: 50μm. g High-magnification fluorescence images (from three independent experiments) of tumors from xenograft breast cancer mouse models after treatment with cisplatin (10μg g−1).Apo-15 was administered i.v. (5μM, green) and nuclei were counterstained with DAPI (10 μM, blue) (λexc.: 405,
488 nm;λem.: 450, 525 nm). Apoptotic cells were stained with anti-active caspase-3 (300 ng mL−1, yellow). Scale bar: 50μm. For (a), (c), and (d), p values
widely used MMTV-PyMT breast cancer mouse model, which
spontaneously develops tumors in the mammary glands. After
tumors were grown to a size between 0.5 and 1 cm, mice were
treated with cisplatin (10
μg g
−1) to induce apoptosis and Apo-15
was injected in vivo intravenously via tail vein. As shown in
Fig.
5
g, the signal of Apo-15 was retained in tumor tissues after
OCT embedding and sectioning, which allowed us to compare its
localization with that of active caspase-3. These results confirmed
that Apo-15 can label apoptotic cells in vivo as defined by activity
of caspase-3, and that it can be administered in vivo via different
routes and under various experimental conditions.
Discussion
Dysregulation of apoptosis is a defining feature of the progression
of inflammatory diseases and of cancer. Although a number of
probes for the detection of apoptosis using non-optical imaging
modalities (e.g., positron emission tomography, single-photon
emission computed tomography) have been described
40,41, there
are very few optical probes that can be used in vivo (Table
1
). In
particular, chemical degradation in an inflammatory
micro-environment (e.g., protease or oxidative), dependence on in vivo
availability of high concentrations of free divalent cations and
perturbation of cellular functions represent key limitations.
We have rationally designed and synthesized
fluorogenic
heptapeptides that specifically overcome these limitations,
allowing us to identify a highly stable optical imaging reagent for
apoptotic cells (termed Apo-15). The functional neutrality of
Apo-15, together with the characterization of its binding to
apoptotic cells in vitro and in vivo, suggests that Apo-15 can be
used for non-invasive imaging of apoptosis in a broad range of
experimental settings, including different preclinical mouse
models.
First, we have established a solid-phase synthetic method for the
production of apopeptides (including Apo-15) as low molecular
weight (~1 kDa)
fluorogenic agents for the detection of PS, widely
regarded as an early biomarker of apoptosis. Apo-15 is shorter
than other peptides reported to bind phospholipids related to
apoptosis (e.g., PE-binding duramycin and PS-binding PSBP-6 are
19-mer and 14-mer peptides, respectively)
40. Furthermore, Apo-15
incorporates Trp-BODIPY as an environmentally-sensitive
repor-ter for exclusive emission in proximity to cellular membranes with
enhanced brightness over other
fluorophores (Table
1
). Apo-15
can be produced cost-effectively and in large scale (>100 mgs/
batch, which would allow ~300,000 in vivo imaging assays). In
contrast, PS-binding proteins like annexins (~36 kDa) or the Ca
2+-independent lactadherin C2 (~17 kDa) are difficult to manufacture
with site-specific chemical tags in large scale. The small size and
peptidic nature of Apo-15 might also favor better clearance and
biodistribution to tissues where proteins (e.g., annexins) cannot
gain access. For example, Apo-15 shares structural similarities (e.g.,
cyclic core, positively-charged amino acids) with recently
devel-oped blood brain barrier shuttle peptides
42,43, suggesting that
Apo-15
or slightly modified derivatives could enable optical detection of
apoptotic cells in the brain.
Second, we have demonstrated that Apo-15 binds rapidly to
aminophospholipids, with a strong preference for PS over other
phospholipids. Of note, Apo-15 binds more strongly to PS than
PE. This observation suggests that the binding to PS may be
favored by electrostatic interactions between the
positively-charged residues (i.e., arginine, lysine) of Apo-15 and the free
negatively-charged carboxylate groups in PS, which are not
pre-sent in PE. We also showed that Apo-15 binds to cells from
different species and lineages undergoing tissue culture-induced
apoptosis as well as chemical or UV-induced apoptosis (Fig.
2
).
Interestingly, although our data demonstrate that Annexin V and
Apo-15
cross-compete for binding (Fig.
3
),
fluorescence analysis
reveals that dual labeling with these two probes is not strictly
co-linear. One possibility is that there are differences in lipid
spe-cificity between Annexin V and Apo-15. Alternatively, the
assembly of Annexin V multimers on the apoptotic cell
mem-brane
31may restrict accessibility to the lipids. Detection of
membrane lipids offers key advantages (e.g., no need for
fixatives)
over optical agents visualizing other events (i.e., caspase
activa-tion, mitochondrial dysfunction or loss of membrane integrity;
Table
1
) and allows identification of apoptotic cells at early stages
of disease where therapeutic interventions may exert beneficial
effects.
Third, the divalent cation-independence of Apo-15 binding
enables in vivo detection and quantification of apoptosis in tissues
(e.g., lungs, Fig.
5
) where low and/or variable levels of free Ca
2+could limit the performance of annexin-based reagents. Apo-15 is
also compatible with in vitro experimental conditions where the
use of annexins would be challenging, such as assays where
cal-cium ion concentrations need to be tightly controlled due to
potential activation of cells (e.g., the binding of platelets to
fibrinogen is highly dependent on the concentration of
extra-cellular free calcium)
44. In addition, the enhanced
fluorescence
emission of Apo-15 upon binding allows time-lapse imaging of
apoptosis progression in situ (Supplementary Movie 1) without
the need for washing and without significant loss of signal over
time. We have exploited these characteristics to visualize the
different stages in the formation and reabsorption of apoptotic
bodies, which will provide insights into the functions that these
structures play in different diseases (Fig.
3
g and Supplementary
Movie 3).
Fourth, we have demonstrated that Apo-15 is a highly stable
peptide, even under proteolytic or oxidative conditions (Fig.
1
),
overcoming an important limitation of protein-based agents. The
low molecular weight of Apo-15 (~27-fold smaller than annexins)
may allow increased tissue penetration and biodistribution
in vivo. This feature could also enable imaging studies in
optically-transparent organisms that are well-established for
developmental studies (e.g., zebrafish (D. rerio), worms (C.
ele-gans),
flies (D. melanogaster)), given that apoptosis is crucial for
the appropriate formation of organs and structures during
embryonic development
45. We have also demonstrated that the
staining capabilities of Apo-15 are compatible with different
administration routes. Apo-15 could facilitate mechanistic and
efficacy studies of drugs in tissues undergoing repair and/or
regeneration (e.g., liver). There is experimental evidence that the
first phases of liver injury are characterized by hepatocyte
apoptosis, which is profibrogenic
46. With drugs modulating
apoptosis currently being tested for the treatment of liver injury,
the repeated in vivo administration of Apo-15—which may be
prohibitive in the case of annexins due to its cost—could
repre-sent a powerful method for longitudinal monitoring of hepatocyte
apoptosis in the liver using abdominal intravital imaging
windows
47.
Finally, we and others have previously shown that promotion
or inhibition of apoptosis affects the progression and resolution
of inflammation
48. In this work, we have demonstrated that
Apo-15
does not accelerate or delay apoptosis, a critical requirement
for quantitative assessment of cell death in vivo. In contrast to
annexins and lactadherin C2 proteins
33,49, Apo-15 does not
inhibit the phagocytic removal of apoptotic cells by macrophages
(Fig.
4
), and therefore represents a valuable tool for imaging
assays where phagocytosis and cell clearance must remain
unaf-fected. This functional neutrality of Apo-15 may enable tracking
of the ultimate fate of apoptotic material in mice. Further studies
(we were unable to co-stain ex vivo samples with Apo-15 and
antibodies given that processing and antigen retrieval methods
results in marked loss of the Apo-15 signal) are required to
investigate whether pulses of Apo-15-labeled apoptotic cells
could be followed in vivo. Also, further studies would be required
to determine the cell types that are preferentially labeled in vivo
and the longevity of the Apo-15
fluorescence signal, particularly
when internalized apoptotic material reaches the acidic
phago-lysosome. Given experimental evidence that links dysfunctional
phagocytosis with worsening of pulmonary diseases (e.g., COPD,
cystic
fibrosis)
50, Apo-15 could open avenues for imaging of
apoptosis in other preclinical models and in clinical specimens.
Accumulation of apoptotic cells has been also reported in
atherosclerotic lesions, where defective phagocytic clearance can
contribute to the establishment of a pro-inflammatory necrotic
core and disease progression
51. In vivo imaging of apoptosis in
these lesions, now generally done via positron emission
tomo-graphy (PET), could allow the identification of at risk vulnerable
plaques with pro-thrombotic potential
52. The Trp-BODIPY in
Apo-15
contains two
19F
fluorine atoms which can be isotopically
exchanged with radioactive
18F to prepare radiolabeled Apo-15
analogs for multimodal imaging (i.e., PET and optical imaging)
53.
This approach could help to identify vulnerable plaques in vivo
and ex vivo using a single molecular agent, and also allow us to
test the efficacy of therapies promoting efferocytosis and reducing
apoptotic cell burden within atherosclerotic lesions.
In summary, our studies validate Apo-15 as a reliable
fluoro-genic peptide for the detection and quantification of apoptosis,
both in vitro in multiple cell lineages and in vivo in different
preclinical mouse models of inflammation and cancer. The
spe-cificity and non-invasiveness of Apo-15 could allow imaging of
apoptotic events that are not possible with current probes, from
tracking of apoptotic bodies with subcellular resolution to
per-forming intravital imaging using optical windows. Moreover,
Apo-15
labeling provides a simple and effective readout to
directly assess the efficacy of therapeutic interventions targeting
apoptosis in vivo.
Methods
Chemical synthesis and characterization. The synthesis and analytical char-acterization data for apopeptides is described in the Supporting Information (Supplementary Tables 1-2 and Supplementary Methods).
Cell culture and in vitro induction of apoptosis. Work with human peripheral blood leukocytes complied with all relevant ethical regulations and informed consent was obtained. The study protocol was approved by the Accredited Medical Regional Ethics Committee (AMREC, reference number 15-HV-013) at the Uni-versity of Edinburgh. Human blood leukocytes were isolated from healthy volun-teers54. Briefly, whole blood was anti-coagulated with sodium citrate [0.4% (w/v)
final concentration] and centrifuged at 350 × g for 20 min. Platelet-rich plasma was removed and autologous serum was generated by recalcification with CaCl2
(20 mMfinal concentration). Erythrocytes were separated from leukocytes by sedimentation with Dextran T500 (0.6%) for 30 min and leukocyte populations were further fractionated using isotonic Percoll (GE Healthcare) 49.5%/63%/72.9% discontinuous gradients. Polymorphonuclear cells (>95% neutrophils) were har-vested from the 63%/72.9% interface. Neutrophil apoptosis was induced by in vitro culture for 18 h at 37 °C and 5% CO2in IMDM supplemented with 5% autologous
serum. Monocytes were enriched from the mononuclear cells (49.5%/63% inter-face) by negative selection using the Pan Monocyte Isolation Kit (Milentyi Biotech) according to the manufacturer’s instructions. Monocytes were cultured for 6 days in IMDM supplemented with 5% autologous serum to yield monocyte-derived macrophages (MDMs).
For work with human cell lines, BL-2 and PLB-985 cells were cultured in RPMI supplemented with 10% FBS, 100 U mL−1penicillin and 100 µg mL−1
streptomycin. Cells were plated on 8-well confocal chambers (1.25 × 10⁵cells/well) the day before imaging experiments. Apoptosis was induced by UV treatment (300 mJ cm−2with intervals of 6 × 50 mJ cm−2every 30 s in BL-2 cells) or by chemical treatment (staurosporine 1 µM for 3 h in BL-2 and PLB-985; staurosporine 1 µM for 6 h in primary airway epithelial cells).
Primary Small Airway Epithelial cells (HSAEC) were cultured in airway epithelial cell basal media supplemented with Bronchial Epithelial Growth Kit. Cells were plated on 8-well confocal chamber (5 × 10⁴cells/well) the day before imaging experiments. Forflow cytometry experiments, cells were detached using
0.05% trypsin-EDTA for 3 min at 37˚C and resuspended in HEPES-NaCl buffer containing 0.1% BSA and 2 mM CaCl2or 2.5 mM EDTA.
Mouse bone marrow-derived neutrophils were purified from C57Bl/6 mice using discontinuous Percoll gradients as previously described55. The purity of the
neutrophil population was determined as 75–80% by analysis of cytocentrifuge preparations. Neutrophils were induced to undergo tissue culture-induced apoptosis by culturing for 18 h at 37 °C and 5% CO2in IMDM with 10% FBS.
Flow cytometry andfluorescence-activated cell sorting. All apopeptides were reconstituted at 5 mM in DMSO. Peptides were used at 100 nM in HEPES-NaCl buffer containing 2 mM CaCl2, with or without 2.5 mM EDTA, and were incubated
with the cells for 10 min at r.t. beforeflow cytometry analysis, unless otherwise stated. For co-labeling experiments, AF647-Annexin V and PI were used at the indicated concentrations, with AF647-Annexin V being added to cells 10 min prior to analysis and propidium iodide being added directly before analysis. BALF analysis: 106cells were stained for 30 min on ice with mCD45-PE, anti-mLy6G-PerCpCy5.5, and anti-mCD11c-Pacific Blue diluted 1:100 in HEPES-NaCl buffer. After washing, AF647-Annexin V was added at 25 nM in HEPES-NaCl buffer containing 2 mM CaCl2for 15 min prior to acquisition. Fluorescence
emission was measured on a 5 L LSRflow cytometer (BD). Excitation sources/ emissionfilters used: apopeptides (488 nm/525 nm); AF647-Annexin V (641 nm/ 670 nm); PI (560 nm/600 nm), anti-mCD45-PE (560 nm/580 nm), anti-mLy6G-PerCP-Cy5.5 (488 nm/700 nm), anti-mCD11c-Pacific Blue (405 nm/450 nm). Cells were sorted on the FACS Aria (BD), and data were analyzed with FlowJo software. Time-lapse microscopy and live-cell imaging. Time-lapse microscopy of apop-tosis in BL-2 cells was performed using a spinning disk confocal microscope (Andor) equipped with a live-cell incubation system (37 °C, 5% CO2). Live-cell
imaging of different lineages was performed on a confocal laser scanning micro-scope TCS SP8 (Leica) at 37 °C and 5% CO2. Prior to imaging, freshly isolated
neutrophils were incubated for 3 h at 37 °C in phenol red-free IMDM (Gibco) supplemented with 2.5% autologous serum and 20 µM R-roscovitine (Sell-eckchem). UV-treated BL-2 cells were incubated for 3 h at 37 °C prior to imaging. AF647-Annexin V and Hoechst 33342 were used as counterstains at the indicated concentrations. Apopeptide staining was performed by direct addition of apo-peptides at 100 nM and imaged after 10 min. Images were processed with ImageJ software.
Signal-to-noise ratios for apoptotic neutrophils labeled with FITC-Annexin V or Apo-15 were determined after image acquisition under the same laser power and gain and analysis using ImageJ. Briefly, raw images were converted into 16-bit grayscale images and averagefluorescence intensities in labeled cells and in the background were measured (≥150 points per condition). Experiments were performed in triplicate.
Liposome-based assays. Giant unilamellar vesicles (GUV) were prepared by the electroformation method56. Briefly, stock solutions of lipids (0.2 mM total lipid
containing 0.3 mol% Lissamine-Rho-DOPE) were prepared in CHCl3:MeOH (2:1,
v/v) and deposited on Pt wires that were placed under vacuum for 2 h to com-pletely remove the organic solvents. 500 µL assay buffer (25 mM HEPES, 150 mM NaCl, pH 7.4) pre-warmed at 37 °C was then added to the chamber, and the Pt wires were connected to a TG330 function generator (Thurlby Thandar Instru-ments), with thefield being applied in three steps at 37 °C: (1) frequency 500 Hz, amplitude 260 mV (29 V m−1) for 6 min; (2) frequency 500 Hz, amplitude 3.1 V (320 V m−1) for 20 min; (3) frequency 500 Hz, amplitude 7.3 V (656 V m−1) for 90 min. GUVs were visualized under an inverted confocalfluorescence microscope (Nikon D-ECLIPSE C1) with the following excitation wavelengths: 488 nm for Apo-15, 561 nm for Lissamine-Rho-DOPE, and 637 nm for AF647-Annexin V. Images were collected using band-passfilters (515 ± 15 nm for Apo-15, 593 ± 20 nm for Lissamine-Rho-DOPE), and a long-passfilter >650 nm for AF647-Annexin V. For AF647-AF647-Annexin V staining, buffer containing 25 mM HEPES, 150 mM NaCl, 2 mM CaCl2, and 0.1% BSA was used. Polarizedfluorescence
emission was measured in afluorimeter plate reader PHERAstar (BMG) containing polarizers andfilters with excitation at 485 nm and emission at 520 nm. Binding of Apo-15 to phospholipids. Cardiolipidin, PG, and PA were purchased from Stratech Scientific Ltd. PS and PC were obtained from Sigma-Aldrich and PE was purchased from Cambridge Biosciences. All lipids were dissolved at 1 mg mL−1in dry EtOH and transferred into a blackflat-bottom 96-well plate to generate lipid thin layers by solvent evaporation at r.t. Apo-15 was reconstituted at 1 µM in sterile PBS and incubated at 25 °C for 40 min. Fluorescence emission was measured in a Synergy H1 BioTek spectrophotometer (λexc.: 450 nm,λexc.: 520 nm).
All experiments were performed in triplicate.
Competition binding assays between Apo-15 and AF647-Annexin V. Neu-trophils which had been induced to undergo tissue culture-induced apoptosis (cultured for 18 h at 37 °C and 5% CO2in IMDM supplemented with 5%
auto-logous serum) were pre-incubated for 10 min with different concentrations of AF647-Annexin V or Apo-15 (as indicated in Fig.3and Supplementary Fig. 12) in HEPES-NaCl buffer containing 0.1% BSA and 2 mM CaCl2. Pre-incubation was