FROM ILLEGAL MARKETS
TO LEGITIMATE BUSINESSES:
THE PORTFOLIO OF ORGANISED
CRIME IN EUROPE
Final report of Project OCP
Organised Crime Portfolio
With the financial support of the Prevention of and Fight against Crime Programme
With the financial support of the Prevention of and Fight against Crime Programme European Commission – Directorate-General Home Affairs.
Project OCP has been funded with support from the European Commission. This publication reflects the views only of the authors, and the European Commission cannot be held respon-sible for any use which may be made of the information contained therein.
From illegal markets to legitimate businesses: the portfolio of organised crime in Europe
Final Report of Project OCP – Organised Crime Portfolio (HOME/2011/ISEC/AG/FINEC/4000002220)
www.ocportfolio.eu
Edited by Ernesto U. Savona and Michele Riccardi Authors (in alphabetical order):
Monica Angelini Francesco Calderoni Stefano Caneppele Diana Camerini Marta Chinnici Yulia Chistyakova Jeltsje Cusveller Marco Dugato Joras Ferwerda Luca Giommoni Jarmo Houtsonen Pilar Laguna Marina Mancuso Jerónimo Márquez Jesús Palomo Sarianna Petrell Michele Riccardi Nuria Ruiz Alexandre Salha Ernesto Savona Cristina Soriani Priscilla Standridge Brigitte Unger John Walker David Wall
Suggested citation: Savona Ernesto U. & Riccardi Michele (Eds.). 2015. From illegal markets to legitimate busi-nesses: the portfolio of organised crime in Europe. Final Report of Project OCP – Organised Crime Portfolio (www. ocportfolio.eu). Trento: Transcrime – Università degli Studi di Trento. © 2015
ISBN 978-88-8443-595-8
Transcrime – Joint Research Centre on Transnational Crime
Università Cattolica del Sacro Cuore di Milano – Università degli Studi di Trento
www.transcrime.it
Table of contents
Key Findings 7
Executive summary 8
Acronyms 18
1. Introduction
21
2. Methodological remarks 24
2.1. Definitions and classifications 24
2.2. Data, sources and methodology of analysis
27
PART 1: WHERE DO ORGANISED CRIME PROCEEDS COME FROM? ILLICIT MARKETS IN EUROPE 33
3. Illicit markets and organised crime in Europe
34
3.1. Revenues from illicit markets
34
3.2. Actors
38
3.3. Emerging trends
40
3.4. Social and economic costs
41
4. Focus on ten illicit markets 43
4.1. Illicit drugs market
43
4.2. Trafficking in human beings
57
4.3. Illicit trafficking in firearms
61
4.4. Illicit trade in tobacco products
64
4.5. Counterfeiting 69
4.6. Illegal gambling and match-fixing
75
4.7. Extortion racketeering
78
4.8. Usury
81
4.9. Fraud
84
4.10. Organised property crime
91
5. Focus on seven European countries 95
5.1. Finland
95
5.2. France
101
5.3. Ireland
107
5.4. Italy
112
5.5. Netherlands
120
5.6. Spain
126
5.7. United Kingdom
134
6. From the generation of illicit proceeds to investments in the legal economy 144
6.1. Estimating the proceeds from the heroin market available for investment in the legitimate economy
145
PART 2: WHERE DO PROCEEDS GO? ORGANISED CRIME INVESTMENTS IN THE EUROPEAN
LEGITIMATE ECONOMY
149
7. Organised crime investments in Europe 150
7.1 Geography of organised crime investments
150
7.2. Types of assets
154
7.3. Business sectors
155
7.4. Actors
159
7.5. Drivers and concluding remarks
164
8. Focus on seven European countries 166
8.1. Finland
166
8.2. France
172
8.3. Ireland
178
8.4. Italy
183
8.5. Netherlands
196
8.6. Spain
202
8.7. United Kingdom
210
9. The impact of organised crime investments on the European legitimate economy 217
9.1. How to measure the impact of organised crime investments on the legal economy?
An exploratory analysis
217
PART 3: WHAT PROCEEDS ARE RECOVERED? THE CONFISCATION OF CRIMINAL ASSETS IN EUROPE 223
10. The regulatory framework: confiscation in Europe 224
10.1. Introduction
224
10.2. A review of the confiscation process in Europe
225
10.3. Finland
227
10.4. France
230
10.5. Ireland
233
10.6. Italy
235
10.7. Netherlands
238
10.8. Spain
240
10.9. United Kingdom
242
149
11. Assessing the availability of data on confiscated assets in Europe 245
11.1. The availability of data on confiscated assets in Europe
245
11.2. Results of a survey across European countries
247
12. Focus on seven European countries 249
12.1. A comparative analysis among the seven OCP countries
249
12.2. Finland
253
12.3. France
257
12.4 Ireland
263
12.5. Italy
268
12.6. Netherlands
274
12.7. Spain
277
12.8. United Kingdom
282
13. Conclusions 286
Acknowledgements 289
References 291
• Chinese OCGs, Russian/Georgian OCGs, Italian mafias, Motorcycle gangs and OCGs of British, Dutch and Turkish origin constitute the majority of cases. Differences in terms of investment strategy exist among criminal groups and countries.
• Drivers of criminal investments are profit, money laundering, control of the territory, influence on the political sphere, social consensus, personal benefit or concealment of criminal activities.
3. What proceeds are confiscated?
• According to the few available data, assets confiscated from OC are increasing in Europe in terms of both number and value .
• Most confiscated assets are movable goods (cash and vehicles) while there is almost no confiscation of companies.
• As a result, a gap exists between where OCGs invest and what is recovered by European authorities.
4. What research and policy
implications?
• The study should extend to all 28 EU MS in order not to miss the transnational nature of organised crime investments. • All the experts of the EU 28 MS (LEAs, AROs, FIUs,
prosecutors, researchers, private organisations) should network to collect better data and cases of organised crime infiltration in legitimate businesses.
• An innovative methodology should be developed for shifting from a cold picture of past cases (such as this report) to an assessment of the factors facilitating criminal infiltration, in order to reduce the risk that this could occur. • The organization of LEAs, FIUs and AROs should be
reshaped so as to focus on these high-risk situations. So, the prevention activity of public agencies and private companies.
• At the same time, the confiscation of infiltrated companies should be improved, and the use of instruments alternative to seizure (e.g. administrative penalties and temporary suspensions) should be increased.
Key Findings
1. Where do organised crime proceeds
come from?
• The main illicit markets in the European Union generate around 110 billion euro each year. This figure corresponds to approximately 1% of the EU GDP.
• Illicit drugs (heroin, cocaine, cannabis, amphetamines and ecstasy) remain the most profitable ‘traditional’ market (28 billion euro yearly at EU level). Among emerging criminal activities, fraud appears to the most lucrative (29 billion euro each year from MTIC VAT fraud alone).
• Illicit revenues are shared by a plurality of organised crime groups and criminal actors. The use of business facilitators and of legitimate companies to cover illicit trade is also widespread.
• The poly-crime nature of criminal groups in Europe expands the economies of scale among illicit markets, reduces groups’ operational costs and increases their profit margins.
2. Where are organised crime
proceeds invested in the legitimate
economy?
• Illicit proceeds are widely laundered in the European legal economy. Evidence of organised crime investments is found in almost all EU MS.
• In the 7 OCP countries, investments concentrate in areas with a strong presence of organised crime (e.g. Southern Italy), ones strategic for illicit trafficking (e.g. Andalusia), with key ports and airports (e.g. Amsterdam/Rotterdam), border regions (e.g. north-western Italy and south-western France), tourist areas (e.g. PACA or Costa del Sol) and large cities (e.g. Rome, Madrid, London, Paris, Berlin, Bucharest). • Bars and restaurants, construction, wholesale and
retail trade (especially of food products and clothing), transportation, hotels and real estate are traditional sectors of infiltration.
• There is growing evidence of infiltration into renewable energy, waste and scrap management, logistics, money transfer businesses (MTB) and VLT, slot machines, betting and gaming.
This is the final report of Project OCP – Organised Crime Portfolio (www.ocportfolio.eu).1 Aim of OCP is to carry out an
exploratory study of the economics of organised crime in Europe, and in particular to address three research questions, which are covered by the three sections of this report: • Where organised crime proceeds are generated, from
which illicit markets (Part 1);
• Where these proceeds are then invested in the legitimate economy, in which regions, assets and business sectors (Part 2);
• The extent to which these proceeds are confiscated by European authorities (Part 3).
The project focuses on seven EU member states (Finland, France, Ireland, Italy, the Netherlands, Spain and the United Kingdom), represented by OCP partners, and for which provides an in-depth analysis. However, the report also presents a broader examination of the situation in Europe as a whole.
OCP deals with issues crucial from a policy standpoint but which are characterised by a lack of data and of previous studies. OCP addresses this research gap by adopting an innovative methodology and using a wide range of information, both qualitative and quantitative, deriving from very different sources. Despite its pioneering nature and its data limitations, this report represents a first step towards better understanding of how the organised crime business works. In line with the Transcrime research agenda, it is a starting point for a better identification and reduction of the opportunities exploited by criminals to infiltrate illicit and legitimate markets in Europe.
In this sense, this report constitutes an important tool for both public and private institutions to improve the assessment of the risks of organised crime infiltration and to strengthen the tracing and the confiscation of criminal assets in Europe.
Part 1: Where do organised crime
proceeds come from? Illicit
markets in Europe
Illicit markets in Europe are changing rapidly in size, products, actors, routes and flows, but they remain key sources of proceeds for organised crime in Europe.
To analyse their role in the economy of OCGs, Project OCP has produced one of the first measurements at European level of the revenues from illicit markets, and a review of the main criminal actors among which these revenues are shared.2 In particular:
• For some markets (heroin, cocaine, trafficking of firearms, illicit trade in tobacco products, counterfeiting, MTIC fraud), OCP has calculated new estimates for all the 28 EU MS;
• For other markets it has collected existing estimates, in some cases available for all the 28 MS (cannabis, amphetamines, ecstasy, cargo theft) or only in few countries (trafficking in human beings, illegal gambling and match-fixing, extortion racketeering and usury).
Both when calculating and collecting estimates, OCP has employed a transparent and verifiable methodology, which is described in detail in Chapter 2 and in the Methodological Annex.
How large are the revenues from illicit markets?
Appraising the magnitude of the revenues generated by illicit markets is not straightforward. Data are lacking, and there is the risk to produce ‘mythical numbers’ with no empirical proof. Taking into account these challenges, the estimates calculated by OCP reveal that:
• Illicit markets in the European Union produce about 110 billion euro each year.3
1. Project OCP has been carried out with the financial support from the Prevention of and Fight against Crime Programme of the European Union - European Commission, DG Home Affairs, and has been developed by an international consortium of eight partners: Transcrime – Joint Research Centre on Transnational Crime (www. transcrime.it) of the Università Cattolica del Sacro Cuore di Milano and the Università degli Studi di Trento (Italy), coordinator of the project; Police University College (PCF – Finland); Agence de Gestion et de Recouvrement des Avoirs Saisis et Confisqués (AGRASC – France); An Garda Síochána - Criminal Assets Bureau (CAB – Ireland); Guardia di Finanza (GDF – Italy); Universiteit Utrecht (UU - The Netherlands); Universidad Rey Juan Carlos (URJC – Spain); Durham University (UDUR – United Kingdom).
2. Focus has been posed on ten main illicit markets: trafficking of illicit drugs (heroin, cocaine, cannabis, amphetamine, ecstasy), trafficking in human beings, illicit trafficking in firearms, illicit trade in tobacco products, counterfeiting, illegal gambling and match fixing, extortion racketeering, usury, fraud and organised property crime. Not all of them can be defined ‘markets’, as not all of them imply the existence of a demand and a supply, but they are often defined as ‘markets’ for the sake of simplicity. Corruption has not been considered as an illicit market per se but as an enabler on which organised crime often relies when active in the illicit and the legitimate economy.
3. This figure refers to the estimate of the annual revenues only from those illicit markets for which estimates were available or have been produced for all the 28 EU MS: trafficking of illicit drugs (heroin, cocaine, cannabis, amphetamines, ecstasy), illicit trafficking in firearms, illicit trade in tobacco products, counterfeiting, MTIC fraud and cargo theft. It does not include trafficking in human beings, illegal gambling and match fixing, extortion racketeering and usury, for which quantifications exist only in few
Executive summary
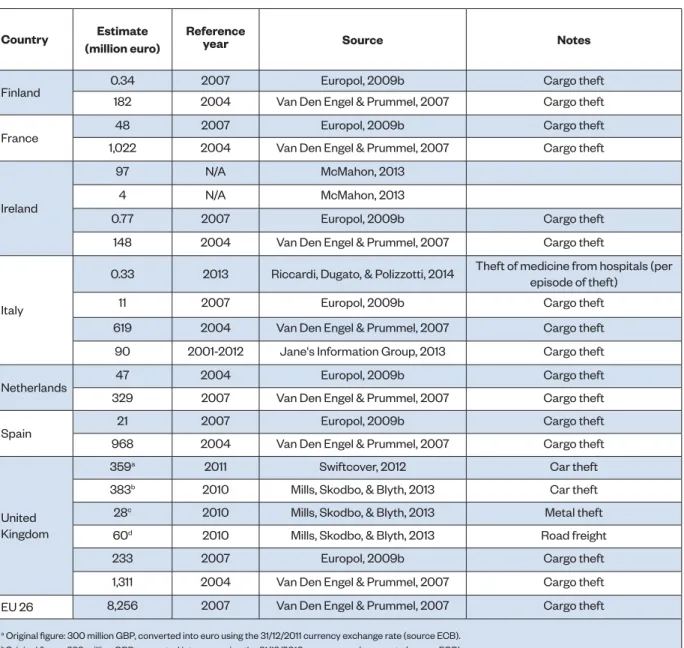
• This figure is approximately 1% of the EU GDP.4 The weight on GDP is higher in southern and eastern European countries (see maps below).
• The seven OCP countries (Finland, France, Ireland, Italy, the Netherlands, Spain and the United Kingdom) produce
about 60% of this amount (64 billion).
• Illicit drugs are still the most profitable ‘traditional’ market (nearly 28 billion yearly at EU level, 20 in OCP countries alone); of which heroin is the most profitable (8 billion euro in the EU). However, new synthetic substances (such as methamphetamines) and the increase in home-made illicit drugs (such as home-grown cannabis) are reshaping this market (see Section 4.1).
• Fraud, in its various forms (e.g. MTIC fraud, VAT carousel fraud, plastic fraud, insurance fraud, social benefits fraud, etc. - see Section 4.9) is becoming one of the most profitable illicit activities, attracting many OCGs. MTIC fraud alone produces more than 29 billion euro at EU level each year according to the estimates calculated in this report.5
Table 1 – Revenues from illicit markets per year – billion euro
Illicit market countries7 OCP Whole EU
Illicit drugs 20.2 27.7 Heroin 5.7 8.0 Cocaine 5.3 6.8 Cannabis 5.4 6.7 Amphetamines 1.6 2.8 Ecstasy 2.2 3.5 Trafficking in human
beings (THB) Estimate available only in few EU MS Illicit trafficking in
firerarms (ITF) - 0.4
IIllicit trade in tobacco
products (ITTP) 5.2 9.4
Counterfeiting 21.6 42.7
Illegal gambling Estimate available only in few EU MS Extortion racketeering Estimate available only in few EU MS
Usury Estimate available only in few EU MS
MTIC fraud 16.9 29.3
Cargo theft 0.36 0.42
TOTAL 64.2 109.9 • Counterfeiting is potentially very profitable (estimated
to produce 42 billion euro annually in the EU), given the willingness of European citizens to purchase counterfeit products. However, it is still unclear if and how the actual illicit supply is able to satisfy the potential demand (see Section 4.5).
• Illicit trade in tobacco products (see 4.4) is able to produce revenues equal to those of some illicit drugs (e.g. cocaine in OCP countries) according to estimates.
6. For example in Italy THB for sexual exploitation has been estimated to produce around 3 billion of euro annually (Mancuso, 2014; see Section 4.2).
7. It covers the following illicit markets and activities: heroin, cocaine, cannabis, amphetamines, ecstasy, ITTP, counterfeiting, illicit trafficking in firerarms, MTIC frauds and cargo thefts.
Revenues - Mn euro < 1,000 1,000 - 3,600 3,601 - 11,900 > 11,900 Not available
Figure 1 – Estimates of the revenues from illicit markets in the EU. Absolute values7
Figure 2 – Estimates of the revenues from illicit markets in the EU. Percentage of GDP 20108
% of GDP 2010 < 0.66 % 0.66- 1.03 % 1.04 - 1.34 % > 1.34 % Not available
Source: Transcrime-OCP estimates. In italics estimates by other authors
Source: Transcrime elaboration on OCP estimates
Source: Transcrime elaboration on OCP estimates and Eurostat data • Trafficking in human beings (for both sexual and labour
exploitation purposes) is an important activity for OCGs, but estimates of the scale of revenues are almost non-existent (except in some countries).6
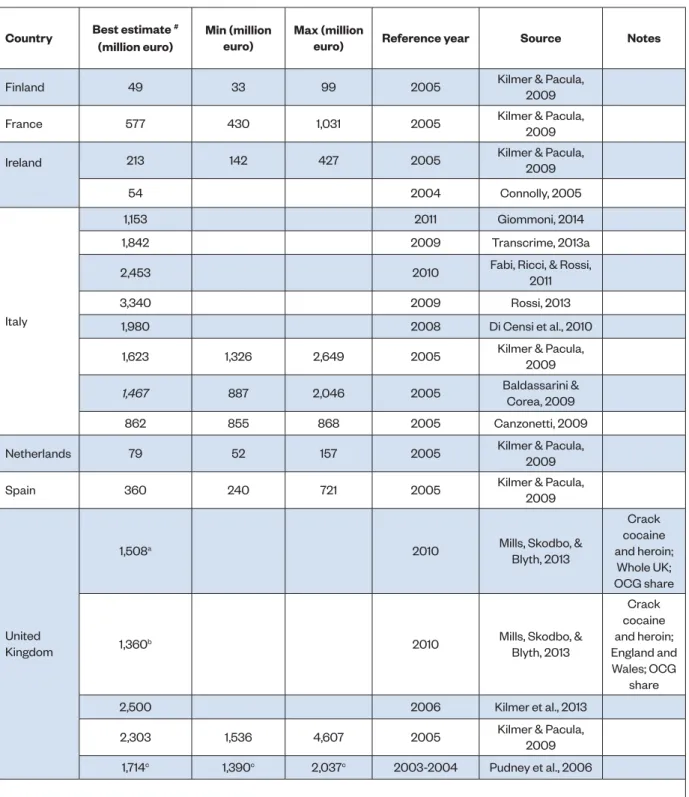
• There are few measures of the proceeds from organised property crime and illicit trafficking in firearms (ITF). Especially the former has attracted a large number of criminal groups given the high returns and the low risks (for example the theft of medicines, see Section 4.10), but only limited figures on cargo theft are available (about 420 million euro in revenues at EU level).
• Given the lack of figures on these markets, the overall quantification (110 billion) may be underestimated.
4. The rate has been calculated on the consolidated EU GDP 2010, reference year for most of the estimates.
5. Missing Trader Intra Community fraud refers to a particular type of organised VAT fraud producing a loss to the government budget and an extra profit for the fraudster.
Who shares the illicit revenues? The actors
Revenues from illegal markets in Europe are shared by a plurality of actors and not monopolized by a few criminal organisations. The number, nature, composition and level of organisation of these actors change according to the country, the market, the opportunities and the particular stage of the illicit supply chain in which they are active:
• Although large and structured groups may be still important in those criminal activities entailing a high level of organisation, smaller groups and free-lance criminals have become central, especially in emerging markets such as synthetic drugs, home-grown cannabis, fraud or ITTP (see respectively 4.1, 4.4, 4.9).
• Criminal groups composed of one dominant nationality or ethnicity still play a key role in some markets (for instance Albanian and Turkish OCGs in heroin trafficking) but they are increasingly changing into heterogeneous, multi-ethnic and inter-connected OCGs.
• Also important are functional links, such as those with the countries of origin of illicit goods (e.g. the links of gangs from quartiers sensibles in France with North African groups in the trafficking of cannabis – see 5.2) and cultural ones (e.g. among different national chapters of Outlaw Motorcycle gangs - see 5.1).
• Some criminal groups specialize in particular illicit activities (e.g. some Eastern European OCGs in organised theft – see 4.10) and move across Europe to carry out these activities (e.g. property crimes or frauds).
• But most groups are increasingly involved in multiple crimes, i.e. active in more than one market simultaneously (e.g. Chinese OCGs in counterfeiting, sexual exploitation, illegal gambling and tax fraud in Italy – see 5.4).
• This may lead to economies of scale deriving from the use of the same routes and channels to traffic different illicit goods, which may reduce operational costs and increase OCGs’ profit margins.
Given this fragmented and dynamic picture, it is difficult to assess who earns how much in illicit markets in Europe. Future research should seek a better understanding of how illicit proceeds are split among the different criminal actors and the different members of the same criminal group.
Where and how will criminal groups produce illicit revenues in the future? Emerging trends
The evidence collected by project OCP has highlighted some emerging trends which must be taken into account to fully understand how the revenues of illicit markets may change in the future:
• First, there is evidence that OCGs may gradually shift from traditional markets (e.g. drugs or THB) to new, less risky, underrated but very profitable illicit activities, such as fraud or organised property crime (e.g. of medicines, vehicles, car parts). Besides creating new actors, these activities may also attract traditional OCGs (e.g. Italian mafias such as Camorra groups).
• Second, increasing use is made of legitimate companies in illicit markets, for example:
- In fraud schemes, as shell companies in VAT carousels, excise or insurance frauds;
- As fronts for illicit activity (e.g. . transport or shipping companies to hide the smuggling of drugs);
- To ‘launder’ stolen products (e.g. fake wholesalers in order to repack and sell stolen medicines back to hospitals and pharmacies, see 4.10).
• Third, new products are emerging in a twilight zone between licit and illicit. For example, illicit white cigarettes, which are legally produced in one country and illegally smuggled to other (see 4.4), are expanding; or firearm replicas which, when manipulated, can become illicit firearms (see 4.3).
These trends are reshaping illicit markets in Europe, but they are also important drivers of the business strategies of organised crime groups when they move from the illegal economy to legitimate markets (see Part 2).
From the generation of illicit revenues to investments in the legitimate economy
Not all the proceeds generated by illicit markets are then available for investment in the legitimate economy. Criminal groups must cover a range of expenses, including:
• Operational costs, such as the purchase of wholesale drugs and transportation costs;
• Management costs, such as the payment of salaries of criminal group members or subsidies to their families; • Personal expenses, to cover living expenses or the cost of
a certain lifestyle;
• Money laundering costs, such as the fees paid to professionals hired to launder illicit proceeds;
Applying an innovative methodology (see chapter 6) to the heroin market, this report estimates that, for instance, between 25% and 42% of the revenues from heroin in the 7 OCP countries (between 1,160 and 3,160 million euro) may be available, after subtracting costs, for investment in the legal economy.9
9. The model developed in Chapter 6 covers the costs for purchase of raw materials and costs of living of the criminal actors involved in the supply chain. It does not cover transportation costs, management costs and money laundering
Part 2: Where do proceeds go?
Organised crime investments in
the European legitimate economy
Once all the costs of illicit operations have been covered, where are the proceeds invested in the legitimate economy? OCP provides a first exploratory overview of the investment portfolio of organised crime groups in the 7 OCP countries. It considers:
• The geographic regions where investments occur; • The types of assets;
• The business sectors;
• The different investment strategies of criminal actors; • The drivers which could explain these different
investments strategies.
To this end, given the lack of official data and in order to collect as much evidence as possible, a broad definition of
investment was used (see Chapter 2) to conduct a
large-scale collection of cases of investments from a wide variety of sources (judicial files, reports by LEAs, FIUs, AROs, academic studies, open sources).
Legend
OCP Countries
Low
Medium-Low
Medium-High
High
Non-OCP Countries
Low
Medium-Low
Medium-High
High
Figure 3a – European regions (NUTS 2) with evidence of organised crime investments - Percentages of the country total10
Source: Transcrime elaboration on DOCI
10. Classes identified using Jenks natural breaks optimization. Although references to OCGs are available in most countries, in some cases they do not report indications about the relevant NUTS 2, or the number of references with NUTS 2 indication is too low to be meaningful and representative. Therefore, some countries (Austria, Bulgaria, Cyprus, Czech Republic, Denmark, Estonia, Greece, Croatia, Hungary, Ireland, Lithuania, Luxembourg, Latvia, Malta, Portugal, Slovakia) are classified according to their national values
In which geographic areas do criminal investments occur?
Although the analysis focused systematically only on the 7 OCP countries (which represent 70% of the evidence gathered), cases of organised crime investments were found in almost all EU MS (24 out of 28), and in a large number of non-EU neighbouring countries as well.
A concentration of investments was found in specific regions: • In Italy: the southern regions, Lazio and north-western
regions (especially Lombardy);
• In France: PACA - Provence-Alpes-Côte d’Azur, Île-de-France and eastern border regions;
• In Spain: Andalusia, Madrid and, to a lesser extent, south eastern regions;
• In UK: the London area and south-western Scotland; • In the Netherlands: Amsterdam and Rotterdam and their
neighbouring areas;
• In non-OCP countries: some areas like Berlin, the Düsseldorf-Köln area, Bucharest and the Romanian border with Moldavia.11
According to this exploration, criminal investments tend to be larger in areas with a historically strong presence of OCGs (e.g. southern Italy), in border regions, or in areas which may play a crucial role in illicit trafficking (e.g. Andalusia, or Rotterdam and Marseille with their harbours), large urban areas (e.g. London, Amsterdam, Madrid, Berlin) and tourist or coastal areas (e.g. Côte d’Azur, Murcia, Malaga or European capitals) which can provide investment opportunities, for example in the real estate or hotel sector.
While some regions (e.g. southern Italy – see 8.4) witness the infiltration of mainly local groups, other areas record investments of a wide range of OCGs: for instance southern Spain has cases of investments by Italian mafias, Russian OCGs, Motorcycle gangs and other groups (see Section 8.6).
In which types of assets?
Evidence collected by the OCP project shows that assets of all types make up the investment portfolios of organised crime groups:
• Registered assets, such as cars or boats, which are instrumental to many illicit activities (e.g. boats for drug transportation), as well as status-symbols for criminal group members and reflection of the criminal group’s culture (e.g. “choppers” for motorcycle gangs);
• Movable goods, such as jewels, valuables, luxury-watches, but also financial instruments and bank accounts/cash; • Real estate properties, ranging from lands, to villas, to
flats. Immovable goods are considered safe investments by OCGs because they ensure high returns (especially in areas with buoyant real estate markets, such as PACA or
Costa del Sol – see 8.2 and 8.6) and profits in the forms of rents. Owning real estate can also facilitate illicit activities (e.g. houses can host brothels or deposits for illicit goods), fraud (e.g. mortgage frauds – see in Ireland 8.3) and control of the territory (e.g. in Italy, see 8.4);
• Companies, which are crucial investments and play a multifaceted role in the strategies of criminal organisations.
In which business sectors?
According to the evidence collected, the business sectors with the most cases of criminal investments are (see Section 7.3): • Bars and restaurants;
• Construction;
• Wholesale and retail trade, in particular of food products and of clothing;
• Transportation; • Real estate activities; • Hotels.
Other economic activities that, according to the collected data, have emerged in recent years as particularly attractive to organised crime investments are, among others, renewable energy, waste and scrap management, money transfer businesses (MTB) and casinos, VLT, slot machines, betting and gaming (see 7.3).
Although future research projects should examine the factors and vulnerabilities determining the attractiveness of these sectors, there seems to be a prevalence of:
• Cash-intensive sectors, which can facilitate money laundering;
• Low-tech, labour-intensive and not export-oriented sectors;
• Sectors with a high involvement of public administration and/or public subsidies;
• Territorial-specific sectors, which can benefit and/or facilitate the control of the territory by criminal groups. • Sectors with weak or developing regulation, which may
imply weaker monitoring or more infiltration opportunities (e.g. renewable energy or VLT and gaming).
But above all, these sectors are often functional for the commission of other illicit activities: for example, transportation is often used as a front for the trafficking of illicit goods or MTB for transferring illicit funds.
Despite these general rules, there are differences among countries. These may depend on many variables, including the country’s business structure and entrepreneurial culture (e.g. criminal investments in agriculture and fishery are higher in Spain than, for instance, in Finland – see 8.6), investment opportunities, differences in terms of national administrative and regulatory systems or the nature of the illicit activities conducted by the criminal groups active in the country (e.g. the infiltration of transportation companies is higher in transit countries like the Netherlands – see 8.5).
12. The data collection, which focused on the 7 OCP countries, may overestimate the role and the weight of OCGs, such as Italian mafias or British OCGs, originating from the 7 OCP EU MS.
What are the differences among actors?
Besides countries and business sectors, there are also differences among organised crime groups.
• First, as in illicit markets, a plurality of criminal actors, ranging from large and structured organisations to smaller and looser criminal gangs, invest in the legitimate economy; • Taking into account data biases12 the criminal groups
for which there is most evidence of investments in the legitimate economy are Italian mafias (especially Camorra and ‘Ndrangheta), Chinese OCGs, Russian/Georgian OCGs but also Motorcycle gangs and criminal groups of British, Dutch and Turkish origin and nationality; • Evidence of Italian mafia investments can be found
not only in Italy but also in a large number of European countries, and in particular in real estate, construction companies, bars, restaurants and the wholesale and retail of food products;
• Chinese OCGs presence is especially high in the wholesale and retail trade, bars and restaurants, personal services (e.g. massage parlours) and money transfer agencies. Moreover, there is growing evidence of transfers of illicit proceeds generated in Europe (e.g. from counterfeiting, tax fraud or labour exploitation) to China (especially through MSB) (e.g. in Italy, Spain and UK);
• Russian/Georgian OCGs are, according to the evidence collected, present in the largest number of EU countries, in particular in the wholesale and retail trade, bars, restaurants, real estate, hotels and casinos and gaming; • Evidence can be found of investments by Motorcycle
gangs in the private security industry, construction, renovation and repair and retail of vehicles, with an increasing level of sophistication and in a larger number of countries (including southern EU MS such as Spain – see 8.6);
• Turkish, Colombian and North African OCGs seem to prefer moving and investing the proceeds generated in Europe (e.g. from drug trafficking) abroad, often in their country of origin (e.g. in real estate), also using money transfer agencies under their control;
Other emerging issues should be highlighted:
• First, the evidence collected confirms the key role that professionals and company service providers may play especially in high-level money laundering and fraud schemes; • Second, the growing role of freelance entrepreneurs,
belonging to the so-called grey area, connected with multiple OCGs at the same time, and acting either as frontmen for criminal groups or as facilitators (e.g. of Cosa Nostra or Camorra investments in the wind power sector in Italy, see Section 8.4).
Figure 3b – Business sectors with highest evidence of organised crime investments - 7 OCP countries
Figure 4 - European countries with evidence of organised crime investments - Selected categories of OCGs
Cosa Nostra
Chinese OCGs
Camorra
'Ndrangheta
Source: Transcrime elaboration on DOCI
Motorcycle gangs
Russian OCGs
• Third, the increasing number of cases of cooperation and joint ventures between different groups in the management of legitimate businesses and legitimate markets (e.g. between Camorra and Chinese OCGs in the clothing industry).13
What are the drivers of organised crime investments?
In summary, the OCP project shows that the investments in the legitimate economy are widely used by criminal groups to serve a variety of purposes, and in particular:
• To launder criminal proceeds;
• To increase profits, e.g. through speculation on the real estate market;
• To strengthen control of the territory, e.g. through investments in real estate properties or in highly territorial-specific businesses;
• To infiltrate the local political, business and administrative sphere, e.g. with companies active in public procurements;
• To increase social consensus, e.g. through the creation of jobs or the provision of public services;
• To satisfy personal benefits, including the purchase of status symbols;
• To facilitate illicit activities, for example through the investment in and control of:
- Wholesale trade companies (especially of food products) as fronts for drug trafficking;
- Transportation, logistics and import-export companies, to cover the smuggling of illicit, counterfeit or stolen goods;
- Bars and restaurants, clubs and hotels as covers for prostitution rings or drug markets;
- Money service businesses to facilitate the transfer of illicit funds across borders.
- Oil and gas companies to commit fraud (e.g. tax frauds, excise frauds, fuel laundering, etc.).
Criminal groups in Europe do not invest in the legal economy solely to launder money; they use legitimate businesses as tools to exert their power, influence and to exploit economies of scale with the criminal activities in which they are involved. OCGs do not discriminate between illicit and legitimate markets, but see them as a continuum along which to grasp profit opportunities and expand their influence.
Part 3: What proceeds are
recovered? The confiscation of
criminal assets in Europe
But to what extent are the proceeds generated by organised crime from illicit markets and then invested in the legitimate economy recovered by the authorities?
Despite the general consensus on the crucial role of the confiscation of criminal assets in the fight against organised crime in Europe (as confirmed by the introduction of the new Directive 2014/42/EU), answering this question is not simple. First, because of the lack of statistics; second, because of the many differences among the confiscation regimes in EU countries (e.g. different types of confiscation, predicate offences and types of assets – see Chapter 10) which make it difficult to compare the available data.
In order to gain better understanding of these problems, and in an attempt to answer the question above, OCP has:
• Assessed the level of availability of data on confiscated assets throughout the 28 EU MS;
• Analysed, on the basis of the available data, the amount and types of assets confiscated for serious and organised crime across the 7 OCP countries.
What is the availability of data on confiscated assets in Europe?
According to the assessment conducted by OCP among EU AROs and AMOs, it emerges that (see Chapter 11 for details): • Data on confiscated assets in Europe are lacking and
of poor quality. While some countries (e.g. Italy, the Netherlands) collect good statistics, others do not; • The use of IT systems to organise data is infrequent; • Owing to the legislative differences, methods and criteria
for the collection of data on confiscation vary widely across EU MS;
• Data are often collected within the same country by several agencies, involved in different stages of the asset recovery process or based in different geographic locations. This means that statistics are not often available in a centralized dataset, with uniform information;
• Data can refer to different stages of the asset recovery process and even provide overlapping information on the same court proceedings;
• It is often not possible to clearly distinguish the main offence(s) for which an asset was confiscated;
• Other useful information (e.g. location and condition of the confiscated asset, date of seizure/confiscation, type or name of the related criminal group) is often missing; • In most cases, assets are not associated with a unique
ID code throughout the recovery process, and this makes it impossible tracing the assets throughout the whole process.
13. Other interesting cases can be found among Italian mafias for the management of some important fruit markets in Italy (see 8.4) and a
How many and what types of assets are confiscated, according to the available data?
Despite these obstacles to determine a clear picture of the state of confiscation overall, the case by case analysis of the 7 OCP countries reveals that (see Chapter 12):
• The number and value of confiscated assets has increased over past ten years in most of the countries for which data are available;
• The majority of confiscated assets are movable assets. Cash, bank accounts, vehicles, boats and, to a much lesser extent, real estate are commonly seized (see below); • Except for in Italy, there is a clear absence of confiscated
companies. Confiscation of companies is not a widespread practice, despite the evidence of criminal investments across many different business sectors in EU MS.
The available data therefore show that significant discrepancy between what criminals invest in and what is actually confiscated by EU authorities, not only in terms of amount but also in terms of types of criminal assets.
Research and policy implications
Given its pioneering nature, its data limitations and the limited number of EU MS covered, this report has to be considered only a first step towards a better understanding of the economics of organised crime in Europe, and a starting point for further studies in this field. In particular, the OCP report has highlighted several challenges which should be addressed by future research and policy initiatives (see Chapter 13). From a research standpoint:
• This report provides a cold picture of the activity of OCGs in illicit and legitimate markets in Europe according to police and judiciary cases. However, there is the need to pass from cold pictures of past cases to heat maps of risk, which could highlight not only where risks of criminal
infiltration are, but also where they could emerge in the future.
• In order to do so, it is necessary to extend the study to all the 28 EU MS, in order not to miss the transnational nature of criminal investments and to identify the areas where to focus research and policy initiatives.
• OCP has provided a ‘wide-angle’ picture, highlighting
macro patterns and trends of OCGs in illicit and
legitimate markets. There is the need enrich this macro approach with a micro approach which could focus on
more specific issues. Future research initiatives should integrate the findings of this study with other research projects, more limited-in-scope, conducted at EU level.15 From a policy perspective:
• This report has clearly highlighted that data in this field (e.g. on confiscated assets, on STRs, etc) across EU MS are lacking and of poor quality. EU agencies should propel the collection of better data across European countries and guarantee access to researchers active in this field. • This report has shown that a discrepancy exists between
what criminals invest in and what is confiscated by European authorities, in particular with regard to criminal investments in legitimate businesses. There is the need to improve the confiscation of companies, by improving their tracing (e.g. through strengthening the financial investigation skills of European LEAs and FIUs and giving them better access to centralised registries and IT tools),16 by improving the regulation (e.g. widening the use extended confiscation or third-party confiscation) and improving the management of the companies once confiscated. Also the use alternative instruments to seizure (such as temporary suspension of business administration or administrative penalties for companies ‘polluted’ by organised crime) should be explored and expanded.
14. The considered data is from Patja (Finland), AGRASC (France), CAB (Ireland), ANBSC (Italy) and PNSD (Spain). See chapter 12 for details.
15. For example with the findings of Project ARIEL (www.arielproject.eu), funded by DG Home Affairs and expected to finish in spring 2015. ARIEL has been carrying out a script analysis of some selected cases studies of organised crime infiltration into legitimate companies in 5 pilot EU countries in order to better understand how OCGs acquire and keep control of European corporate entities. 16. For example EU funded Project EBOCS (www.ebocs.eu) will produce an IT prototype available to LEAs, FIUs and AROs to ease the collection and analysis of data on shareholders and administrators across different business registries of five EU MS. Should this pilot tool be extended to other countries, it would Figure 5 – Average percentages of types of assets
confis-cated in five OCP countries14
Source: OCP analysis on AROs public reports and OCP data
14.5% 1.8% 23.9% 59.8% 0% 20 0% 60 0% Real estate Companies Vehicles/Boats Cash and movable assets
4
• Finally, this report has stressed the need for better public-private partnerships (e.g. through a more effective exchange of data and of best practices) to prevent that criminal groups could exploit loopholes in legal supply chains to carry out criminal activities such as theft, fraud, counterfeiting or money laundering.
Based on the current research gaps and the policy perspective, future projects should adopt a more integrated approach to better combat organised crime infiltration and prevent its spread in new areas of the European legitimate economy. The development of risk assessments should be coupled with an holistic analysis of the opportunities that organised criminal groups exploit to infiltrate the legal economy. In turn this requires a micro-approach focusing also on the contextual vulnerabilities, such as legislation and the level and type of crime control policies. All 28 EU MS need to collaborate in the systematic collection of homogenous and comparable data. The data collection process should require the collaboration of experts from different countries and backgrounds (including LEAs, FIUs and AROs, academic, public officials and representatives of the private sector) to allow for a better interpretation of information as well as to increase the shared knowledge regarding this phenomenon. Finally, European institutions and national governments should provide human and technological resources in order to meet these challenges. The organisation of LEAs, FIUs and AROs could be reshaped in order these agencies can better identify, assess and manage the risks of criminal infiltration into illicit and legitimate markets.
Following an opportunity reduction approach and focusing
on high-risk situations could lead to the achievement of these results with fewer resources and less costs for European citizens.
ACFE Association of Certified Fraud Examiners AGRASC Agence de la Gestion et Recouvrement des Avoirs Saisis et Confisqués (France) AML Anti-Money Laundering
ANBSC Agenzia Nazionale per l'amministrazione e la destinazione dei beni sequestrati e confiscati (Italy)
ANDEMA Asociación Nacional para la defensa de
la Marca (Spain)
ARIEL Assessing the Risk of the Infiltration of Organized Crime in EU MSs Legitimate Economies
ARO Asset Recovery Office
ASIC Australian Securities and Investments Commission
ATO Australian Tax Office
ATS Amphetamine-Type Stimulants AWP Amusement with prize
BASCAP Business Action to Stop Counterfeiting
and Piracy
BMC Bandidos Motorcycle Club
BOOM Bureau Ontnemingswetgeving Openbar
Ministerie (Criminal
Assets DeprivationBureau of the Public Prosecution Service) (Netherlands) BRIFN Brigade de recherches and
d’investigations financières
nationale (France)
CAB Criminal Assets Bureau (Ireland) CARIN Camden Assets Recovery Interagency Network
CASE Center for Social and Economic Research
CEART Centres of Excellence in Asset Recovery
and Training
CENSIS Centro Studi Investimenti Sociali (Italy) CFT Combating the Financing of Terrorism CICO Centre of Intelligence against the Organized Crime (Spain)
CJA Criminal Justice Act
CJIB Centraal Justitieël Incassobureau
(Netherlands)
CMC Cannonball MC
COSC Central Office for Seizure and Confiscation (Belgium)
CPB Centraal Planbureau (Netherlands Bureau for Economic Policy Analysis) DGDDI Direction générale des douanes et droits
indirects (France)
DIA Direzione Investigativa Antimafia (Italy) DNA Direzione Nazionale Antimafia (Italy) DOCI Database on Organised Crime Investments
DPP Director of Public Prosecutions (Ireland)
EC European Commission
ECAB Europol Criminal Assets Bureau ECB European Central Bank
EMCDDA European Monitoring Centre for Drugs and Drug Addiction
EMI Euromonitor International
ESAET Environment Services Association
Education Trust
ETA Euskadi Ta Askatasuna ETS Emission Trading System
EU European Union
FATF Financial Action Task Force FARC Revolutionary Armed Forces of Colombia
FCTC Framework Convention on Tobacco Control
FIU Financial Investigation Unit
GBP UK Pound Sterling
GDF Guardia di Finanza (Italy) GDO Grande Distribuzione Organizzata GDP Gross Domestic Product GPS General Population Survey
GRECO Group of Special Response to Organised Crime
GTRIC General Trade-Related Index of Counterfeiting for Economies HAMC Hells Angels MC
HMRC Her Majesty's Revenue and Customs
(UK)
HLM Habitation à Loyer Modéré HRDU High Risk Drug Users
HS code Harmonized System Code ICPR Institute for Criminal Policy Research ILO International Labour Office
ILU International Liaison Officers Units IMF International Monetary FUnd
INHESJ Institut National des Hautes Études de la Sécurité et de la Justice (France) IPOL National Police Intelligence Service
(Netherlands)
IPR Intellectual Property Rights IRA Irish Republican Army ISS Internal Security Strategy
ISTAT Istituto Centrale di Statistica (Italian National Statistics Institute)
ITF Illicit Trafficking in Firearms ITTP Illicit Trade in Tobacco Products JARD Joint Asset Recovery Database (UK) KLPD Koninklijke Landelijke Politie Dienst
(Netherlands)
LEA Law Enforcement Agency
LECRIM Ley de Enjuiciamiento Criminal (Spain) MAOC-N Centre Maritime Analysis and
Operations against drug trafficking
MC Motor Club
MHRA Medicines and Healthcare Products
Regulatory Agency
MS Member State
MTB Money Transfer Businesses MTEC Missing Trader Extra-Community MTIC Missing Trader Intra-Community MOKAS-FIU Unit for Combating Money Laundering
(Cyprus) MUP Ministry of the Interior (Croatia) NACE Nomenclature Générale des Activités Économiques dans les Communautés Européennes NAO National Audit Office (UK) NBI National Bureau of Investigation (Finland) NCA National Crime Agency (UK) NFA National Fraud authority (UK) NHS National Health Service (UK) NPS New Psychoactive Substances NUTS Nomenclature of Territorial Units for Statistics
NWCU National Wildlife Crime Unit (UK)
OC Organised Crime
OCCT Organised Crime and Counter Terrorism Unit
OCG Organised Crime Group
OCJS Offending, Crime and Justice Survey OCP Organised Crime Portfolio
OCTF Organised Crime Task Force
OECD Organisation for Economic Cooperation
and Development
OFDT Observatoire Français des Drogues et
des Toxicomanies
OLAF European Anti-Fraud Office OMCG Outlaw Motorcycle Gangs
ONDRP Observatoire National de la Délinquance et des Réponses Pénales (France) OPC Organised property crime
OSCE Organization for Security and Co- Operation in Europe
PACA Provence-Alpes-Côte d'Azur PACCO Action Plan Against Organised Crime PCF Police college of Finland
PFRC Personal Finance Research Centre PIAC Plateforme d’Identification des Avoirs
Criminels (France)
PNSD Plan Nacional Sobre Drogas (Spain) POCA Proceeds Of Crime Act
PPO Public Prosecution Office (Netherlands) PIAC Plateforme d’Identification des Avoirs
Criminels (France)
PIRA Provisional Irish Republican Army PSNI Police Service of Northern Ireland REITOX Réseau Européen d' Information sur les Drogues et les Toxicomanies (European
information network on drugs and drug addiction)
RIRA Real Irish Republican Army SALW Small Arms and Light Weapons SAC Servizio Analisi Criminale (Italy) SCI Société Civile Immobilière (France) SEPI Sociedad Estatal de Participaciones
Industriales (Spain) SFO Serious Fraud Office (UK)
SFO Strafrechtelijk Financieel Onderzoek
(Netherlands)
SGI Société de Gestion Immobilière (France) SIPPI Sistema Informativo Prefetture e Procure
dell'Italia
STRJD Service Technique de Recherches Judiciaires et de Documentation
(France)
SOCTA Serious and Organised Crime Threat Assessment
SOCA Serious Organised Crime Agency (UK) TFEU Treaty on the Functioning of the
European Union
THB Trafficking in Human Beings TTI Texas Transportation Institute VAT Value Added Tax
VLT Video lottery terminal VRT Vehicle Registration Tax UAE United Arab Emirates
UB United Brotherhood
UCO Central Operative Unit (Spain) UDEF Economic and Fiscal Crime Unit (Spain) UDUR Durham University (UK)
UEFA Union of European Football Associations UIF Unità di Informazione Finanziaria (Italy) UK United Kingdom (Great Britain, Scotland,
Wales and Northern Ireland)
UN United Nations
UNAFEI United Nations Asia and Far East Institute
UNODC United Nations Office on Drugs and Crime
UOKFK Unit Combating Corruption and Financial Crimes (Czech Republic)
URJC Universidad Rey Juan Carlos (Spain)
USD US dollars
UU Utrecht University (Netherlands) WAP Weighted Average Price WEEE Waste Electrical and Electronic Equipment
WHO World Health Organization WRT Wholesale and Retail Trade
WODC Wetenschappelijk Onderzoek- en Documentatiecentrum (Research and
Documentation Centre of the Dutch Ministry of Justice)
Project OCP – Organised Crime Portfolio
This report presents the final results of Project OCP – Organised Crime Portfolio (www.ocportfolio.eu). Project OCP has been carried out with financial support from the Prevention of and Fight against Crime Programme of the European Union - European Commission, DG Home Affairs, and has been developed by an international consortium of eight partners:
• Transcrime – Joint Research Centre on Transnational Crime (www.transcrime.it) of the Università Cattolica del Sacro Cuore di Milano and the Università degli Studi di Trento (Italy), coordinator of the project
• Police College of Finland (PCF – Finland)
• Agence de Gestion et de Recouvrement des Avoirs Saisis et Confisqués (AGRASC – France)
• An Garda Síochána - Criminal Assets Bureau (CAB – Ireland).
• Guardia di Finanza (GDF – Italy)
• Utrecht University (UU - The Netherlands) • Universidad Rey Juan Carlos (URJC – Spain) • Durham University (UDUR – United Kingdom)
The aim of OCP is to provide a first exploration of the economics of organised crime in Europe, and in particular to understand:
• Where organised crime proceeds are generated, from what illicit markets;
• Where these proceeds are then invested in the legitimate economy, in what regions, assets and business sectors; • To what extent these proceeds are confiscated and
recovered by European authorities.
Background: the gap in the research
In the past thirty years, awareness has grown at international level that in order to combat organised crime effectively, it is necessary first to disrupt its business cycle: from the sources of its illicit proceeds to its investments in the legitimate economy.
In recent years, numerous regulatory and policy measures have been introduced at European level to address this issue. They include a range of legal instruments in both the anti-money laundering field (Riccardi & Savona, 2013; Unger et al., 2014, for a review) and that of the confiscation and recovery of criminal assets, such as the new Directive 2014/42/EC (European Commission, 2008; Forsaith et al.,
2012; European Parliament, 2014).
However, despite these advances, numerous questions remain unanswered from a research perspective: there is a lack of knowledge on how the economics of organised crime actually work: i.e. where organised crime proceeds are produced, from what illicit markets, where these proceeds are invested in the legitimate economy (in what geographic regions, types of assets and business sectors), and to what extent they are eventually confiscated by the public authorities.
This is due primarily to the lack of data and information that would enable comprehensive analysis of the phenomenon. Organised crime groups do not publish financial statements, and it is necessary to rely on indirect proxies for their business (see Chapter 2 for details), such as data on the portfolio of confiscated assets or other judicial evidence which affords understanding of how criminals make and then spend their money. But also this information is scarce: statistics on confiscated assets are very limited across Europe, and they are very difficult to compare owing to the different regulations (see Part 3). Similarly, also other useful information (e.g. on suspicious transaction reports, financial investigations, etc.) is very poor and fragmented.
For this reason, the available studies in this field furnish only a partial understanding of the dynamics of the economics of organised crime: they usually focus either on specific countries (see Chapters 4 and 8 for a review) and therefore miss the increasingly transnational nature of criminal investments; or they analyse only specific illicit markets (see Chapter 3), not taking account of the links that organised crime groups are able to establish between the illegal and the legitimate economy; and only a few studies explore the differences in terms of business strategies among different criminal groups.
This lack of knowledge makes it more difficult for LEAs, FIUs and AROs in Europe to obtain an overall picture of the mechanisms of the organised crime business, and thus determine where to focus their investigative and asset recovery resources. Similarly, also public authorities and private companies (including banks and the other entities subject to AML obligations) are unable correctly to assess where the risk of criminal investments is higher so that they can improve their preventive action and reduce the opportunities for organised crime infiltration.
1.
Introduction
How Project OCP addresses this gap
Project OCP – Organised Crime Portfolio (www.ocportfolio. eu) aims to address this knowledge gap. It provides a pioneering analysis of the economics of organised crime groups (OCGs) in Europe, in particular by answering the three following research questions:
• Where do organised crime proceeds originate? From what illicit markets? What is their scale?
• Where are these proceeds invested in the legitimate economy? In what regions, assets and business sectors? • To what extent are these proceeds and assets recovered
and confiscated?
In order to address these questions, Project OCP builds on previous research initiatives,17 primarily the project entitled
Gli investimenti delle mafie – Mafia investments (www.
investimentioc.it), carried out in 2012 by Transcrime with funding from the Italian Ministry of the Interior, and which analysed the illicit markets and investments in the legitimate economy of mafia groups in Italy (Transcrime, 2013a). Employing the same approach as the Italian project, OCP extends the study to European level, and for the first time adopts a transnational perspective. It focuses on seven EU countries (Finland, France, Ireland, Italy, the Netherlands, Spain and the United Kingdom), represented by the OCP partners, but also presents a broader analysis of the situation in Europe as a whole.
In order to maximise the amount of usable data, OCP has collected a wide range of information, both qualitative and quantitative, deriving from very different sources, and including statistics on confiscated assets, data from police investigations, judicial evidence, academic literature and open sources, all of them analysed employing an innovative methodology (see Chapter 2 and the Methodological Annex). Given the diversity of these data and the pioneering methodology, this report aspires to be only a first exploration of this phenomenon and a first step towards better understanding of how its business cycle works, from the origin of illicit proceeds, through its investments in the legitimate economy, to its disruption through confiscation.
Structure of this report
The report is structured into three parts which precisely reflect the three research questions addressed by the project.18 After a brief description of the main methodological issues in Chapter 2 (definitions, classifications, sources and data): Part 1 focuses on the origin of organised crime proceeds, i.e. illicit markets. In particular:
• Chapter 3 provides a summary analysis at European aggregate level, with a measurement of the scale of the revenues from illicit markets and a review of the main criminal groups which share these proceeds;
• Chapter 4 focuses on 10 illicit markets (illicit drugs, THB, ITF, ITTP, counterfeiting, illegal gambling and match fixing,
extortion racketeering, usury, fraud, organised property crime);
• Chapter 5 provides an in-depth analysis of illicit markets in the 7 European countries covered by OCP (Finland, France, Ireland, Italy, the Netherlands, Spain, United Kingdom);
• Chapter 6 constitutes a bridge between Part 1 and 2 by presenting an exploratory assessment of what proportion of the revenues generated by illicit markets may be available for investment in the legitimate economy.
Part 2 analyses where (in what regions, types of assets, business sectors, and with what differences among criminal actors) organised crime proceeds are then invested in the legitimate economy. In particular:
• Chapter 7 provides an analysis of organised crime investments at European aggregate level;
• Chapter 8 focuses on criminal investments in the 7 OCP countries (Finland, France, Ireland, Italy, the Netherlands, Spain, United Kingdom);
• Finally, Chapter 9 explores the impact and the costs of organised crime investments on the European legitimate economy.
Part 3 studies the extent to which organised crime proceeds are eventually confiscated by European authorities. In particular:
• Chapter 10 provides an overview of the regulatory framework for criminal asset recovery in Europe, with a focus on the seven OCP countries;
• Chapter 11 provides an assessment of the availability of data on confiscated assets in Europe;
• Finally Chapter 12, based on the available data, provides an analysis of confiscated assets in the 7 OCP countries. The report concludes by examining the research and policy implications stemming from the analysis and discussing future research follow-ups on Project OCP.
Who can benefit from this report?
Despite its data limitations and its pioneering nature, this report is a starting point towards better comprehension of the opportunities exploited by organised crime to infiltrate illicit markets and legitimate businesses in Europe.
17. For a complete list of related projects and research initiatives see http://www.
18. This report is also structured to reflect the activities of the project and to incorporate its deliverables. In particular, a single report has been produced (instead of a plurality of deliverables) so as to enable better comprehension of the results of the analysis carried out by OCP, and to provide an easy-to-handle product for policy-makers, investigators, researchers and other stakeholders. Specifically, Deliverable D1 is incorporated in Chapter 2 (description of the data available and collected) and in Chapter 11 (assessment of the availability of data on confiscated assets); Deliverable D3 is incorporated in Chapter 2 (description of the methodology developed for the analysis) and in the Methodological Annex; Deliverable D4 is incorporated in Part 1, in particular Chapters 3, 4 and 5 (estimate of the amount of organised crime proceeds from illicit markets) and in Part 2, in particular in Chapters 7 and 8 (Analysis of organised crime investments); Deliverable D5 is incorporated in Part 2, and in particular in Chapter 9 (assessment of the impact of OC investments on the European legitimate economy); Deliverable D6 is incorporated in Part 2, in particular in Chapters 7 and 8 (analysis of selected economic sectors with evidence of organised crime investments). The Final public conference (Deliverable D7) was held on 27 November 2014 in Brussels, at EU Commission premises, with the
In particular, it represents an invaluable support tool for: • LEAs and FIUs, to identify the areas in the illicit and the
legitimate economy on which to focus their investigative activity;
• AROs, to develop more effective confiscation policies; • Public authorities, such as local governments and
public contractors, as a basis for better assessment and prevention of the risk of criminal infiltration of the legitimate economy;
• Banks and other AML covered entities (e.g. auditing firms, law firms, real estate agencies, casinos), to respond better to AML obligations, and in particular to develop more effective CDD activities;
• Private companies, to determine more precisely the vulnerabilities in the supply-chain which may be exploited by criminal groups for illicit trade purposes.
The final report of Project OCP constitutes a solid basis for the future development of a risk assessment tool which could be used by both public and private institutions to reduce the opportunities for criminal infiltration of the legitimate economy, and thereby strengthen the prevention of organised crime business.
In addition, this report can also be used by European public authorities to determine the gaps that must be addressed from both a regulatory and policy standpoint, for example to improve the availability of data in this field (see research and policy implications in Chapter 13).
What is new about this report?
With respect to the existing literature in this field, this report provides a range of innovative contributions, in-cluding:
• One of the first quantifications at European level of the scale of the illicit revenues from illicit markets19 (Part 1)
• A comprehensive literature review of the main criminal actors involved in illicit markets in Europe (Part 1)
• An estimation of how much remains of the revenues from illicit markets, after subtracting costs, for investment in the legitimate economy (Part 1) • A map of the geographic regions in Europe with evidence of organised crime investments (Part 2) • A list of the business sectors most exposed to organised crime investments (Part 2) • A first assessment of the availability of statistics on confiscated assets across EU member states (Part 3) • An analysis, based on the available statistics, of what assets are confiscated across EU MS (Part 3)
17. In particular, estimates of almost all of the 28 EU MS are available for the following illicit markets and activities: illicit trafficking in heroin, cocaine, cannabis, ecstasy, amphetamines, illicit trafficking in firearms, illicit trade in tobacco products, counterfeiting, MTIC frauds, and cargo theft.