UNIVERSITY OF MOLISE
DEPARTMENT OF BIOSCIENCE AND TERRITORYPHD COURSE -CURRICULUM TERRITORIALE
XXXICICLO
VIBRATION BASED METHODS FOR THE
STRUCTURAL ASSESSMENT OF HISTORICAL
STRUCTURES
ICAR/09 DANIELE BRIGANTETUTORS:
PROF.FILIPPO SANTUCCIDE
MAGISTRIS
PROF.GIOVANNI FABBROCINO
COORDINATOR: PROF.SSA
GABRIELLA STEFANIA SCIPPA
Acknowledgements
Completion of this doctoral dissertation was possible with the support of several people. I would like to express my sincere gratitude to all of them. First of all, I am extremely grateful to my research guide, Professor Giovanni Fabbrocino, for his valuable guidance, scholarly inputs and consistent encouragement I received throughout the research work. The joy and enthusiasm he has for his research was contagious and motivational for me, even during tough times in the Ph.D. pursuit. I would also like to thankful my other supervisor, Professor Filippo Santucci De Magistris for his interest, care and continuous encouragement. I am deeply grateful to Professor Carlo Rainieri for helping me with his very kind amicable and positive disposition. I am grateful to Professor Salvatore Gerbino , for his suggestions for the numerical models analysis.
I thank Professor Stefania Scippa, Coordinator of the Phd Course - Curriculum Territoriale , for the academic support and the facilities provided to carry out the research work at the University.
Some faculty members of the University have been very kind enough to extend their help at various phases of this research, and I do hereby acknowledge all of them.
I would like to express my deep gratitude to my guidance, in the foreign research period, Professor Paulo Lourenço from the University of Minho, for welcoming me in to Institute for Sustainability and Innovation in Structural Engineering (ISISE). I thank him for the academic support and the facilities provided to carry out the research work at the Institute.
I would like to thank heartily my co-guidance, in the visiting period, Dr. Maria Giovanna Masciotta from the University of Minho. She has been very kind and patient and always willing to lend her service whenever I approached her and I acknowledge and appreciate her for all her efforts. I would also like to thank all the technicians of the Structural Laboratory LEST, of Civil Engineering Department, of University of Minho, for their support during the experimental phases I am particularly grateful to Antonio Matos who helped me during the all activities.
that were offered to me by my friend and collegue Dr. Danilo Gargaro for which I am really grateful.
During the course of this work, I had an opportunity to interact with many fellow students. I thank them for their friendship and for their support during this work. I would like to thank in particular Massimina and Dipendra. I cannot forget to thank my flatmates Beatrice, Nicoletta and Antonio who supported me a lot during the period in Guimarães, and which also long distance, they continued to encourage me in this last months.
I take this time to express my gratitude to my new friends and colleagues that I met in Portugal. I gained a lot from them, through their personal and scholarly interactions and their suggestions for the life.
I owe a lot to my parents, who encouraged and helped me at every stage of my personal and academic life, and longed to see this achievement come true. I would also like to thank all of my friends who supported me in writing, and incented me to strive towards my goal.
I want to dedicate this work to my friend Fra Peppe. Thank you for supporting me for everything, and especially I can’t thank you enough for encouraging me throughout this experience.
“No one can pass through life, any more than he can pass through a bit of country, without leaving tracks behind, and those tracks may often be helpful to those coming after him in finding their way.”
With this thought of the founder of the modern Scouting movement Baden Powel, at last but not least, I would like to thank God Almighty for giving me the strength, knowledge, ability and opportunity to undertake this research study and to persevere and complete it satisfactorily. Without his blessings, this achievement would not have been possible. “
Vibration based methods for the structural assessment of historical structures I
T
ABLE OF
C
ONTENTS
TABLE OF CONTENTS ... I LIST OF FIGURES ... V INDEX OF TABLES ... XV CHAPTER 1 INTRODUCTION ... 11.1BACKGROUND OF THE SEISMIC VULNERABILITY FOR THE ARCHITECTURAL HERITAGE ... 3
1.2MOTIVATION FOR THE RELIABLE PROCEDURES FOR PERFORMANCE ASSESSMENT OF HISTORICAL STRUCTURES IN SEISMIC AREAS ... 7
1.3OUTLINE OF THE THESIS ... 14
CHAPTER 2 VIBRATION BASED OF DYNAMIC IDENTIFICATION: BACKGROUND AND OPEN ISSUES ... 17
2.1INTRODUCTION ... 17
2.2BASICS OF DYNAMIC ... 18
II Daniele Brigante
2.3METHODS FOR OPERATIONAL MODAL ANALYSIS (OMA) ... 24
2.3.1 Frequency Domain Decomposition method ... 26
2.3.2 Stochastic Subspace Identification Method ... 29
2.4SOMEREMARKSONTHEDYNAMICSOFHERITAGE STRUCTURES ... 31
2.5ANOVERVIEWOFEXPERIMENTALSUBSTRUCTURING TECHNIQUES ... 46
2.5.1 The substructuring approach to dynamic analysis ... 47
2.5.2 The Modal Assurance Criterion (MAC) in the dynamic substructuring ... 52
2.5.3 Modal Assurance Criterion (MAC)... 53
2.5.4 Substructure Modal Assurance Criterion (SUMAC) ... 54
CHAPTER 3 MODEL UPDATING VS. DAMAGE ASSESSMENT 59 3.1INTRODUCTION ... 59
3.2CLASSIFICATION OF VIBRATION-BASED DAMAGE IDENTIFICATION METHODS ... 60
3.3SPECTRUM DRIVEN DAMAGE IDENTIFICATION METHOD ... 61
3.3.1 Basic theory ... 62
CHAPTER 4 A MAC BASED APPROACH: DYNAMIC IDENTIFICATION OF THE STRUCTURAL BEHAVIOUR ... 65
4.1THE ROLE OF THE DYNAMIC IDENTIFICATION ... 65
4.1.1 Introduction ... 65
Vibration based methods for the structural assessment of historical
structures III
4.1.3 An approach to discriminate global or local mode... 71
4.2A NOVEL USE OF THE MAC: ASSESSMENT OF THE METHOD... 74
4.2.1 Explanatory numerical cases: Regular masonry structure ... 76
4.2.2 Single Cell ... 79
4.2.3 Double Cell ... 100
4.2.4 L-Shaped aggregate... 107
4.2.5 Monitoring strategies ... 115
4.3FINAL REMARKS ... 116
CHAPTER 5 FIELD VALIDATION ON AN ITALIAN MASONRY BUILDING ... 119
5.1INTRODUCTION ... 119
5.2KNOWLEDGE PATH OF THE STRUCTURE ... 120
5.2.1 Knowledge path ... 120
5.2.2 Historical evolution ... 121
5.2.3 Structural assessment ... 124
5.2.4 Description of the structural systems ... 127
5.3DESCRIPTION OF THE NUMERICAL MODEL ... 135
5.3.1 Introduction ... 135
5.3.2 Equivalent Frame Model ... 136
5.4DYNAMIC IDENTIFICATION SYSTEM ... 144
5.4.1 System identification test ... 144
5.4.2 Dynamic identification campaign ... 147
IV Daniele Brigante
5.4.4 Assessment of the modal shapes by means the MAC based
procedure ... 155
5.5CLOSING FINAL REMARKS ... 158
CHAPTER 6 DAMAGE ASSESSMENT: AN OLD ARCH REPLICA161 6.1INTRODUCTION ... 161
6.2ARCH MODEL DESCRIPTION ... 163
6.2.1 Arch construction description ... 163
6.2.2 Numerical Model description ... 165
6.2.3 Modal Dynamic Analysis ... 170
6.2.4 Numerical prediction of damage locations ... 173
6.3ARCH DAMAGE TEST IN DISPLACEMENT CONTROL ... 176
6.3.1 System identification tests ... 178
6.3.2 Test setup ... 182
6.3.3 Types of Input data acquisition ... 190
6.3.4 Modal identification: Result for the damage evolution ... 191
6.3.5 Application of the spectral damage analysis ... 200
6.3.6 Results ... 203
CHAPTER 7 CONCLUSIONS AND FUTURE DEVELOPMENTS 207 REFERENCES ... 210
Vibration based methods for the structural assessment of historical
structures V
L
IST OF
F
IGURES
Figure 1.1. Collapse mechanisms ... 8 Figure 2.1. System scheme for the Experimental Modal Analysis
approach (Benjamin Greiner, 2009) ... 19 Figure 2.2. Free vibration of an undamped system (Chopra, 2001): (a)
system; (b) and (c) different representations of the first natural vibration mode ... 19 Figure 2.3. Total response as superposition of modal components
(Clough & Penzien, 1993) ... 24 Figure 2.4. Stochastic Subspace Identification method: (a) model
calibration; (b) model parameter estimation dilemma; and (c) data driven with the poles selection through the several test setups (Ramos 2007) ... 30 Figure 2.5. a) Distribution of the main modal shapes of some churches
in the field of frequency and active modal mass participating; Mode contribution in terms of mass participating : b) S.Maria in Donnaromita, c) S. Agostino
VI Daniele Brigante
alla Zecca, d) S. Giovanni Maggiore. Adapted to Boscato et al 2016 ... 35 Figure 2.6. a) Distribution of the main modal shapes of some palaces
in the field of frequency and active modal mass
participating; Mode contribution in terms of participating mass: b) Palazzo Bosco Lucarelli; c) Beylerbeyl Palace. (Adapted from Boscato et al 2016 ... 36 Figure 2.7. Different structural configuration of Bell Tower... 38 Figure 2.8. a) Bell Tower view of the San Bartolomeo church; b) layout
of the sensor at each floor; c-d) 3D model of the church aggregate ... 39 Figure 2.9. a) Graph of PMR in y [%]; b) experimental mode and
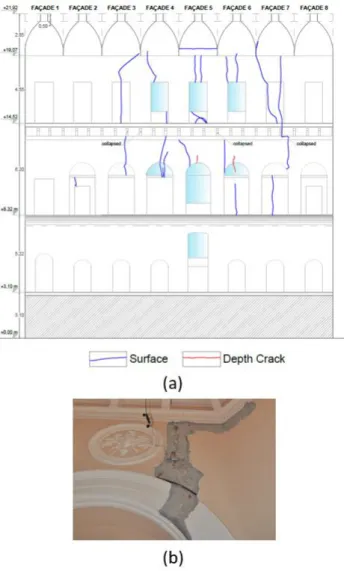
frequency values of the Bell Tower ... 41 Figure 2.10. Layout of the accelerometers at each floor of the Tower . 43 Figure 2.11. a) Damage survey of the Osservatorio Vesuviano Tower;
b) damage detail on vaulted ... 44 Figure 2.12. Assembly using interface displacements (adapted from
van der Valk. 2010) ... 50 Figure 2.13. Assembly using interface forces (adapted from van der
Valk. 2010) ... 51 Figure 2.14. Mixed interface method (adapted from van der Valk.
2010) ... 51 Figure 2.15. Yaw system of a 2.3. MW Siemens wind turbine adapted
Vibration based methods for the structural assessment of historical
structures VII
Figure 2.16. SUMAC of the models from the total assembly and he modes of the component assembly adapted from van der
Valk (2010) ... 57
Figure 3.1. Classification of Vibration-based Damage Identification Methods by (M.G. Masciotta, 2015) ... 61
Figure 4.1. Classification of the type of behaviour of the existing masonry building ... 68
Figure 4.2. Sample MAC matrix ... 73
Figure 4.3. 3D Model of the aggregate ... 77
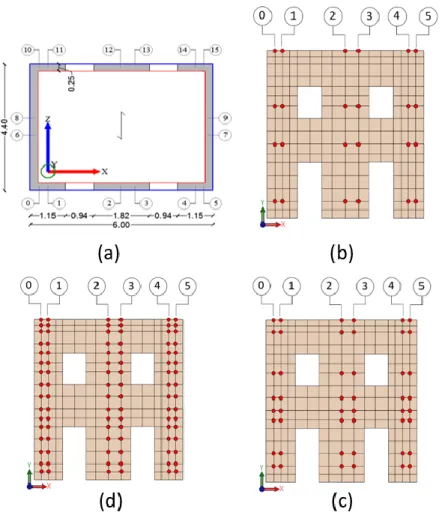
Figure 4.4. Location of virtual sensors ... 78
Figure 4.5. a) 3D Model of the isolated building; b)Finite mesh view . 80 Figure 4.6. Model 1: schematic plan view of the aggregate reference basic cell with restrained floor (A), and unrestrained floor (B) ... 81
Figure 4.7. Single cell: set of virtual sensor: a) view in plan of the verticals (16 alignments), the number of the sensors increase (b), (c), (d) ... 83
Figure 4.8. M.1.A: modal analysis results for rigid and restrained floor ... 85
Figure 4.9. M.1.B: modal analysis results for rigid and restrained floor ... 86
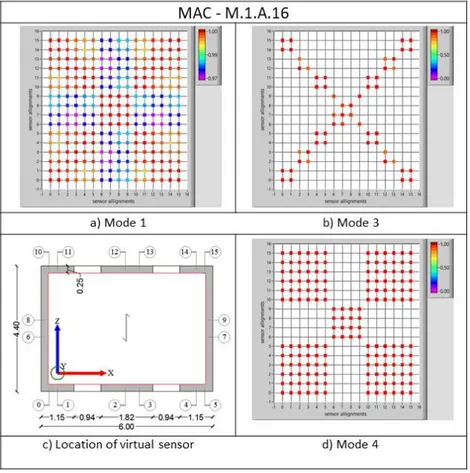
Figure 4.10. Results M.1.A.16: the MAC matrix associated with the global modes a-b) and local mode d); c) schematic plan view of the virtual alignments ... 87
VIII Daniele Brigante
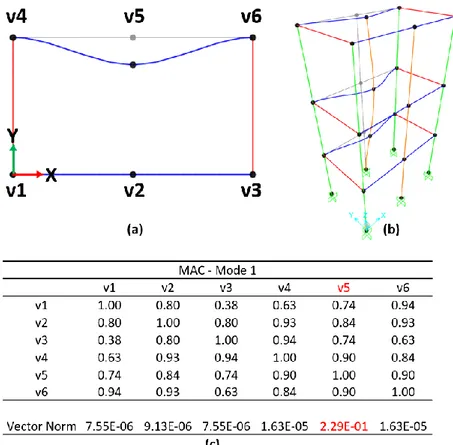
Figure 4.11. Results M.1.B.16: the MAC matrix associated with the global modes a-b) and local mode d); c) schematic plan view of the virtual alignments ... 88 Figure 4.12. Plan view of the reference numerical model ... 90 Figure 4.13. 3D View of the reference numerical model ... 91 Figure 4.14. Results multi-storey table mode 1: a) deformed shape
view in plan; b) 3D view of mode shape; c) the MAC matrix associated with the first mode and vector norm values. ... 92 Figure 4.15. Results multi-storey table mode 2: a) deformed shape
view in plan; b) 3D view of mode shape; c) the MAC matrix associated with the first mode and vector norm values. ... 93 Figure 4.16. Results multi-storey table mode 3: a) deformed shape
view in plan; b) 3D view of mode shape; c) the MAC matrix associated with the first mode and vector norm values. ... 94 Figure 4.17. Results multi-storey table mode 4: a) deformed shape
view in plan; b) 3D view of mode shape; c) the MAC matrix associated with the first mode and vector norm values ... 95 Figure 4.18. Results multi-storey table mode 5: a) deformed shape
view in plan; b) 3D view of mode shape; c) the MAC matrix associated with the first mode and vector norm values ... 96
Vibration based methods for the structural assessment of historical
structures IX
Figure 4.19. Results multi-storey table mode 6: a) deformed shape view in plan; b) 3D view of mode shape; c) the MAC matrix associated with the first mode and vector norm values ... 97 Figure 4.20. Results multi-storey table mode 7: a) deformed shape
view in plan; b) 3D view of mode shape; c) the MAC matrix associated with the first mode and vector norm values ... 98 Figure 4.21. Double cell: geometry modelling with restrained floor
(A); and unrestrained floor with 0.02 m gap (B)
configuration ... 101 Figure 4.22. Double cell: set of virtual sensor: the number of the
sensors and the vertical increase. ... 102 Figure 4.23. M.2.A: modal analysis results for rigid and restrained
floor (a) and rigid and unrestrained floor (b) ... 104 Figure 4.24. M.2.B: model analysis results for rigid and restrained
floor (a) and rigid and unrestrained floor (b) ... 104 Figure 4.25. Results M.2.A.30: the MAC matrix associated with the
global modes a-b) and local mode d); c) schematic plan view of the virtual alignments ... 105 Figure 4.26. Figure 4.27. Results M.2.B.30: the MAC matrix associated
with the global modes a-b) and local mode d); c)
schematic plan view of the virtual alignments ... 106 Figure 4.28.a) L-Shape aggregate: schematic plan view of the
X Daniele Brigante
Figure 4.29.b) L-Shape aggregate: schematic plan view of the
aggregate with unrestrained floor - application of a 0.02 m gap - (B). ... 108 Figure 4.30. L-Shape aggregate: set of virtual sensor alignments ... 109 Figure 4.31. Results for building aggregate: M.3.A- Modal analysis
with rigid and restrained floor; ... 111 Figure 4.32. Results for building aggregate: M.3.B- Modal analysis
with rigid and unrestrained floor; ... 111 Figure 4.33. Results: M.3.A.40: the MAC matrix associated with global mode a- b) and local modes d) ... 113 Figure 4.34. Results: M.3.B.40: the MAC matrix associated with global
mode a- b) and local modes c) ... 114 Figure 4.35. a) Schemes in plan of the sensors distribution b) results in terms of MAC index ... 116 Figure 5.1. The artefact printing ... 122 Figure 5.2. Plans and section of the building 1951 ... 123 Figure 5.3. Plan of the building in which the relevant investigations
are marked ... 126 Figure 5.4. Geometry relief: a) view of the plan; b) drawing of main
prospectus ... 128 Figure 5.5. Result of thermographic testing of walls: a) ground floor;
b) first floor ... 129 Figure 5.6. a) infrared thermos camera type FLIR E60bx; b) endoscopy
Vibration based methods for the structural assessment of historical
structures XI
Figure 5.7. Direct investigation: a) front of Masonry Class A3 - Group Ib ; b) cross sections ... 131 Figure 5.8. Direct investigation: a) front of Brickwork; b) cross section
... 132 Figure 5.9. a) IR image of weaving floor; b) detail of concrete curb .. 133 Figure 5.10. a) detail between S.A.P and concrete curb; b) cross section of S.A.P. (www.leca.it) ... 134 Figure 5.11. View of the wooden trusses ... 134 Figure 5.12. Identification of the main structural system ... 136 Figure 5.13. Analysed building: drawing of the equivalent frame .... 137 Figure 5.14. SAP modelling: equivalent frame ... 138 Figure 5.15. Equivalent Frame Model of the building ... 139 Figure 5.16. Modelling building: plastic higes’ location in the
equivalent frame model of the wall façade. ... 142 Figure 5.17. Principal mode shapes ... 143 Figure 5.18. PCB models: capacitive accelerometer ... 145 Figure 5.19. Coaxial cable for the piezoelectric accelerometers with
MIL-C-5015 BNC connection (www.pcb.com ... 146 Figure 5.20. The cables system ... 146 Figure 5.21. Modular chassis and modules for the acquisition system.
... 147 Figure 5.22. a) View of the installed sensors; b) detail of the sensor
with the plate ... 148 Figure 5.23. Experimental monitoring: a) plan view of the localization
XII Daniele Brigante
Figure 5.24. The Assign DOF Information Task displaying all sensors of the three test setups. The purple arrows are the
reference sensors. ... 151 Figure 5.25. Stabilization diagram for SSI techniques from ARTeMIS
... 152 Figure 5.26. Mode shapes of experimental data ... 152 Figure 5.27. The complexity plots for the corresponding mode shapes
... 153 Figure 5.28. Results: a) The shape mode; b) MAC matrix associated
with torsional mode; c) Location of the verticals ... 156 Figure 5.29. Results: a) The shape mode; b) MAC matrix associated
with torsional mode; c) Location of the verticals ... 157 Figure 6.1. a) Mortar Cylinder compression test for Elastic modulus; b)
flexural strength test of prism specimen; c) compressive test of prism specimen ... 163 Figure 6.2. Arch geometry ... 164 Figure 6.3. Arch model phases in the construction of masonry arches
... 165 Figure 6.4. Arch 3D model : Tensile (a) and compressive behaviour (b)
... 167 Figure 6.5. The CHX60 solid element ... 169 Figure 6.6. Arch 3D: view of the mesh type and the boundary
conditions ... 169 Figure 6.7. a) Numerical modal results - mode shape and frequency
Vibration based methods for the structural assessment of historical
structures XIII
Figure 6.8. b) Numerical modal results - mode shape and frequency values ... 172 Figure 6.9. Edit boundary conditions ... 173 Figure 6.10. Numerical crack sequence prediction... 175 Figure 6.11. Prediction model analysis: (a)View of the control points;
(b) displacement control of the arch ... 176 Figure 6.12. a) View of the actuator pre-test; b) rolls system design . 177 Figure 6.13. Actuator test: a) View of LVDT controller; b) result of
displacement test ... 178 Figure 6.14. Arch test: a) view of the test apparatus; b) vertical LVDT
... 179 Figure 6.15. a) View of the LVDTs location during the static tests; b)
results for the arch displacement control ... 180 Figure 6.16. Arch damage: a) view of crack location; (b) crack C1; c)
crack C2; d) crack C3 ... 181 Figure 6.17. BeanDevice® AX-3D XRange wireless vibrations sensor
... 184 Figure 6.18. Sensors location: a) top view of the strain gauge systems;
b) view from below of the strain gauge systems; c) strain gauges surface base across 3 bricks; d) disposition of the accelerometers ... 184 Figure 6.19. Location of the measuring points for the dynamic tests: (a)
front view; (b) top view. Ai indicates accelerometers and Si indicates strain gauges. ... 185 Figure 6.20. Dynamic test sequence, with the different setups ... 189
XIV Daniele Brigante
Figure 6.21. Data collection: a) ambient excitation; b) random impact excitation ... 190 Figure 6.22. a) Reference scenario: diagram of estimated state space
model with ambient excitation input ( FDD method) .... 192 Figure 6.23. b) Reference scenario: diagram of estimated state space
model with ambient excitation input (SSI-PC method) . 193 Figure 6.24. a) Reference scenario: diagram of estimated state space
model with random excitation input (FDD method) ... 194 Figure 6.25. b) Reference scenario: diagram of estimated state space
model with random excitation input (SSI-PC method) .. 195 Figure 6.26. Mode shapes configuration for the reference scenario... 200 Figure 6.27. Spectral value decomposition for the random impact
excitation ... 201 Figure 6.28. Relative frequency values for the identified modes
obtained from the dynamic test ... 202 Figure 6.29. Damage analysis results (RS -DSI) for acceleration
responses by BB index (light grey bars) and NB index (dark grey bars)... 204 Figure 6.30. Damage analysis results (RS -DSVII) for acceleration
responses by BB index (light grey bars) and NB index (dark grey bars)... 205
Vibration based methods for the structural assessment of historical
structures XV
INDEX
OF
TABLES
Table 2.1. Experimental values ... 43 Table 4.1. Matrix of the numerical simulation ... 79 Table 4.2. Single cell: numerical simulation of virtual sensors ... 82 Table 4.3. Modal analysis results: modal shape definition codes:
T-X=Translational along X axis; T-Z=Translational along Z; R-Y=Rotational in Y axis. ... 84 Table 4.4. Double cell: numerical simulation of virtual sensors ... 100 Table 4.5. Summary of the results : Modal shape definition codes:
T-X=Translational along X axis; T-Z=Translational along Z; R-Y=Rotational in Y axis. ... 103 Table 4.6 L-Shape aggregate: numerical simulation of virtual sensors
... 109 Table 4.7. Results : Modal shape definition codes: T-X=Translational
along X axis; T-Z=Translational along Z; R-Y=Rotational in Y axis... 110 Table 5.1. Reference value for the masonry mechanical parameters . 140
XVI Daniele Brigante
Table 5.2. Reference value for the concrete and steel mechanical parameters ... 141 Table 5.3. Results OMA: natural frequencies (f), damping (ξ) and MAC ... 153 Table 5.4. Comparison between numerical and experimental values of
the natural frequency of the fundamental modes of the building ... 155 Table 6.1. Mechanical properties of the masonry arch model ... 166 Table 6.2. Test setups for accelerometers, n indicate normal direction
and t tangential direction ... 187 Table 6.3. Global scenario: FDD results from the ambient excitation
test. ... 196 Table 6.4. Global scenario: FDD results from the ambient excitation
test. ... 196 Table 6.5. Global scenario: dumping results for the ambient excitation
test ... 197 Table 6.6. MAC values results ... 197 Table 6.7. Global scenario: FDD results from the random impact test
... 198 Table 6.8. Global scenario: SSI-PC results from the random impact test
... 198 Table 6.9. Global scenario: dumping results for the random excitation
test ... 199 Table 6.10. MAC values results ... 199
Vibration based methods for the structural assessment of historical structures 1
Chapter 1
I
NTRODUCTION
Protection of cultural and architectural heritage represents an interdisciplinary challenge due to the coexistence of historical, artistic and structural issues (Marra 2015). Aging of materials and components due to either time or environmental effects represents one of the problems to be tackled in preserving cultural heritage. This is quite visible in many European Countries, including Italy, where many modern cities grew around historical centres thus the historical centres are being affected by continuous and irregular evolution over time, so that the present structural condition is very complex due to the effect of extensive interactions.
On the other hand, the destructive effects of recent earthquakes - Emilia, 2012; Gorkha, Nepal, 2015; Central Italy, 2016-17 - confirmed the need of developing effective and reliable procedures for performance assessment of historical structures in seismic areas (EN1998-3 2005). The activity of the Italian Authorities showed a strong effort in this field with the release of a comprehensive program
2 Daniele Brigante
aimed at assessing the seismic vulnerability of critical buildings and infrastructures including historical and architectural assets. Such programme is also integrated with a continuous development of national seismic code provisions. With the help of an interdisciplinary effort focused on the application of the seismic performance assessment procedures to cultural and architectural heritage, standard results can be obtained in compliance with the conservation principles (The Charter of Krakow 2000) In addition, the probabilistic approach of seismic safety management of structures is becoming very popular in the scientific and technical community, due to the enhancement of analysis techniques and the increment in the computational capabilities of non-linear analysis software programmes.
However, numerical analyses are often very complex due to significant uncertainties in the characterization of material properties and structural behaviour. Besides this, the reliability of seismic analyses is often jeopardized by the need of definition of an appropriate structural and dynamic model. The unique structural configurations, the old construction techniques and the presence of stratified structural modifications that took place over the centuries make the definition of an appropriate and reliable numerical model very challenging. The possibility of applying the dynamic procedures for the seismic assessment can represent a valid tool in understanding the seismic behaviour of the existing historical constructions.
Vibration based methods for the structural assessment of historical structures 3
1.1 B
ACKGROUND OF THE SEISMIC VULNERABILITY FOR THE ARCHITECTURAL HERITAGEMasonry buildings are the most common structural typology in the Italian historical centres. They are often the result of continuous urban development in a particular areas yielding large structural aggregates (Formisano et al. 2015). Due to the progressive transformation of the urban centres, distinguishing the structurally independent units and identifying the global response of the building as a whole are often very difficult tasks. In fact, distribution of seismic actions strongly depends on the dynamic properties of the architectural complex and its geometrical and mechanical configurations (Elnashai and Di Sarno 2015). Thus, seismic vulnerability assessment of masonry aggregates in the Italian historical centres represents a challenging problem due to the difficulties in reliably predicting their behaviour under earthquake loadings and defining appropriate seismic protection measures in the presence of structural weakness.
The problem of the characterization of the reference unit/component for the evaluation of seismic performance of masonry buildings is fully within the approach of the regulatory framework, not only in the case of historic constructions but also in the case of the traditional masonry building stocks in many historical sites in the big cities, towns and villages in Italy. It is obvious that historical buildings are integral part of the built environment and thus deserve to be preserved (Lagomarsino and Cattari 2015).
4 Daniele Brigante
The urban texture of historical city centers, in terms of their construction, reveals considerable differences in terms of geographical, cultural and technical backgrounds. The differences result in buildings with typical local characteristics and authenticity that justify conservation of heritage structures.
Apart from this, the high vulnerability of historic masonry buildings to seismic actions needs to be considered, mainly due to the lack of proper connections between the various structural elements (masonry walls, wooden beams in the floors and wooden beams on the roof). These conditions often lead to overturning collapse of the perimeter walls under seismic excitation. Simplified limit state analysis methods are often used for safety analysis and design of strengthening interventions (Direttiva 2011).
The preservation of the cultural heritage in seismic areas, therefore, requires a strategic plan and a suitable methodology that includes a rational approach of multidisciplinary knowledge.
The issue of seismic vulnerability assessment of existing masonry building takes on particular characteristics due to the difficulties in reliably forecasting their behaviour in the seismic field or provide suitable seismic prevention measures in the presence of structural weakness. To this end, the seismic assessment involves over the historical structures also the traditional masonry buildings present in many historical centers of the big cities or the numerous villages. Also, the architectural and cultural heritage can be viewed as strong social
Vibration based methods for the structural assessment of historical structures 5
and economic contributions for the cities and countries by providing an attraction.
Recent Italian guidelines (CNR DT 212. 2012), in agreement with the seismic design code (NTC 2018), suggests the adoption of a probabilistic approach for seismic safety management of structures due to the enhancement of analysis techniques and advancement in computational capabilities of non-linear software programmes. Numerical analysis is a complex task, because of several uncertainties associated with the mechanical properties of materials, structural scheme and structural details. This is a very relevant difference between modern constructions and existing masonry buildings. So, relevant codes at national and international level recommend the assessment of local as well as global mechanisms whenever existing constructions are concerned. The implementation of policies to seismic prevention, whose aim is safeguarding the protected artistic assets, requires knowledge, on a different scale, of the risk which existing artefacts are subjected for the seismic safety assessment and design of the interventions of cultural heritage is therefore necessary to reach an adequate knowledge of the structure, in order to identify the characteristics of the elements that determine the structural behaviour. It can be obtained with different levels of details, according to criteria based on the accuracy of the reliefs and historical investigations, in recognition of the use of rules of art, identification of the level and type of damage, ability to reconstruction of the history of the building in relation to seismic events, results of experimental investigations, of
6 Daniele Brigante
assess the impact of any evidence including weak earthquakes, in the preservation of the building.
The acquisition of a sufficient level of security and protection with respect to seismic risk is guaranteed, for architectural artefacts of historical and artistic interest, considering three limit states: The Limit State of Protection of Life (LPS), in the case of rare and strong intensity earthquakes, and for the Damage Limit State (DLS) for earthquakes less intense but more frequent. In the case in which the artefact analysed has some characteristics in parts of it or localized in defined areas of the same environment such that a reference earthquake with intensity and frequency can cause damage to parts or elements that entail an irretrievable loss to the cultural heritage, it is necessary to define a new specific limit state called Artistic Limit State (ALS). The analysis to the Artistic Limit State is done exclusively at the local level, in the parts of the building that are characterized by elements whose loss would result in irreparable damage to cultural heritage which is, not recoverable with the procedures and methods of conservation. A significant attention has been aimed at investigating the seismic behaviour of buildings and historical and monumental complex and about methods of restoration, to establish criteria and methods to operate interventions that are respectful of cultural values and at the same time rational and efficient.
Vibration based methods for the structural assessment of historical structures 7
1.2 M
OTIVATION FOR THE RELIABLE PROCEDURES FOR PERFORMANCE ASSESSMENT OF HISTORICAL STRUCTURES IN SEISMIC AREASHeritage Constructions (HC) are exposed to natural and anthropogenic hazards and need a careful consideration from the technical point of view whenever their preservation and protection are concerned. The task is very complex for all the competences involved in the process and above all for structural engineers who must deal with the safety of structure and users.
The high seismic risk and the large number of historical buildings and distributed over the territory make Italy a unique laboratory for the development and testing of innovative procedures for seismic vulnerability assessment of the cultural heritage. Many studies on protection forma seismic risk of cultural heritage have been produced in recent years.
More attention has been expected at investigating the seismic behaviour of artefacts and architectural complexes and methods of restoration, to establish criteria and methods to operate interventions with respect to cultural values and at the same time rational and efficient.
The damage scenarios related to masonry buildings, show that the earthquake does not affect the entire complex severely in total, but the damage would be concentrated to some structural parts and the weakest technological solutions, activating mechanisms that are easily
8 Daniele Brigante
identifiable and catalogable in many cases. To overcome this problem, an approach based on the concept of the macroelements has been proposed a few years ago and since then repeatedly used to recognize the collapse mechanisms in the different macroelements.
Figure 1.1. Collapse mechanisms
The Architectural heritage are particularly vulnerable to dynamic actions, with a special focus on seismic action. Owing to the age as well as environmental factors, many cultural heritage buildings, as well as structures planned and constructed in the past, are vulnerable to dynamic loads, which may unpredictably induce a collapse of a portion or lead the whole structure to a rapid failure.
The absence of adequate connections between the various parts, irregularities in plan and elevation and presence of flexible floors increase the vulnerability of historical masonry buildings to seismic
Vibration based methods for the structural assessment of historical structures 9
actions. The systematic documentation of damage identifies two categories of architectural complexes: The first includes all those structures historically affected by interventions that have led to the presence of significant percentages of stiff floors connected to the masonry. For this class of buildings, the participating mass ratios associated with the fundamental modes are appreciable and thus application of non-linear static analysis methods can be expected easily. The second category consists of structures characterized by very small values of participating mass ratios, suggesting the existence of local vibration modes. In the former case, a global “box-like” behaviour can be observed; whereas in the latter, subdivision of the building into subassemblies of relevant structural elements (macro-elements) that can be extracted and analysed separately from the rest of the complex, and analysis of local mechanisms according to the kinematic approach are recommended. In the literature, there are some approaches employed to analyse the seismic behaviour of masonry building. Accurate simulation of the structure subjected to seismic action should be in principle carried out by means of Non-Linear Dynamic Analysis (NLDA). This means that an exhaustive knowledge of the cyclic response of materials and structural components exists and it can be integrated in the non-linear constitutive laws implemented in dedicated software programs. It is easy to recognize that a similar approach can be unsuitable for general applications, not only due to the high level of complexity of the procedure, but also due
10 Daniele Brigante
to the need of field investigations aimed at assessing the actual properties of materials and components.
This is the reason why, simplified methodologies of structural analyses have been defined during time. They are based on the application of a distribution of quasi-static forces, which depends on the dynamics of the structure. The structural analysis is carried out in the elastic field (Elastic Static Analysis, ESA). For this reason, it can be reasonably applied to the design of new structures, but it shows some drawbacks and limitations in the analysis of the existing ones.
Another analysis option is the Response Spectrum Analysis (RSA) that, starting from a de-tailed knowledge of the dynamics of the structure, this combines the different contributions of the most relevant modes of vibration to the demand parameters (displacements, forces). The seismic performance assessment is again carried out under the assumptions of elastic response of materials and components and reduced spectral intensities of the seismic action, consider the structural energy dissipation.
In recent years, non-linear static analyses - Push-Over Analyses, POA – have become very popular because of the moderate computational efforts and the possibility to track inelastic phenomena associated to the energy dissipation of the structure. On the analogy with ESA, POA are strictly related to the distribution of inertial forces acting on the structure during the loading process, so that the drawbacks and limitations of the approach are similar to those of the ESA. In particular, both ESA and POA are based on the existence of modes that
Vibration based methods for the structural assessment of historical structures 11
dominate the dynamics of the structure, so that the response of the structure under the seismic action basically depends on the same modes.
This is the reason why limitations in terms of participating mass of the fundamental modes are defined for both ESA and POA, and a target cumulative mass participation factor (0.85) is prescribed to modal analysis-based RSA.
The participating mass ratio is a measure of the amount of the total mass participating in the mode of interest: a mode characterized by a large effective mass can be addressed as a significant contributor to the total structural response. It is therefore clear that the dynamics of the structure under consideration for seismic performance assessment, and the nature and characteristics of the local and global constitutive relationships dictate the complexity of the seismic calculations: the more regular the structure from the dynamic standpoint, the simpler the structural analysis would be.
The above concepts are clearly reflected in the seismic codes aimed at providing rules for design and assessment of structures depending on the selected structural system and the associated material for construction. Use of traditional construction materials such as masonry and wood are common in cultural heritage structures, whose structural response also depends on construction techniques.
In addition, fundamental mode shapes do not necessarily characterize the dynamics of the whole structure, so that local mechanisms, for instance out-of-plane overturning of walls, represent the key features
12 Daniele Brigante
of the structure subjected to seismic actions. The coexistence of local and global mechanisms and their interaction represents one of the most relevant issues in the seismic structural analysis of historical structures.
A general approach to seismic safety assessment should analyse the building within the complex, but this approach requires extensive analyses of the entire architectural complex. As a consequence, an appropriate structural modelling (spatial scale, structural scheme and type of analysis) should start by classifying the investigated building: 1. Structures which tend to an isolated building behaviour; 2. Structures that have a global configuration behaviour; 3. Structures characterized by a complex interaction among the buildings.
In other words, the complex dynamics of historical structures, that depends on many components, in principle can be analysed by dividing the structure in the so-called macro-elements (the basic element of the local analyses) or in structural units, i.e. buildings or assemblage of horizontal and vertical structures that can be extracted and separately analysed from rest of the complex without any loss of significance of the seismic analyses.
The concept is not completely new, since it is a traditional problem in other engineering fields like the mechanical one (De Klerk et al 2008). The most relevant problem in selecting the macro-elements is the lack of operational recommendations in seismic codes, so that sub-assembling is sometimes avoided.
Vibration based methods for the structural assessment of historical structures 13
When macro-elements are considered, their identification is usually based on the engineering judgment of the operator without the support of rational tools of analysis
In any case it is easy to recognize the fundamental role of modal analysis, which cannot be disregarded in relation to its complexity. Modern instruments and software packages for the architectural and structural representation are effective options for the analyst, so that detailed modal analyses can be carried out. An effective support to the analysis of historical structures comes from Operational Modal Analysis – OMA – (Rainieri e Fabbrocino 2014) and model updating techniques (Friswell & Mottershead 1995), which have been proved to be valuable tools for indirect non-invasive structural assessment (Rainieri et al 2014, Conte et al 2011). However, an extensive experimental analysis of large architectural complexes is definitely expensive and sometimes infeasible. Nevertheless, some tools traditionally used in the context of experimental modal analysis can be profitably used also to compare the results of purely numerical analyses and check the effectiveness of sub-structuring.
In addition, monuments significantly contribute to the economy of cities and countries by providing key attractions. In this context, structural damage identification at an early stage plays an important role for developing effective and reliable procedures for performance assessment of historical structures in seismic areas (L F Ramos et al., 2010). Damage on masonry structures mainly relates to cracks, foundation settlements, material degradation and displacements.
14 Daniele Brigante
When cracks occur, they are generally localized, splitting the structures in macroblocks. Dynamic based methods to assess the damage are an attractive tool to this type of structures because they are non-destructive methods and are able to capture the global structural behaviour. Moreover, being motivated by the above reasons, this work aims at exploring damage in masonry structures at an early stage by vibration measurements.
1.3 O
UTLINE OF THET
HESISThe thesis is organized in seven chapters as follows:
− Chapter 1 is the introduction to the work, with the motivation, the motivation, the background, the focus of the thesis, as well as the outline of the thesis;
− Chapter 2 addresses the state of the art on system identification based on vibration measurements. Secondly presents some remarks on the dynamics of heritage structures. Finally, an overview of experimental substructuring methods is presented;
− Chapter 3 reviews the main analysis procedures about dynamic based damage identification techniques. The principal algorithm-based methods developed hitherto are described;
Vibration based methods for the structural assessment of historical structures 15
− Chapter 4 presents the numerical study on a well-established vector correlation index frequently used in the field of experimental modal analysis;
− Chapter 5 performs the validation of the Modal Assurance Criteria (MAC) procedure identification carried out in the context of an isolated masonry building.
− Chapter 6 describes the experimental campaign carried out on the masonry arch replica. The arch model was built in the laboratory where a controlled damage not recoverable (support movement) was applied. The dynamic response of the system was processed based on the spectral output. Issues addressed are the preliminary numerical model simulations for static and dynamic behaviour of the arch, the description of the static tests series, including the observed damage pattern, the system identification tests on each scenario;
− Chapter 7 summarizes the main conclusion from each chapter and a proposal for future works.
Vibration based methods for the structural assessment of historical structures 17
Chapter 2
V
IBRATION BASED OF DYNAMIC
IDENTIFICATION
:
BACKGROUND
AND OPEN ISSUES
2.1 I
NTRODUCTIONThe present chapter is dedicated to description of fundamental theoretical of the system identification based on vibration signatures. Basic notions to approach the topics analysed in the below of the thesis was provides. The chapter deals briefly with the differences between the classical experimental modal analysis approach such as conducted in the MST – and the OMA approach. This chapter introduces the theory of two major methods used in OMA: Frequency Domain Decomposition (FDD) and Stochastic Subspace Identification (SSI). Issues addressed include sensors selection, data acquisition systems and test planning.
and open issues
18 Daniele Brigante
2.2 B
ASICS OF DYNAMICA preliminary, review about the signals and systems would be definitely useful in the field of experimental dynamics.
The theory notions about signals, systems and structural dynamics and indirectly defines the required cultural background with respect to the Operational Modal Analysis (OMA).
A signal is any physical quantity varying with respect to one or more independent variables and associated to information of interest. A system converts an input signal into an output signal (Rainieri & Fabbrocino, 2014).
The evaluation of the structural conditions to a given stimulus detects important information about the system. For instance, the analysis under wind load (input signal) and the swinging of a building (output signal) makes possible the identification of dynamic parameters of the structures investigated.
Nevertheless, attention is herein focused on inverse approaches; where the output is known but either the input or the system characteristics are unknown. The attention is focused around the identification of the characteristics of the system when the output signal is known and some assumptions for the input are considered.
The term noise refers to any undesired signal superimposed on the signal of interest. Thus, suitable data acquisition strategies must be adopted to reduce the level of noise that necessarily affects measurements.
Vibration based methods for the structural assessment of historical structures 19
Figure 2.1. System scheme for the Experimental Modal Analysis approach (Benjamin Greiner, 2009)
2.2.1 Theory and classical formulation
Structural dynamics theory outlines that an undamped structure with multiple degrees of freedom owns simple harmonic motion without changing the deflected shape, if free vibration is initiated under particular conditions (Chopra, 2001).
Figure 2.2. Free vibration of an undamped system (Chopra, 2001): (a) system; (b) and (c) different representations of the first natural vibration mode
and open issues
20 Daniele Brigante
Whenever the initial static equilibrium position changes- whether by applying external dynamic forces or by imparting some initial displacement -, the structural system starts vibrating with a certain frequency until the mechanisms controlled by the damping and other sources of energy dissipation gradually reduce the amplitude of the motion and cause its decline (Figure 2.2).
Thus, the dynamic response of a structure can be described by three main characteristics of dynamic systems: mode shape, frequency and damping ratio that define the modal properties of the system. However, the main property of a dynamic system from a mechanical and physical point of view are mass and stiffness. Considering the direct interdependence between dynamic and physical properties makes modal-based methods suitable tools for detecting the structural. The important role played by this relationship will be extensively discussed in Chapter 3.
The mathematical methods used to characterize the dynamic behaviour of the systems are: The Classical Formulation, the Steady-State Formulation and Auto-Regressive Models. The attention is focused on the Classical formulation. Main difference between the dynamic and the static analysis is the time dependency of the dynamic approach. In fact, the response of the structure in terms of displacements, velocities, accelerations or internal forces is connected to the accelerations that take place due to inertia forces. The observed free vibration response of a Single-Degree-of-Freedom (SDOF) system
Vibration based methods for the structural assessment of historical structures 21
under a set of initial conditions is an example of deterministic data, since it is governed by an explicit mathematical expression depending on the mass and stiffness properties of the system:
𝑚𝑞̈(𝑡) + 𝑐𝑞̇(𝑡) + 𝑘𝑒𝑞(𝑡) = 𝑝(𝑡) (2.1)
where m is mass of the system, c is the damping constant, ke is the
system stiffness and p(t) is the load vector, which is also time dependant. Here, the time derivates 𝑞̈(𝑡) and 𝑞̇(𝑡) represent the acceleration and the velocity of the system respectively. When an arbitrary force is acting in the system, the solution of this second order differential equation can be obtained by the Duhamel’s integral, valid for linear systems (Chopra, 2001).
Another possibility is to achieve the solution of linear differential equation in the frequency domain, by applying the Fourier transform to the functions on both sides of (2.2). The Fourier transform X(ω) of a function x(t) is given by:
𝑋(ω) = ∫ 𝑥(𝑡)𝑒−ωt𝑑𝑡 +∞
−∞
(2.2)
where j is the imaginary number ( j2 = −1). As the time derivate of the
frequency transform functions are given by the product j ω in the frequency domain, Eq.(2.1) can be rewritten as:
and open issues
22 Daniele Brigante
−𝑚ω2𝑄(ω) + 𝑐𝑗ωQ(ω) + 𝑘
𝑒𝑄(ω) = 𝑃(ω) (2.3)
where, P(ω) and Q(ω) represent the Fourier transforms of the excitation p(t) and the response q(t) respectively.
Solving the Eq. (2.3) with respect to Q(ω), it can be concluded that the response Fourier transform function directly depends on the excitation and on a complex function H(ω) equal to:
𝐻(ω) =𝑄(ω) 𝑃(ω)
(2.4)
Finally, the desired solution q(t) is given by the inverse Fourier transform of Q(ω), given by:
For a system with n degrees of freedom, the equations of motion are traditionally expressed in time domain, and for general MDOF system, the following set of linear, second order differential equations expressed in matrix form are provided
[𝑀]{𝑞̈(𝑡)} + [𝐶]{𝑞̇(𝑡)} + [𝐾]{𝑞(𝑡)} = {𝑝(𝑡)} (2.6)
Where {𝑞̈(𝑡)} is the vector of acceleration; {𝑞̇(𝑡)} is the vector of the velocity and {𝑞(𝑡)} the displacement vector. [𝑀], [𝐶]𝑎𝑛𝑑[𝐾] define the
𝑞(t) = 1 2𝜋∫ 𝐻(ω) 𝑃(ω) 𝑒 jωt𝑑ω +∞ −∞ (2.5)
Vibration based methods for the structural assessment of historical structures 23
mass, damping and stiffness matrices, respectively; {𝑝(𝑡)} is the generalized force vector. As a result, the complete solution is obtained by superposition of eigensolutions.
This is a standard formulation of the dynamic problem reported in several structural dynamics and modal analysis books (e.g. Chopra 2001, Ewins 2000, Heylen et al 1998). The matrix differential equation of Equation 4.4 becomes a set of linear algebraic equations by applying the Fourier transform:
(−𝜔2[𝑀] + 𝑐𝑗𝜔[𝐶] + [𝐾]){𝑄(𝜔)} = {𝑃(𝜔)} (2.7)
where {𝑄(𝜔)} and {𝑃(𝜔)} are the Fourier transforms of {𝑞(𝑡)} and {𝑝(𝑡)}, respectively; j is the imaginary unit. A linear time-invariant system can be, therefore, represented through its FRF, which is given by the ratio between the Fourier transforms of the output and the input. Finally, the total response of the MDOF system in the original geometric coordinates is obtained by the superposition of all the n = (1, 2, …, N) modal contributions (Figure 2.3).
and open issues
24 Daniele Brigante
Figure 2.3. Total response as superposition of modal components (Clough & Penzien, 1993)
2.3 M
ETHODS FOR OPERATIONAL MODAL ANALYSIS(
OMA)
The Operational Modal Analysis (OMA) defines the class of modal identification methods based on response measurements only.
The excitation is either transient (impact hammer testing), random, burst-random or sinusoidal (shaker testing). The advanced signal processing tools used in operational modal analysis techniques allow the inherent properties of a mechanical structure (resonance frequencies, damping ratios, mode patterns) to be determined by only measuring the response of the structure without using an artificial excitation. This technique has been successfully used in civil engineering structures (buildings, bridges, platforms, towers) where the natural excitation of the wind is used to extract modal parameters. This discipline has been systematized in the last two decades but early applications can be traced back to the beginning of modal testing in the Sixties (Rainieri, Fabbrocino, & Cosenza, 2007).
Vibration based methods for the structural assessment of historical structures 25
The first applications of OMA were mainly based on the analysis of PSDs and the identification of Operational Deflection Shapes (ODSs). An ODS represents the deflection of a structure at a particular frequency under a generic input and it is usually the result of the contribution of different modes. In early 1990s different number of methods working in time domain were developed as the Natural Excitation Techniques (NExT) and applied in combination with correlation functions, leading to the so-called output-only modal testing. Furthermore, at the end of the Nineties new effective output-only modal identification techniques, such as the Frequency Domain Decomposition (FDD) and the Stochastic Subspace Identification (SSI), became available, overcoming the limitations of the previous techniques in dealing with closely spaced modes and noise. OMA is based on the following assumptions:
− Linearity: the systems response given by the combination of inputs is equal to the same combination of the corresponding outputs;
− Stationarity: the dynamic characteristics of the structure do not change over time; thus, the factors of the differential equations governing the dynamic response of the structure are independent of time;
− Observability: the sensor layout has been defined to see the modes of interest.
and open issues
26 Daniele Brigante
The OMA methods can be classified depending on the advantages and limitations related to specific assumptions and data processing procedures. Each criterion points out a specific aspect common to different analysis methods and it is helpful to guide the user towards the choice of the favourite or most appropriate analysis method. The attention is focused on the domain of implementation. In fact, the OMA methods based on the analysis of response time histories or correlation functions are referred to as time domain methods, while the methods based on spectral density functions are referred to as frequency domain methods. The PSD function of the excitation is considered constant.
2.3.1 Frequency Domain Decomposition method
The basic method for output-only modal parameter identification is the Basic Frequency Domain (BFD) method, also known as the Peak-Picking method. The name of the method is given so due to the fact that the modes are identified by picking the peaks in the Power Spectral Density (PSD) plots.
The FDD method, presented by Brincker et al. (2000), can be visualized as an extension of the PP method, which assumes that resonant frequencies are well spaced in frequency and the contribution of other modes in the vicinity of that resonant frequency is null. This method was originally applied to FRFs and known as Complex Mode Indicator Function (CMIF) to point out its ability to detect multiple roots and,
Vibration based methods for the structural assessment of historical structures 27
therefore, the possibility to count the number of dominant modes at a certain frequency (Shih et al. 1988). A theoretical formulation of the method is based on the modal expansion of the structural response:
{𝑞(𝑡)} = [Φ]{𝑃(𝑡)} (2.8)
where [Φ]is the modal matrix and {𝑃(𝑡)} the vector of modal coordinates. From Eq. (2.8) the correlation matrix of the responses can be computed:
[𝑅𝑞𝑞(𝜏)] = 𝐸[{𝑞(𝑡 + 𝜏)}{𝑞(𝑡)}𝑇] = [Φ][𝑅𝑝𝑝(𝜏)][Φ]𝑇 (2.9)
The PSD matrix can be obtained from Equation (2.9) by taking the Fourier transform:
[𝐺𝑞𝑞(𝜔)] = [Φ][𝐺𝑝𝑝(𝜔)][Φ]𝐻
(2.10)
The PSD matrix of the modal coordinates is diagonal if they are uncorrelated. The superscript H denotes the conjugate transpose and the following relation can be established for the matrix Φ.
Considering that the SVD of the PSD matrix at a certain frequency ω leads to the following factorization:
[𝐺𝑞𝑞(𝜔)] = [U][∑][V]𝐻 (2.11)
Where [U] and [V] are the unitary matrices holding the left and right singular vectors and [∑] is the matrix of singular values for a
and open issues
28 Daniele Brigante
Hermitian and positive definite matrix, such as the PSD matrix, it follows that [U] = [V] and the decomposition of Equation (2.11) can be rewritten as:
[𝐺𝑞𝑞(𝜔)] = [U][∑][U]𝐻 (2.12)
The comparison between Equation (2.10) and Equation (2.12) suggests that it is possible to identify a one-to-one relationship between singular vectors and mode shapes; moreover, the singular values are related to the modal responses and they can be used to define the spectra of equivalent SDOF systems characterized by the same modal parameters as the modes contributing to the response of the MDOF system under investigation. Assuming that only one mode is dominant at the frequency ω, and that the selected frequency is associated to the peak of resonance of the kth mode, the PSD matrix approximates to a rank
one matrix with only one term on the right side of Eq. (2.10):
[𝐺𝑞𝑞(𝜔)] = {𝑢1}{𝑢1}𝐻, 𝜔 → 𝜔𝑘 (2.13)
In this contest, the first singular vector {𝑢1} represents an estimate of
the mode shape of the kth mode and the corresponding singular value
σ1 belongs to the auto PSD function of the equivalent SDOF system
corresponding to the mode of interest. The FDD method was improved by Brincker et al. (2001) with the Enhanced FDD (EFDD) method. Basically, the first step of the EFDD is equal to the FDD
Vibration based methods for the structural assessment of historical structures 29
method but the estimation of frequency values and damping coefficients are calculated by the application of inverse FFT of each spectral density function for each mode shape.
The comparison of the mode shape estimates {𝜙̂ peak with the 𝑘}
singular vectors associated to the frequency lines around the peak leads to the identification of the singular values whose singular vectors show a correlation with {𝜙̂ higher than a user-defined threshold. 𝑘}
The Modal Assurance Criterion (MAC) is used as a measure of the correlation between two modal vectors. ( Allemang and Brown 1982). Details are shown in the following section.
2.3.2 Stochastic Subspace Identification Method
The time domain methods and, in particular, the Stochastic Subspace Identification (SSI) method (Figure 2.4) deals directly with time series processing (DD-SSI), driven stochastic subspace identification).
The Data-Driven Stochastic Subspace Identification (DD-SSI) method allows the estimation of the states directly from the experimental data by applying robust numerical techniques, such as SVD and QR decomposition (Rainieri & Fabbrocino, 2014).
On the other hand, the implementation is not as friendly as the FDD method, and more processing time is needed during parameter estimation. The mathematical model has parameters that can be adjusted to minimise the deviation between the predicted system response and the measured system response.
and open issues
30 Daniele Brigante
Figure 2.4. Stochastic Subspace Identification method: (a) model calibration; (b) model parameter estimation dilemma; and (c) data driven with the poles
selection through the several test setups (Ramos 2007)
The main objective of the SSI method is the identification of the state matrix A and the output matrix C, see Eq.(2.38), which contain the information about the resonant frequencies, mode shapes vectors and damping coefficients.
𝑋𝑘+1= 𝐴𝑥𝑘+ 𝑤𝑘
𝑦𝑘 = 𝐶𝑥𝑘+ 𝑣𝑘
(2.14)
where wk is defined as the process noise resulted from input
perturbations and modelling inaccuracy and vk is measured noise due
to transducers and data acquisition disturbances. For further reading about State-Space Formulation, the reader is referred to Peeters (2000). The DD-SSI method as well as the FDD method are implemented, in the software ARTeMIS (SVS, 2018) that has been used in the applications described below.
Vibration based methods for the structural assessment of historical structures 31
2.4 SOME
REMARKS
ON
THE
DYNAMICS
OF
HERITAGE
STRUCTURES
The experimental modal analysis is more importance as a valuable tool for the execution of accurate structural analysis, and to obtain useful information in the assessment of the structural behaviour of existing buildings. In this context, the purpose of the monitoring does not consist only the identification of sudden or progressive damages, but also evaluating their performance under operational conditions or during some particular environmental conditions such as earthquakes. The use of dynamic identification techniques and monitoring systems is increasingly common tools in the structural analysis. The indirect and non-destructive assessment is suitable for historical buildings and monuments; in line with the principles of conservation and protection of the architectural heritage and to identify the dynamic response of the structure (fundamental natural frequencies, mode shapes and damping coefficients). The experimental identification tests combined with the numerical investigations can be considered as effective tools for the knowledge path of the historical buildings. In this framework, the objective of the dynamic tests in operational conditions is the reduction of the modelling uncertainties, in terms of the mechanical properties and which supports the setting of a reliable numerical model. In the case of historical structures, more attention on the opportunities provided by Operational Modal Analysis (OMA) is paid recently. OMA can be defined as the modal testing procedure that
and open issues
32 Daniele Brigante
allows the experimental estimation of the modal parameters of the structure from measurements of the ambient vibration response only. The idea behind OMA is to take benefit of the natural and freely available excitation due to operational loads and ambient forces (wind, traffic, micro-tremors, etc.) to replace the artificial excitation. In this context, OMA is very attractive because tests are cheap and fast when compared with the EMA procedures, and the benefit is that the test are easily conducted even in the operational condition of the structure. Moreover, the identified modal parameters are representative of the actual behaviour of the structure in its operational conditions as, they refer to the levels of vibrations. On the other hand, the main limit of the application is identified by a low ratio between signal and noise, thus, requires very sensitive, low-noise sensors and a high-performance measurement chain. The OMA procedures as well as the EMA allow to evaluate the structural dynamic parameter as: natural frequencies, vibration modes and damping ratios. However, the random and not measured input in OMA, does not allow to define the effective modal mass corresponding to the principal modal shapes. For this reason, the numerical models and sensitivity analyses, can support the assessment of the adequacy of a measurement chain for the specific OMA application, in terms of frequencies and mass distribution representative of the real structure.
During the last few years a large effort in the development of experimental and numerical studies on reinforced-concrete structures
![Figure 2.9. a) Graph of PMR in y [%]; b) experimental mode and frequency values of the Bell Tower](https://thumb-eu.123doks.com/thumbv2/123dokorg/4800695.49303/63.629.92.549.205.660/figure-graph-pmr-experimental-frequency-values-bell-tower.webp)