Nuclear Inst. and Methods in Physics Research, A 986 (2021) 164756
Contents lists available atScienceDirect
Nuclear Inst. and Methods in Physics Research, A
journal homepage:www.elsevier.com/locate/nimaThe Drift Chamber detector of the FOOT experiment: Performance analysis
and external calibration
Dong Yunsheng
8,23,∗, Silvestre Gianluigi
11,24, Colombi Sofia
15,16, Alexandrov Andrey
10,19,33,34,
Alpat Behcet
11, Ambrosi Giovanni
11, Argirò Stefano
28,17, Arteche Diaz Raul
30,
Barbanera Mattia
2,35, Bartosik Nazar
17, Belcari Nicola
3,2, Bellinzona Elettra
15, Biondi Silvia
5,20,
Bisogni Maria Giuseppina
3,2, Bruni Graziano
5, Carra Pietro
3,2, Cerello Piergiorgio
17,
Ciarrocchi Esther
3,2, Clozza Alberto
7, De Lellis Giovanni
10,19, Del Guerra Alberto
3,2,
De Simoni Micol
12,26, Di Crescenzo Antonia
10,19, Di Ruzza Benedetto
15, Donetti Marco
17,1,
Durante Marco
6,32, Ferrero Veronica
17, Fiandrini Emanuele
11,24, Finck Christian
14,
Fiorina Elisa
17, Fischetti Marta
12,22, Francesconi Marco
3,2, Franchini Matteo
5,20,
Franciosini Gaia
12,26, Galati Giuliana
10, Galli Luca
2, Gentile Valerio
31, Giraudo Giuseppe
17,
Hetzel Ronja
4, Iarocci Enzo
7, Ionica Maria
11, Kanxheri Keida
11, Kraan Aafke Christine
2,
Lante Valeria
1, La Tessa Chiara
15,16, Laurenza Martina
7, Lauria Adele
10,19,
Lopez Torres Ernesto
30,17, Marafini Michela
12,21, Massimi Cristian
20, Mattei Ilaria
8,
Mengarelli Alberto
5, Moggi Andrea
2, Montesi Maria Cristina
10,19, Morone Maria Cristina
13,27,
Morrocchi Matteo
2,3, Muraro Silvia
8, Narici Livio
13,27, Pastore Alessandra
29, Pastrone Nadia
17,
Patera Vincenzo
12,22, Pennazio Francesco
17, Placidi Pisana
11,25, Pullia Marco
1,
Raffaelli Fabrizio
2, Ramello Luciano
18,17, Ridolfi Riccardo
20,5, Rosso Valeria
3,2,
Sanelli Claudio
7, Sarti Alessio
12,22, Sartorelli Gabriella
5,20, Sato Osamu
9, Savazzi Simone
1,
Scavarda Lorenzo
28,17, Schiavi Angelo
12,22, Schuy Christoph
6, Scifoni Emanuele
15,
Sciubba Adalberto
7,22, Sécher Alexandre
14, Selvi Marco
5, Sitta Mario
18,17, Spighi Roberto
5,
Spiriti Eleuterio
7, Sportelli Giancarlo
3,2, Stahl Achim
4, Tomassini Sandro
7, Toppi Marco
7,22,
Traini Giacomo
12,26, Valeri Tioukov
10, Valle Serena Marta
8, Marie Vanstalle
14, Mauro Villa
5,20,
Weber Ulrich
6, Zoccoli Antonio
5,20, Battistoni Giuseppe
8, Servoli Leonello
11,
Tommasino Francesco
15,161Centro Nazionale di Adroterapia Oncologica (CNAO), Pavia, Italy 2Istituto Nazionale di Fisica Nucleare (INFN), Section of Pisa, Pisa, Italy 3University of Pisa, Department of Physics, Pisa, Italy
4RWTH Aachen University, Physics Institute III B, Aachen, Germany 5Istituto Nazionale di Fisica Nucleare (INFN), Section of Bologna, Bologna, Italy
6Biophysics Department, GSI Helmholtzzentrum für Schwerionenforschung, Darmstadt, Germany 7Istituto Nazionale di Fisica Nucleare (INFN), Laboratori Nazionali di Frascati, Frascati, Italy 8Istituto Nazionale di Fisica Nucleare (INFN), Section of Milano, Milano, Italy
9Nagoya University, Department of Physics, Nagoya, Japan
10Istituto Nazionale di Fisica Nucleare (INFN), Section of Napoli, Napoli, Italy 11Istituto Nazionale di Fisica Nucleare (INFN), Section of Perugia, Perugia, Italy 12Istituto Nazionale di Fisica Nucleare (INFN), Section of Roma 1, Rome, Italy 13University of Rome Tor Vergata, Department of Physics, Rome, Italy 14Université de Strasbourg, CNRS, IPHC UMR 7871, F-67000 Strasbourg, France
15Trento Institute for Fundamental Physics and Applications, Istituto Nazionale di Fisica Nucleare (TIFPA-INFN), Trento, Italy 16University of Trento, Department of Physics, Trento, Italy
17Istituto Nazionale di Fisica Nucleare (INFN), Section of Torino, Torino, Italy
18University of Piemonte Orientale, Department of Science and Technological Innovation, Alessandria, Italy
∗ Corresponding author at: University of Milano, Department of Physics, Milano, Italy. E-mail address: [email protected](Dong Y.).
https://doi.org/10.1016/j.nima.2020.164756
Received 16 July 2020; Received in revised form 21 September 2020; Accepted 12 October 2020 Available online 14 October 2020
A R T I C L E
I N F O
Keywords:Drift chamber
Silicon microstrip detector Nuclear physics
A B S T R A C T
The study that we present is part of the preparation work for the setup of the FOOT (FragmentatiOn Of Target) experiment whose main goal is the measurement of the double differential cross sections of fragments produced in nuclear interactions of particles with energies relevant for particle therapy. The present work is focused on the characterization of the gas-filled drift chamber detector composed of 36 sensitive cells, distributed over two perpendicular views. Each view consists of six consecutive and staggered layers with three cells per layer. We investigated the detector efficiency and we performed an external calibration of the space–time relations at the level of single cells. This information was then used to evaluate the drift chamber resolution. An external tracking system realized with microstrip silicon detectors was adopted to have a track measurement independent on the drift chamber. The characterization was performed with a proton beam at the energies of 228 and 80 MeV. The overall hit detection efficiency of the drift chamber has been found to be 0.929 ± 0.008, independent on the proton beam energy. The spatial resolution in the central part of the cell is about 150 ± 10 μ m and 300 ± 10 μ m and the corresponding detector angular resolution has been measured to be 1.62 ± 0.16 mrad and 2.1 ± 0.4 mrad for the higher and lower beam energies, respectively. In addition, the best value on the intrinsic drift chamber resolution has been evaluated to be in the range 60 − 100 μ m. In the framework of the FOOT experiment, the drift chamber will be adopted in the pre-target region, and will be exploited to measure the projectile direction and position, as well as for the identification of pre-target fragmentation events.
1. Introduction
Charged Particle Therapy (CPT) is an established therapeutic option for cancer treatment that exploits accelerated light charged ions (such as protons and carbon ions) for the irradiation of solid tumors. The main advantages of CPT with respect to the traditional X-ray therapy is the depth-dose curve typical of charged particles: the largest fraction of dose is released at the end of the particle path, in correspondence of the so-called Bragg Peak, thus allowing the concentration of the dose in the tumor volume, while sparing the surrounding healthy tissues. In addition to that, charged particles are characterized by an enhanced biological effectiveness, that can be evaluated by means of the Relative Biological Effectiveness (RBE), defined as the ratio of photon to charged particle physical dose resulting into the same biological effect. The RBE values depend on several biological and physical parameters, as well as on the particle type. In clinical practice, the RBE of protons is assumed to be 1.1, even though recent studies indicate comparably large RBE variability in several tissues [1]. Among the causes of this variability, one potential contribution originates from the dose deposited by the fragments produced by the nuclear interactions between the incident particles and the human body [2]. In CPT with protons, the fragments produced from the target nuclei have high charge, low kinetic energy and a range of the order of few micrometers [2]. Therefore, they can be associated to high RBE values and their damage is confined to a limited number of cells. Due to the experimental difficulties in the detection of such particles, there is a lack of accurate cross section data describing target fragments production, excluding the possibility to consider this effect in the current clinical treatment planning.
The FOOT (FragmentatiOn Of Target) experiment aims at measuring the double differential cross sections with respect to kinetic energy and
emission angle of fragments produced in nuclear interactions of parti-cles with energies relevant for proton therapy. In order to overcome the detection difficulties due to the few micron range of fragments, FOOT will adopt an inverse kinematic approach, studying the fragmentation of different ion beams (e.g.12C,16O, 40Ca) onto hydrogen enriched
targets, such as C2H4, as already adopted in [3,4]. Secondary fragments
will thus have boosted energy and longer range, making possible the detection. The final goal of the FOOT experiment will be the measure-ment of the fragmeasure-ments cross section with maximum uncertainty of 5% and of fragment energy spectra with an energy resolution of the order of 1–2 MeV/u, as well as the charge and isotopic identification (at the level of 3% and 5% uncertainty, respectively). The choice of the inverse kinematics approach requires the measurement of the projectile direction and position before and after the target with an angular resolution of the order of few mrad and a spatial resolution of the order of few hundreds of μm. For this reason, a Beam Monitor (BM) drift chamber detector has been adopted in the pre-target region, which will allow the determination of the Lorentz boost direction to be applied to the produced fragments. The FOOT BM detector is inherited from the FIRST experiment [5]. It has been employed in the past, adopting the space–time relations calculated using a self-calibration iterative algorithm based on the BM tracks and residuals. In order to improve the evaluation of the space–time relations and the detector performance assessment, a calibration of the space–time relations by means of an external independent tracking detector is mandatory. In this way, it is possible to overcome the difficulties related to the use of a self-calibration algorithm whose results depend on the initial space–time relation hypothesis and on the BM track reconstruction performances. Moreover, the stopping time of the iterative procedure cannot be well determined, since artifacts introduced by the algorithm itself appear
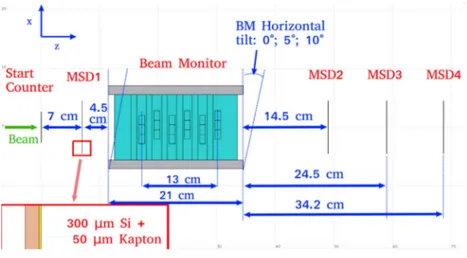
Fig. 1. Schematic view of the experimental setup used for the BM calibration experiment. The bottom-left insert shows a detail of the MSD mechanical structure. The beam direction is horizontal from left to right.
Fig. 2. Mechanical support used for the alignment of the detectors along the beam line. From left to right, we can distinguish the start counter detector and the BM, with a first MSD (black) positioned between the two detectors (see alsoFig. 1for comparison). Downstream the BM, three MSD are aligned.
after multiple iterations. In this work we present the calibration of the space–time relations and the performance assessment of the BM of the FOOT experiment by means of Microstrip Silicon Detectors (MSD) [6], performed at the Trento proton therapy facility with protons at 80 and 228 MeV of kinetic energy.
2. Materials and methods
2.1. Experimental setup
The BM calibration experiment was performed in the experimental area of the Trento Proton Therapy facility, where a proton beam in the energy range 80–228 MeV is available [7]. The setup was assembled on the 30 degree beam line. It includes a plastic scintillator Start Counter (SC) detector, the BM detector and four layers of MSD. The center of the SC was placed at the isocenter of the beam, followed by one layer of MSD placed between SC and BM, and the other three placed after the BM. A schematic view of the apparatus is shown inFig. 1, where distances between detectors are also indicated. A dedicated mechanical support was used to properly align the detectors along the beam line (Fig. 2). A detailed description of all detector types is presented below.
The start counter detector. The SC has been used in the FIRST experi-ment [8], and it consists of a circular 250 μm thick plastic scintillator disk (EJ-228), with a 26 mm radius. The light produced is collected radially by 160 optical fibers grouped in four bundles and readout by fast photomultipliers (Hamamatsu H10721-201) with 40% quantum efficiency. The scintillator thickness was minimized in order to reduce the probability of particle interaction before the target. As calculated by means of MC simulations, assuming an incident beam of oxygen ions with an initial kinetic energy of 400 MeV/u delivered on a 5 mm thick graphite target, about 3.5% fragmentation probability is expected on the SC with respect to on-target fragmentation. A time resolution of the order of 𝜎𝑡 = 150 ± 5 ps has been measured fitting the time difference distribution between two selected photomultipliers with a Gaussian function [9]. The SC is adopted as trigger detector for the whole acquisition system and as reference time detector for the BM measurements.
The beam monitor detector. The BM is a drift chamber consisting of six planes of alternated horizontal and vertical layers of cells, closed by two mylar windows with 100 μm thickness placed at the beam entrance and exit to contain the gas mixture. Each plane is composed of two layers, one with horizontal and one with vertical wires, both perpendicular
view. The SC trigger signal is also acquired by the TDC in order to get a reference for the BM time measurements. During testing the BM has been continuously flushed with an Ar/CO2gas mixture at 80%∕20% and
∼0.9bar relative pressure.
The microstrip silicon detectors. The detectors employed for the calibra-tion data taking are composed of 300 μm thick double sided silicon micro strip sensors with either one (for the outermost ones, with a resulting 4 × 7 cm2active area) or two daisy-chained modules (for the
innermost ones, with a resulting 8 × 7 cm2 active area). The modules
are directly derived from the ones used in the AMS-02 experiment [6] with the use of a new version of the readout chip (VA140, Ideas) and the reduced readout pitch on the ohmic side (104 μm vs. 208 μm) for the modules with a single sensor. The visible side is the p-side (junction side or S-side) while the reverse side corresponds to the n-side (ohmic side or K-side). The VA140 chip is capable or accepting either positive or negative signals, hence the only difference between the two sides is the number of readout channels and thus the number of chips. In total, each module provides 1024 readout channels, 640 for the S-side, 384 for the K-side. This results in a final spatial resolution of less than 30 μm on the S-side and of either 60 μm (for the detectors with a single sensor with reduced readout pitch) or 30 μm (for the detectors with a single sensor) on the K-side. The overall mean point resolution along a track reconstructed by the detector is of 45 μm. The detectors are operated applying a positive voltage of typically 80 V on the n-side guard ring, while connecting the p-side inner guard ring to ground. Due to the high leakage current of one of the sensors, the bias power supply connected to two of them had to be set at a slightly lower bias voltage of 50 V, resulting in a lower depletion of the silicon bulk.
2.2. Experimental plan
The highest (228 MeV) and lowest (80 MeV) proton energies avail-able at the Trento Protontherapy center were used for the experiment. The former is the best choice to characterize the detector minimizing the Multiple Coulomb Scattering (MCS) and to evaluate the detector resolution. The latter energy has been explored to check the detector sensitivity on ionization density and to evaluate the space–time relation differences, in order to mimic as much as possible the experiment conditions that will be met by the FOOT experiment, in which the BM will be exposed to more ionizing particles at different energies (4He, 12C,16O). In the present experiment, as evaluated by means of PSTAR
tables [10], the stopping power (d𝐸∕d𝑥) of 228 and 80 MeV protons in the BM gas is 3.13 and 6.44 MeV cm2/g respectively.
The spot size of the 228 MeV proton beam is about 3 mm [7], i.e. smaller than a BM single cell dimension. In order to reach all the cell area, the BM has been rotated at 0◦, 5◦and 10◦degrees along the
𝑦axis for the calibration with the MSD. Furthermore, the tilt avoids the overlap of the cell anodes on one layer with the cell border of the next layer, which are the areas with the lowest resolution [11]. The MSD and the SC have not been moved during the entire data taking period.
hits in total, but due to delta rays, cross talks, detector inefficiency and geometry reasons, the hit distribution is spread. In order to avoid these effects as much as possible, but maintaining a sufficient number of events per dataset, we decided to select the events with a number of BM hits≤ 14 and ≥ 10. In the selected events, the BM time measurements with 𝛥𝑡≤ 320 ns are converted to distance measurements adopting the space–time relations calculated in the FIRST experiment [11]. Then, the hits are processed by a track reconstruction algorithm based on the Legendre polynomials [12]. The Legendre space is a bi-dimensional space in which the two coordinates are the two parameters of a bi-dimensional line. All the BM hits are represented in the Legendre space with the Legendre transform and the hits that are compatible with the same track results to be clustered. The cluster with the highest number of hits is considered as the projectile track and the cluster position gives an initial guess of the track parameters. Finally the hits associated with this cluster are given as input to a 𝜒2minimization algorithm to refine
the track parameters estimation.
In order to reconstruct the MSD tracks, first an internal alignment of all the detectors is performed by means of an iterative minimization process on the residuals distributions: events to be used in this process are required to have a single reconstructed hit in each detector to eliminate track multiplicity ambiguities. To minimize the contribution of MCS and to introduce the smallest bias possible in the final track reconstruction the required events are taken from a random sub-sample of those at the highest energy available. The final tracks are then recon-structed using the two detectors closest to the BM (one upstream and one downstream) to mitigate effects from MCS on the track resolution.
The BM tracks with a reduced 𝜒2 (𝜒2
red) ≤ 10 are selected and
matched with the MSD tracks to extract the alignment parameters with an iterative method based on the minimization of the tracks residuals. The number of collected events, selected tracks, the proton beam energy and the tilting angle of the BM with respect to the beam line for the analyzed dataset are reported inTable 1.
Once the tracks are coupled, the two detector measurements are combined to assess the BM performances presented in Section3. As shown inTable 1, the selection criteria strongly reduce the number of collected data in order to maximize the tracks precision and reliability, excluding as much as possible the contribution of the delta rays. Indeed, considering the 228 MeV events reconstructed by the MSD and taken with the setup at 0◦, the BM track reconstruction efficiency, evaluated
as the fraction of events in which the BM reconstructed a track without any selection criteria, is of 0.9906 ± 0.0005. The cut on the number of hits reduce the efficiency to 0.828 ± 0.002 and the cut on the 𝜒2
redfurther
reduce the efficiency to 0.633 ± 0.002. The drop of the number of BM reconstructed tracks in the tilted setups is due to the reduced angular acceptance of the detector with respect to the beam direction. Since the beam spot size at the isocenter is of 𝜎𝑥 = 2.74mm and 𝜎𝑥 = 6.93 mm for the 228 and 80 MeV protons [7], in the latter case the efficiency drop is enhanced. However, by means of a Monte Carlo (MC) simulation performed with the FLUKA MC code [13–15], it has been previously verified that the total number of selected events is sufficient to achieve the analysis purpose.
Fig. 3. On the left, the hit distribution of 105events of protons at 80 MeV reconstructed with the BM high voltage at 2200 V; on the right, the mean value (black) and the peak value (red) of the BM hit distribution as a function of the high voltage. The error bars show the standard deviation of each hit distribution. (For interpretation of the references to color in this figure legend, the reader is referred to the web version of this article.)
Fig. 4. On the left, the drift distance as a function of the BM measured time for the combined tracks. The red and the blue lines indicate the new fitted space–time relations and the space–time relations adopted in the FIRST experiment, respectively [11]; on the right, the difference between the space–time relations evaluated from the data taken with protons at 80 MeV and 228 MeV as a function of time. For each time bin, the error bar represents the squared sum of the standard error of the mean of the two underlying space distributions. (For interpretation of the references to color in this figure legend, the reader is referred to the web version of this article.)
3. Results
Once the tracks are selected and the detector alignment param-eters retrieved, different paramparam-eters have been studied to character-ize the BM detector and to ensure that its performance satisfies the requirements of the FOOT experiment.
3.1. BM hit distribution and working point
In order to select an optimal High voltage (HV) value, the BM was first exposed to a fixed 80 MeV proton beam and a set of data was taken varying the HV from 1800 to 2300 V. A minimum of 105primaries was
acquired for each data set. The threshold on the BM channels was set to 20 mV during the data acquisition. This value is above the noise level and below the typical BM signal that is of the order of hundreds of mV. An example of the hit distribution for a given HV is presented in the left panel ofFig. 3. The asymmetric shape of the distribution is given by the effect of delta rays, cross talks and geometry, since a particle can produce ionization in more than a single cell in each layer. Thus the hit distribution mean value is slightly higher than the peak value. The mean and the peak values of the number of hits as a function of the HV are shown on the right panel ofFig. 3. As expected, the number of hits increases with the increase of the HV. A minimum threshold value of 1900 V on the HV has been found to detect the 80 MeV protons.
Since the expected number of hits for each event is 12 and in order to maintain a high level of efficiency (as shown in Section3.3), the optimal HV working point for the BM has been found to be 2200 V, in which the mean number of hit per event is 14 and the peak of the hit distribution is 12 hits. The same HV value has been adopted during the acquisition of protons at 228 MeV, since the same hit distribution properties have been found.
3.2. Space–time relations
In order to evaluate the BM space–time relations minimizing the bias due to MCS, the data taken with protons at the maximum available energy of 228 MeV are considered. For each event that passes all the selection criteria, the MSD reconstructed track is extrapolated into the BM detector and the cells crossed by the track that contain a BM hit are considered for the analysis. For each selected cell, the distance of the track with respect to the cell sense wire position is calculated. This value represents the drift distance of the projectile and it can be coupled with the BM time measurement. The two values calculated from all the events fill a two dimensional plot that represents the distribution of the drift distance as a function of the time measurement. In order to get a clean space–time relation distribution, a profiling procedure is adopted and for each time bin, the mean value of the relative underlying space distribution is considered as the best value for the given time bin.
Fig. 5. On the left, the raw hit detection efficiency measured as a function of the BM high voltage; on the right, the measured efficiency as a function of the drift distance. The red line represents the raw hit detection efficiency for the calibration test working point (2200 V). All the error bars are calculated by means of uncertainty propagation. (For interpretation of the references to color in this figure legend, the reader is referred to the web version of this article.)
The results are shown in Fig. 4 on the left with the new fitted space–time relations in red. For comparison, the blue line represents the space–time relations adopted in the FIRST experiment [11] and evaluated with an iterative procedure based on data taken from a test with carbon ions at 80 MeV/u and the BM operating at 1800 V. Even though the incident particles and the BM working point were different, the two curves look quite similar, since no relevant differences are observed on the reconstructed tracks and on the resolution evaluation using both space–time relations.
The space–time relation difference between the data taken with protons at 80 and 228 MeV is shown on the right panel of Fig. 4. For a given time measurement, the corresponding drift distance is larger for the protons at the lower energy. This effect is due to the enhancement of the mean free path between two ionization clusters of the high low ionizing protons with respect to the low energy-high ionizing protons. Indeed, in the energy range considered in this analysis, the 80 MeV protons will ionize a factor 2 more than 228 MeV protons, providing thus more ionization clusters. In this case, the distance between the cell sense wire and the closest ionizing cluster is lower and the drift signal will be collected in less time with respect to the high energy particle. Thus, for a given time measurement, the low energy particles are associated with a larger drift distance. This effect is enhanced at the BM cell border due to the lowering of the electric field, where also time-walk and time-jitter effects on the wire signal can have a role. The difference of the space–time relations between the two proton energies data is 35 ± 10 μm for the hits with a time measurement shorter than 270 ns and 100 ± 13 μm for the hits associated with a time higher than 270 ns. However, in the former case it is 4–5 times smaller than the BM mean resolution at the cell center and in the latter case it is 2–3 times smaller than the resolution at the cell border. Considering also the BM inefficiency and the reduced number of hits detected at the cell border, the difference between the space– time relations evaluated with the two proton energies is a negligible effect for the track reconstruction purpose.
3.3. Efficiency
In order to find a proper working point, the BM raw hit detection efficiency is estimated using a pivot and probe counter method: for each view, the pivots are the events in which three hits are detected on the three odd (or even) planes. On this subset of events, the probes are the events in which also the two even (or odd) planes placed between the pivots planes contains at least a hit. The hit detection efficiency is defined as the ratio of probes to pivots. At first, efficiency is evaluated as a function of the BM HV. For a fixed beam of protons at 80 MeV, we took a dataset of 100k events for each HV step of 50 V, ranging from 1900 V up to the maximum voltage allowed of 2300 V. The results are
shown on the left panel ofFig. 5. As expected, the efficiency increases as the HV increases. In order to have an efficiency≥ 0.9, the minimum HV value has been found to be 2150 V. For the HV value of 2200 V chosen as the optimal working point after the procedure described in Section3.1, the efficiency is evaluated also varying the beam energy from 80 MeV to 220 MeV with steps of 20 MeV, taking datasets with 100k events. The overall mean value of the efficiency at 2200 V result to be 0.929 ± 0.008. This is good enough to reconstruct the projectile track since the BM has 6 planes of cells for each view and, with this efficiency value, the mean number of hits per particle and per view is 5.58 ± 0.06, which is high enough compared to the three minimum hits required to reconstruct a track on a view.
In order to evaluate the BM efficiency as a function of the hit drift distance exploiting the external independent detector, the efficiency is measured with a different method using the BM hits and the MSD reconstructed tracks: for each selected event, the MSD track is prop-agated into the BM detector and the cells crossed by the track are selected and considered as the pivots. Each pivot is associated with a drift distance and a probe counter. The former is evaluated as the distance between the track and the cell sense wire. The latter is equal to one if the cell contains a BM hit and zero if it does not. At the end, all the pivots with the same drift distance are grouped and the relative efficiency is evaluated as the ratio of the number of the associated probes to the number of pivots. The result is shown in the right panel ofFig. 5. The cell efficiency is always larger than 98% for hit distances below 0.45 cm, where the strength of the electric field ensures good charge collection. At the border of the cell, for distances above 0.6 cm, where the electric field is of 0.55 kV/cm, the efficiency drops below the 0.93 mean value, due to incomplete charge collection. The effect of the detectors misalignment and the track reconstruction precision on the efficiency drop at large drift distance is negligible, since the drift distance of the pivots are evaluated with an accuracy of 0.034 cm in the worst case scenario of proton beam at 80 MeV, where the MCS is maximized. In principle, it would be possible to balance the inefficiency by rising the HV, but the disadvantage is the enhancement of cross talks and delta rays: the number of hits per event would rise above 12– 13 hits/event and the number of fake hits detected by the BM would increase, as shown in Fig. 3. Moreover, the BM cells are staggered overlapping a cell border with the anode of the cells placed in the adjacent layers, which allows recovering the inefficiency.
3.4. Spatial and angular resolution
The BM spatial resolution has been evaluated with two different methods: the first one consists in the extrapolation of the MSD recon-structed tracks into the BM cells and in the evaluation of the residual, by checking the difference between the distance of the track with
Fig. 6. Resolution of the BM calculated with the MSD reconstructed tracks (red) and the BM tracks (black) for proton beams at 228 MeV (left) and 80 MeV (right). (For interpretation of the references to color in this figure legend, the reader is referred to the web version of this article.)
the cell center and the BM space measurement. The obtained residual distribution is fitted with a Gaussian and, in order to extrapolate the contribution of the BM detector, the square of the MSD detector resolution of 45 μm is subtracted from the fitted variance. The results of this method are shown in red in Fig. 6. For protons at 228 MeV and 80 MeV the mean resolution is 200 ± 60 μm and 340 ± 60 μm while the resolution at the central part of the cell is of the order of 150 and 300 ± 10 μm, respectively for the two beam energies. In both cases there is a worsening of the performance at the cell border and close to the cell center. In the former case, it is due to the diffusion process of the ionized particles that leads to a Gaussian smearing of the position of particles with a variance that depends on the drift time. In the latter case, the avalanches produced by the electrons close to the anode wire modify the electric field reducing the resolution at the cell center. Furthermore, for a given fixed time resolution due to the acquisition electronics, the associated space resolution is lower at the cell center since in this region the BM space–time relation is steeper due to the electric field dependence. The second method to evaluate the BM spatial resolution adopts the same strategy as the previous one, but it uses the BM reconstructed tracks instead of the MSD tracks. The resulting mean resolution is 140 ± 70 μm and 120 ± 60 μm for protons at 228 and 80 MeV respectively. In both cases, the resolution in the central part of the cell is in a range between 100 μm and 60 μm (Fig. 6).
In order to analyze the difference between the results of the two methods, a MC simulation study was performed by means of FLUKA code. The experimental setup shown inFig. 1was simulated with a proton beam at 80 MeV and an oxygen beam at 400 MeV/u. The BM spatial resolution was reproduced in the simulations applying a smear on the drift distances according to the resolutions obtained with the BM track method from the data collected with protons at 80 MeV. Applying the same procedure as done for the experimental data, the results of the two resolution evaluation methods on the two simulations are shown inFig. 7. The black and the blue points are the resolutions obtained with the BM track method respectively for the proton and the oxygen ion beams. Both the curves are similar to each other and they are compatible to the input resolution. The results of the MSD track method are indicated by the red and the green points that respectively represent the proton and the oxygen beam simulations. In this case the two curves differ from each other due to the distinct MCS contributions. Protons have lower charge and lower energy with respect to the oxygen ions, so the MCS effect is enhanced and the spatial resolution evaluated with the MSD tracks in the central part of the cell is of the order of 250 μm. The difference between the simulated and the experimental data results can be attributed to an underestimate of the material budget in the simulations. Indeed, similar results are obtained also with a simulation performed with protons at 228 MeV. In the case of oxygen ions, the MCS effect is limited by the particle higher charge and kinetic
Fig. 7. BM spatial resolutions evaluated by means of MC simulations: the red and the green points represent the resolutions evaluated with the MSD tracks respectively for the simulations performed with protons at 80 MeV and oxygen ions at 400 MeV/u. The resolutions obtained with the BM track method for the two simulations are shown by the black (protons at 80 MeV) and the blue (oxygen at 400 MeV/u) points. (For interpretation of the references to color in this figure legend, the reader is referred to the web version of this article.)
energy. Indeed the spatial resolutions evaluated with the MSD track method are of the order of 100 μm in the central part of the cell, that is slightly above the simulation input resolution. Therefore, with an external detector it is possible to evaluate the BM resolution including the worsening due to the MCS given by the BM itself and the air gap between the BM and the two layers of MSD. Alternatively, adopting the BM tracks, it is possible to evaluate the detector intrinsic resolution, that represents the upper limit of the BM performances. This conclusion explains also the better resolutions obtained exploiting the MSD track method with the 228 MeV protons experimental data with respect to the 80 MeV protons data.
In order to evaluate the BM angular resolution, the distribution of the residuals between the BM and the MSD track slopes has been fitted with a Gaussian function for each dataset and for each view. The resulting BM angular resolution for the 228 and 80 MeV protons is of 1.62 ± 0.16 mrad and 2.1 ± 0.4 mrad. On each view the distance along the beam direction between the position of the first and the last layer of sense wires is of 13 cm. Considering this length, the angular resolution is compatible with the previous spatial resolution measurement performed with the MSD tracks.
material. To this purpose, we investigated the BM angular resolution by evaluating the angular residual distribution between the BM and the MSD tracks. The results show an angular resolution of 1.62 ± 0.16 mrad and 2.1 ± 0.4 mrad for the higher and lower beam energies, respectively. At the same time, two methods have been developed and studied by means of MC simulations to measure the BM spatial resolution. The first one adopts the information provided by an external tracker (i.e. the MSD detectors) and it takes into account both the BM intrinsic resolution and the MCS effect. The results show a resolution of about 150 and 300 ± 10 μm in the central part of the cell for protons of 228 and 80 MeV of kinetic energy, respectively. The second method exploits instead the BM reconstructed tracks. It depends essentially only on the BM intrinsic resolution and it allows us to determine the detector performance limit, that has been found to be 60–100 μm in the central part of the cells. Even if the spatial resolution obtained with the BM tracks are better than the results achieved with the MSD tracks due to the MCS effect, the evaluation of the space–time relations performed with the external detector is still preferred since it avoids the dependence of the results on the BM reconstruction algorithm and the limitations experienced in the past [9] when a self-calibration method was used.
Both the overall hit detection efficiency and the BM intrinsic res-olution evaluation method have already been adopted in the FIRST experiment [11]. The results presented in this work are compatible with the previous ones, even if the working point was not the same. Our results show that the detector fulfills the FOOT requirements and it can be adopted for the future FOOT data taking in which the BM will be adopted to reconstruct heavy ion beams with Z≥2 with kinetic energies of 200–700 MeV/u.
CRediT authorship contribution statement
Dong Yunsheng: Formal analysis, Writing - original draft,
Inves-tigation, Software, Methodology. Silvestre Gianluigi: Formal
analy-sis, Investigation, Resources.Colombi Sofia: Investigation, Resources,
Methodology.Patera Vincenzo: Funding. Battistoni Giuseppe:
Super-vision, Writing - review & editing, Investigation, Conceptualization,
authors reviewed and approved the manuscript.
References
[1] H. Paganetti, Relative biological effectiveness (RBE) values for proton beam therapy. Variations as a function of biological endpoint, dose, and linear energy transfer, Phys. Med. Biol. 59 (22) (2014) R419, http://dx.doi.org/10.1088/0031-9155/59/22/R419.
[2] F. Tommasino, M. Durante, Proton radiobiology, Cancers 7 (2015) 353–381,
http://dx.doi.org/10.3390/cancers7010353.
[3] J. Dudouet, et al., Double-differential fragmentation cross-section measurements of 95 MeV/nucleon12C beams on thin targets for hadron therapy, Phys. Rev. C 88 (2013) 024606,http://dx.doi.org/10.1103/PhysRevC.88.024606.
[4] W.R. Webber, J.C. Kish, D.A. Schrier, Individual isotopic fragmentation cross sections of relativistic nuclei in hydrogen, helium, and carbon targets, Phys. Rev. C 41 (1990) 547–565,http://dx.doi.org/10.1103/PhysRevC.41.547. [5] R. Pleskac, et al., The FIRST experiment at GSI, Nucl. Instrum. Methods Phys.
Res. A 678 (2012) 130–138,http://dx.doi.org/10.1016/j.nima.2012.02.020. [6] J. Alcaraz, et al., The alpha magnetic spectrometer silicon tracker: Performance
results with protons and helium nuclei, Nucl. Instrum. Methods Phys. Res. A 593 (3) (2008) 376–398,http://dx.doi.org/10.1016/j.nima.2008.05.015.
[7] F. Tommasino, et al., Proton beam characterization in the experimental room of the Trento Proton Therapy facility, Nucl. Instrum. Methods Phys. Res. A 869 (2017) 15–20,http://dx.doi.org/10.1016/j.nima.2017.06.017.
[8] M. Toppi, et al., Measurement of fragmentation cross sections of12C ions on a thin gold target with the FIRST apparatus, Phys. Rev. C 93 (06) (2016) 064601,
http://dx.doi.org/10.1103/PhysRevC.93.064601.
[9] A. Paoloni, et al., The upstream detectors of the FIRST experiment at GSI, Phys. Proc. 37 (2012) 1466–1472,http://dx.doi.org/10.1016/j.phpro.2012.03.745. [10] M. Berger, J. Coursey, M. Zucker, J. Chang, Stopping-power and range tables
for electrons, protons, and helium ions,http://dx.doi.org/10.18434/T4NC7P. [11] Z. Abou-Haidar, et al., Performance of upstream interaction region detectors for
the FIRST experiment at GSI, J. Instrum. 7 (2012) P02006,http://dx.doi.org/ 10.1088/1748-0221/7/02/P02006.
[12] T. Alexopoulos, et al., Implementation of the Legendre Transform for track segment reconstruction in drift tube chambers, Nucl. Instrum. Methods Phys. Res. A 592 (3) (2008) 456–462,http://dx.doi.org/10.1016/j.nima.2008.04.038. [13] T. Böhlen, F. Cerutti, M. Chin, A. Fassò, A. Ferrari, P. Ortega, A. Mairani, P. Sala, P. Smirnov, V. Vlachoudis, The FLUKA code: Developments and challenges for high energy and medical applications, Nucl. Data Sheets 120 (2014) 211,
http://dx.doi.org/10.1016/j.nds.2014.07.049.
[14] A. Ferrari, P.R. Sala, A. Fassò, J. Ranft, FLUKA: A Multi-Particle Transport Code, Tech. Rep., (CERN-2005-10, INFN/TC_05/11, SLAC-R-773) CERN, INFN, SLAC, 2005,http://dx.doi.org/10.2172/877507.
[15] G. Battistoni, et al., The FLUKA code: An accurate simulation tool for parti-cle therapy, Front. Oncol. 6 (2016) 116,http://dx.doi.org/10.3389/fonc.2016. 00116.