RESEARCH ARTICLE
Within-session decrement of the emission of
licking bursts following reward devaluation in
rats licking for sucrose
Paolo S. D’Aquila*, Adriana Galistu
Dipartimento di Scienze Biomediche, Universitàdi Sassari, Sassari, Italy
Abstract
We previously observed that dopamine D2-like receptor blockade in rats licking for sucrose produced a within-session decrement of the emission of licking bursts similar to the effect of either reward devaluation, or neuroleptics, on operant responding for different rewards, which, accordingly, we interpreted as an extinction-like effect. This implies that exposing animals to reward devaluation would result in a drop of burst number taking place only after the contact with the devalued reward. To test this prediction, we compared the difference in the within-session time course of burst number in response to high (10%) versus low (2%) concentration sucrose solutions, either in a condition of reward devaluation (exposure to 2% after daily 10%), or in a condition which does not involve changes in the reward value (two groups of subjects each repeatedly exposed to only one of the two concentrations). Reward devaluation resulted in a within-session decrement of the burst number, with the response rate dropping only after the contact with the devalued reward, as predicted. This response pattern was reliably observed only in subjects at their first devaluation experience. In con-trast, exposure of separate groups of animals to the two different concentrations yielded lower levels of burst number in the low concentration group apparent since the beginning of the session, as previously observed with dopamine D1-like receptor blockade. These results show that the analysis of burst number, but not of burst size, reveals a specific activation pattern in response to reward devaluation, which differs from the pattern observed compar-ing the response to two different sucrose concentrations in separate groups of subjects, i.e. in a condition not involving reward devaluation. Finally, the characterisation of the experi-mental measures of the analysis of licking microstructure in behaviourally (and psychologi-cally) meaningful functional terms, might be relevant for the investigation of the mechanisms underlying behavioural activation and the related evaluation processes.
Introduction
Licking behaviour in rats ingesting fluids is characterised by the clustering of licks in bursts, i.e. discrete series of licks at the rate of about 5 to 7 licksper second, as shown by the early
a1111111111 a1111111111 a1111111111 a1111111111 a1111111111 OPEN ACCESS
Citation: D’Aquila PS, Galistu A (2017)
Within-session decrement of the emission of licking bursts following reward devaluation in rats licking for sucrose. PLoS ONE 12(5): e0177705.https:// doi.org/10.1371/journal.pone.0177705
Editor: James Edgar McCutcheon, University of
Leicester, UNITED KINGDOM
Received: January 10, 2017 Accepted: May 2, 2017 Published: May 11, 2017
Copyright:© 2017 D’Aquila, Galistu. This is an open access article distributed under the terms of theCreative Commons Attribution License, which permits unrestricted use, distribution, and reproduction in any medium, provided the original author and source are credited.
Data Availability Statement: All relevant data are
within the paper.
Funding: This work was funded by
Fonda-zione Banco di Sardegna, Italy (www. fondazionedisardegna.it, Grant N. U5002013/ A.I.424MGB to PSD). The funder had no role in study design, data collection and analysis, decision to publish, or preparation of the manuscript.
Competing interests: The authors have declared
studies by Davis based on the log-survivor analysis of the intervals between successive licks [1]. Burst size, defined as the number of licksper burst, along with the initial lick rate, is mainly dependent on the nature and the concentration of tastants in a solution. For example, it was demonstrated that burst size is monotonically related to the concentration of different sugars [2–5]. On the other hand, burst number, which represents the number of times that subjects decide to engage in licking behaviour, is more sensitive to stimuli that do not involve the oro-sensory contact with the reward, such as post-ingestive cues [2,4,5]. Therefore, the number and the size of licking bursts might be interpreted as measures revealing, respectively, (i) a pro-cess of activation of a reward-oriented response, possibly due to the attribution of incentive motivational properties to a reward-related stimulus, and (ii) an evaluation process occurring during the consummatory transaction with the reward, which is possibly related to the experi-ence of pleasure [6–9]. Rats show a high preferexperi-ence for sucrose, the ingestion of which appears to be regulated by both orosensory and post-ingestive mechanisms, which determine the total lick number in a session by primarily influencing size and number of licking bursts [10–14].
We recently suggested that the activation of reward-associated responses depends on dopa-mine D1-like receptor stimulation, while the level of this activation is updated, or “reboosted”, on the basis of a dopamine D2-like receptor-mediated evaluation process occurring during the consummatory transaction with the reward [8,9,15]. This hypothesis rests on the observation that dopamine D2-like receptor antagonists, not only reduce the size of licking bursts for sucrose [3,8,16–18] thus mimicking the effect of sucrose dilution [3], but also result in a within session decrement of burst number occurring after the contact with the reward, which we interpreted as an extinction-like effect [8,9], as previously suggested for the effect of either reward devaluation or neuroleptics on instrumental responding for different rewards [19–21]. In contrast, dopamine D1 receptor blockade reduces lick number exclusively by reducing burst number, but has no effect on their size [8,9,18,22–24]. It is worth noting that its effect on the burst number within-session time course is apparent since the very beginning of the sessions, thus differing substantially from the effect of dopamine D2 receptor blockade [8,9]. Consistent results were obtained examining the effect of dopamine D1- and D2-like receptor antagonists in sodium-replete [9,23–25] and sodium-depleted [23] rats licking for NaCl solutions.
The interpretation of the effect of dopamine D2 receptor blockade on the within-session time course of burst number as an extinction-like effect–which is the main piece of evidence in support of the proposed hypothesis–implies that exposing animals to reward devaluation, obtained by reducing the concentration of a familiar sucrose solution, would also result in a similar response, i.e. a drop of burst number taking place only after the contact with the deval-ued reward. To our best knowledge, the effect of sucrose dilution on the licking burst number time course was never reported in the literature so far. Indeed, earlier studies investigated the within-session time course of lick number, but not of burst number, after either reward deval-uation or neuroleptics, failing to observe such a response pattern [26,27]. Thus, the aim of this study was to test this prediction.
This study consists into two experiments. Experiment 1 was aimed (i) to the investigation of the effect of reward devaluation, both within subjects and in comparison with a group not subjected to reward devaluation, and (ii) to the exploration of the effects of repeated exposure to reward devaluation. To this end, we examined the effect of sucrose dilution on the licking burst number time course (along with the other microstructural measures of licking behav-iour) within 30-min sessions in rats with an experience of daily exposure to a 10% sucrose solution, i.e. in an experimental condition involving reward devaluation. In a first experimen-tal trial, half of the subjects trained to drink a 10% sucrose solution were offered a 2% solution, and the other half were offered the usual 10% solution. A week later, both groups were
subjected to reward devaluation. Since subtle differences between the responses of the two groups were noted, we decided to further explore the possible effects of the repeated experi-ence of reward devaluation in a third trial performed a week later.
Experiment 2 aimed (i) to the replication of the main finding from Experiment 1, i.e. the effect of reward devaluation on the within-session burst number time course, and (ii) to provide an experimental condition apt to reveal the difference between the response pattern to 10% vs 2% sucrose concentration solutions, in absence of reward devaluation. In addition, we decided to explore the effect of an upshift in sucrose concentration in the low concentration group. To this end, two groups of rats were allowed daily access to either a high (10%) or a low (2%) con-centration sucrose solution. In the course of 19 experimental sessions, the high concon-centration group was exposed to the 2% concentration solution in 3 devaluation trials 3–4 sessions apart from each other. In the last session, both groups were exposed to the high concentration solu-tion. The comparisons which bear relevance to the aim of this study are: (i) the within-group comparison between the devaluation session with the immediately preceding one in the high concentration group–i.e the effect of reward devaluation–which provides the replication of the findings from Experiment 1, and (ii) the comparison between the high and the low concentra-tion groups in the sessions not involving downshift (or upshift) in sucrose concentraconcentra-tion, which provides a comparison between the response to 10% vs 2% sucrose in absence of reward devalu-ation. It must be noted that this experimental design is the same which is adopted in the investi-gation of the successive negative contrast effect, which consists in a reduced intake of the low sucrose concentration solution in the high concentration group when subjected to downshift in concentration, compared to the intake of the unshifted low concentration group [28–30]. This effect is revealed by the comparison between the high and the low concentration group response with both exposed to the low concentration solution.
The results show that sucrose dilution results, as predicted, in a within-session decrement of burst number, taking place only after the contact with the reward, as previously shown with dopamine D2-like receptor blockade [8,9], while the different response to highversus low con-centration sucrose solutions of separate groups of animals yields lower levels of burst number in the low concentration group, which are apparent since the beginning of the session, as we previously observed with dopamine D1-like receptor blockade [8,9].
Materials and methods
Subjects
Experimentally naïve male Sprague-Dawley rats (Harlan, Italy) weighing 300–350 g were used as subjects. The animals were housed in groups of two-three per cage in controlled environmen-tal conditions (temperature 22–24˚C; humidity 50–60%; light on at 08:00, off at 20:00), with free access to food and water. All the experimental procedures were carried out in accordance with the regulatory requirement of the Italian law (D.L. 116, 1992) and Council Directive 2010/ 63EU of the European Parliament, and were approved by the Independent Committee of Bio-ethics for Animal Testing of the University of Sassari (11/11/2013) and authorised by the Minis-try of Health, Italy (Authorisation N. 87/2014-B, 12/03/2014). After the experiments the animals were euthanised with pentobarbital sodium.
Apparatus, microstructural measures and testing conditions
Behavioural testing was carried out using a multistation lick analysis system (Habitest,Coul-bourn Instruments, USA) connected to a computer. Rats were individually placed in a Perspex chamber with an opening in the centre of the front wall allowing access to a bottle spout. The recording period started either after the first lick or after 3 min that the animals were placed
into the chambers, so that the latency to the first lick had a cut off time of 3 min. The interrup-tions of a photocell beam by each single tongue movement while licking the spout were recorded, with a temporal resolution to the nearest 50 milliseconds. The raw data were ana-lysed through Graphic State 3.2 software (Coulbourn Instruments, USA) and, besides lick number, the following microstructural measures were obtained: number of bursts, time spent in bursts, latency to the first lick. A burst was defined as a series of licks with pauses no longer than 400 milliseconds (see [8]). Burst size (number of licksper burst) and intra-burst lick rate (lick/sec within bursts) were then calculated. The data were collected in time bins of 3 min in sessions of 30 min.
The experiments were performed between 09:00 and 13:00, i.e. during the light phase of the lighting cycle (see [9]). All the experiments were perfomed in non-deprived animals.
Experimental design and procedures
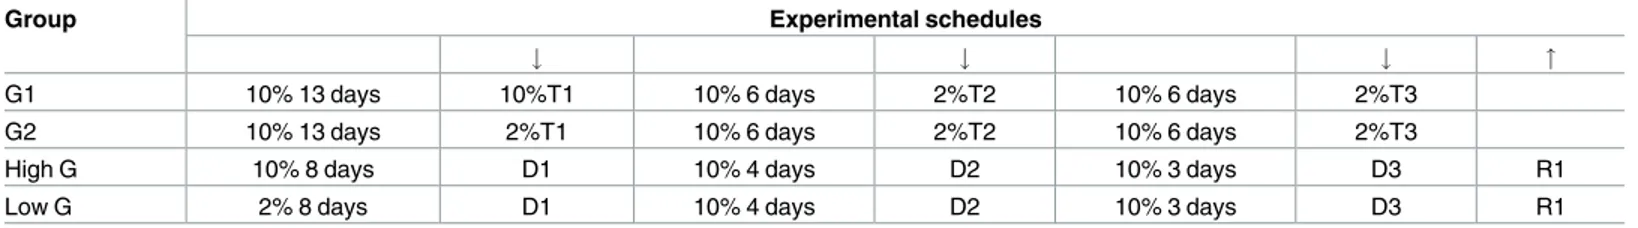
Experiment 1. The subjects (N = 39) were exposed to a 10% sucrose solution in daily
ses-sions of 30 min. On day 6 of the 2nd week, i.e. after 13 days of daily exposure to sucrose, having obtained a reasonably stable baseline, the subjects were divided into two experimental groups, G1 (n = 20) and G2 (n = 19), matched according to the whole session burst size. The successive day, i.e. on day 7 of the second week (Trial 1), G1 was exposed again to the usual 10% solution, while G2 was exposed to a 2% sucrose solution. Daily exposure of the animals to the sucrose solutions was carried on for two more weeks, with both groups being exposed to the 2% solu-tion on day seven of each week (Trial 2 and 3), while receiving the 10% solusolu-tion all the other days (Table 1).
Experiment 2. The subjects (N = 35) were allocated into two groups, (i) high
concentra-tion group (n = 19) and (ii) low concentraconcentra-tion group (n = 16), with 30 min daily access to either a 10% or a 2% sucrose solution, respectively (sessions S1-S15). At the 9th(D1, immedi-ately after S8), 14th(D2, immediately after S12) and 18th(D3, immediately after S15) sessions, the high concentration group was exposed to the 2% concentration solution (3 devaluation tri-als). In the last session (R1), both groups were exposed to the high concentration solution (10%).
Data analysis
Statistical analysis of all sets of data was performed with ANOVA, by the software Statistica 8.0 (StatSoft Inc.). Post hoc analysis of the main effects was made using the Newman-Keuls multi-ple comparison test. When a significant interaction between factors was revealed, comparisons were performed by F-test for contrasts.
Experiment 1. The analysis of the results included the data from the 3 devaluation
ses-sions (labeled in the figures as session II) along with the data from the previous day (session I), so that each devaluation trial was composed of two sessions, the first with the 10% solution
Table 1. Experimental schedules. Experiments 1 (G1, G2) and 2 (High and Low concentration group). T, trial; D1, D2, D3 2%, R1 10% sucrose solution;
#/": downshift/upshift in sucrose concentration.
Group Experimental schedules
# # # "
G1 10% 13 days 10%T1 10% 6 days 2%T2 10% 6 days 2%T3
G2 10% 13 days 2%T1 10% 6 days 2%T2 10% 6 days 2%T3
High G 10% 8 days D1 10% 4 days D2 10% 3 days D3 R1
Low G 2% 8 days D1 10% 4 days D2 10% 3 days D3 R1
and the second with the 2% solution (with the exception of the 1sttrial for G1, with the animals being offered a 10% solution, see above). Lick number and burst number data analysis
involveddevaluation (2 levels, corresponding to the 2 sessions from each trial), time (10 levels, corresponding to the within-session 3-min time bins) andtrial (3 levels) as within-group fac-tors, and (ii)group (2 levels, corresponding to G1 and G2) as a between-group factor. Analysis of the data relative to the latency to the 1stlick, and the whole session number of licksper burst and intra-burst lick rate data did not involve the factortime. Further analyses were performed to explore the possible within-session changes in burst size. Thus, the data relative to the num-ber of lickper burst were grouped into three time bins: T1 (including the first three 3-min time bins, from the beginning of the session up to 9 min), T2 (three 3-min time bins from 9 to 18 min) and T3 (four 3-min time bins from 18 min up to the end of the session). A first analysis involved two within-group factors,time (with 3 levels corresponding to the three time bins) anddevaluation (with two levels, see above) and the between-group factor group (with two lev-els). However, the repeated measures ANOVA does not allow empty cells in the data matrix, thus, the data of the subjects failing to perform a single lick burst in a single time bin are not taken into account in the analysis. Since, especially late in the session, a significant number of subjects fail to engage in licking behaviour, in order to have more representative samples, the data relative to each time bin were also analysed independently, withdevaluation as a within-group factor andgroup as a between-group factor.
Experiment 2. Firstly, the data from either the total or the mean values (as appropriate for
each experimental measure) from each session were analysed by ANOVA, withgroup as a between-groups factor (with two levels, corresponding to the high and the low concentration groups), andsession (with 19 levels, corresponding to the experimental sessions, from S1 to R1) as a within-group factor (by sessions analysis). Moreover, the burst number within-session time course data from the first 7 sessions (S1-S7), from the three devaluation trials and from the con-centration upshift trial, R1 (each including the devaluation session–or the R1 session–along with the preceding session: S8-D1, S12-D2, S15-D3, D3-R1), were analysed by ANOVA. The analysis of the data from S1 to S7 involved a between-group factor,group, with two levels (corre-sponding to the high and the low concentration groups), and a within-group factor,time, with 10 levels (corresponding to the ten 3 min time bins within the 30 min session). The analysis of the data from the devaluation trials and from the concentration upshift trial involved a further factor,devaluation (or upshift), with two levels (corresponding to the two sessions of the trial). Further analyses were performed on the within-session time course of burst size, by grouping the session data into 3 time bins, as described for Experiment 1. ANOVA of the data relative to the comparison between each devaluation session and the immediately preceding session in the high concentration group–i.e. the investigation of the effects of devaluation–involved two within-group factors:devaluation (2 levels) and time (3 levels corresponding to the three time bins). ANOVA of the data relative to the comparison between the high and the low concentra-tion groups in each devaluaconcentra-tion session–i.e. the investigaconcentra-tion of the contrast effect–involved the within-group factortime (3 levels) and the between-group factor group (2 levels). As in Experi-ment 1, the data relative to each time bin were also analysed independently, withdevaluation as a within-group factor to reveal the effect of devaluation in the high concentration group, and a separate analysis withgroup as a between-group factor to reveal the contrast effect in each deval-uation session. Finally, ANOVA of the upshift concentration trial (High and Low concentration group at sessions D3 with 2% and R1 with 10%) involved the between-group factorgroup (2 lev-els) and the within-group factorsupshift (2 levels) and time (3 levels, corresponding to the three time bins). ANOVA of the data from each single time bin involved the between-group factor group and the within-group factor upshift.
Results
Experiment 1
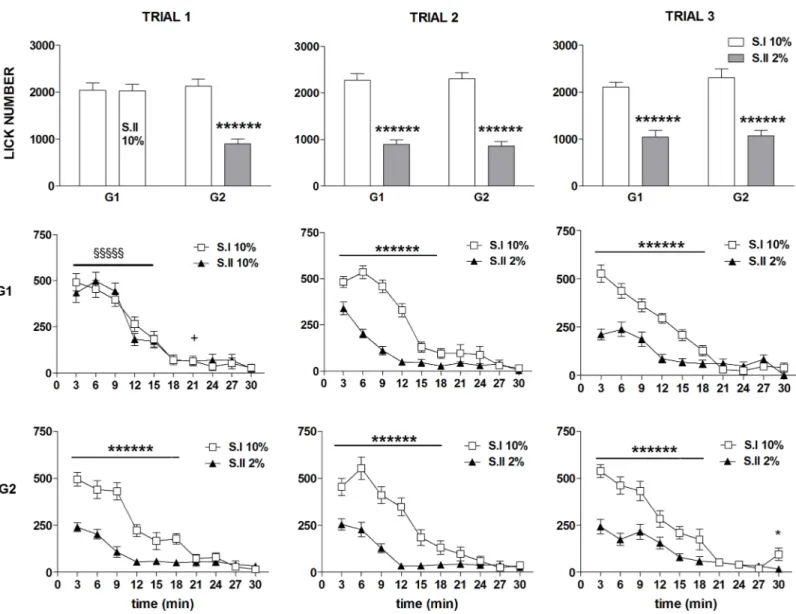
ANOVA of lick number data showed a statistically significant effect ofdevaluation [F(1,37) = 293.78, P<10−6], andtime [F(9,333) = 205.71, P<10−6], with no statistically significant effects oftrial [F(2,74) = 1.90, n.s.] and group [F(1,37) = 1.28, n.s.]. Moreover, a statistically significant 3 ways interaction betweendevaluation, trial, and group [F(2,74) = 7.73, P = 0.00089] and a sta-tistically significant 4 ways interaction betweendevaluation, trial, time and group [F(18,663) = 2.53, P = 0.0004] were revealed. Further analyses (F-tests for contrasts) based on the 3 ways interaction showed that, in all the trials and both in G1 and G2, exposure to sucrose dilution resulted in a marked decrease of the total lick number (Fig 1, first row). Comparisons made on the basis of the 4 ways interaction showed that these differences were due to a reduced number of licks from the beginning of the session up to the 18thmin in response to the 2% sucrose solution compared to the 10% solution (Fig 1, 2ndand 3rdrows). As for the comparison between G1 and G2 in the first trial, in session I, with both groups being exposed to a 10% sucrose solution, the curves representing the lick number time course are almost superimpos-able, showing a small but statistically significant difference limited to one time bin (15–18 min). In session II, G2, i.e. the group exposed to the solution at reduced concentration, showed a reduced level of the number of licks since the beginning of the session up to the 15thmin compared to G1, which was exposed to the 10% solution (Fig 1, left panels).
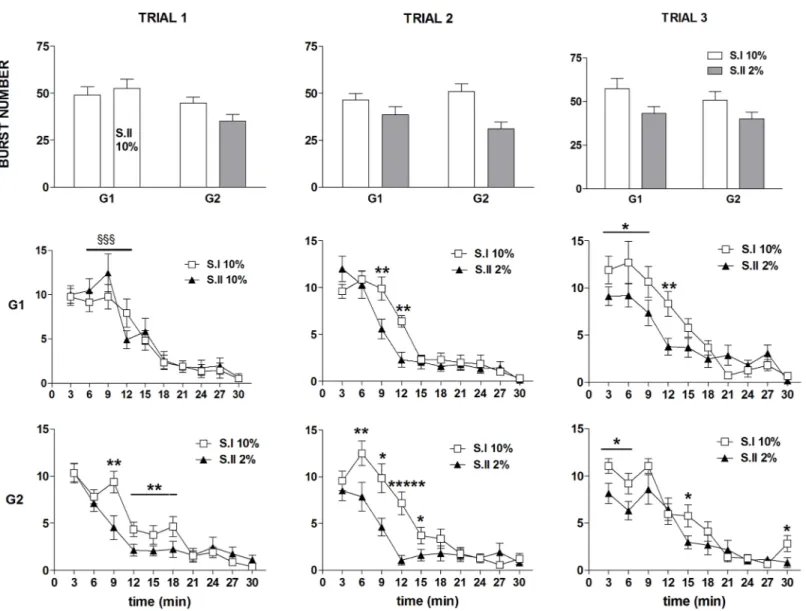
ANOVA of burst number data revealed a statistically significant effect ofdevaluation [F(1,37) = 14.17; P = 0.0005], due to the reduced burst number in session II in both groups regardless of trial [devaluation x trial x group: F(2,74) = 1.07; n.s.] (Fig 2, first row). Moreover, a statistically signifi-cant effect of the factorstrial [F(2,74) = 3.70; P = 0.029] and time [F(9,333) = 137.82; P<10−6] was revealed, with no significant effect of the factorgroup [F(1,37) = 2.74; n.s.]. A more clear picture emerged from the comparisons between the time course data based on the significant 4 ways inter-action [F(18,666) = 1.98; P = 0.008] (Fig 3, 2ndand 3rdrow). In trial 1, exposure to the diluted solu-tion in G2 (session II) resulted in a within-session decline which resulted in a significant reducsolu-tion with respect to the response to the 10% solution (session I) from the 3rdto the 6thtime bin (Fig 2, 3rdrow, left panel). The within session-decline in response to sucrose dilution was apparent also in the comparison between G1 and G2 in session II of the trial I, due to a significant reduction of burst number from the 2ndto the 5thtime bin, while a superimposable time course of the responses of the two groups was observed in session I, with both groups exposed to the 10% solution (Fig 2, left panels). In trial 2, a within-session decline of burst number in response to sucrose dilution was observed in both groups. However, in G1, which was at its first exposure to reward devaluation, the difference with respect to the 10% solution was apparent starting from the 3rdtime bin, as observed in G2 at its first exposure (trial 1), while in G2, now at its second exposure to devaluation, the difference between the two solutions was anticipated, starting at the 2ndtime bin (2ndand 3rd rows mid panels). In trial 3 the difference between the response to the two solutions (session Ivs session II within each group) was apparent since the very beginning of the session in both groups (Fig 2, 2ndand 3rdrows right panels). The pattern emerging from these results shows a within-ses-sion decline of burst number in response to sucrose dilution, which is very clear at the first episode of reward devaluation in both groups, but the reduction of the response level appears to be antici-pated following repeated experiences of reward devaluation.
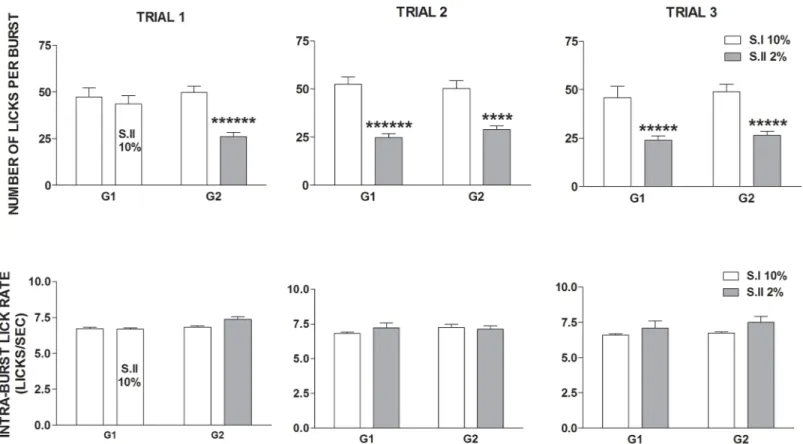
ANOVA of the whole session number of licksper burst data showed a statistically signifi-cant effect ofdevaluation [F(1,37) = 87.81; P<10−6], with no significant effects ofgroup [F (1,37) = 0.07; n.s.] andtrial [F(2,74) = 2.32; n.s.]. Moreover, a statistically significant interac-tion betweendevaluation, trial and group was revealed [F(2,74) = 8.26; P = 0.0005]. F-test for
contrasts showed a statistically significant reduction of this parameter in response to the 2% sucrose solution, in both groups and in all trials (Fig 3, top panels).
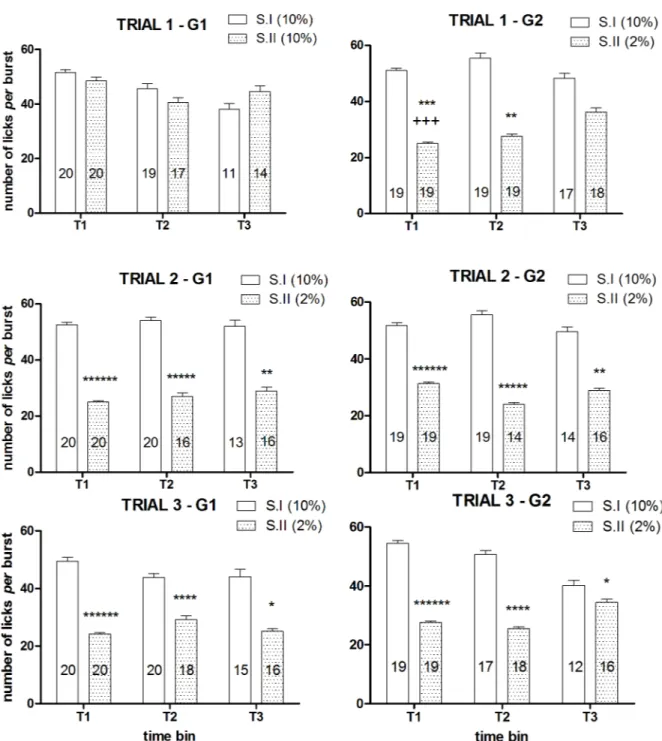
ANOVA of the within-session time course of number of licksper burst of the first devaluation trial showed a significant main effect of the factordevaluation [F(1, 23) = 8.58, P = 0.007] and a significant interaction betweendevaluation and group [F(1, 23) = 15.86, P = 0.00058], due to a reduced burst size after reward devaluation in the group G2, with no 3 ways interaction between these two factors andtime [F(2, 46) = 1.62, n.s.]. ANOVA of the data of the first two time bins (T1, T2) revealed a significant interaction between the factorsgroup and devaluation [T1: F(1, 37) = 17.82, P = 0.00015; T2: F(1, 33) = 8.07, P = 0.0076]. Post-hoc analysis (Newman-Keuls) showed a statistically significant reduction of the number of lickper burst in the group G2 in time bins T1 and T2. ANOVA of the data of the third time bin (T3) failed to show statistically significant effects [group: F(1, 24) = 0.02, n.s.; devaluation: F(1, 24) = 0.68, n.s.; devaluation × group: F(1, 24) = 2.76,
Fig 1. Experiment 1. Effect of exposure to sucrose dilution on lick number. Comparison between session I (S.I) and session II (S.II) across the three
trials in the groups G1 and G2. Top panels show the total values, mid and bottom panels show the time course of the response in G1 and G2, respectively. Values represent the mean±S.E.M. from 19–20 subjects. S.I vs S.II in G2:*P<0.05,******P<10−6; G1 vs G2 in S.I: +<0.05; G1 vs G2 in S.II: §§§§§P<10−5 (ANOVA followed by F-test for contrasts; straight lines indicate contrasts involving consecutive time points).
https://doi.org/10.1371/journal.pone.0177705.g001
n.s.]. The analysis of the within-session time course of number of licksper burst of the second and third devaluation trials showed very similar results, with only the factordevaluation resulting in a statistically significant effect in all analyses, due to the reduced values observed in both groups in all time bins after reward devaluation [trial 2, within-session time course analysis: F(1, 17) = 49.28, P<10−5, T1: F(1, 37) = 62.65, P<10−6, T2: F(1, 28) = 31.41, P<10−5, T3: F(1, 21) = 11.24, P = 0.003; trial 3: within-session time course analysis: F(1, 20) = 37.40, P<10−5, T1: F(1, 37) = 62.53, P<10−6, T2: F(1, 32) = 21.33, P = 0.00006, T3: F(1, 22) = 5.06, P = 0.034] (Fig 4).
ANOVA of the intra-burst lick rate data showed a statistically significant effect of devalua-tion [F(1,37) = 6.58; P = 0.014], due to a slight increase of this parameter in response to the 2% sucrose solution, with no statistically significant effects oftrial [F(2,74) = 0.27; n.s.] and group
Fig 2. Experiment 1. Effect of exposure to sucrose dilution on burst number. Comparison between session I (S.I) and session II (S.II) across the three
trials in the groups G1 and G2. Top panels show the total values, mid and bottom panels show the time course of the response in G1 and G2, respectively. Values represent the mean±S.E.M. from 19–20 subjects. S.I vs S.II in G2:*P<0.05,**P<0.01,*****P<10−5; G1 vs G2 in S.II: §§§P<0.001 (ANOVA followed by F-test for contrasts; straight lines indicate contrasts involving consecutive time points).
[F(1,37) = 2.33; n.s.] and no significant interaction between the three factors [group x trial x devaluation: F(2,74) = 1.08; n.s.] (Fig 3, bottom panels).
Since ANOVA of the latency to the first lick data failed to show any statistically significant main effect or relevant interactions [group: F(1,37) = 0.014, n.s.; trial: F(2,74) = 2.7, n.s.; devalu-ation: F(1,37) = 0.29, n.s.; interaction between the three factors: F(2,74) = 0.24; n.s.], we report the whole experiment mean value for each group: 14.95± 0.43 (G1) and 14.61 ± 0.45 (G2).
Experiment 2
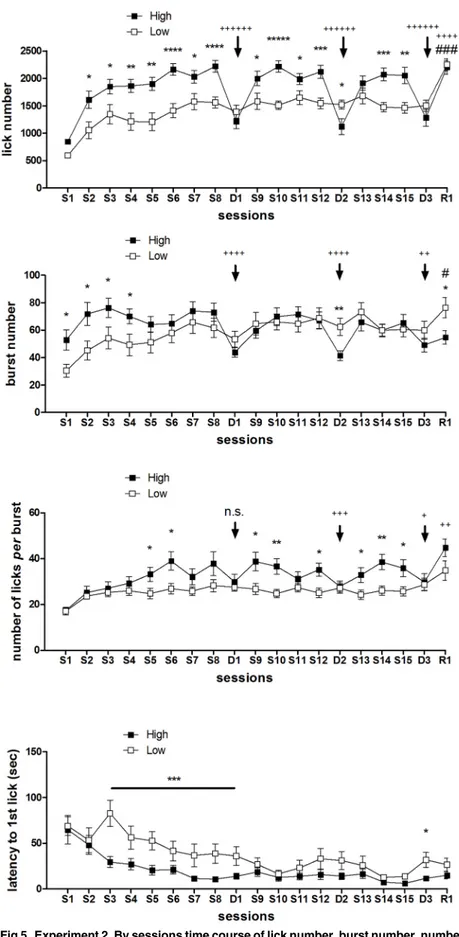
By sessions data analysis. ANOVA of lick number data (Fig 5, top panel) showed a statis-tically significant effect ofgroup [F(1,33) = 10.53; P = 0.002] and session [F(18,594) = 21.10; P<10−6], with a statistically significant interaction between the two factors [F(18,594) = 6.06; P<10−6]. Further analysis (F-tests for contrasts) revealed that the high concentration group showed a higher lick number level, compared with the low concentration group, from the sec-ond session (S2) up till the end of the experiment. Moreover, a reduction in the lick number was observed in this group when exposed to the lower sucrose concentration in the three devaluation sessions (D1, D2, D3). Conversely, an increased lick number in the low concentra-tion group was observed in the last session, when exposed to the 10% concentraconcentra-tion (R1).
ANOVA of burst number data (Fig 5, 2ndpanel) showed a statistically significant effect of the factorsession [F(18,594) = 5.03; P<10−6] but notgroup [F(1,33) = 0.35; n.s.], with a statisti-cally significant interaction between the two [F(18,594) = 4.28; P<10−6]. The high concentra-tion group showed higher levels of burst number in the first four sessions (S1-S4), with
Fig 3. Experiment 1. Effect of exposure to sucrose dilution on the whole session number of licks per burst (top panels) and intra burst-lick rate (bottom panels). Comparison between session I (S.I) and session II (S.II) across the three trials in the groups G1 and G2. Values represent the mean±S.E. M. from 19–20 subjects.****P<10−4,*****P<10−5,******P<10−6(ANOVA followed by F-test for contrasts).
https://doi.org/10.1371/journal.pone.0177705.g003
statistically significant decrements when exposed to the 2% concentration in the three devalua-tion sessions (D1, D2, D3). Conversely, an increased burst number in the low concentradevalua-tion group was observed in the last session, when exposed to the 10% concentration (R1).
As for both lick number and burst number, the values recorded in the devaluation sessions in the high concentration group were not significantly different from the values for the 2%
Fig 4. Experiment 1. Effect of exposure to sucrose dilution on number of licks per burst: within-session time course (Experiment 1). Comparison between session I (S.I) and session II (S.II) across the three trials in the groups G1 (left panels) and
G2 (right panels). Values represent mean±S.E.M. The number of subjects for each mean value is indicated in the relative column. Effect of devaluation:*P<0.05,**P<0.01,****P<10−4,*****P<10−5,******P<10−6(ANOVA, main effect); G2 vs G1: ++P<0.01 (ANOVA followed by Newman-Keuls multiple comparison test).
Fig 5. Experiment 2. By sessions time course of lick number, burst number, number of licks per burst and latency to the first-lick (from top to bottom) in two groups of rats daily exposed to either a high
solution in the low concentration group at sessions D1 and D3, while, at session D2, they dropped even to a lower level.
ANOVA of the whole session number of licksper burst data (Fig 5, 3rdpanel) revealed a statistically significant effect of the factorsgroup [F(1,33) = 4.87; P = 0.03] and session [F (18,594) = 8.27; P<10−6], with a significant interaction between the two factors [F(18,594) = 2.27; P = 0.002]. F-tests for contrasts revealed a different response between the two groups starting at the 5thsession (S5): in the sessions from S5 to S15, in 8 time points out of 11, the high concentration group showed a significantly higher level of number of licksper burst. Exposure of the high concentration group to the 2% concentration resulted in a decrement of this measure in the 2ndand 3rddevaluation sessions (D2, D3), but not in the first one (D1). Exposure of the low concentration group to the 10% concentration (R1) failed to induce statistically significant effects.
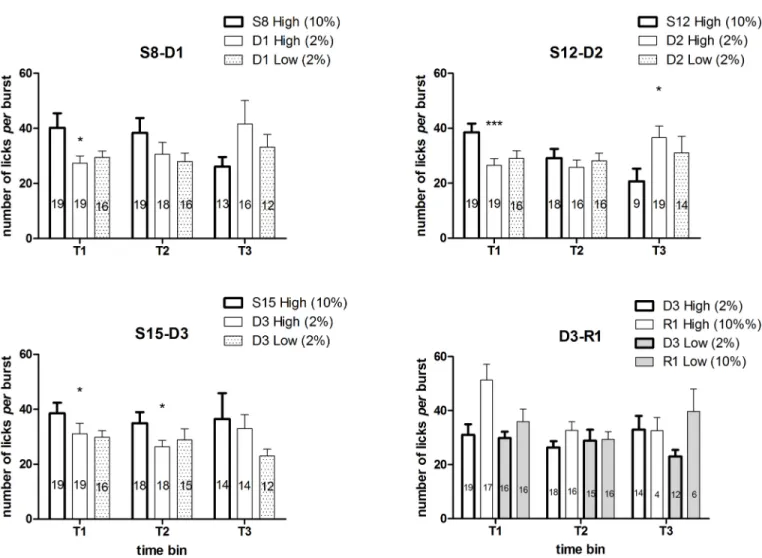
ANOVA of the within-session time course of number of licksper burst of the first two devaluation trials in the high concentration group [S8 (10%) vs D1 (2%), S12 (10%) vs D2 (2%)] showed a significant interaction between the factorsdevaluation and time [S8 vs D1: F(2, 18) = 4.49, P = 0.026; S12 vs D2: F(2, 12) = 8.89, P = 0.0042], due to a reduction in burst size in the course of the session at S8 and S12 (exposure at 10%) compared to a specular increase at D1 and D2 (exposure at 2%). Consistently, the ANOVA of the single time bins showed a sig-nificant main effect ofdevaluation at T1 in both trials [S8 vs D1: F(1, 18) = 6.09, P = 0.02; S12 vs D2: F(1, 18) = 20.7, P = 0.00024], due to a reduction of burst size at D1 and D2, with no effect in the successive time bins in the trial S8-D1 [T2: F(1, 17) = 2.2, n.s.; T3: F(1, 10) = 2.2, n.s.], and a significant main effect in the third time bin (T3) in the trial S12-D2 [F(1, 8) = 7.9, P = 0.022], due to an increased burst size at D2. ANOVA of the within-session time course of number of licksper burst of the third devaluation trial in the high concentration group [S15 (10%) vs D3 (2%)] failed to show any statistically significant effects or interactions between the factors. Consistently with the first two trials, ANOVA of the single time bins showed a signifi-cant effect ofdevaluation in the first two time bins [T1: F(1, 18) = 4.89, P = 0.04; T2: F(1, 16) = 5.1, P = 0.03], due to a reduced burst size at D3, but not in the third [T3: F(1, 10) = 0.34, n.s.] (Fig 6).
ANOVA of the within-session time course of number of licksper burst of the first succes-sive negative contrast (High concentration vs Low concentration group, both exposed to 2% at session D1) showed only a significant effect oftime [F(2, 50) = 4.75, P = 0.012], due to the increased burst size in the last time bin (T3), regardless of group [group × time: F(2, 50) = 0.6, n.s.]. The analyses of the within-session time course of the number of licksper burst relative to the 2nd(D2) and the 3rd(D3) successive negative contrasts failed to show any statistically sig-nificant effect, as well as the ANOVA of the single time bins of all the three contrast sessions. (Here we report the results of the analysis relative to T3 at D3, which at visual inspection is the only comparison which might look like significant: F(1,24) = 2.83, P = 0.105, n.s.)(Fig 6).
ANOVA of the within-session time course of number of licksper burst of the upshift trial (High concentration and Low concentration group with 2% and 10% sucrose at sessions D3
(10%) or a low (2%) concentration sucrose solution. In D1, D2 and D3 both groups were exposed to 2%,
while in R1 to 10%. Values represent the mean±S.E.M. from 16–19 subjects. Arrows indicate the devaluation episodes. High vs. Low concentration group:*P<0.05,**P<0.01,***P<0.001,****P<10−4,*****P<10−5, ******P<10−6. Within-subjects effect of devaluation, comparison between the devaluation sessions and the immediately preceding sessions in the High concentration group: +P<0.05, ++P<0.01, +++P<0.001, +++ +P<10−4, ++++++P<10−6. Within-subjects effect of switch from 2% to 10%, comparison between R1 session and the immediately preceding session in the Low concentration group: #P<0.05, ###P<0.001 (ANOVA followed by F-test for contrasts).
and R1, respectively) showed only a significant effect ofupshift [F(1, 5) = 22.22, P = 0.0052], due to the increased burst size after upshift from 2% to 10% sucrose concentration, regardless ofgroup [group × upshift: F(1, 5) = 0.67, n.s.]. Moreover, a significant effect of upshift
(increased burst size at session R1) was revealed in the first time bin [F(1, 31) = 9.002, P = 0.0052], again, with no interaction with the factorgroup [F(1, 31) = 2.59, n.s.]. No statisti-cally significant effects or interactions were revealed by the analysis of the data relative to the successive time bins.
ANOVA of the intra-burst lick rate data failed to show a statistically significant effect of the factorgroup [F(1,33) = 3.86; n.s.], while a statistically significant effect of session was revealed [F(18,594) = 2.11; P = 0.004], due to slight differences between the sessions. The interaction between the two factors was not significant [F(18,594) = 0.43; n.s.](Table 2).
ANOVA of the latency to the 1stlick data (Fig 5, bottom panel) showed a statistically signifi-cant effect of the factorsgroup [F(1,33) = 8.56; P = 0.006] and session [F(18,594) = 10.17; P<10−6], with a significant interaction between the two [F(18,594) = 1.72; P = 0.03]. F-tests for
Fig 6. Experiment 2. Effect of devaluation and of successive negative contrasts on number of licks per burst: within-session time course.
Values represent mean±S.E.M. relative to (i) the session immediately preceding the devaluation session in the high concentration group (left column), and the (ii) high (central column) and (iii) low concentration group (right column) in the devaluation session. (i) vs (ii): devaluation effect; (ii) vs (iii): contrast effect. The number of subjects for each mean value is indicated in the relative column. Effect of devaluation:*P<0.05,***P<0.001 (ANOVA, main effect).
https://doi.org/10.1371/journal.pone.0177705.g006
contrasts revealed significantly lower latencies for the high concentration group from the 3rd session (S3) up till the first devaluation session (D1). For the remaining part of the experiment no differences between the two groups were observed, with the exception of the session D3 (again, with the high concentration group showing a lower value).
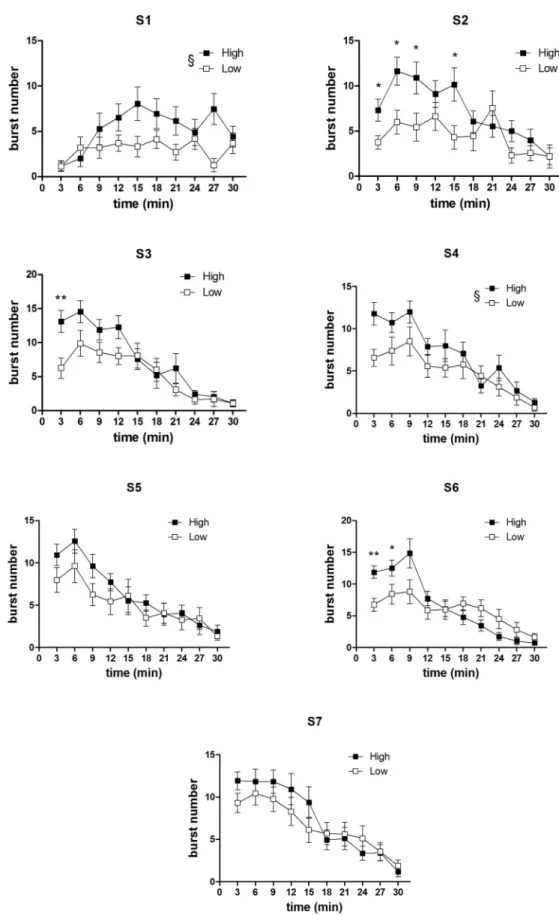
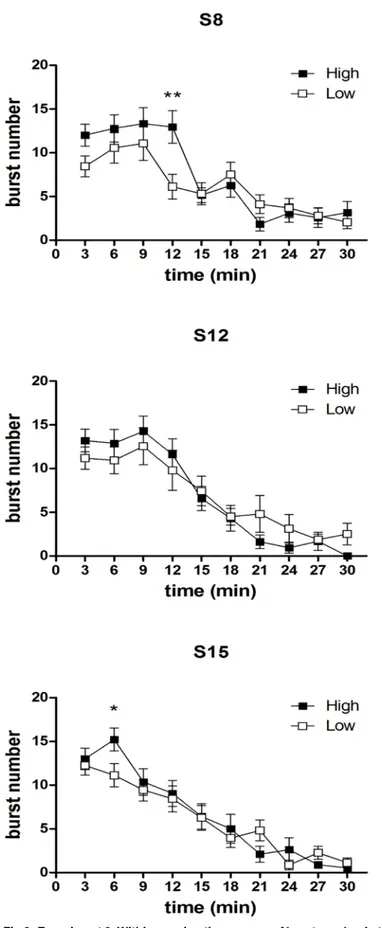
Within-session analysis of burst number time course. InFig 7andFig 8are reported the comparisons between the burst number within-session time course from the two concen-tration groups, relative to all the sessions preceding the first devaluation episode and the single sessions immediately preceding the other two devaluation episodes. In the first four sessions (Fig 7, S1-S4), a statistically significant effect of the factorgroup was present [S1: F(1,33) = 6.04, P = 0.019; S2: F(1,33) = 5.81, P = 0.021; S3: F(1,33) = 4.37, P = 0.044; S4: F(1,33) = 4.84, P = 0.044], due to the higher level of burst number in the high concentration group. In the 2nd and 3rdsessions, an interaction betweengroup and time was also present [S2: F(9,297) = 2.30, P = 0.16; S3: F(9,297) = 1.96, P = 0.04]. F-test for contrasts revealed that in both cases the differ-ence between the two groups exposed to the different concentration solutions was apparent since the beginning of the session. In the other sessions examined (the sessions from S5 to S7, Fig 7, and the single sessions immediately preceding the devaluation sessions, i.e. S8, S12, S15, Fig 8) no effect ofgroup was revealed [all F(1,33)<2.5, n.s.]. However, in three of these sessions (S6, S8, S15), a statistically significant interaction between the factorsgroup and time (involving also the factordevaluation in S8 and S15 data) was revealed [S6: F(9,297) = 4.63, P = 0.000009; S8: F(9,297) = 3.47, P = 0.00042; S15: F(9,297) = 2.51, P = 0.0087]. In one case (S6), F-tests for contrasts revealed a statistically significant difference between the two groups in favour of the high concentration group, which was apparent since the beginning of the session and lasted for first six minutes (Fig 7). In the other two cases, the difference in favour of the high concentra-tion group was limited to a single time bin (4thtime point for S8 and 2ndtime point for S15) (Fig 8).
Fig 9depicts the results of the devaluation trials (D1, D2, D3). In the high concentration group, the time course of the burst number response to a 2% concentration is compared to the time course of the immediately preceding session, with a 10% concentration. F-tests for con-trasts, performed on the basis of a three ways interaction between the between-group factor group and the within-group factors time and devaluation [F(9,297) = 3.47; P = 0.004], have shown that, in the first devaluation episode, a statistically significant difference in favour of the 10% concentration is apparent only since the 2ndtime point, and persists up till the fourth time point, thus resembling the response pattern of an extinction curve, as observed in Experi-ment 1. In the successive devaluation episodes [devaluation x time x group: D2: F(9,297) = 2.47, P = 0.009; D3: F(9,297) = 2.51, P = 0.008], a significant difference is apparent since the beginning of the session, consistently with the observations from Experiment 1, showing an anticipated decrease of burst number after repeated devaluation episodes.
Fig 10depicts the results of the upshift concentration trial (R1). The effect of the increase in sucrose concentration in the high and the low concentration group was very similar. Indeed, ANOVA showed a significant interaction betweentime and upshift [F(9, 279) = 10.19,
Table 2. Experiment 2. Whole experiment mean intra-burst lick rate, and lowest and highest mean single session values from the High and the Low concentration groups. Values represent the mean±S. E.M. from 16–19 subjects.
Group Whole experiment mean Intra-Burst Lick Rate
Lowest and highest mean single session value
High concentration 6.6±0.03 6.52±0.1–7.04±0.3
Low concentration 6.5±0.02 6.24±0.09–7.09±0.3
Fig 7. Experiment 2. Within-session time course of burst number in the first seven sessions (S1-S7): comparison between the High and Low concentration groups. Values represent the mean±S.E.M. from
P<10−6], with no three ways interaction between these factors andgroup [F(9, 279) = 1.22, n.s.], due to an increased burst number at the beginning of the R1 session,with respect to the preceding session (D3), in both groups. The lack of a significant interaction betweengroup andupshift [F(1, 31) = 1.7, n.s.] indicates that the overall effect of the concentration upshift did not result in significant differences between the two groups. However, it should be recalled that in the whole experiment data analysis a statistically significant difference between the groups at session R1was revealed, based on the group× session interaction (see above, By ses-sion data analysis).
Discussion
Consistently with earlier findings, the results of Experiment 1 showed that, in animals with daily access to a 10% sucrose solution, reward devaluation obtained by reducing the sucrose concentration solution to 2% resulted in a reduced ingestion, as indicated by the reduced lick number [see8], mainly due to the reduction of the initial lick rate and of the whole session mean size of licking bursts, but also of their whole session number [2,3]. Moreover, both group G1 and group G2 responded to reward devaluation showing a within-session decrement of burst number, with the response rate decreasing only after contact with the devalued reward, which was observed in the first devaluation episode for G1 (trial 2), and in the first two devaluation episodes for G2 (trials 1 and 2). This response pattern was apparent also in the comparison between the response of group G2 to the 2% concentration and the response of group G1 to 10%, in the same experimental session (Fig 2: Trial 1 S.II). The results from Exper-iment 2 provided a replication of these findings. Indeed, all three devaluation sessions in the high concentration group (D1, D2, D3 compared to the immediately preceding session) resulted in a reduced lick number due to a reduction of the whole session size and number of licking bursts (with the exception of session D1, with a significant reduction of burst size observed in the 1st9-min time bin but not in the whole session data). Most importantly in rela-tion to the aim of the present study, a within-session decrement of burst number occurring after the contact with the reward was observed in the first devaluation session (D1).
The most relevant comparison in relation to the aim of Experiment 2 was the comparison between the within-session burst number time course of the highversus low concentration group. We examined all the sessions preceding the 1stdevaluation episode, and the single ses-sions preceding the successive two devaluation episodes (Figs6and7). In the first four ses-sions, when a significant difference in the session total burst number was present–which is the condition characterising all devaluation episodes–a difference in favour of the high concentra-tion group emerged since the beginning of the session, with the possible excepconcentra-tion of the first session. Indeed, the inspection of the data from such session shows both groups with very low burst number levels at the beginning of the session, as one would expect in subjects at their first experience with the apparatus, with the high concentration group increasing more steeply and eventually reaching a higher level, as one would expect with a larger reward. However, these within-session differences were not supported by a statistically significant interaction between the relevant factors (group and time). When the difference in total values was not pres-ent, the within-session burst number time courses of the high and of the low concentration group were virtually super-imposable. (With the exception of three sessions: in one session [S6], a significant difference in favour of the high concentration group was present, again, since the beginning of the session, and lasted for six minutes; in the other two sessions [S8 and 16–19 subjects.*P<0.05,**P<0.01 (Comparison between corresponding time bins, ANOVA followed by F-test for contrasts); §P<0.05 (ANOVA, main effect of group).
Fig 8. Experiment 2. Within-session time course of burst number in the sessions immediately preceding the devaluation sessions (S8, S12, S15): comparison between the High and Low
S15], it was limited to a single time point.) Hence, these results show that the difference in the burst number within-session time course in two groups of subjects in response to two different sucrose concentrations, i.e. in a condition which does not involve changes in the reward value, is very different from the extinction pattern observed with reward devaluation.
Thus, the results from this study, taken together with the results of our previous studies on the effect of dopamine D1- and D2-like receptor antagonists on licking microstructure [8,9], provide evidence confirming the proposed interpretation: the within-session decrement of the burst-number time course occurring after the contact with the reward, observed with dopa-mine D2-like receptor blockade, can be interpreted as an extinction-like effect, in that it resem-bles the response pattern observed after reward devaluation. Moreover, dopamine D1-like receptor blockade, which results in a lower level of this measure apparent since the beginning of the session, reproduces the difference observed comparing the response to either a high or a low sucrose concentration solution in separate groups of rats, i.e. in a condition which does not involve changes in the reward value, but yields different levels of behavioural activation. It should be stressed that while the present data have important implications for the interpreta-tion of the results of our previous studies on the role of dopamine in behavioural activainterpreta-tion through the analysis of licking microstructure, the investigation of the role of dopamine–as well as of any other biochemical substrate or neural system–in the ingestive behavioural responses to shifts in the reward value, such as the responses described in the present study, requires further studies involving experimental manipulations of the relevant neural substrates.
In both experiments (see Figs2and9), re-exposure to sucrose dilution after just one or two devaluation episodes failed to produce a clear within-session extinction pattern, but resulted in a decrease of burst number since the beginning of the session (Exp. 1, both groups: trial 3; Exp. 2, High concentration group: S12 vs D2, S15 vs D3). Such an anticipated response might depend on a learning process leading to a more rapid update of the level of activation of the emission of licking bursts in response to reward devaluation. According to this interpretation, in the first devaluation episode, the licking burst emission response undergoes (partial) extinc-tion: it starts as a response which is appropriate for (and was reinforced by) the previous con-tacts with the 10% solution; following the contact with the devalued reward (2% solution), its level of activation is reduced to that which is appropriate for 2%. Due to the learning process, in the successive contact with the devalued reward, the switch from the 10% to the 2% appro-priate response activation level is more rapid, leading to a low burst number level since the beginning of the session. However, experiments specifically designed to the scope are neces-sary to test this interpretation.
In Experiment 1 (Fig 4), the investigation of the effect of reward devaluation on burst size at different times within the session, showed a reduction of this measure in all three time bins, with the exception of trial 1 for group G2, with a lack of a statistically significant effect in the 3rdtime bin. In Experiment 2, burst size reduction was consistently observed in the 3 devalua-tion trials (S8 vs D1, S12 vs D2, S15 vs D3 in the High concentradevalua-tion group) only in the first time bin (at session D3 it was present also in the 2ndtime bin). In the 3rdtime bin of session D2, burst size was increased. Thus, the results from Experiment 2 might suggest a within-ses-sion attenuation of the effect of reward devaluation on burst size. Such an effect appears to depend (i) to the trend in decrease of burst size over time in the session preceding devaluation, when the animals are exposed to the familiar concentration (10%), and (ii) to a specular
concentration groups. Values represent the mean±S.E.M. from 16–19 subjects.*P<0.05,**P<0.01 (ANOVA followed by F-test for contrasts).
Fig 9. Experiment 2. Within-session time course of burst number in the three devaluation trials (S8 vs D1, S12 vs D2, S15 vs D3) in the High concentration group. Values represent the mean±S.E.M. from 16– 19 subjects.*P<0.05,**P<0.01,***P<0.001****P<0.0001 (ANOVA followed by F-test for contrasts).
Fig 10. Experiment 2. Within-session time course of burst number in the concentration upshift trial (D3 vs R1). Values represent the mean±S.E.M. from 16–19 subjects.*P<0.05,**P<0.01,***P<0.001 (ANOVA followed by F-test for contrasts).
increase in burst size in the devaluation session (these patterns are apparent in the first two devaluation sessions). However, considering the lack of full consistency between the results from the two experiments, no conclusions can be drawn on this matter on the basis of the pres-ent set of data, which simply shows that, in our experimpres-ental conditions, the effect of reward devaluation of reducing burst size is more reliably observed early in the session.
The comparison between the whole session data of the response of the highversus low con-centration group to two different sucrose concon-centrations, 10% vs 2%, respectively (Experiment 2,Fig 5), showed significant differences since the first session, in animals at their first experi-ence with the sweet solutions, with a higher burst number, but not burst size, in the high con-centration group. The difference in lick number, which is proportional to ingested volume [8], with higher levels in the high concentration group, emerged in the second session and lasted up to the end of the experiment, and it was accounted for by a difference in burst number up to the 4thsession, and by a difference mainly in burst size from the 5thsession on. Both groups showed a progressive increase in burst number across sessions, with a more rapid increase in the high concentration group, and with both groups eventually reaching the same (relatively stable) level after a week. The time course of the latency to the 1stlick values across sessions showed both groups at the same level in the 1sttwo sessions. The high concentration group val-ues progressively decreased across the first week sessions, reaching a low value which remained stable up to the end of the experiment. The decline of the values of the low concentration group was less steep, reaching the level of the high concentration group from the 9thsession up to the end of the experiment (with the exception of session D3, with the low concentration group showing a slight but statistically significant increase with respect to the high concentra-tion group). The difference between the two groups in the speed of the progressive increase in burst number across sessions, and of the almost specular progressive reduction of latency to the 1stlick, reflects the different reinforcing effect of the two sucrose concentrations. Thus, these results show that the response to reinforcement of burst number across sessions is similar to that of the response latency, which, in a number of experimental paradigms, is considered as a measure of behavioural activation [6,31,32].
The increased burst size observed from the 5thsession in the high concentration group is due to a progressive increase of this parameter across sessions, which might depend, at least in part, by an habituation process, possibly consisting in a gradual overcome of the inhibitory feed-back provided by novelty of taste [33]. The higher burst size was crucial in leading to the higher overall intake (lick number) in this group. These results also suggest that burst number might reflect the effect of the evaluation process occurring during the consummatory transac-tion with the reward more promptly than burst size.
The comparison between the whole session data of the response of the highversus low con-centration group to the low sucrose concon-centration solution (Experiment 2, D1, D2, D3.Fig 5) revealed the successive negative contrast effect only in session D2: indeed, the intake of the 2% solution, revealed by the lick number, was reduced in the high concentration group, subjected to down-shift in sucrose concentration, with respect to the “unshifted” low concentration group. This reduction was entirely due to a lower level of burst number. No differences in burst size between the two groups were found (Fig 5, whole session, andFig 6, time bins). The failure to observe the contrast effect more robustly might depend on the sucrose concentra-tions used in our experiments. Indeed, most experiments on successive negative contrast with sucrose use 32% as the high concentration and 4% as the low concentration [29,30], or 1M vs 0.1M [28], alternatively. With these concentrations one obtains a higher degree of dilution (1/ 8-1/10) compared to our experiment (1/5), providing a stronger reward devaluation, and a more concentrated low concentration solution, which might support a higher response level in the low concentration group.
The results of the upshift trial showed that exposure to the 10% solution in R1 yielded an increased lick number both in the high and in the low concentration group, with respect to the previous session with 2% (D3), mainly due to increased whole session burst size in the high concentration group and to increased whole session burst number in the low concentration group. The analysis of the results of the single time bins suggests that the increase in burst size after the concentration upshift is accounted for by the response early in the session. The analy-sis of the within-session time course of burst number showed a similar response pattern for both groups, characterised by an increased response at the beginning of R1 session with respect to D3. The comparison between the two groups at session R1 showed a higher burst number in the low concentration group, paralleled by a lower (but the difference was not sta-tistically significant) burst size value, with the result that lick number did not differ between the two groups. These results show that, while responding to an increase in the reward value, the level of emission of licking bursts is immediately updated to the level which is appropriate for the increased value reward. This is the opposite with respect to devaluation, with the response persisting for several minutes before dropping to a lower level. Thus, these observa-tions provide support to the interpretation of burst number as a measure of behavioural activa-tion. Moreover, this makes sense in adaptive terms. Indeed, it might be advantageous to persist in a response which is not particularly demanding in terms of effort while dealing with a deval-ued reward, since small reductions in the reward value might be compensated by an increased response rate [19], while there is no possible gain in persisting with a low response rate while dealing with a reward with an increased value.
In Experiment 1, we observed a slight increase in the intra-burst lick rate after reward devaluation, while in Experiment 2 we observed slight differences in this measure between ses-sions (regardless of group). This might seem somewhat surprising. Indeed, the rhythm of the tongue movements while licking is extremely stable, depending on a brainstem Central Pattern Generator (CPG) the activity of which can occur without proprioceptive feedback and without descending input from the cortex [34]. However, very small changes of this parameter had been previously observed in response to experimental manipulations not involving drugs (which can have direct effects on CPG neurons). For example, in rats licking for NaCl solu-tions, the intra-burst lick rate was influenced by NaCl concentration and by sodium-depletion [23]. It might be worth noting that such effects are very small and have, if any, negligible effects on intake.
The results of this study might provide further elements for the interpretation of the effects of either drugs or other experimental manipulations on ingestive behaviour. Based on the lack of effect on burst size and initial lick rate, two previous studies reported the failure to observe anhedonic effects after administration either of the dopamine D2-like receptor antagonist eti-clopride [35] or of the opioid antagonist naltrexone [36]. However, a within-session decrement of lick number was observed in both studies, which, in absence of effects on burst size, can be explained only by a within-session burst number time course with a similar pattern. The reduction of burst size and initial lick rate are considered as signs revealing anhedonia because these effects were observed after sucrose dilution, i.e. after reduction of the reward value [2–4, 7]. Here we provide evidence that there is another distinctive feature which characterises the licking response to reward devaluation: the within-session decrement of burst number after the contact with the devalued reward. Incidentally, an independent replication of our previous finding on the effect of dopamine D2-like receptor blockade on licking microstructure might be provided by one of the two cited studies, which was performed in a different species (mice), with a different dopamine D2-like receptor antagonist (eticlopride) and a different route of administration (lateral ventricle infusion)[35].
In conclusion, these results show that the analysis of burst number, but not of burst size, reveals a specific activation pattern in response to reward devaluation, which differs from the pattern observed comparing the response to two different sucrose concentrations in separate groups of subjects. These response patterns are paralleled by similar ones induced by either D2-like (extinction mimicry) or D1-like (different activation level) receptor antagonism [8,9]. Thus, these observations might bear relevance in relation to the ongoing debate on the role of dopamine on goal-directed behaviour [3,6,8,9,17,19,20,23–25,35–39]. Moreover, this con-tribution to the characterisation of the analysis of licking microstructure might help to better define the experimental measures in behaviourally (and psychologically) meaningful func-tional terms. Here we provide evidence in support of the interpretation of burst number as a measure of behavioural activation, whose analysis might reveal the evaluation process deter-mining its emission level. Finally, these findings suggest that when analysing the effects of either drugs or taste manipulations on licking microstructure, the within-session time course of this measure should be taken into account, and provide further support to the analysis of licking microstructure as a potentially important source of behavioural substrates, relevant for the investigation of the mechanisms underlying behavioural activation and the related evalua-tion processes.
Author Contributions
Conceptualization: PSD AG. Formal analysis: PSD AG. Funding acquisition: PSD. Investigation: AG. Project administration: PSD. Resources: PSD. Supervision: PSD. Visualization: PSD AG. Writing – original draft: PSD.
References
1. Davis JD. The microstructure of ingestive behavior. Ann NY Acad Sci. 1989; 575: 106–21. PMID:
2699182
2. Smith GP. John Davis and the meanings of licking. Appetite. 2001; 36: 84–92.https://doi.org/10.1006/ appe.2000.0371PMID:11161348
3. Schneider LH, Davis JD, Watson CA, Smith GP. Similar effect of raclopride and reduced sucrose con-centration on the microstructure of sucrose sham feeding. Eur J Pharmacol. 1990; 186: 61–70. PMID:
2282936
4. Davis JD, Smith GP. Analysis of the microstructure of the rhythmic tongue movements of rats ingesting maltose and sucrose solutions. Behav Neurosci. 1992; 106: 217–28. PMID:1554433
5. Spector AC, Klumpp PA, Kaplan JM. Analytical issues in the evaluation of food deprivation and sucrose concentration effects on the microstructure of licking behavior in the rat. Behav Neurosci. 1998; 112: 678–94. PMID:9676983
6. Berridge KC. The debate over dopamine’s role in reward: the case for incentive salience. Psychophar-macol. 2007; 191: 391–431.
7. Higgs S, Cooper SJ. Evidence for early opioid modulation of licking responses to sucrose and intralipid: a microstructural analysis in the rat. Psychopharmacol. 1998; 139: 342–55.
8. D’Aquila PS. Dopamine on D2-like receptors “reboosts” dopamine D1-like receptor -mediated beha-vioural activation in rats licking for sucrose. Neuropharmacol. 2010; 58: 1085–96.
9. Galistu A, D’Aquila PS. Dopamine on D2-like receptors “reboosts” dopamine D1-like receptor mediated behavioural activation in rats licking for a isotonic NaCl solution. Psychopharmacol. 2013; 229: 357– 366.
10. Geary N, Smith GP. Pimozide decreases the positive reinforcing effect of sham fed sucrose in the rat. Pharmacol Biochem Behav. 1985; 22: 787–90. PMID:2989944
11. Sclafani A, Ackroff K. The relationship between food reward and satiation revisited. Physiol Behav. 2004; 82: 89–95.https://doi.org/10.1016/j.physbeh.2004.04.045PMID:15234596
12. Sclafani A, Nissenbaum JW. Oral versus postingestive origin of polysaccharide appetite in the rat. Neu-rosci Biobehav Rev. 1987; 11: 169–72. PMID:3614782
13. Smith GP. Accumbens dopamine mediates the rewarding effect of orosensory stimulation by sucrose. Appetite. 2004; 43: 11–13.https://doi.org/10.1016/j.appet.2004.02.006PMID:15262012
14. Weingarten HP, Watson SD. Sham feeding as a procedure for assessing the influence of diet palatabil-ity on food intake. Physiol Behav. 1982; 28: 401–07. PMID:7079355
15. D’Aquila PS, Galistu A. Possible role of dopamine D1-like and D2-like receptors in behavioural activa-tion and evaluaactiva-tion of response efficacy in the forced swimming test. Neuropharmacol. 2012; 62: 1717–29.
16. Galistu A, Modde C, Pireddu MC, Franconi F, Serra G, D’Aquila PS. Clozapine increases reward evalu-ation but not overall ingestive behaviour in rats licking for sucrose. Psychopharmacol. 2011; 216: 411– 20.
17. Genn RF, Higgs S, Cooper SJ. The effects of 7-OH-DPAT, quinpirole and raclopride on licking for sucrose solutions in the non-deprived rat. Behav Pharmacol. 2003; 14: 609–17.https://doi.org/10. 1097/01.fbp.0000104032.08123.4cPMID:14665978
18. Liao RM, Ko MC. Chronic effects of haloperidol and SCH23390 on operant and licking behaviors in the rat. Chin J Physiol. 1995; 38: 65–73. PMID:8697900
19. Wise RA. Dopamine, learning and motivation. Nat Rev Neurosci. 2004; 5: 483–94.https://doi.org/10. 1038/nrn1406PMID:15152198
20. Wise RA, Spindler J, deWit H, Gerberg GJ. Neuroleptic-induced "anhedonia" in rats: pimozide blocks reward quality of food. Science. 1978; 201: 262–4. PMID:566469
21. Sanger DJ. Response decrement patterns after neuroleptic and non-neuroleptic drugs. Psychopharma-col. 1986; 89: 98–104.
22. Schneider LH, Watson CA, Davis JD, Smith GP. Microstructural analysis of the inhibition of sucrose sham feeding by SCH 23390. Appetite. 1989; 12: 236.
23. D’Aquila PS, Rossi R, Rizzi A, Galistu A. Possible role of dopamine D1-like and D2-like receptors in behavioural activation and "contingent" reward evaluation in sodium-replete and sodium-depleted rats licking for NaCl solutions. Pharmacol Biochem Behav. 2012; 101: 99–106.https://doi.org/10.1016/j. pbb.2011.12.004PMID:22197709
24. Galistu A, D’Aquila PS. Effect of the dopamine D1-like receptor antagonist SCH 23390 on the micro-structure of ingestive behaviour in water-deprived rats licking for water and NaCl solutions. Physiol Behav. 2012; 105: 230–3.https://doi.org/10.1016/j.physbeh.2011.08.006PMID:21864553
25. Canu ME, Carta D, Murgia E, Serra G, D’Aquila PS. Dopamine on D2-like receptors is involved in reward evaluation in water-deprived rats licking for NaCl and water. Pharmacol Biochem Behav. 2010; 96: 194–97.https://doi.org/10.1016/j.pbb.2010.05.004PMID:20460136
26. Gramling SE, Fowler SC, Collins KR. Some effects of pimozide on nondeprived rats licking sucrose solutions in an anhedonia paradigm. Pharmacol Biochem Behav. 1984; 21: 617–24. PMID:6150496
27. Gramling SE, Fowler SC. Some effects of pimozide and of shifts in sucrose concentration on lick rate, duration, and interlick interval. Pharmacol Biochem Behav. 1986; 25: 219–22. PMID:3749229
28. Grigson PS, Spector AC, Norgren R. Microstructural analysis of successive negative contrast in free-feeding and deprived rats. Physiol Behav. 1993; 54: 909–16. PMID:8248382
29. Jime´nez-Garcı´a AM, Ruı´z-Leyva L, Cenda´n CM, Torres C, Papini MR, Moro´n I. Hypoalgesia Induced by Reward Devaluation in Rats. PLoS One. 2016; 11(10):e0164331.https://doi.org/10.1371/journal. pone.0164331PMID:27764142
30. Austen JM, Strickland JA, Sanderson DJ. Memory-dependent effects on palatability in mice. Physiol Behav. 2016; 167: 92–99.https://doi.org/10.1016/j.physbeh.2016.09.001PMID:27614065
31. Salamone JD, Cousins MS, Snyder BJ. Behavioral functions of nucleus accumbens dopamine: empiri-cal and conceptual problems with the anhedonia hypothesis. Neurosci Biobehav Rev. 1997; 21: 341– 59. PMID:9168269
32. Salamone JD, Yohn SE, Lo´pez-Cruz L, San Miguel N, Correa M. Activational and effort-related aspects of motivation: neural mechanisms and implications for psychopathology. Brain. 2016; 139: 1325–47.
https://doi.org/10.1093/brain/aww050PMID:27189581
33. Lin JY, Amodeo LR, Arthurs J, Reilly S. Taste neophobia and palatability: the pleasure of drinking. Phy-siol Behav. 2012; 106: 515–9.https://doi.org/10.1016/j.physbeh.2012.03.029PMID:22484563
34. Moore JD, Kleinfeld D, Wang F. How the brainstem controls orofacial behaviors comprised of rhythmic actions. Trends Neurosci. 2014; 37: 370–80.https://doi.org/10.1016/j.tins.2014.05.001PMID:
24890196
35. Robles CF, Johnson AW. Disruptions in effort-based decision-making and consummatory behavior fol-lowing antagonism of the dopamine D2 receptor. Behav Brain Res. 2017; 320: 431–39.https://doi.org/ 10.1016/j.bbr.2016.10.043PMID:27984049
36. Frisina PG, Sclafani A. Naltrexone suppresses the late but not early licking response to a palatable sweet solution: opioid hedonic hypothesis reconsidered. Pharmacol Biochem Behav. 2002; 74: 163– 72. PMID:12376164
37. Salamone JD, Correa M, Mingote SM, Weber SM. Beyond the reward hypothesis: alternative functions of nucleus accumbens dopamine. Curr Opin Pharmacol. 2005; 5: 34–41.https://doi.org/10.1016/j. coph.2004.09.004PMID:15661623
38. Salamone JD, Correa M, Farrar AM, Nunes EJ, Pardo M. Dopamine, behavioral economics, and effort. Front Behav Neurosci. 2009; 3:13.https://doi.org/10.3389/neuro.08.013.2009PMID:19826615
39. Berridge KC. From prediction error to incentive salience: mesolimbic computation of reward motivation. Eur J Neurosci. 2012; 35: 1124–43.https://doi.org/10.1111/j.1460-9568.2012.07990.xPMID:
22487042