UNIVERSITÀ DEGLI STUDI DI CATANIA
DOTTORATO DI RICERCA IN SCIENZE DELLE PRODUZIONI ANIMALI(XXIV Ciclo)
DIPARTIMENTO DI SCIENZE AGRONOMICHE, AGROCHIMICHE E DELLE PRODUZIONI ANIMALI
Doctoral thesis
PATRICIA LÓPEZ ANDRÉS
Bioavailability and antioxidant effect of
dietary phenolic compounds in
lamb tissues
Coordinator: Prof. Marcella Avondo Tutor: Prof. Alessandro Priolo
List of Publications
ü López-Andrés P., Luciano G., Vasta V., Gibson TM., Biondi L., Priolo A.,
Mueller-Harvey I. Bioavailability and antioxidant effect of dietary tannins in lamb tissues. Submitted for publication to British Journal of Nutrition.
ü Luciano G., Moloney AP., Priolo A., Röhrle, Vasta V., Biondi L., López Andrés
P., Grasso S., Monahan FJ. 2011. Vitamin E and polyunsaturated fatty acids in bovine muscle and the oxidative stability of beef from cattle receiving grass or concentrate-based rations. Journal of Animal Science 89, 3759-3768.
ü Luciano G., Vasta V., Monahan FJ., López-Andrés P., Biondi L., Lanza M.,
Priolo A. 2011. Antioxidant status, colour stability and myoglobin resistance to oxidation of longissimus dorsi muscle from lambs fed a tannin-containing diet. Food Chemistry 124, 1036-1042.
Foreigner Institutions and Laboratories Visited
ü School of Agriculture, Food Science and Veterinary Medicine, University
College of Dublin, Ireland. (February – April 2010). Tutor: Prof. Frank Monahan.
ü Chemistry & Biochemistry Laboratory, Food Production and Quality Research
Division, School of Agriculture, Policy and Development, University of Reading, United Kingdom. (January – March 2011). Tutor: Dr. Irene Mueller-Harvey.
CONTENTS
Ø Phenolic compounds 6
Ø Effects of phenolic compounds in monogastrics 11
Ø Bioavailability of phenolic compounds in monogastrics 13
Ø Effects of phenolic compounds in polygastrics 18
Ø Bioavailability of phenolic compounds in polygastrics 23
Ø Aim of the experiments 24
Ø Materials and methods
1. Animal and diets 25
2. Sampling 26
3. Preparation of feed samples and purification of phenolic compounds by SPE
26
4. Preparation of lamb tissues samples and purification of phenolic compounds by SPE
27
5. Feed and tissue extracts LC-MS analysis 28
6. Antioxidant status of liver and plasma samples treated with or without SPE
6.1. Folin-Ciocalteu assay in RAW-samples 29
6.2. Folin-Ciocalteu assay in SPE-samples 30
6.3. Ferric reducing antioxidant power (FRAP assay) of
RAW-samples
30
6.4. Ferric reducing antioxidant power (FRAP assay) of
SPE-samples
32
7. Statistical Analysis 32
Ø Results
1. Analysis of feed samples by LC-MS 33
2. Analysis of animal tissues samples by LC-MS 39
3. Folin-Ciocalteu assay in lamb tissues samples 46
4. Ferric reducing antioxidant power (FRAP) assay in lamb tissues samples 47
Ø Discussions 49
Ø Conclusion 57
~ 6~
PHENOLIC COMPOUNDS
Phenolic compounds are organic compounds distributed all over the plant kingdom and they are products of the secondary metabolism of plants (Haslam, 1989). Widely distributed in the leaves, seeds, bark and flowers of plants, phenolic compounds afford protection against ultraviolet radiation, pathogens, and herbivores in plants (Harbone and Williams, 2000). Also they contribute to the colour and sensory characteristics for fruits and vegetables. More over 4,000 flavonoids have been identified in plants and phenolic compound have been used in the chemotaxonomic characterisation of plant species or of particular organs of plant tissues (Harborne and Green, 1980).
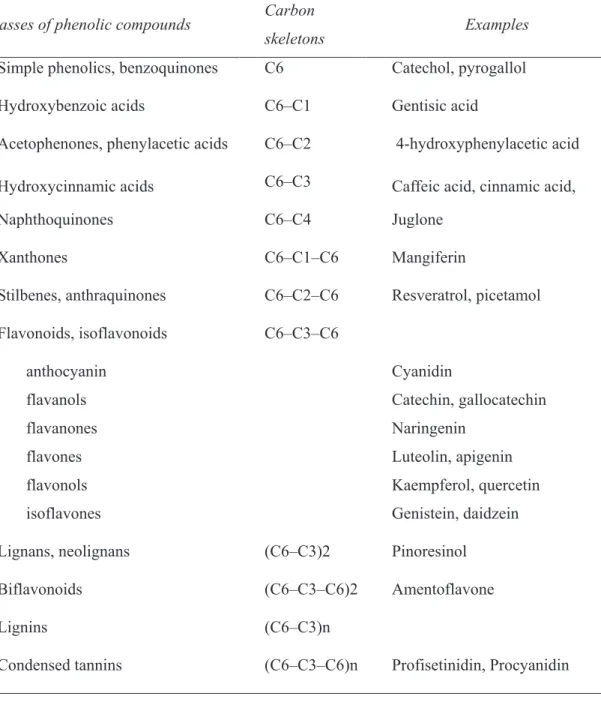
Polyphenols' chemical structure consists in one or more aromatic rings which can contain hydroxyl (Rice-Evans, 1996) methoxy (Dugas et al., 2000) and/or glycosidic groups (Harborne 1994). Polyphenols also can be associated, with other compounds, such as organic acids (Tapiero et al., 2002), amines (Vitaglione et al., 2004), lipids (Yang et al., 2000) and other phenols (Bravo, 1998). Depending on their chemical structure, polyphenolic compounds can be divided into different groups as shown in Table 1.
Fig.1 Structure of a flavan skeleton
A
B
C
2 3 4 5 6 7 8 1' 2' 3' 4' 5' 6'~ 7~
Flavonoids constitute the main and extensively group of phenolic compounds present in plant kingdom (Koes et al., 2005). They present a C6-C3-C6 carbon skeleton (Rice-Evans et al., 1996) and their structures consist in two benzene rings A and B, bonded through three carbons, which form a closed pyran ring (ring C) (Fig. 1).
Table 1. Chemical features of phenolic compounds
Classes of phenolic compounds Carbon
skeletons Examples
Simple phenolics, benzoquinones C6 Catechol, pyrogallol Hydroxybenzoic acids C6–C1 Gentisic acid
Acetophenones, phenylacetic acids C6–C2 4-hydroxyphenylacetic acid Hydroxycinnamic acids C6–C3 Caffeic acid, cinnamic acid, Naphthoquinones C6–C4 Juglone
Xanthones C6–C1–C6 Mangiferin
Stilbenes, anthraquinones C6–C2–C6 Resveratrol, picetamol Flavonoids, isoflavonoids C6–C3–C6
anthocyanin Cyanidin
flavanols Catechin, gallocatechin flavanones Naringenin
flavones Luteolin, apigenin flavonols Kaempferol, quercetin
isoflavones Genistein, daidzein Lignans, neolignans (C6–C3)2 Pinoresinol
Biflavonoids (C6–C3–C6)2 Amentoflavone
Lignins (C6–C3)n
~ 8~
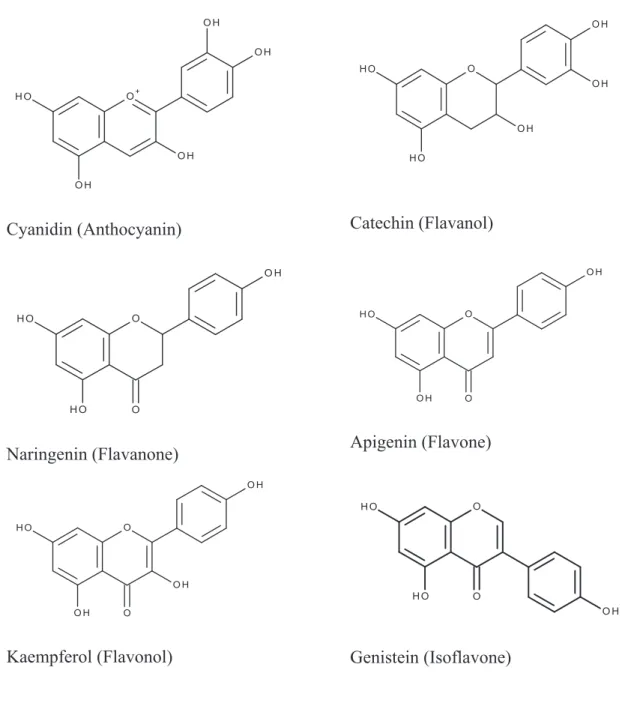
Flavonoids are themselves divided into several subclasses, depending on the oxidation state of the central pyran ring and the position of the ring B (Figure 2). In each flavonoids subclass, numerous possible linkages between flavonoids and different sugars (as glucose, galactose, rhamnose, xylose), disaccharides (such as rutose) and methoxy groups can occur (Cook et al., 1996). For example, the flavonol kaempferol can be linked with glucose in the 3 carbon to give astragalin, or be bonded with two rhamnose in the 3 and 7 carbons to give kaempferitrin, or linked with a robinose in 3-C and a rhamnose in 7 to give robinin, etc.
Figure 2. Examples of flavonoids compounds
Cyanidin (Anthocyanin) Catechin (Flavanol)
Naringenin (Flavanone) Apigenin (Flavone)
~ 9~
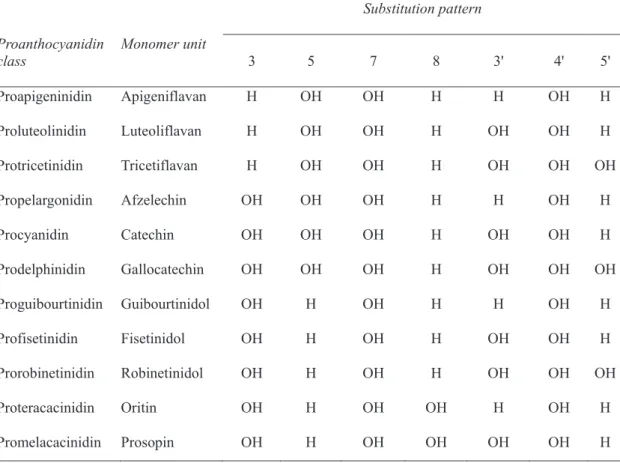
Flavonoids are the monomers of tannins, another group of polyphenolic compounds widespread in plant kingdom (Yoshida et al., 2000). Tannins can be classified into two groups: (i) hydrolysable tannins, which contain gallic acids and their oxidation products (Mueller-Harvey, 2001) and can be classified in ellagitannins and gallotannins (ii) condensed tannins or proanthocyanidins, which are oligomers and polymers of polyhydroxyflavan-3-ols (Porter, 1992). Depending on the chemical structure of the monomer unit, proanthocyanidins can be divided also in different classes (Table 2).
Table 2. Proanthocyanidin nomenclature: types of proanthocyanidin and suggested names for the monomer units
Substitution pattern Proanthocyanidin class Monomer unit 3 5 7 8 3' 4' 5' Proapigeninidin Apigeniflavan H OH OH H H OH H Proluteolinidin Luteoliflavan H OH OH H OH OH H Protricetinidin Tricetiflavan H OH OH H OH OH OH Propelargonidin Afzelechin OH OH OH H H OH H Procyanidin Catechin OH OH OH H OH OH H Prodelphinidin Gallocatechin OH OH OH H OH OH OH Proguibourtinidin Guibourtinidol OH H OH H H OH H Profisetinidin Fisetinidol OH H OH H OH OH H Prorobinetinidin Robinetinidol OH H OH H OH OH OH Proteracacinidin Oritin OH H OH OH H OH H Promelacacinidin Prosopin OH H OH OH OH OH H
Regardless of their structural diversity, all polyphenolic compounds are reducing agents (Rice-Evans et al., 1996). This antioxidant activity depends on the chemical structure of the polyphenols (Balasundram et al., 2006), first of all, in the degree of
hydroxylation and the positions of the –OH groups in the B ring (Rice-Evans et al.,
~ 10~
to their capacity to transfer electrons free radicals, chelate metal catalysts, activate antioxidant enzymes, reduce alpha-tocopherol radicals, and inhibit oxidases (Heim et
al., 2002). Some studies have reported that the antioxidant activity of polyphenolic
compounds decrease when these polyphenols are linked to methyl and/or glucosidic groups (Cao et al., 1997).
Tannins, which are highly polymerized, possess also diverse biological effects, as to be metal ion chelators (McDonald et al. 1996) and protein precipitating agents (Santos-Buelga et al. 2000). Tannins, like all phenolic compounds are antioxidant agents, but its antioxidant activity has not been studied so greatly than for simple phenols. Hagerman et al., (1998) showed in an in vitro study that tannins could be 15-30 times more effective at quenching peroxyl radicals than simple phenols. This effect could be due to the fact that tannins are highly polymerized and can contain more –OH groups in their structure, than simple phenols.
Phenolic compounds are present daily in humans and animals diets. Phenolic compounds' effect and their bioavailability have been studied in depth in the last 20 years. The study of bioavailability and effects of phenolic compounds in humans has been focused to relate the consumption of phenols with the decrease of several diseases. In animals, to achieve final products (meat, dairy, eggs) with higher quality, which humans will consume subsequently.
Below, the last studies related with the consumption of phenols, their effects and bioavailability in monogastric and polygastric animals.
~ 11~
EFFECTS OF PHENOLIC COMPOUNDS
IN MONOGASTRICS
Phenolic compounds are regular constituents of human food. The main sources of phenolic compounds in human diet are fruits (Cieslik et al.,2006), beverages such as tea (McKay et al., 2002), cocoa (Holt et al., 2002), coffee (Nardini et al., 2002), wine (Wang et al., 2002) and fruit juices (Abad-García et al., 2007), vegetables (Vinson et
al., 1998), cereals (Naczk et al., 2006), fruits (Cieślikr et al., 2006), chocolate
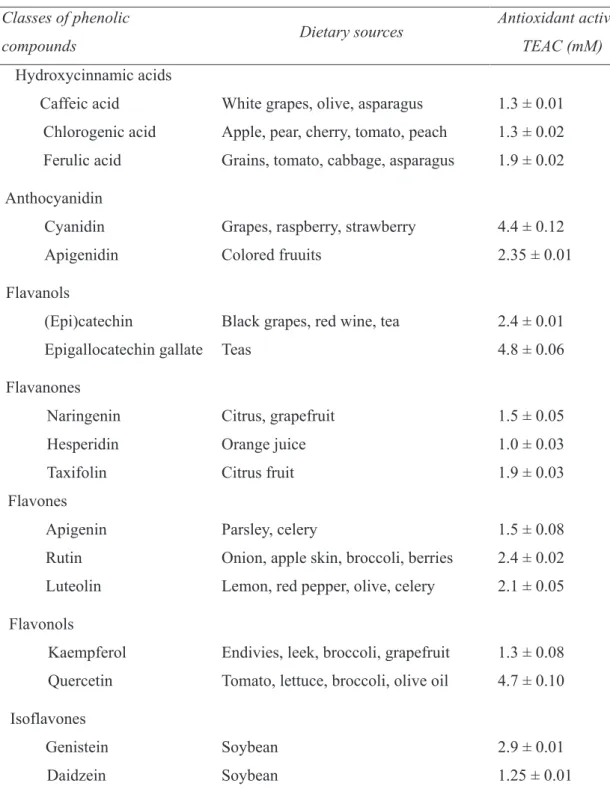
(Sanbongi et al., 1997) and legume seeds (Troszynska et al., 2006). The antioxidant activity of polyphenols present in food is very variable. In table 3 is shown different polyphenol food sources and Trolox equivalent antioxidant activities (TEAC) of each flavonoid. (Heim et al., 2002 and Rice-Evans et al., 1997).
The consumption of phenol-rich foods or beverages is associated with beneficial effects for human health (Hollman et al., 1997). Phenolic compounds are related to the prevention of diseases such as cancer (Ramos, 2008), stroke (Fraser et al., 2007), coronary heart (Ghosh, 2009), osteoporosis (Yamaguchi, 2002), neurodegenerative diseases (Ramassamy, 2006), diabetes (Dembinska-Kiec et al., 2008).
Phenolic compounds have different effects in the organism, they can act as allergenic (Ksouri et al., 2007), artherogenic (Sultana et al., 2008), anti-inflammatory (Cook et al., 1996), anti-microbial (Cowan 1999), antioxidant (Moreno
et al., 2006), anti-thrombotic (Stangl et al., 2007), cardioprotective (Zern et al., 2005)
and vasodilators compounds (Balasundram et al., 2006). The absorption of polyphenols in humans and animals can increase the vasodilatation (Diebolt et al., 2001), reduce the vasoconstriction of endothelial cells (Aldini et al., 2003) and decrease the platelet aggregation (Freedman et al., 2001). In short, polyphenols can reduce the angiogenesis (Yuasa et al., 2002) and the atherogenesis (Kaliora et al., 2005) of animals fed with a rich phenol diet.
~ 12~
Table 3. Dietary sources of flavonoids and Trolox equivalent antioxidant activities (TEAC). Higher TEAC values reflect greater antioxidant capability.
Classes of phenolic
compounds Dietary sources
Antioxidant activity TEAC (mM)
Hydroxycinnamic acids
Caffeic acid White grapes, olive, asparagus 1.3 ± 0.01 Chlorogenic acid Apple, pear, cherry, tomato, peach 1.3 ± 0.02 Ferulic acid Grains, tomato, cabbage, asparagus 1.9 ± 0.02 Anthocyanidin
Cyanidin Grapes, raspberry, strawberry 4.4 ± 0.12 Apigenidin Colored fruuits 2.35 ± 0.01 Flavanols
(Epi)catechin Black grapes, red wine, tea 2.4 ± 0.01 Epigallocatechin gallate Teas 4.8 ± 0.06 Flavanones
Naringenin Citrus, grapefruit 1.5 ± 0.05 Hesperidin Orange juice 1.0 ± 0.03 Taxifolin Citrus fruit 1.9 ± 0.03 Flavones
Apigenin Parsley, celery 1.5 ± 0.08 Rutin Onion, apple skin, broccoli, berries 2.4 ± 0.02 Luteolin Lemon, red pepper, olive, celery 2.1 ± 0.05 Flavonols
Kaempferol Endivies, leek, broccoli, grapefruit 1.3 ± 0.08 Quercetin Tomato, lettuce, broccoli, olive oil 4.7 ± 0.10 Isoflavones
Genistein Soybean 2.9 ± 0.01
~ 13~
BIOAVAILABILITY OF PHENOLIC COMPOUNDS
IN MONOGASTRIC
It has been suggested that the different chemical structures of the phenolic compounds, which are ingested by animals as part of their diets, are responsible for generating different effects in terms of their absorption and metabolism (Mueller-Harvey, 2006). For example, phenols differ in their basic structures (Urquiaga et al., 2000), degree and pattern of glycosylation (D’Archivio et al., 2007), acylation (Stevenson et al., 2006), polymerisation or molecular size (Wollgast et al., 2000) and solubility (Manach et al., 2004). All is these factors are likely to affect the absorption of each phenolic compound. Due to the different chemical structures of phenolic compounds, it is difficult to describe single metabolic pathways in the organism. The bioavailability of phenols in mammals has been focused in humans (Scalbert et al., 2000, Manach et al,. 2005) and in rats (Carbonaro et al., 2001, Silberberg et al., 2006). Polyphenols, depending on their chemical structure, can go by different metabolic pathways in human organism as explained above (see also Figure 3):
1. For polyphenols glycosylated, that it is the main form in which
polyphenos are present in foods and beverages, the first step for their absorption is to remove the sugar by glycosidase enzymes. These enzymes can be present in food (enzymes endogenous) and in the gastrointestinal mucosa. It is known that after polyphenols deglycosylation, conjugation reactions such as glucuronidation and methylation, can occur in the jejunal and ileal sections of the small intestine (Spencer et al., 1999).
2. Flavanols as (-)-epicatechin can pass directly through biological
membranes and be absorbed without deconjugation or hydrolysis.
3. Phenolic acid esters, i.e. chlorogenic acid, are not absorbed in the small
intestine. These compounds reach the colon where they are metabolised by the esterases enzymes. These enzymes are able to break the ester bond between phenol compound and carboxylic acid, in the case of chlorogenic acid (Kroon
et al., 1996).
4. Hydroxycinnamic acids as free aglycones are rapidly absorbed directly
~ 14~
5. With regard to proanthocyanidins, contradictory results studies about
their bioavailability have been provided. It was thought that they were not absorbed in the small intestine due to their high molecular weight and in this way they were directly eliminated. However, Déprez et al., 2000 showed that although proanthocyanidins were not absorbed through the gut barrier, they could be degraded by the colonic microflora into low molecular weight aromatic acids, which could be absorbed. Furthermore, there are some studies that showed that proanthocyanidins dimmers can be absorbed and identified in human and rat plasma (Holt et al., 2002 and Prasain et al. 2009 respectively).
Phenolic compounds that have been absorbed through gut barrier are widely conjugated by enzymes present in different tissues. The conjugation by glucuronidation occurs mainly in liver, although it can also occur in intestine, kidney and human colon (Tapiero et al., 2002). Methylation is undertaken by enzymes found in a wide range of tissues (Lambert et al., 2003) and sulphatation is carried out by the enzyme phenol sulfotransferases found in many tissues as liver and also in the colon, Stahl et al., 2002, Cappiello et al., 1990). These new conjugated phenolic compounds can (i) be excreted in the bile and return to the small intestine, (ii) reach the kidneys and be eliminated in urine (Shahrzad et al., 1998) or (iii) be transported by plasma till other animal tissues. It has to be noted that phenols circulate in plasma as glucuronidated or sulphated compounds and rarely as free aglycones (Manach et al., 1998; Carbonaro et al., 2001).
Figure 3. Possible routes for consumed polyphenols in humans (Scalbert and Williamson 2000).
~ 15~
Polyphenols that have not been absorbed through gut barrier or polyphenos re-excreted in the bile can reach the colon where they are metabolised by colonic microflora. In this way, flavonoid glycosides or glucuronides can be hydrolysed and the aglycone free form can be absorbed. In the case of free aglycones that reach the colon, these can be hydrolysed to low molecular weight and absorbed through the colonic barrier.
It should be noticed that the concentration of polyphenols is usually very low in plasma after their dietary administration. Most dietary polyphenols are quickly eliminated in both urine and bile after ingestion. The elimination depends also on the chemical structure of polyphenols and some studies have showed that the quantities of polyphenols found intact in urine vary from one phenolic compound to another (Scalbert et al. 2000). In human plasma, a post-prandial peak is observed 1–2 h after ingestion of various flavonols and flavanols but is longer for isoflavones and other polyphenols only absorbed after degradation by the colon microflora (Scalbert et al., 2000). To keep a high concentration in plasma, it has to repeat ingestion of the polyphenols, as it has been observed with volunteers consuming tea every 2 h (Van Het Hof et al., 1999).
It is well known that some simple flavonoids or their metabolites can be detected in different mammalian tissues not involved in phenol metabolism and excretion. Kalt
et al., (2008) demonstrated that when pigs are fed with an enriched blueberry fed,
anthocyanins from the diet can be found also in eyes and brain region (cortex and cerebellum) of the pigs. Also, it is known that anthocyanins have been associated with improvements in vision (Matsumoto et al., 2006) and with cancer chemoprevention (Hou et al., 2004). In another study, Bieger et al., (2008) gave to pigs quercetin aglycone as single dose the same day of slaughtering (expt. 1) or mixed into the regular meals of pigs for 4 weeks (expt. 2). In both experiments quercetin was found in muscle longissimus dorsi in very low quantity. Bieger also demonstrated that pigs did not accumulate quercetin in most tissues after a long-term of dietary flavonol intake (expt. 2), compared with a single treatment (expt. 1) and that only organs involved in flavonol metabolism and excretion, as small intestine, liver, and kidneys, contained significantly higher flavonol concentrations than plasma in both experiments.
~ 16~
De Boer et al., (2005) identified for the first time quercetin and quercetin metabolites in diverse rat tissues as lung, testes, heart, fat, bones and brain, besides the organs involved directly in phenol metabolism. More recently, Juan et al., (2010) studied the bioavailability of trans-resveratrol after an intravenous administration in rats. The results reported that trans-resveratrol aglycone was identified in kidney, lungs, liver, testis and brain.
In other studies diverse polyphenols have been identified in different animal tissues. Ha Park et al., (2009) fed tilapia fish with an enriched quercetin diet for 15 weeks. After trial term, quercetin aglycone was identified and quantified in liver and whole body mixture sample. Saitoh et al., 2004 report that when laying hens were fed with an experimental diet containing soy isoflavone-glycosides, most of the isoflavones (daidzein, glycitein, and genistein) and a metabolite, equol, were present in blood and egg yolk in conjugated form. Also Nimalaratne et al., 2011 have shown that when hens are fed with an enriched wheat and corn diet, gallic acid and trace of ferulic acid were found in egg yolk.
In humans, the identification of phenols has been focused on plasma samples. Paganga and Rice-Evans (1997) described the evidence for the absorption of flavonoids and their presence in human plasma in the glycosylated form. The phenol compounds identified were rutin, other quercetin glycosides and phloridzin. Day et al., (2001) showed that after consumption of onions (a rich source of flavonoid glucosides) the main circulating compounds identified in plasma were quercetin-3-glucuronide, 3′-methyl-quercetin-3-glucuronide and quercetin-3′-sulfate.
On the other hand, only few studies have reported the identification of proanthocyanidins in animal tissues. Baba et al., (2002) showed the bioavailability of procyanidin B2 [epicatechin-(4β-8)-epicatechin] in rats. After procyanidin B2 administration, it was absorbed and excreted in urine, and a portion of the PB2 was degraded to epicatechin and to the metabolized conjugated and/or methylated (−)-epicatechin internally in the rat. Prasain et al., 2009 reported that rats fed with grape seed extracts orally, monomeric catechins, their methylated metabolites, and proanthocyanidins up to trimmers were detected in blood samples. Prasain also
~ 17~
reported that (+)-catechin and (−)-epicatechin were identified in the brain conclusively.
In humans Holt et al., (2002) showed that after cocoa consumption, procyanidin dimmer, as well as the flavonol monomers epicatechin and catechin, can be absorbed into the circulation.
More studies are required to understand better the bioavailability of proanthocynidins in animals.
~ 18~
EFFECTS OF PHENOLIC COMPOUNDS
IN POLYGASTRICS
Polygastric animals, also known as ruminants, have a different digestive system to monogstric animals. Ruminants have four different stomachs: rumen, omasum, reticulum and abomasum. In the rumen it is possible to find high quantities of microflora and microfauna like bacteria (Tajima et al., 1999), protozoa (Dehority, 1993) and fungi (Barr, 1988). These microorganisms have a symbiotic relationship with the animals (Russell and Wilson, 1998), because the ruminants give an optimal habitat for the growth of the microorganisms and the microorganisms can provide protein, vitamins and short-chain organic acids for ruminants (Russel and Rychlik, 2001).
Polyphenols consumption by ruminants is highly dependent on the type of the diet. There are different typologies of ruminant feeding systems, i.e. grassland, herbage, silage, concentrate or a mixture between them. It is well known that fresh herbage contain high quantity of vitamins, polyunsaturated fatty acids, antioxidants compounds like tocopherols, carotenoids, ascorbic acid and phenolic compounds (Wood & Enser, 1997). Also it has been widely studied that the consumption of grass or fresh herbage by ruminants, improve qualitative aspects in final products as meat and dairy compare to animals fed a concentrate or silage diet (Nozière et al., 2006). The consumption of grass or concentrate feeds can affect animals performance (Steen
et al., 2003), meat color and flavor (Priolo et al., 2001), fatty acid composition in
meat and intramuscular fat (Realini et al., 2004, French et al., 2000 respectively), vitamin E concentration in muscle (Turner et al., 2002) and lipid oxidation in meat (Luciano et al., 20011b). The feeding system can affect also to the composition and quality of milk (Morand-Fehr et al., 2007), sensory quality of dairy products (Martin
et al., 2005) etc.
It is known that some antioxidant compounds present in the pasture can be transferred to animal tissues. In sheep and goats, the main carotenoid in plasma and adipose tissue is lutein, whereas cattle can also store β-carotene (Yang et al., 1992).
~ 19~
Yang et al., (2002) demonstrated higher concentrations and significant differences of
α-tocopherol and β-carotene compounds in liver from pasture-fed cattle compared to
liver from grain-fed cattle. Prache et al., (2003) showed higher plasma carotenoid content for grass-fed lambs, than for stall-fed, long-stall finished or short-stall finished lambs. La Terra et al., (2010) showed that when cows are fed with increasing proportion of fresh forages in their diet, a progressive increase of α-tocopherol and β-carotene are found in plasma. Vitamin E has also been found in higher concentrations in muscle from cattle fed with a grass diet compared to muscle from cattle fed concentrate feeds (Reailini et al., 2004; Luciano et al., 2011a). However, there is a lack of clear information about the bioavailability of dietary phenolic compounds in animals. Moreover, the possible antioxidant mechanisms of dietary phenolic compounds in animal tissues, whether direct or indirect is still unclear. Given the large variability in the concentration of phenolic compounds in different feedstuffs used for livestock feeding, it could be of great interest to study their potential biological effects when ingested by ruminants.
Among the different phenolic compounds, tannins have been particularly studied in ruminant animals for their effects on animal digestion and performance (Makkar, 2003), for their high antioxidant activity and for their potential effects on products’ quality such as meat, milk and dairy products.
It is known that many hydrolysable tannins can be metabolised by microorganisms in the rumen (Brooker et al., 1994, Nelson et al., 1995, Skene et al.,
1995, Sly et al., 1997) to gallic acid, pyrogallol and other products that are potentially
toxic to ruminants (Goel et al., 2005).
However, it is unclear to what extent the microbial organisms degrade or metabolise condensed tannins. Several publications reported that condensed tannins cannot be degraded (Makkar et al. 1995a, Getachew et al. 2008) by ruminal microorganisms. In contrast, Perez-Maldonado and Norton (1996) suggested that condensed tannins could be absorbed or degraded during metabolism in the gastrointestinal tract in sheep and goats. Nevertheless it is unclear whether these studies can be applied to all or only to certain types of condensed tannins. It has to been noticed that not all condensed tannins have the same chemical structure and in this way, their chemical structure could interfere in their bioavailability. The main
~ 20~
sources of condensed tannins in animal studies are: grape seed extracts (rich in procyanidins), green tea leaves (prodelphinidin) chestnut, oak, mimosa and quebracho Colorado trees (rich in profisetinidin). The main difference between these kinds of proanthocyanidins is the presence or absence of – OH group in the carbon 5 (see table 2 and Figure 4). Profisetinidin compounds do not contain this group in carbon 5. It is known, that the absence of -OH group increase the stability of the interflavonol linkages in condensed tannin (Mueller-Harvey, 1999).
Fig. 4 Chemical structure of different proanthocyanidin compounds
Profisetinidin Procyanidin
Tannins are usually added in animal diets in rather low amounts, due to their antinutritional effects when present in high quantities.
When tannins are present in the diet in a proportion higher than 5% of feed dry matter, they have undesirable effects on animal digestion. For example condensed tannins can form complexes with proteins, metal ions, amino acids and polysaccharides, limiting the availability of these nutrients to animals (Goel et al., 2005) and reducing the activity of ruminal microorganisms (Priolo et al., 2000), resulting in an impairment of feed digestion in the rumen. To deactivate the negative effects of tannins it is possible to add the polymers PEG (polyethylene glycol) or PVP (polyvinyl pyrrolidone) in animals’ diet: these polymers, in fact, deactivate effects of tannins because tannins have more affinity to these compounds than for other nutrients
~ 21~
(Makkar et al., 1995b). In this way the bioavailability of nutrients to ruminants is higher. Furthermore, it is known that microbial population can adapt to tannin, protecting the animals from their antinutritional effects (Smith et al., 2005).
Nevertheless, it is known that when tannins are present in the diet up to the 4-5%
of feed dry matter, they can offer advantages for ruminants which result in increased milk production, wool growth, ovulation rate, and lambing percentage (Min et al., 2003). Also tannins can protect proteins from degradation by ruminal microorganisms thus increasing the amount of proteins available for absorption in the intestine (McSweeney et al., 2001).
There are lots of plants rich in condensed tannins like sulla, sainfoin, birdsfoot trefoil and others which are commonly used for ruminant feeding. Also there are several hardwood tree species rich in condensed tannins like chestnut, oak, mimosa and quebracho trees. Focusing the attention on quebracho trees, the plants commonly used for quebracho extracts production are Schinopsis lorentzii and Schinopsis
balansaer, also named as quebracho Colorado.
Some positive effects of condensed tannins from quebracho on the quality of ruminants’ meat are reported below:
Vasta et al., (2009b) showed that when lambs are fed herbage supplemented with
quebracho tannins, the level of ∆9 desaturase protein expression in the muscle
longissimus dorsi was significantly higher compared to lambs receiving the herbage
without tannins. The function of the ∆9 desaturase protein is to synthesize oleic acid, a
monounsaturated ɷ-9 fatty acid, by desaturating the stearic acid, a saturated fatty acid. This study could mean that tannins or their derivatives could act directly in the muscle’s tissues.
In another study, Vasta et al., (2009a) demonstrated in vivo that the supplementation of quebracho tannins to lambs given fresh herbage or a concentrate diet reduces ruminal biohydrogenation. During the biohydrogenation, the polyunsaturated fatty acids (PUFA) ingested through the diet are gradually hydrogenated by ruminal microorganisms to form steraic acid, a saturated fatty acid (Kepler and Tove 1967). An intermediate of this process is the fatty acid 9cis 11trans C18:2, known as conjugated linoleic acid (CLA) or rumenic acid. Vasta et al., (2009a)
~ 22~
showed that when ruminants are fed with an enriched diet, the concentration of PUFA and CLA in meat is higher than in animals fed a control diet. The consumption of CLA it has been associated with a reduction of the incidence of cancer (Ip et al., 1991), diabetes (Houseknect et al., 1998), and atherosclerosis (Lee et al., 2005).
It has been showed also that dietary tannins can affect ruminal biohydrogenation through changes in the ruminal microbial community. Vasta et al., 2010 showed for the first time in vivo study that the conversion of vaccenic acid (unsaturated fatty acid) to stearic acid (saturated fatty acid) was reduced by tannin supplementation, probably because of a lower proportion of Butyrivibrio proteoclasticus bacteria, which are responsible for the last step of biohydrogenation.
Recent studies have shown the effect of condensed tannins on meat oxidative stability. It should be considered that oxidative reactions are the major causes of quality deterioration of raw meat and meat products. Oxidation of lipids and proteins in meat can affect its flavour (giving a rancid taste and smell), colour (giving discolouration, which result in an unpleasant brownish meat colour (Mancini and Hunt, 2005) and its nutritive value. Considering that condensed tannins, as all polyphenolic compounds, exert antioxidant activity, recent studies have investigated the effect of dietary tannins on meat oxidative stability. Luciano et al., (2011b) reported an improvement of the antioxidant status of meat from lambs fed a concentrate-based diet supplement with tannins from a quebracho extract compared to a control tannin-free diet. The effects of phenolic compounds on meat oxidation had been studied previously by Moñino et al., (2008) but in this case the effects of
rosemary polyphenols were investigated. Moñino et al., (2008) reported that the
muscle of lambs receiving the milk of ewes fed with a rosemary-rich concentrate
showed a greater antioxidant status than the control group. These authors reported that
when lambs are fed with a polyphenol-enriched diet (tannins or flavonoids); lamb meat displayed a higher scavenging activity compared to the meat of lambs from the control group. Regarding discolouration process in meat, in another study Luciano et al., (2009a) reported that including quebracho tannins in lamb diet improved meat colour stability by delaying myoglobin oxidation during refrigerated storage.
~ 23~
BIOAVAILABILITY OF PHENOLIC COMPOUNDS
IN POLYGASTRICS
The results obtained in the studies mentioned above imply that dietary quebracho tannins can affect the post-digestive metabolism in animals. Two possible mechanisms could explain these observations: i) ingested quebracho tannins (or their metabolites) might be degraded and absorbed from the ruminant digestive tract before being transferred to tissues or ii) dietary quebracho tannins (and their metabolites) are not absorbed in the digestive tract but act instead as antioxidants in the gastrointestinal tract.
Regarding to the bioavailability of polyphenolic compounds in ruminants, only
few studies have showed the bioavailability of simple phenolic. Gladine et al., (2007)
found monomeric phenol compounds in plasma of sheep receiving polyphenol-rich plant extracts by ruminal infusion (i.e. grape or rosemary extracts, which contain galloylated condensed tannins or simple phenolics, respectively). Moñino et al., (2008) reported that the muscle of lambs receiving the milk of ewes fed with a rosemary-rich concentrate contained several of the phenols that were present in the diet of the ewe (i.e. rosmarinic acid, carnosol and carnosic acid); while two other flavonoids, genkawanin and hesperetin, which are also present in rosemary extract, were not detected in lamb tissues. These studies suggested that only some phenolic compounds are bioavailable.
Little information is available about the presence of polyphenols in milk or dairy products. Lopez and Lindsay (1993) demonstrated the presence of phenolic compounds in bovine, caprine and ovine milk. It is known that the presence of these compounds takes a very important part in the sensory properties of milk and dairy products (for a review, see O’Connell et al.,2001).
~ 24~
AIM OF THE EXPERIMENTS
The aims of the following studies were to investigate whether different polyphenolic compounds or their metabolites could be detected in the tissues of lambs that had been fed previously with a specific diet. For the Experiment 1, lambs where fed with a diet supplemented with quebracho extract (characterised to be a rich source of profisetinidin compounds, a group of condensed tannins). In the other experiment (Experiment 2), lambs where fed on pasture, specifically with Lolium perenne (this plant belong to Poaceae family plant, which is not rich in polyphenolic compounds but contains some simple polyphenolic compounds). In both studies there was a control group, where lambs were fed with a commercial concentrate diet.
Furthermore, in both experiments the antioxidant status was measured in lamb tissue extracts that had either been treated or not treated with a Solid Phase Extraction (SPE) step. This step was used to purify samples and to isolate any phenolic compounds in the final extract. These experiments sought to investigate whether phenolic compounds have a direct or indirect antioxidant effect in lamb tissues.
~ 25~
MATERIALS AND METHODS
1. ANIMAL AND DIETS
EXPERIMENT 1
Eighteen Comisana lambs were weaned at 45 days of age (mean weight 14·48 kg ± standard deviation, SD 2·41kg). Lambs were blocked in groups of 2 on a descending body weight basis and, within block, were assigned to one of two dietary treatments of 9 animals each (C, control and C+T, control + tannins) and kept in individual pens for the duration of the trial. The C group received a concentrate containing the following ingredients: barley (55·1%), alfalfa hay (30·0%), soybean meal (13·0%), and vitamin and mineral premix (1·9%). The C+T group received the concentrate plus supplementary quebracho tannins (from Schinopsis lorentzii; Figli di
Guido Lapi S.pA., Castelfranco di Sotto, Pisa, Italy). For each 1000 g of DM of
concentrate plus tannins, 95·7 g consisted of quebracho powder and the remaining 904·3 g of concentrate. The quebracho-supplemented diet was formulated to contain 6·4% (DM basis) tannins. The lambs were adapted to the experimental diets for 7 days before the commencement of the experiment. After 70 days of experiment the lambs were slaughtered,
EXPERIMENT 2
Sixteen Merinizzata italian lambs were blocked in groups of 2 on a descending body weigh basis after being weaned at 70 days of age. Lambs were assigned to one of two dietary treatments of 8 animals each (S, stall group and G, grazing group). The G group was allowed to graze from 9 am to 5 pm on a 1 ha ryegrass (Lolium perenne) at the end of the day the lambs were penned indoor in a multiple box and had ad libitum access to water. Before the commencement of the experiment, the animals were adapted to the experimental conditions over a 20 days period in which they were conducted to pasture and in stall received an amount of hay which was gradually
~ 26~
reduced till elimination from the diet. The S lambs were gradually adapted to the experimental feed over a 20 days period during which the weaning concentrate was gradually replaced with the experimental concentrate.
The experimental trial started when the animals were 90 days old and the experimental feeding trial had a duration of 72 days. All the animals were weighed weekly.
2.SAMPLING
In both experiments individual blood samples were taken from the jugular vein of each lamb 12 hours after the last feeding trial and collected in heparin tubes. Blood samples were centrifuged at 3000 x g for 20 min at 4 ºC and stored at -80 ºC. Liver, taken at slaughtering, was immediately frozen in liquid nitrogen, vacuum packed and stored at -20 ºC. Subsequently, a uniform and representative sample of each diet was prepared, vacuum packed and stored at -20 ºC until analysis.
3. PREPARATION OF FEED SAMPLES AND PURIFICATION OF PHENOLIC COMPOUNDS BY SPE
Feeds (2·5 g) given to the groups of each experiment (C and C+T for Experiment 1 and S and G for Experiment 2) were placed into 50 ml centrifuge tubes. Samples were homogenised with 15 ml acetone / water (70/30, v/v) for 60 seconds at 4000 rpm using a Heidolph Diax 900 tissue homogenizer (Heidolph Elektro GmbH & Co. KG, Kelheim, Germany). Samples were then sonicated for 6 min (with a break of 2 min after the first 3 min of sonication) using a Bandelin Sonoplus HD2070 sonicator (cycle: 4 × 10%, power: 0·31%). Samples were kept in a water/ice bath during both homogenization and sonication procedures. The sonicated homogenates were centrifuged at 3000 × g for 15 min at 4°C using a Thermo Scientific centrifuge (model IEC CL31R). Then the supernatants were filtered through Whatman 541 filter paper before SPE purification.
~ 27~
Phenolic compounds were isolated from feed samples on a reversed-phase C18 Sep-Pak Vac 6cc (500 mg) cartridge (WAT043395, WATERS SpA, Milan). The method was based on that described by Perez Magariño et al. (2008) but was adapted as follows. Prior to use, cartridges were conditioned with 3 ml methanol followed by 3 ml of distilled water. The filtered supernatant (10 ml) was acidified to pH 2·5 with 0.5
M-H2SO4 prior to loading onto the cartridge. Phenolic compounds were eluted with 2
ml of methanol and The final fraction was divided into two 1·5 ml glass vials and kept in a freezer at -30ºC.
4. PREPARATION OF LAMB TISSUES SAMPLES AND PURIFICATION OF PHENOLIC COMPOUNDS BY SPE
Liver (5 g) was placed into 50 ml centrifuge tubes. Preparation steps for liver samples were carried out in the same way as for feed samples. SPE method was based
on that described by Perez Magariño et al.(2008) and carried out for feed samples. For
liver samples phenolic compounds were eluted with 3 ml of ethyl acetate. The collected fraction was evaporated to dryness under nitrogen and then dissolved in 3 ml of methanol. The final fraction was also divided into two 1·5 ml glass vials and kept at -30ºC.
The method for plasma samples was based on that described by Juan et al., (2010) but was adapted as follows. A 500 μl plasma aliquot was acidified with 15 μl of glacial acetic acid. Phenolic compounds were isolated from plasma samples on a reversed-phase C18 Sep-Pak 1cc (100 mg) Cartridge (WAT023590 WATERS SpA, Milan). Prior to use, the cartridges were conditioned with 3 ml of methanol followed with 3 ml of distilled water. The acidified plasma sample was completely loaded onto the cartridge followed by 1 ml of distilled water. Phenolic compounds were eluted with 2 ml of methanol. Ascorbic acid (10 μl) was added to the final eluate to avoid any possible oxidation in plasma samples. This fraction was evaporated to dryness under nitrogen and then dissolved in 3 ml of methanol. The final fraction was divided into two 1·5 ml subsamples and stored at -30ºC.
~ 28~
To confirm that the SPE method carried out in Experiment 1 and Experiment 2 did not reduce the initial concentration of polyphenolic compounds in a sample during the treatment, a recovery test was performed on 3 solutions of known concentration of gallic acid. Standard solutions were analysed for the concentration of total phenols using the Folin-Ciocalteu assay (Luciano et al., 2011b). Subsequently, the same solution underwent the SPE treatment performed as explained above for plasma samples, but without the addition of ascorbic acid to the final eluate. The elute obtained after SPE step was evaporated to dryness under nitrogen and then dissolved in 1·5 ml of methanol: distilled water (1:1, v/v). The Folin-Ciocalteu assay was then performed on the SPE-treated extract. A 86·35% recovery was found, which shows that during the SPE treatment, exist only minimal loss (< 15%) of polyphenolic compounds in the samples.
5. FEED AND TISSUE EXTRACTS LC-MS ANALYSIS
Feed and lamb tissue extracts were analysed by HPLC-MS using an ACE 5 2.1 × 150 mm C18 column (Hichrom Ltd, Theale, Berkshire, UK) fitted to an Agilent 1100 liquid chromatography with diode array detector. A binary mobile phase system was used where solvent A was HPLC-grade water + 0·1% formic acid and solvent B was HPLC S-grade acetonitrile + 0·1% formic acid (Rathburn Chemicals Ltd, Walkerburn, UK). Metabolites were eluted from the column using a simple gradient program. Initial conditions being 95% A and 5% B held for 1 min changing to 5% A and 95% B over 9 min and then held for 5 min before returning to the initial gradient conditions over 1 min and then held for 9 min to re-equilibrate the column. The pump flow rate was 0·2 ml/min and the column oven temperature was 25ºC.
For LC-MS analysis, 5 μl of each sample was injected and the eluted peaks were analysed using an electrospray ionisation (ESI) micrOTOF QII quadrupole time of flight mass spectrometer (Bruker Daltonics, Coventry, UK) operated in the negative
ion mode. Using a capillary voltage of 3200 V, nebuliser gas (N2) pressure of 1 bar,
dry gas (N2) flow of 8 l/min and a drying temperature of 180˚C. The TOF flight tube
was set at +8600 V and the detector at 2010 V. The mass range, of 100 to 1700 daltons, was calibrated using Agilent low concentration Tunemix (G1969-85000). 5 μl of a
~ 29~
standard catechin solution (10 ng/μl) was first injected with each batch of samples to check system integrity and performance. Peak areas of lipophilic compounds were normalized based on catechin areas.
6. ANTIOXIDANT STATUS OF LIVER AND PLASMA SAMPLES TREATED WITH OR WITHOUT SPE
Liver and plasma antioxidant status was determined by means of the FRAP (Ferric Reducing Antioxidant Power) and the Folin-Ciocalteu assays. Both assays were applied to samples either treated (SPE-samples) or not treated (RAW-samples) with SPE.
6.1. Folin-Ciocalteu assay in RAW-samples
For the preparation of RAW-liver for the Folin-Ciocalteu assay, 2 g of liver from lambs of Experiment 1 were placed into 50 ml centrifuge tubes and homogenised with 10 ml of distilled water. For Experiment 2, liver (2 g) were placed into 50 ml centrifuge tubes and homogenised with 15 ml acetone / water (70/30, v/v). For the samples from the two experiments, homogenisation, sonication, centrifugation and filtration steps were performed as above described for SPE-liver. A 1:4 dilution of the extract (3 ml of distilled water added to 1 ml of liver extract) was chosen. The assay
was performed as described by Luciano et al.(2011b). Briefly, 100 µl of the diluted
RAW-liver extract was transferred into 15 ml centrifuge tubes and 900 µl of distilled water were added. The Folin-Ciocalteu reagent was diluted to 1 N and 500 µl were added to the tubes followed by 2·5 ml aqueous solution of sodium carbonate (20% w/v). The mixture was vortex mixed for 30 s and incubated for 40 min in the dark at room temperature. The samples were centrifuged at 2700 × g for 10 min at 4ºC in order to remove any sodium carbonate precipitates. A Shimadzu double-beam spectrophotometer (model UV-1601) was used to measure the absorbance of the samples. The wavelength used was 725 nm and a tube containing all the reagents except tissue extract was used as blank. Aqueous solutions of gallic acid were used for the calibration curve. The concentration range for the calibration curve covered 0 µg to
~ 30~
80 µg/µl of gallic acid. The results were expressed as mg of gallic acid equivalents (GAE) / g of liver.
For RAW-plasma samples, 100 µl of plasma diluted 1:10 with distilled water were placed into 15 ml centrifuge tubes and 900 µl of distilled water were added. The Folin-Ciocalteu assay was carried out as described for RAW-liver samples. The results were expressed as mg of gallic acid equivalents (GAE) / ml of plasma.
6.2. Folin-Ciocalteu assay in SPE-samples
Liver and plasma samples, from Experiment 1 and Experiment 2, treated with SPE were subjected to the Folin-Ciocalteu assay as follows. The content of one of the two 1·5 ml glass vials obtained after the SPE step was evaporated to dryness under nitrogen and then dissolved in 1·5 ml of methanol:distilled water (1:1, v/v). In the case of SPE-liver samples, 500 µl of this extract was transferred into a 15 ml centrifuge tube and 500 µl of methanol:distilled water (1:1, v/v) were added. The Folin-Ciocalteu assay was performed as described above for RAW-liver. Solutions of gallic acid in 1:1 (v/v) methanol:distilled water were used to calibrate the assay.
For measuring the total phenolic content and the antioxidant status in plasma, SPE-plasma samples were obtained as described above, with the only difference that
ascorbic acid was not added to the final sample; in fact, Georgé et al.(2005) showed
that ascorbic acid interferes in the Folin-Ciocalteu assay. The final SPE-plasma extracts were evaporated to dryness under nitrogen and then dissolved in 3 ml of methanol:distilled water (1:1, v/v); 500 µl of this sample was placed into a 15 ml centrifuge tube and 500 µl of methanol:distilled water (1:1, v/v) was added. The Folin-Ciocalteu assay was performed as described for RAW-liver. The results were expressed as mg of gallic acid equivalents (GAE) / ml of plasma.
6.3. Ferric reducing antioxidant power (FRAP assay) of RAW-samples
The method described by Luciano et al. (2011b) was followed to measure the
~ 31~
volumes of acetate buffer (300 mM, pH 3.6) with 1 volume of 10 mmol TPTZ solution (2,4,6-tripyridyl-s-triazine in 40 mM HCl) and with 1 volume of 20 mM aqueous ferric chloride. A blank reading at 593 nm was taken immediately after mixing 400 μl of distilled water with 3·0 ml of FRAP reagent.
Experiment 1: For RAW-liver samples, 0·5 g of liver was placed into a 50 ml centrifuge tube and 10 ml of distilled water was added. Homogenisation, sonication, centrifugation and filtration steps were performed as above described for SPE-liver samples. Then, in a glass test tube, 300 μl of distilled water were mixed with 100 μl of liver extract and 3.0 ml of warm FRAP reagent (37°C) were added. The content of the tube was mixed and incubated in a water bath set at 37°C for 4 min, after which the absorbance was recorded at 593 nm.
Experiment 2: For RAW-liver samples, 2 g of liver was placed into a 50 ml centrifuge tube and 15 ml acetone / water (70/30, v/v) of distilled water was added. Homogenisation, sonication, centrifugation and filtration steps were performed as above described for SPE-liver. 74 μl of liver extract, 220 μl of distilled water and 3.0 ml of warm FRAP reagent (37°C) were added in a glass test tube, 300 were mixed with 100. The content of the tube was mixed and incubated in a water bath set at 37°C for 4 min, after which the absorbance was recorded at 593 nm.
Then for both experiments: The change in absorbance (ΔA593 nm) between the
final reading and the blank reading was related to that obtained with solutions of Fe2+
of known concentrations (aqueous FeSO4∙7H2O ranging from 0 μM to 1000 μM).
Results of the FRAP assay were therefore expressed as µmoles of Fe+2 equivalents /g
of liver.
For RAW-plasma sample in both experiments, 74 μl of plasma was added in a glass test tube to 220 μl of distilled water and 2·2 ml of FRAP reagent (the final dilution of the sample in the mixture was always 1:34). Tubes were mixed and incubated for 4 min in a water bath at 37ºC. The absorbance was immediately recorded
at 593 nm. Results of the FRAP assay were therefore expressed as µmoles of Fe+2
~ 32~
6.4. Ferric reducing antioxidant power (FRAP assay) of SPE-samples
The same method described above was applied to the samples. Since SPE-samples were prepared in a methanol:distilled water solution, the same solution was used instead of distilled water in the assay, as well as for preparing standard
FeSO4∙7H2O solutions. The assay was performed by adding in a glass test tube 200 µl
of the SPE-liver samples or SPE-plasma samples (without ascorbic acid) to 200 µl of methanol:distilled water and 3 ml of FRAP reagent. Incubation time, absorbance measurement and calculations were performed as described above.
7.STATISTICAL ANALYSIS
For each experiment, the data from the Folin-Ciocalteu assay and FRAP values were analysed by one-way ANOVA including the model treatment effects (C vs C+T or S vs G) and experimental error. Each lamb was considered as an individual experimental unit.
~ 33~
RESULTS
1.ANALYSIS OF FEED SAMPLES BY LC-MS
EXPERIMENT 1
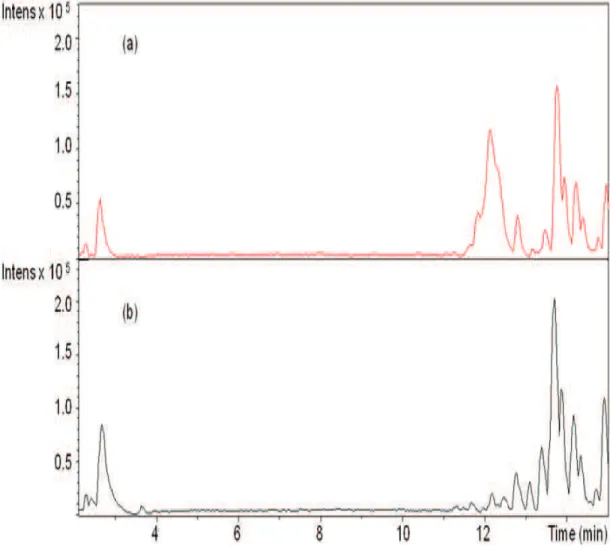
Representative chromatograms of quebracho enriched and control diets are shown in Fig. 5. The quebracho chromatogram differed from the control by the presence of one peak at 12·1 min. The extracted ion chromatogram revealed that this peak
contained several different masses (Fig. 6) with m/z (H-) of 561·150, 833·223 and
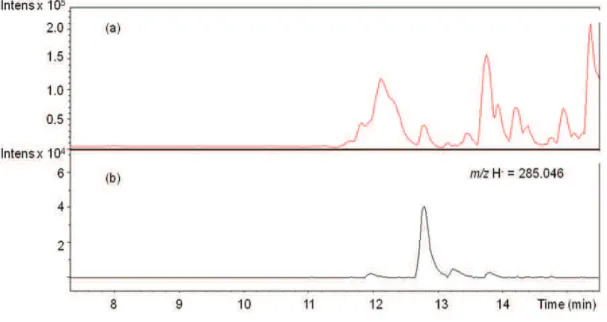
1105·293. These compounds were identified as a combination of one or more fisetinidol units plus one catechin unit (Fig. 8; Table 4). Another single peak was
observed at 12·8 min with an m/z (H-) of 285·046 and was identified as fisetin (Fig.5
and 7; Table 4). LC-MS analysis of the control diet revealed the absence of the compounds identified in the quebracho enriched diet.
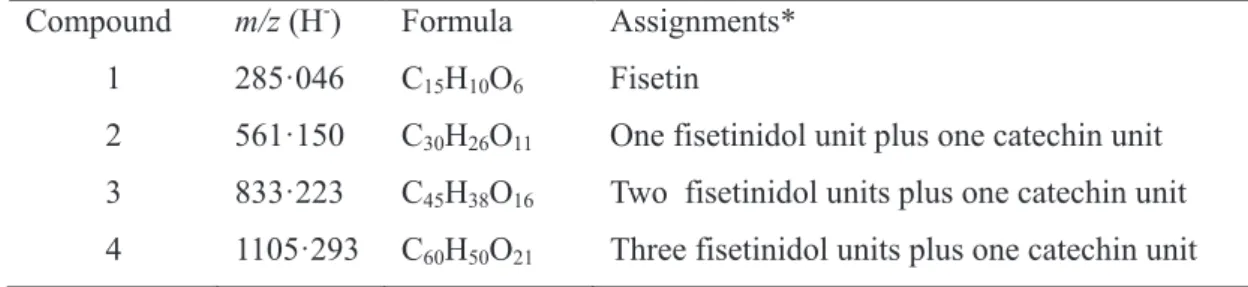
Table 4. Main phenolic compounds identified in the quebracho-enriched diet by LC-MS Compound m/z (H-) Formula Assignments*
1 285·046 C15H10O6 Fisetin
2 561·150 C30H26O11 One fisetinidol unit plus one catechin unit
3 833·223 C45H38O16 Two fisetinidol units plus one catechin unit
4 1105·293 C60H50O21 Three fisetinidol units plus one catechin unit
~ 34~
Fig. 5. LC chromatograms (wavelength: 214 nm) from quebracho-supplemented diet (a) and control diet (b)
~ 35~
Fig. 6. LC-chromatogram (a) and extracted ion chromatograms for m/z H- = 56 ·15 (b),
833·20 (c) and 1105·29 (d) from quebracho-enriched diet (wavelength: 214 nm).
Fig. 7. LC-chromatogram (a) and extracted ion chromatogram for m/z H- = 285·046
~
36~
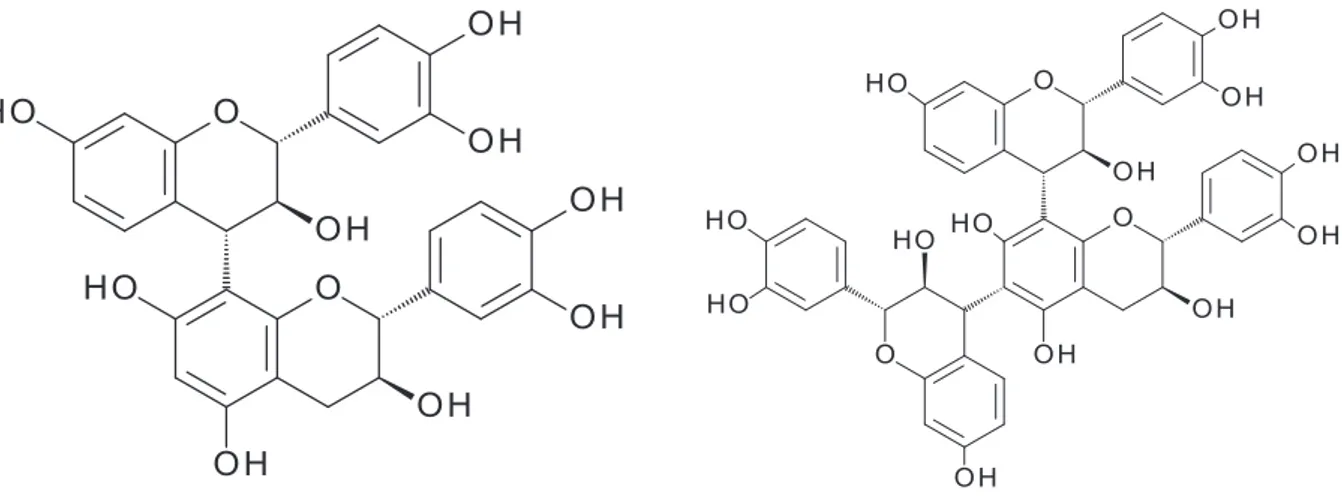
Fig. 8: Possible assignments of profisetinidin ions that were detected in the LC-MS chromatograms of extracts from the quebracho-enriched diet
Chemical Formula : C15H10O6
Exact Mass: 285·046 (fisetin)
Chemical Formula : C30H26O11
Exact Mass: 562·150 (profisetinidin dimmer)
Chemical Formula : C45H38O16
Exact Mass: 834·223 (profisetinidin trimmer)
n
n =2 Chemical Formula : C60H50O21
~
37~
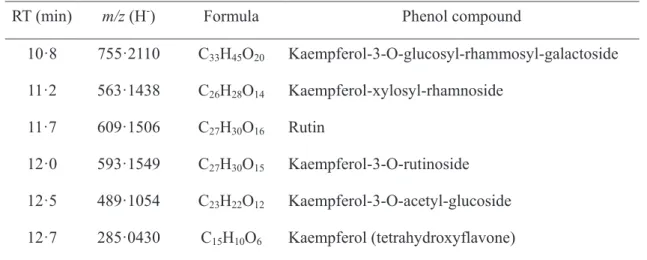
EXPERIMENT 2Representative chromatograms of grass and concentrate diets are shown in Fig. 9. Under the LC-MS conditions used in the present study, phenolic compounds were expected to elute between 5 and 13min. In grass chromatogram, only few peaks and with a very low intensity were observed in the range of phenolic compounds (Fig. 9). The phenolic compounds identified in the chromatogram of grass samples belong to the flavonol family and most of the compounds are present in their glycoside form (Table 5).
Table 5. Identification of possible phenolic compounds found in grass diet by LC-MS RT (min) m/z (H-) Formula Phenol compound
10·8 755·2110 C33H45O20 Kaempferol-3-O-glucosyl-rhammosyl-galactoside 11·2 563·1438 C26H28O14 Kaempferol-xylosyl-rhamnoside 11·7 609·1506 C27H30O16 Rutin 12·0 593·1549 C27H30O15 Kaempferol-3-O-rutinoside 12·5 489·1054 C23H22O12 Kaempferol-3-O-acetyl-glucoside 12·7 285·0430 C15H10O6 Kaempferol (tetrahydroxyflavone)
~
38~
Fig. 9. LC-chromatograms (wavelength: 214 nm) from grass diet (a) and control diet (b). The first chromatogram is a complete chromatogram of the diets; the chromatogram below is an enlargement of the corresponding range of phenolic compounds.
~
39~
Some of the peaks observed between 10 and 22 min in the chromatograms from grass and control diet are due to lipophilic compounds (Figure 9). Among the lipophilic compounds identified in the diets, the compound observed at 18·2 min with
a mass m/z (H-) of 277·2206(probably, linolenic acid) was found in a proportion of
7·5 times higher in the grass diet than in the concentrate diet. The peak detected at 20
min with a mass m/z (H-) of 279·2358(plausibly linoleic acid) which was 4·5 times
higher in the concentrate diet than in the grass diet.
2.ANALYSIS OF ANIMAL TISSUES SAMPLES BY LC-MS
EXPERIMENT 1
Plasma and liver extracts obtained after the SPE step were analysed for quebracho profisetinidins and other phenolic compounds or possible metabolites arising from their degradation. However, no signals from any of these compounds could be detected in liver (Fig. 10) or plasma (Fig. 11) samples from lambs fed the C+T diet. Fig. 10 shows that liver chromatograms from lambs fed the C or C+T diet are exactly the same.
Fig 10. LC-chromatogram (wavelength: 214 nm) of a liver sample from one lamb from the C+T group (a) and of a liver sample from one lamb from the C group (b).
~
40~
In plasma chromatograms (Fig. 11) no differences could be found between the lambs fed with the different diets. In plasma chromatograms the peak at 2·5 min is ascorbic acid, which had been added during the SPE step. The peaks observed between 12 and 25 min in the chromatograms from plasma and liver samples are due to lipophilic compounds (Table 6); the plasma of the C+T lambs presented greater (P ≤
0·011) amounts of C18H30O2, C18H32O2, C18H34O2 and C20H30O2 compared to the C
animals. No significant differences (P > 0·05) were found in the amounts of the
lipophilic compounds detected in liver samples of the lambs from the two groups.
Fig 11. LC-chromatogram (wavelength: 214 nm) of a plasma sample from one lamb from the C+T group (a) and of a plasma sample from one lamb from the C group (b).
~
41~
T ab le 6. L ip o p hi li c c om p ounds * found i n l iv er a nd p la sm a of l am b s fe d conc ent ra te (C) or c onc ent ra te p lus que b ra cho t anni ns (C+T ). L iv er P la sm a D IE T D IE T C C+T P v al ue S E M C C+T P v al ue S E M m /z ( H - ) F or m ul a 255·235 C1 6 H3 2 O2 807,930 2,1 10,674 0·090 384,486 108,944 154,186 0·200 547,031 265·151 C1 5 H2 2 O4 16,472,51 1 24,140,824 0·080 2,195,887 2,594,968 3,475,423 0·174 318,125 277·221 C1 8 H3 0 O2 9,246,287 1 1,522,243 0·222 909,524 39,008 1,81 1,618 0·006 28,156 279·236 C1 8 H3 2 O2 15,870,152 17,634,140 0·153 608,223 67,688 315,776 0·004 47,583 281·25 1 C1 8 H3 4 O2 17,133,219 20,462,1 15 0·702 4,146,446 312,905 936,492 0·01 1 130,618 299·263 C1 8 H3 6 O3 1,675,988 1,962,691 0·402 164,443 - - - - 301·221 C2 0 H3 0 O2 1,389,920 13,174,605 0·914 504,255 364,171 478,965 0·008 23,333 * D at a e x p re ss ed a s p ea k a re a~
42~
EXPERIMENT 2Liver and plasma extracts obtained after the SPE step were analysed for the same phenolic compounds found in grass diet or possible metabolites arising from their degradation. However, no signals from any phenolic compounds could be detected in liver (Fig. 12) or plasma (Fig. 13) samples from the G lambs.
Fig. 12. LC-chromatogram (wavelength: 214 nm), from 4 to 16 min (range of phenolic compounds) of a liver sample from one lamb from the G group (a) and of a liver sample from one lamb from the S group (b).
~
43~
Fig. 13. LC-chromatogram (wavelength: 214 nm), from 4 to 16 min (range of phenolic compounds) of a plasma sample from one lamb from the G group (a) and of a plasma sample from one lamb from the S group (b).
In this experiment, also some peaks observed at the end of the chromatograms were due to lipophilic compounds. In liver chromatograms some plausible fatty acids were identified (Fig. 14). In the case of plasma chromatograms, Extracted Ions Chromatograms with the masses of the compounds identified previously in liver chromatograms were necessary to reveal the presence of these compounds and for their quantification.
The identification of the possible fatty acids and their concentration in liver and plasma can be observed in Table 7. Liver samples from the G lambs showed greater
amount (P < 0·001) for the compounds identified as C16H32O2, C18H30O2 and C20H30O2
~
44~
No significant differences were found for the same compounds in plasma samples. In liver and plasma samples from lambs fed the concentrate, higher
concentrations (P < 0·05) were found for the compounds identified as C18H32O2, and
C18H36O3, compared to liver and plasma from lambs fed the grass diet.
Fig. 14. LC-chromatogram (wavelength: 214 nm), from 15 to 22 min (range of lipophilic compounds) of a liver sample from one lamb from the G group (a) and of a liver sample from one lamb from the S group (b). For identification of lipophilic compounds see Table 7.
~
45~
T ab le 7. L ip o p hi li c c om p ounds * found i n l iv er a nd p la sm a of l am b s fe d i n s ta ll (S ) o r gra zi ng (G ). L iv er P la sm a D IE T D IE T S G P v al ue S E M S G P v al ue S E M Co m p ound m /z ( H - ) F orm ul a 1 281·251 C1 8 H3 4 O2 2,916,083 3, 877,909 0·213 376,738 427,320 179,944 0·004 47,583 2 255·235 C1 6 H3 2 O2 971,947 1,794,396 <0· 001 132,619 174,716 135,092 0·200 547,031 3 277·221 C1 8 H3 0 O2 1,237,630 4,099,981 <0· 001 407,898 32,717 53,346 0·239 8 ,535 4 279·236 C1 8 H3 2 O2 7 ,1 12,070 4,564,985 0·001 428,736 310,078 56,700 0·009 51 ,957 5 299·263 C1 8 H3 6 O3 809,313 56,284 0·001 126,743 143,136 16,149 0·025 29 ,491 6 301·221 C2 0 H3 0 O2 2,007,747 6,663,365 <0· 001 639,850 10,366 19,515 0·226 3 ,683 * D at a e x p re ss ed as p ea k a re a~
46~
3.FOLIN-CIOCALTEU ASSAY IN LAMB TISSUES SAMPLES
EXPERIMENT 1
The Folin-Ciocalteu assay, performed on the RAW samples, gave significantly higher values in both liver and plasma samples from lambs fed the quebracho-enriched diet as compared to tissues from animals fed the control diet (+9·87%, P = 0·036 for liver samples and +5·91%, P = 0·006 for plasma samples; Table 8).
However, when the liver and the plasma samples had been treated with SPE, the Folin-Ciocalteu assay did not show any differences (P > 0·05) between the experimental treatments (Table 8). It is also noteworthy that the Folin-Ciocalteu values of the SPE-samples were 100-fold lower compared to the RAW-samples.
EXPERIMENT 2
The Folin-Ciocalteu assay, on Experiment 2, gave significantly higher values in liver and plasma samples from lambs fed the grass diet as compared to tissues from animals fed the concentrate diet (+13·15%, P = 0·055 for liver samples and +4·27%,
P = 0·093 for plasma samples; Table 8). At the same way, when the liver samples were
treated with SPE, the Folin-Ciocalteu assay did not show any differences (P > 0·05). The treatment with SPE resulted in a 100-fold reduction of the Folin-Ciocalteu values compared to the RAW-samples (Table 8). Moreover, after SPE purification, plasma samples from S lambs showed higher Folin-Ciocalteu values compared to G lambs (+39·23%, P = 0·012).
~
47~
4. FERRIC REDUCING ANTIOXIDANT POWER (FRAP) ASSAY IN LAMB TISSUES SAMPLES
EXPERIMENT 1
The FRAP values were also significantly higher (+9·6%, P = 0·038 for liver samples and +28·45%, P < 0·0005 for plasma samples; Table 9) in RAW liver and plasma samples from lambs fed the C + T diet than tissues from lambs fed the C diet. However, for SPE liver and plasma samples, the FRAP values were similar (P > 0·05) in all tissues from lambs fed the two diets (Table 9).
EXPERIMENT 2
The RAW-liver and RAW-plasma from lambs fed the grass diet showed significantly higher FRAP values compared to liver and plasma from lambs fed the concentrate diet (+20·03%, P = 0·001 for liver samples and +14·28%, P = 0·003 for plasma samples, Table 9). However, when the liver and plasma samples were treated with the SPE, differences in FRAP values were not detected (P > 0·05; Table 9).