Alma Mater Studiorum – Università di Bologna
D
OTTORATO DIR
ICERCA INS
CIENZE
C
ARDIO
-N
EFRO
-T
ORACICHE
Ciclo 31°
Settore Concorsuale: 06/D1
Settore Scientifico Disciplinare: MED/11
TITOLO TESI
AFICILL: a single-cohort, retrospective study on Atrial Fibrillation In Critically ILL patients admitted to a medical sub-intensive care unit: implications for clinical management, outcomes and elaboration of new data-driven models
Presentata da: Lorenzo Falsetti
Coordinatore Dottorato
Supervisore
Prof. Gaetano Domenico Gargiulo
Prof. Francesco Grigioni
Co-Supervisore
Prof. Alessandro Capucci
Summary
• Abstract
1. Introduction
a. Atrial fibrillation in the critically-ill patient b. Medical population in a subintensive care unit
c. Current use of big data and machine learning in medicine d. Aims of the study
2. Patients and Methods
a. Power analysis
b. Ethics committee approval c. Electronic database structure d. Definitions
e. Statistical analysis
f. Data-driven modelling of new scoring systems
i. Visualizing multi-dimensional datasets: the t-SNE approach ii. Mining insights from multi-dimensional datasets: computational
topology and Mapper algorithm
iii. Statistical methods adopted in topological data analysis 1. Chi-squared test (χ2)
2. Receiver-operating characteristic (ROC) 3. Jaccard similarities
4. Machine learning for data-driven modelling
3. Results 4. Discussion
Abstract
Introduction: atrial fibrillation (AF) is common among critically-ill patients, who are
considered at increased cardioembolic and haemorragic risk. Consequently, anticoagulant therapy might be ineffective or harmful for an excess of haemorragic events which could not be counterbalanced by an adequate reduction of cardioembolic occurrences.
Aims: main outcome (MO) was the composite of death or intensive care unit (ICU) transfer
in a population of critically-ill subjects admitted to a medical subintensive care unit (sICU); we assessed (i) thromboembolic events (TEE) and major haemorrhages (MH); (ii) current guidelines (GL) adherence and related outcomes; (iii) performance of validated risk scores for TEE and MH; we engineered (iv) new scores adopting machine learning (ML) predicting MO, TEE, MH.
Patients and Methods: single-center, retrospective study enrolling all the consecutive
AF-affected patients admitted to a sICU for critical illness. Demographic, clinical, therapeutic and laboratoristic data were collected. Performance of CHA2DS2-VASc and HAS-BLED
scores was evaluated. GL-adherence and its relationship with outcomes was studied. ML was used to engineer new predictive models.
Results: we enrolled 1430 subjects; CHA2DS2-VASc (AUC:0.516;95%CI:0.472-0.560) and
HAS-BLED (AUC:0.493;95%CI:0.443-0.543) did not predict TEE or MH; in-hospital warfarin use was associated to increased MO risk (OR:1.73;95%CI:1.06-2.83; p<0.05); low-molecular-weight-heparin use was not associated to an increased MO risk; antiplatelet drugs use was associated to MO risk reduction (OR:0.51;95%CI:0.34-0.78;p<0.002). GL-adherent treatment was associated to TEE risk reduction and MH and MO risk increase; ML identified specific features for MO, TEE, MH: ML-based classifiers outperformed CHA2DS2-VASc
(AUC: from 0.516 to 0.90, p<0.0001) and HAS-BLED (AUC: from 0.493 to 0.82, p<0.0001).
Discussion: AF-related outcomes cannot be predicted in critically-ill patients with currently
MH and MO increase. ML algorithms can identify the most important features and shape specific scores able to outperform the classical models.
1. Introduction
Atrial fibrillation in the critically-ill patient
Atrial fibrillation (AF) is the most common sustained arrhythmia observed both in general population[1] and in several groups of hospitalized patients[2]. Among critically-ill subjects admitted in intensive care units (ICU), pre-existing and new-onset forms of AF can be observed in 1 out of 3 admitted patients[3].
New-onset AF has a prevalence ranging between 5 and 46%[4] and represents 47.4-61% of all the arrhythmias and 52% of the atrial arrhythmias observed in ICU[2,5,6]. Pre-existing AF follows the same prevalence of the general population[7], and is present in 9% of the patients admitted to ICU for critical illness[8]. Moreover, pre-existing AF has a better-known pathophysiology: it is strongly linked to ageing[9,10] and its associated comorbidities, as chronic heart failure (CHF), diabetes, valvular diseases, acute coronary syndromes (ACS) and hypertension (HYP)[11]. These disorders favour atrial structural and electrical remodelling, offering an ideal arrhythmogenic substrate[12]. Several factors, as electrolytic and volume disturbances, sympathetic and parasympathetic activity alterations are common AF triggers. The association of a substrate and a trigger is able to initiate and maintain AF[12,13].
The classical risk factors and triggers, however, show a weaker association with AF when it occurs during a critical illness[14], and other features seem to be implied in triggering and maintaining new-onset AF[4]. Acute pathologies, presence of organ failure and the activation of the inflammatory systemic response are supposed to induce atrial structural and electric remodelling[3,14,15]. Beta-agonist and vasopressor drugs, sustained tachycardia, bacterial toxins, neuro-hormonal and electrolyte disturbances, myocardial ischemia and volume overload can trigger a new-onset AF[3,4]. Moreover, proinflammatory cytokines have a direct arrhythmogenic effect of on atrial myocardium[16].
deterioration of global haemodynamic due to fast and irregular ventricular response rate and to the loss of atrial systole[3,17], but also to an increased risk of stroke[18], acute heart failure (AHF)[19], and death[3].
Several authors showed that AF increased the risk of in-hospital mortality in specific pathologies, as in sepsis[20], trauma[21], ACS[22,23] and AHF[24], but also in generic cohorts of critically-ill patients admitted both in medical[25] and surgical[26] ICU. In the long-term, these patients had a greater risk of rehospitalisation for AHF and stroke and an increased risk of death, which remained high up to 5 years after hospital discharge[27].
Previous reports underlined the association between poorer clinical outcomes and new-onset AF[14]. However, new-onset AF did not always result independently predictive for in-hospital mortality after adjusting for disease severity, suggesting that this type of AF could be a marker of prognosis rather than an independent risk factor[28,29]. Pre-existing AF has been identified as an independent risk factor for in-hospital mortality and worse functional outcomes in ACS, AHF[22,30,31] and in generic ICU populations[8].
Despite the epidemiologic and prognostic relevance of the problem, the clinical management of AF during a critical illness is still object of debate. Currently, studies underline no benefit of a rhythm control over a rate control strategy in the critically-ill patient, and do not allow to generate any recommendation for a standard treatment[32], except for the cases of cardiogenic shock due to elevated cardiac frequency, where urgent electric cardioversion is mandatory[1]. Medications adopted for both rate and rhythm control are poorly evaluated in the setting of a critical illness and several studies underlined a significant practice variability in the prescription of different rate-control drugs[3]. Even the correct dose of commonly used medications, as amiodarone or magnesium sulphate, is currently under investigation in the specific clinical setting of ICU and in severe sepsis (clinicaltrials.gov ID NCT01049464; clinicaltrials.gov ID: NCT02668432).
Critical illness itself represents a procoagulant state, and the coexistence of AF implies a markedly increased thromboembolic risk[33]. This increased risk has been demonstrated for new-onset AF in severe sepsis[18], ACS[34], AHF[35] and acute respiratory failure (ARF)[36]. Similarly, pre-existing AF has been associated to an increased stroke risk in ICU patients[8]. Anticoagulation in this subset of patients, however, has not been related to a significant reduction of stroke risk, but to a significant increase of bleeding risk[36,37].
The accuracy of the currently adopted clinical prediction scores in critically-ill subjects is still object of debate: while some authors recommend the use of CHA2DS2-VASc
score at a different cutoff to stratify the thromboembolic risk in the critically-ill patients[38], others underline its low predictive value[36,39] and emphasise the presence of a very high haemorragic risk which cannot be accurately quantified by HAS-BLED score[36,40].
Medical population of a semi-intensive care unit
The number of critically-ill patients (and their comorbidities) is increasing along with ageing of the population. In order to reduce ICU overcrowding and optimize resources, this subset of patients is often managed in specific Internal Medicine departments, named semi-intensive care units, or sICU. The sICU population usually differs from ICU for a more advanced age of patients but also for an increased number of comorbidities as chronic respiratory failure, chronic kidney disease, dementia, CHF and cancer, with a worse prognostic profile and an even higher AF prevalence due to age and associated pathologies.
Current use of big data and machine learning in medicine
Medical informations are now collected continuously at the bedside: demographic data, clinical informations, pharmacological therapy, physiological signs, laboratory analysis and radiologic data can now be easily collected, stored and analysed. Thus, a big data repository is usually defined by five “Vs”: volume (large quantity of data), velocity (high speed of acquisition), variety (difference of the data sources), veracity (uncertainty of data quality) and
value (possible valorisation of the data)[41]. Both ICU and sICU, for their technological implementation, represent the ideal environment where to collect and analyse this type of informations.
Due to its multidimensionality, big data analysis cannot be adequately performed with the classical statistical methods: several machine learning (ML) techniques are currently used to explore hidden relationships between different variables. This process is done automatically, but a human supervision is often necessary to clarify the results and avoid spurious interpretations.
Techniques based on a specific set of algorithms, named topological data analysis (TDA), are commonly used to explain relationships between variables in large datasets, especially in critical bio-medical and medical phenomena. TDA has been successfully applied in medical studies regarding cancer[42], simulated human immune systems dynamics[43] and pulmonary embolism (PE)[44]. In the setting of TDA, our group already used an hypernetwork approach and Q-analysis to identify informative medical features and instruct an artificial neural network to predict automatically the pretest probability of PE[44]. Hypernetworks provide a significant generalization of network theory, enabling the integration of relational structure, logic and analytic dynamics. With this novel approach, the resulting neural hypernetwork correctly recognized 94% of the patients affected by PE before the CT-scan. In other studies in the same dataset, we identified key features which were best associated to PE diagnosis[45,46] to engineer a ML algorithm which was able to outperform the classical methods, represented by Wells and Geneve scores.
Aims of the study
Objective of Atrial Fibrillation In Critically ILL (AFICILL) study was to evaluate the occurrence of the main outcome (MO), defined as death or ICU transfer, in a single-cohort, retrospective study of critically-ill patients affected by AF and admitted to a medical sICU.
• evaluate risk factors, comorbidities and concurrent clinical events significantly and independently associated to MO;
• assess the prevalence of cardioembolic events (TEE) and major haemorrhage (MH) as main clinical adverse events associated to AF in this setting;
• appraise the association and the predictive capacity of CHA2DS2-VASc for TEE
and HAS-BLED for MH in this cohort;
• estimate the adherence to the indications of the European Society of Cardiology (ESC) AF guidelines[1] for anticoagulant therapy and assess the association between guidelines adherence (GL) and adverse clinical events;
• identify risk factors for MO, TEE and MH in this population of patients and generate new predictive models adopting a TDA-based, ML algorithm.
2. Patients and Methods
Study cohort and baseline characteristics
In order to evaluate the study objectives, we retrospectively analyzed a cohort of critically-ill patients with AF admitted to the internal and sub-intensive medicine department of the Azienda Ospedaliero-Universitaria “Ospedali Riuniti” in Ancona, Italy. Since January 01st 2002 the department adopted an electronic medical record (eMR) system for inpatients’
management, that allows to interrogate the main database to select patients characterized by a specific diagnosis. All diagnoses in the eMR are coded according to ICD-9 system. In the aim of the study, we selected all patients admitted to the sICU with a concurrent diagnosis of AF (ICD-9: 427.31) from inception to 31/03/2018, then we randomly decided “a priori” to select the first consecutive 25% of the entire AF cohort to include in the study, in order to keep the data collection timely and effective. Afterward, we excluded all patients admitted performing a planned cardioversion procedure for AF rhythm control, stable patients without acute organ failure and patients admitted for trauma or surgical pathologies in order to keep only the medical, critically-ill patients. We then obtained from the eMR and from the detailed examination of discharge reports all the data regarding demographics, history of risk factors and comorbidities, admission diagnoses, concurrent clinical events and use of antithrombotic drugs.
Power Analysis
According to literature, mortality due to critical illness in ICU is estimated at 15% of the population. Setting a priori an alfa of 0.050 in a two-tailed test, we estimated that a sample size of 1430 patients was able to establish this outcome with a precision of ±2% (95%CI).
The local ethics committee (CERM, Comitato Etico Regione Marche, Azienda Ospedaliero-Universitaria “Ospedali Riuniti”, Ancona, Italy) reviewed the protocol and approved the study (protocol number: 2018/168, 21/06/2018, see Appendix 1).
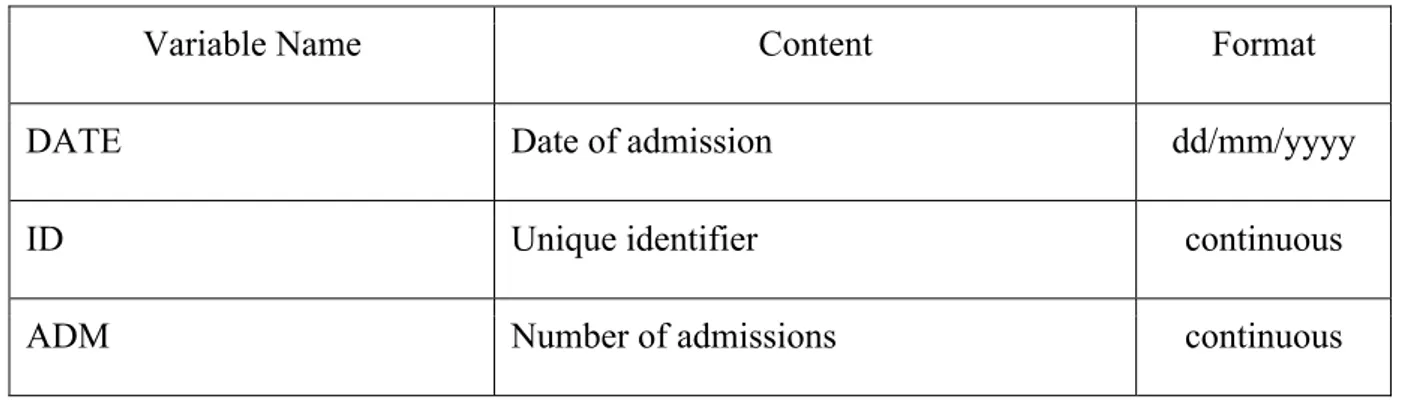
Electronic Database Structure
The database structure, the format of the collected variables, their content, their names and abbreviations are synthesized in Table 1. We collected the unique identifier, the number of admissions and the patient’s age at the admission as continuous variables. Main outcome, sex, electric cardioversion (CVE), pharmacologic cardioversion (CVF), the reason of sUTI admission (syncope, trauma, acute coronary syndrome, acute heart failure, cardiogenic shock, haemorragic shock, septic shock, acute kidney injury and acute respiratory failure), comorbidities (chronic heart failure, chronic obstructive lung disease, peripheral artery disease, previous stroke/TIA, chronic hepatic pathology, chronic kidney disease, chronic ischemic cardiopathy, diabetes mellitus, chronic anaemia, hypertension, active cancer, alcohol abuse, mitral valve disease and aortic valve disease), previous gastrointestinal (GI) bleeding, low time in therapeutic range (TTR), acetylsalicylic acid/clopidogrel use were categorized as binary variables.
Type of AF, type of MH, type of TEE, anticoagulant therapy at admission, anticoagulant therapy at discharge, acute neurologic syndromes, infections and the number of comorbidities were collected as categorical variables.
Table 1: Database structure and type of collected variables
Variable Name Content Format
DATE Date of admission dd/mm/yyyy
ID Unique identifier continuous
SEX Patient’s sex binary
AGE Patient’s age at the admission continuous
MO In-hospital death or ICU transfer
0: Discharged 1: Death in sUTI 1: UTI transfer
binary
AF_TYPE Atrial fibrillation type
1: Paroxysmal 2: Persistent 3: Permanent
categorial
MH_TYPE Major haemorrhage type
1: ICH/ESA
2: Gastrointestinal bleeding 3: Urinary tract bleeding 4: Intramuscular bleeding 5: Other
categorial
TEE_TYPE Cardioembolic event type
1: Stroke/TIA
2: Atrial appendage thrombus 3: Systemic embolization
4: Lower limb ischemia (embolic)
categorial
CVE Electric cardioversion binary
CVF Pharmacologic cardioversion binary
0: Warfarin 1: LMWH
3: No Anticoagulant
AC_DISMISS Anticoagulant therapy at discharge 0: Warfarin
1: LMWH
3: No Anticoagulant
categorial
Critical Illnesses at sICU admission
SYN Syncope binary
AC_NEUR Acute neurologic syndromes binary
TRAUMA Trauma binary
ACS Acute coronary syndromes binary
AHF Acute heart failure binary
CS Cardiogenic shock binary
HS Haemorragic shock binary
SS Septic shock binary
AKI Acute kidney injury binary
ARF Acute respiratory failure binary
INF Infection
1: Pneumonia
2: Abdominal infections 3: Urinary tract infections 4: Other
Comorbidities
CHF Chronic heart failure binary
COPD Chronic obstructive lung disease binary
PAD Peripheral artery disease binary
STROKE_TIA Previous stroke or TIA binary
CHP Chronic hepatic pathologies binary
CKD Chronic kidney disease binary
CCS Chronic ischemic cardiopathy binary
T2DM Type 2 diabetes mellitus binary
CA Chronic anaemia binary
PREVIOUS_BLEED Previous gastrointestinal bleeding binary
HYP Hypertension binary
AC Active cancer binary
COMORBIDITIES Number of comorbidities categorial
ASA_CLOP Acetylsalicylic acid or Clopidogrel use binary
ALC_ABUSE Chronic alcohol abuse binary
MV_PAT Mitral Valve Disease binary
AO_PAT Aortic valve disease binary
CHA2DS2-VASc CHA2DS2-VASc Score categorial
HASBLED HAS-BLED Score categorial
CHADS2 CHADS2 Score categorial
Legend: ICU=intensive-care unit; sICU= subintensive-care unit; ICH= intracranial
hemorrhage; ESA= subarachnoid hemorrhage; TIA= transient ischemic attack; LMWH= low molecular weight heparin.
We calculated CHADS2, CHA2DS2-VASc and HAS-BLED score following their
original definitions [47–49], as shown in Table 2 and Table 3 and collected these scores as categorical variables.
Table 2: CHADS2 and CHA2DS2-VASc score
CHADS2 Score
Item Meaning Score
C CHF History +1
A Age >75 +1
D Diabetes Mellitus +1
S2 Previous Stroke / TIA / Thromboembolism +2
CHA2DS2-VASc Score
Item Meaning Score
C CHF History +1
H Hypertension History +1
A2 Age: >75 +2
D Diabetes Mellitus +1
S2 Previous Stroke / TIA / Thromboembolism +2
V Vascular disease History +1
A Age: 65-74 +1
Sc Sex Category (i.e. Female Sex) + 1
Legend: CHF= chronic heart failure; TIA= transient ischemic attack.
Table 3: HAS-BLED score
Item Meaning Score
H Hypertension +1
A Age > 65 +1
Labile INR (TTR < 60%) +1
B Prior Major Bleeding or Predisposition +1
L Liver Disease +1
Renal Disease +1
E Alcohol Use +1
D Drugs (ASA, NSAIDS) +1
Legend: INR= international normalized ratio; TTR= time in therapeutic range; ASA= acetyl
salicylic acid; NSAIDS= non-steroidal anti-inflammatory drugs.
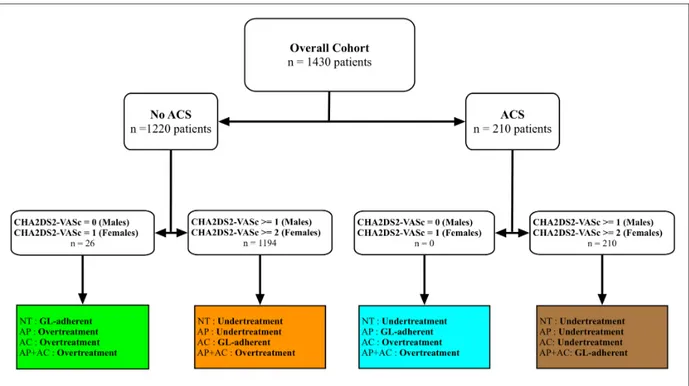
Last, we subdivided the overall sample according to GL-adherence. For patients without ACS we considered the indications in the 2016 ESC guidelines on AF[1]. For patients admitted with ACS, we also considered the indications in latest ESC GL on ACS[50,51]. Patients were divided into GL-adherent, overtreated or undertreated according their admission diagnosis and therapy, as shown in Figure 1.
Figure 1: Subdivision of the sample according to current GL adherence
Legend: NT= no treatment; AP= antiplatelet therapy; AC= anticoagulant therapy; AP+AC=
antiplatelet and anticoagulant therapy; GL= guidelines
Definitions
• critically-ill patient: we defined as “critically-ill” all the subjects who – at the admission – had one or more medical conditions at high risk of death, following the MeSH definition, and who were admitted with at least one acute organ dysfunction.
• main outcome (MO): we intended to evaluate the rate of therapeutic failure, defined as in-hospital mortality or ICU transfer.
• major bleeding (MH): we collected all the major haemorragic events defined according ISTH definition of MH in non-surgical patients[52], intended as (i) fatal bleeding, and/or (ii) symptomatic bleeding in a critical area or organ (intracranial, intraspinal, intraocular, retroperitoneal, intra‐articular or
bleeding causing a fall in haemoglobin level ≥ 20 g/L, or leading to transfusion of ≥ 2 units of whole blood or red cells. Particularly, we classified MH into the following subclasses: o intracranial haemorrhage (ICH) or subarachnoid haemorrhage (ESA) o gastrointestinal bleeding o urinary tract bleeding o intramuscular or retroperitoneal bleeding o other sites
• thromboembolic event (TEE): we recorded all the ischemic events with a presumable cardioembolic source during AF as stroke, TIA or systemic embolization.
o stroke/TIA: we enrolled all subjects with stroke or transient ischemic attack (TIA) where AF was the most probable source of embolism, after evaluating all other causes of non-AF cardioembolic stroke[53].
o atrial appendage thrombus: enrolled subjects undergoing to urgent electric or pharmacologic cardioversion were submitted to trans-oesophageal echocardiography, and the presence of thrombi in the atrial appendages was recorded.
o embolic limb ischemia: acute ischemia of embolic origin appearing in lower or upper limbs.
o systemic embolization: presence of synchronous embolization in multiple sites (visceral, limb and cerebral).
• atrial fibrillation (AF): all patients underwent electrocardiogram at the admission in our sICU; we admitted all patients showing the typical AF pattern, as defined by ESC Guidelines 2016: “absolutely irregular RR intervals and no
discernible, distinct P waves”[1]. We excluded from the study all the cases where the cause of the arrhythmia was deemed to be associated to a valvular disease (such as mechanic valves or severe mitral disease). We deemed as diagnostic the documented episodes lasting at least 30 seconds. According to clinical history, we classified AF into three subclasses[1]:
o paroxysmal: events self-terminating within 48 hours after admission or cardioverted within 7 days from onset.
o persistent: events lasting more than 7 days or undergoing cardioversion after 7 or more days.
o permanent: events in which a rate-control approach was preferred to a rhythm-control approach.
• electrical cardioversion (CVE), pharmacologic cardioversion (CVF): patients who were selected for rhythm-control strategies underwent to CVE or CVF, according current guidelines[1]. A treatment strategy, drug or procedure was not preferred over another.
• anticoagulant therapy at admission (ADM), anticoagulant therapy at discharge
(DIS): we recorded all the anticoagulant therapies at admission and at the
discharge of each subject. Direct oral anticoagulants (DOACs) were not available at the time of the study. Particularly, we evaluated the use of:
o warfarin
o low molecular weight heparin (LMWH) o no anticoagulant therapy
• reason of admission in sICU: the acute pathology for sICU admission was synthesized and collected. Of note, more than one acute pathology could be
o syncope (SYN): patients assessed for transient loss of consciousness in whom a definite diagnosis of cardiogenic cause was ascertained according to the 2009 ESC guidelines on management of syncope[54], which were adopted at the time of the study.
o acute neurological syndromes (ANS): subjects admitted for status epilepticus or other life-threatening neurological pathologies, except stroke/TIA, which was recorded as part of TEE. o trauma: patients admitted for major head trauma, blunt or open thoracic trauma, blunt or open abdominal trauma were gathered. o acute coronary syndrome (ACS): ST-elevated or non-ST elevated ACS were diagnosed according current guidelines[50,51] and classified according to the third universal definition of myocardial infarction[55].
o acute heart failure (AHF) was defined and diagnosed according current ESC guidelines[56] as a rapid onset or worsening of typical symptoms, as breathlessness, ankle swelling and fatigue, accompanied by signs, as elevated jugular venous pressure, pulmonary crackles and peripheral oedema[56].
o shock: was defined as a failure to perfuse or oxygenate vital organs, according MeSH definition, and was subdivided, upon the aetiology, into:
§ cardiogenic shock (CS) was identified as a state of end-organ
hypoperfusion due to cardiac failure[57].
§ haemorragic shock (HS) was defined as a form of hypovolemic
shock in which severe blood loss leads to inadequate oxygen delivery at the cellular level[58].
§ septic shock (SS) was diagnosed according to 2001
SCCM/ESICM/ACCP/ATS/SIS International Sepsis Definitions Conference definition[59].
o acute kidney injury (AKI) was diagnosed, adopting the modified RIFLE criteria, as a serum creatinine increase ≥ 0.3 mg/dl occurring within a 48-hour period[60].
o acute respiratory failure (ARF): was defined as the acute inadequacy of the lungs to maintain either acceptable blood oxygenation, or to allow a normal arterial blood carbon dioxide levels or both[61] and categorized in type 1 (hypoxemic) or type 2 (hypercapnic).
o infection (INF) was defined by the clinical, radiologic and cultural detection of an infection in a specific organ, and was subdivided into:
§ thoracic infections (pneumonia, mediastinitis)
§ non-surgical abdominal infections (appendicitis, cholecystitis, diverticulitis, peritonitis)
§ symptomatic urinary tract infections
§ other
• comorbidities: we also investigated the presence of one or more associated chronic pathologies in each enrolled patient.
o chronic heart failure (CHF) was diagnosed according current guidelines[56] and defined as “a clinical syndrome characterized by typical symptoms (e.g. breathlessness, ankle swelling and fatigue) that may be accompanied by signs (e.g. elevated jugular venous pressure, pulmonary crackles and peripheral oedema) caused by a structural
and/or functional cardiac abnormality, resulting in a reduced cardiac output and/or elevated intracardiac pressures at rest or during stress”. o chronic obstructive lung disease (COPD) was diagnosed according current
guidelines[62] and defined as persistent respiratory symptoms and airflow limitation due to airway and/or alveolar abnormalities.
o peripheral artery disease (PAD) was diagnosed by physical examination, history and echo-colour doppler and defined as a chronic tissue hypoperfusion due to atherosclerosis of extracranial carotid and vertebral, mesenteric, renal, upper and lower extremity arteries[63]. o previous stroke/TIA: was defined as a history of stroke or TIA.
o chronic hepatic pathologies (CHP) were defined as the presence of cirrhosis of any cause or chronic infection by HBV, HCV or other hepatotropic viruses.
o chronic kidney disease (CKD) was defined as kidney damage or glomerular filtration rate (GFR) <60 mL/min/1.73 m2 for 3 months or more, irrespective of cause[64]. eGFR was estimated with Cockroft-Gault formula.
o chronic ischemic cardiopathy (CCS) was diagnosed in presence of a history of myocardial infarction or chest discomfort (angina pectoris)[65].
o type 2 diabetes mellitus (T2DM) was diagnosed in presence of a history of T2DM and/or anti-diabetic therapies at the admission.
o chronic anaemia (CA) was diagnosed when a chronic reduction of haemoglobin below 13.7 g/dl in men and below 12.2 g/dl in women[66]. o previous gastrointestinal (GI) bleeding: was defined as a history of upper
o hypertension (HYP) was identified in presence of a history of poorly controlled hypertension and/or anti-hypertensive therapy use at the admission with an history of poor blood pressure control. Due to the frequent alterations of blood pressure values in the critically-ill patient, we did not consider the blood pressure values during hospitalization for diagnostic purposes.
o active cancer (AC) was diagnosed in presence of history, physical examination and laboratoristic/instrumental exams suggestive for active cancer at the admission of the patient.
o low time in therapeutic range (TTR) the quality of anticoagulation in the 12 months preceding the hospitalization in patients anticoagulated with warfarin was evaluated with TTR, calculated with the Rosendaal method[67]: TTR was defined labile for values < 60%, as required by the HAS-BLED score.
o use of acetylsalicylic acid or clopidogrel (ASA_CLOP) was defined by the use, at the time of admission, of acetylsalicylic acid, clopidogrel or other antiplatelet drugs.
o alcohol abuse (ALC) was defined as chronic abuse of alcoholic substances. o mitral valve disease (MVP) or aortic valve disease (AVP): were diagnosed if
at echocardiogram were present mitral valve stenosis and/or insufficiency and/or aortic valve stenosis and/or insufficiency. We excluded from the present study all the patients in whom the cause of AF was attributable to the valvular pathology.
Continuous variables were reported as mean and standard deviation (SD) or median and interquartile range (IQR), according to a normal or non-normal distribution of values. The statistical difference between subgroups has been evaluated, respectively, with t-test (2 groups, normal distribution), ANOVA test (more than 2 groups) or with Mann-Whitney U test (2 groups, non-normal distribution) and Kruskal-Wallis ANOVA test (more than two groups). Categorial variables were reported as number of subjects and their proportion. Differences between subgroups have been evaluated with χ2 test.
The association of the clinical factors with the main outcome was evaluated with logistic regression analysis. Demographic and clinical variables was assessed first with univariate analysis: all the variables associated with the main outcome with a p value equal or less than 0.010 were included in the multivariate analysis. The association between risk scores and adverse clinical events was assessed with a logistic regression model developed with the same methodology adopted to study the relationship between clinical factors and the main outcome.
Predictivity of risk scores was evaluated adopting the c-statistics. We calculated also sensitivity (Se), specificity (Sp), positive predictive value (PPV) and negative predictive value (NPV) adopting the standard cut-offs. Receiver-operator curves (ROC) were calculated in 2D graphs considering the true positive rate (Se) in the y-axis and the true negative rate (1-Sp) in the x-axis. For each curve, the area under the curve (AUC) was calculated. Differences between curves were calculated accordingly to DeLong method[68].
We considered as statistically significant a p-value less or equal to 0.05 for two-tailed tests. Statistical analysis has been performed with SPSS 25.0 and Microsoft Excel for Mac OSx.
Visualizing multi-dimensional datasets: the t-SNE approach. The dataset under
examination described each patient with 45 categorical and numerical variables synthesizing different clinical aspects of the enrolled patients.
Because of this high dimensionality, the dataset could not be immediately visualized by human brain, which is capable to shape only data belonging to 3 dimensions. A first attempt to visualize the dataset could be of producing a huge amount of 3d scatter plots made by plotting 3 variables at time. This brute-force approach, however, is able to discern only a few and incomplete set of insights. Thus, is important to instruct a more complex but suitable approach for dataset visualization.
Literature suggests different techniques for visualizing high dimensional datasets: for a complete review we referred to [69]. Among these, t-Distributed Stochastic Neighbour Embedding (t-SNE) is one of the mostly used techniques, which is able to visualize datasets up to 50 dimensions. t-SNE is defined as a “non-linear dimensionality reduction algorithm”, which finds patterns in the data by identifying observed clusters based on similarity of data points with multiple features. It is important to underline the concept that t-SNE is not a clustering algorithm, but a “dimensionality reduction algorithm”, which maps the multi-dimensional data to a lower multi-dimensional space, where the input features are no longer identifiable. Thus, it is not possible to make any inference using t-SNE output only which is conceptually a data exploration and visualization technique. t-SNE maps multi-dimensional data to two or more dimensions, making it suitable for human observation. The algorithm for computing t-SNE considers 4 main steps. Step 1 and Step 2 calculate the conditional probability of similarity between a pair of points in high dimensional space and then in low dimensional space. In Step 3 and Step 4 t-SNE tries to minimize the sum of the difference in conditional probabilities and the algorithm finds the best parameters for retaining the local structure of the data in the map. This algorithm optimizes the search of the “hyper-parameter”
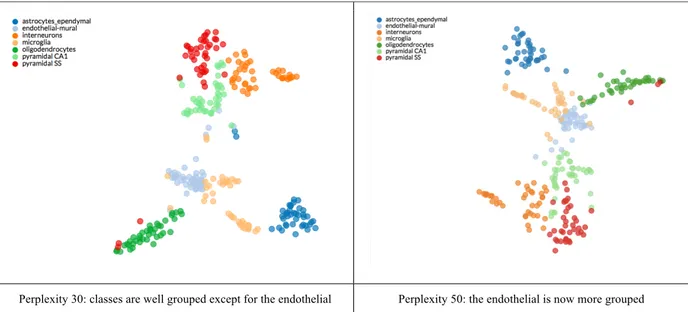
interpreted as a smooth measure of the effective number of neighbours. Typical values are between 5 and 50. For a complete technical overview of this methodology we refer to [70,71]. In Table 4 we report a comparison by using different perplexity values on the same dataset[72].
Medical studies often use principal component analysis (PCA), which is a long-standing technique for data visualization and reduction. However, PCA has some limitations: it is a linear algorithm, and it will not be able to interpret complex non-linear relationship between features. A major problem with linear dimensionality reduction algorithms is that they concentrate on placing dissimilar data points far apart in a lower dimension representation. However, in order to represent high dimensional data on lower dimensions it is important that similar data points must be represented close together, which is not what linear dimensionality reduction algorithms do. For a complete technical review of t-SNE we refer to [73].
Table 4: example of t-SNE: visualization of cell types in the mouse cortex and hippocampus.
Mining insights from multi-dimensional datasets: computational topology and Mapper algorithm: t-SNE retains both the local and global structure of the data at the same
time but it does not care of the meta-scale proximities among data. Meta-scale is the dimension between micro and macro. Topology is the branch of mathematics that aims to study the shapes and the maps among them. A topological space is an abstract space equipped with some notions of similarities. There are several ways for building a topological space, we are interested to the ones obtained by using the so-called simplicial complex.
Simplicial complex is the most suitable construction of topological space even they are combinatorial objects that can be easily constructed and studied by software systems. An abstract simplicial complex is the subset of the power set of a vertex set. For example, given the vertex set V = {0,1,2}, the power set 2V of V is 2V ={{∅},{0},{1},{2},{0,1},{0,2},{1,2},{0,1,2}}, and one simplicial complex can be {0,1,2}.
Instead of dealing with an abstract simplicial complex, the researcher could be interested in geometrical construction: a simplicial complex is obtained by nesting together small pieces, known as simplices. The most common simplices are labelled as follows: 0-simplex is represented by a vertex, 1-0-simplex is represented by an edge, 2-0-simplex is represented by a filled triangle, 3-simplex is represented by a filled tetrahedron. During the construction of the final simplicial complex only a constrain must be respected: the intersection between two simplices must be the empty set or must be proper, meaning that they must share all their simplices or at least one simplices of dimension less the dimension of the whole simplices. A new set of algorithms for the construction of simplicial complexes and their analysis has been derived from algebraic topology and they are known as
topological data analysis. TDA is sensitive to both large- and small-scale patterns that often
fail to be detected by other analysis methods, such as principal component analysis, (PCA), multidimensional scaling, (MDS), and cluster analysis.
This technique is able to explore and synthesize the relationships between large sets of data and is nowadays largely used for exploratory data mining in big data studies. An
Figure 3: (A) a 3D object (hand) is represented as a point cloud. (B) a filter value is applied
to the point cloud and the object is now coloured by the values of the filter function. (C) the data set is binned into overlapping groups. (D) each bin is clustered and a network is built. Picture and caption from [74].
TDA can be derived in three main classes of algorithms: persistent homology,
hypernetwork and mapper. Homology is an algebraic machinery that counts the number of
holes in a simplicial complex. Persistent homology is the computational implementation of homology. Persistent homology builds simplicial complexes from data in an iterative fashion. If the input dataset is a point cloud data, a Vietoris-Rips algorithm or equivalent is used to build the simplicial complex. While, if the input dataset is a network then the completion to a simplicial complex is obtained by clique weight rank persistent homology. Once the simplicial complex is obtained its homology is studied. Persistent homology takes as input the list of simplices within a simplicial complex and iterates over. At each iteration simplicies are added to the topological space and the number of n-dimensional holes is computed. Holes that are found at the end of the process are labelled as persistent, the other are classified as noise.
Mapper builds a 1-dimensional simplicial complex from data. A 1-dimensional
simplicial complex is obtained connecting together vertices (nodes) with edges. This structure coincides with a graph. A graph G is a set of nodes V and a set of edges E: G=(V,E) where E⊆VxV. Before recalling the technical details of the Mapper algorithm, we provide an example in Figure 4.
Figure 4: An example of Mapper with artificially generated 2D point cloud data
The example in Figure 4 shows Mapper output from an artificially-generated point cloud data. The data in the example consists of 5000 points randomly generated from a Gaussian distribution surrounding three centroids at [x, y] coordinates: [10, 20], [-10, -17], [17, -10]; with a standard deviation of 9. The simplicial complex (right) contains a flare. The top arm ends with another flare made by two nodes indicating the two clusters in the bottom of the picture. The second arm ends with a node indicating the upper cluster in the picture. The method consists of a number of steps, given a point cloud with N points 𝑥 ∈ 𝑋 (Figures 3 and 4):
1. We start with a function 𝑓: 𝑋 → ℜ whose value is known for the N data points. We call this function a filter. The function should convey some interesting geometric or
2. Citing from [75]: “Finding the range (I) of the filter f restricted to the set X and creating a cover of X by dividing I into a set of smaller intervals (S) which overlap. This gives us two parameters which can be used to control resolution namely the length of the smaller intervals (l) and the percentage overlap between successive intervals (p)”.
3. Citing from [75]: “Now, for each interval 𝐼* ∈ 𝑆, we find the set 𝑋* = {𝑥|𝑓(𝑥) ∈ 𝐼*} of points which form its domain. The set Xj forms a cover of X, and 𝑋 ⊆ ⋃ 𝑋* *”.
4. Choosing a metric d(-,-) to get the set of all interpoint distances 𝐷𝑗 = {𝑑(𝑥𝑎; 𝑥𝑏)|𝑥𝑎; 𝑥𝑏 ∈ 𝑋𝑗}
5. For each Xj together with the set of distances Dj we find clusters {𝑋*:}.
6. Each cluster then becomes a vertex in our complex and an edge is created between vertices if 𝑋*:∩ 𝑋<= = ∅ meaning that two clusters share a common point.
For a review of the technical details of the algorithm we refer to [75]. In this work we have used the Python language implementation of the Mapper algorithm called Kepler
Mapper [76].
Statistical methods adopted in TDA
• Chi-squared test (χ2): feature reduction is the step of reducing the number of
features to improve model construction. There are two main approaches for feature reduction: feature selection and feature combination. They can be used together. Feature selection is the process of selecting a subset of relevant and informative variables to be used in model construction. In feature combination the features are combined together (linearly or not) by building a new set of artificial features. Usually in feature combinations the features are weighted by coefficients reflecting features’ relevance. Several approaches for feature selection are available, however they rely mainly on statistical tests. χ2 statistical
tests are widely used for selecting features that form the input space of classifiers. χ2 is used in statistics to test the independence of two events. Given
dataset about two events, we can get the observed count O and the expected count E. χ2 measures how much the expected counts E and observed Count O
derivate from each other. n feature selection, the two events are occurrence of the feature and occurrence of the class. If the two events are dependent, we can use the occurrence of the feature to predict the occurrence of the class. We aim to select the features, of which the occurrence is highly dependent on the occurrence of the class: the higher value of the χ2 score, the more likelihood the
feature is correlated with the class, thus it should be selected for model training [77].
• Receiver-operating characteristic (ROC) in TDA: in modern medicine, the validity of a dichotomous diagnostic test is determined by sensitivity and specificity. ROC curve is the plot that displays the full picture of trade-off between the true positive rate (Se) and false positive rate (1-Sp) across a series of inherent validity of a diagnostic test. This curve is useful in evaluating the discriminatory ability of a test to correctly pick up diseased and non-diseased subjects and finding the optimal cut-off point to least misclassify diseased and non-diseased subjects. The AUC is a single index for measuring the performance a test. The larger the AUC, the better is the overall performance of the medical test to correctly identify healthy and non-unhealthy subjects. Equal AUCs of two tests represent similar overall performances, however this does not necessary mean that both the curves are identical. We calculated the optimal cutoff value in each ROC curve adopting Youden's J statistic. ROC curves were compared adopting Delong method[68].
• Jaccard similarities. The Jaccard Similarity coefficient is a statistic used to compare the similarity and diversity of sample sets. The Jaccard coefficient measures similarity between sample sets, and it is defined as:
𝐽(𝑀𝐷, 𝐴𝐷) =|𝑀𝐷 ∩ 𝐴𝐷| |𝑀𝐷 ∪ 𝐴𝐷| Where:
• MD is the medical doctor diagnosis (0 or 1)
• AD is the diagnosis obtained with some other approach, e.g. algorithm (0 or 1) • Machine learning for data-driven modelling. ML is often defined as a “field of study that gives computers the ability to learn without being explicitly programmed”. It means that a ML algorithm learns from the data a set of parameters necessary for adapting the algorithm to the dataset under analysis. As an example, we will use a simple linear equation, defined as: 𝑦 = 𝑎𝑥 + 𝑏: given a set of pairs of x and y (the so-called training set) a ML regressor algorithm will be able to extract automatically the proper values of a and b so that, given a new unseen x, it will approximate the equation. Of course, ML is used for more complicated problems, where it is quite impossible to explicitly write the analytical form. With this example we have introduced the concept of “regressor” that is an algorithm able for predicting continuous numbers. A second class of algorithms is called
classifier: the ML algorithm learns from a training set to automatically classify a
new unseen input in a set of classes. ML algorithms learn from data a set of parameters for better approximating the map projecting the inputs with the output(s). However, the selection of which ML algorithm to be used and its partial initial configuration (e.g. number of layers and nodes of an artificial neural network) is demanded to the data scientist experiences. Moreover, a ML pipeline is often composed by a collection of algorithms interacting each other.
Thus, given a dataset the engineering of a ML pipeline in terms of algorithms down-selection and their configuration becomes a daunting task. Recently, a new class of framework called AutoML is emerging. AutoML systems aim to assist data scientist in the selection of the proper algorithms and their automatic tuning. Among the other, Tree-based Pipeline Optimization Tool (TPOT) framework is receiving interest from the data science community. TPOT automatically designs and optimizes ML pipelines for a given problem domain, without any need for human intervention. In short, TPOT optimizes ML pipelines using a version of genetic programming, a well-known evolutionary computation technique for automatically constructing computer. TPOT can deal with both regression and classification problems. In the following, we list the main algorithms handled by TPOT used as methods of our data analysis:
• Supervised Classification Operators. Decision Tree, Random Forest, eXtreme Gradient Boosting Classifier, Logistic Regression, and K-Nearest Neighbor Classifier.
• Feature Preprocessing Operators. StandardScaler, RobustScaler, MinMaxScaler, MaxAbsScaler, RandomizedPCA, Binarizer, and Polynomial Features.
• Feature Selection Operators. VarianceThreshold, SelectKBest, SelectPercentile, Select and Recursive Feature Elimination (RFE).
3. Results
Study cohort
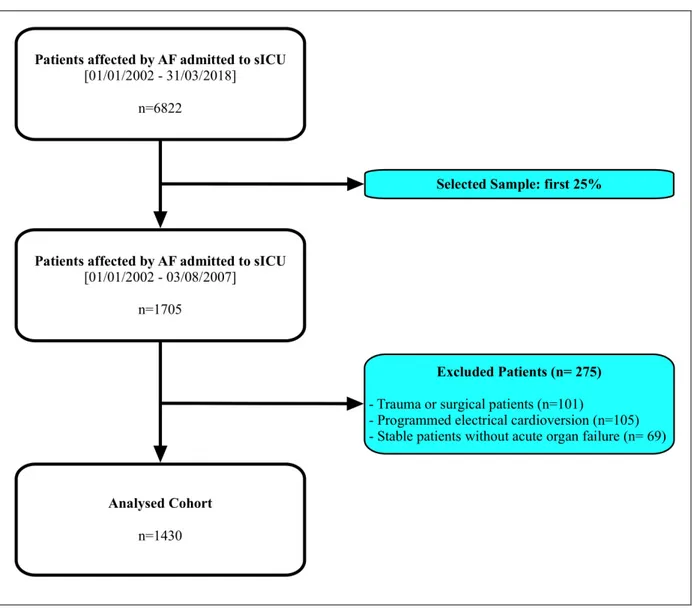
The Internal and Subintensive Medicine department of an 800-beds teaching hospital (Azienda Ospedaliero-Universitaria “Ospedali Riuniti”, Ancona, Italy) adopted an electronic database for inpatients’ management since 01/01/2002; from that date to 31/03/2018, 6822 critically-ill patients affected by AF have been admitted to this unit.
According to the study design, we selected the first quarter, equal to 1705 patients. After excluding those admitted performing a planned cardioversion procedure for AF rhythm control, stable patients without acute organ failure and patients admitted for trauma or surgical pathologies, we obtained a total of 1430 patients, included in the analysis. We synthesized the criteria for patients’ selection in Figure 2.
Figure 2: criteria for selection of the analysed sample
Baseline characteristics of the sample
Main outcome was met in 13.6% of the sample (194 subjects). TEE occurred in 14.8% of the cohort (212 patients). We observed MH in 9.30% of the analyzed group (133 subjects). Baseline characteristics of the sample at the admission according MO are synthesized in Table 5.
Table 5: Baseline Characteristics at Admission in Sub-Intensive Unit (sICU)
N= 1236 N= 194
Age, years median [IQR] 81 [75-85] 83 [77-89] <0.001
Female Sex, n (%) 753 (49.9) 90 (46.2) 0.329 Type of AF, n (%) Paroxysmal Persistent Permanent 220 (18.6) 292 (24.7) 668 (56.6) 24 (12.8) 57 (30.3) 107 (56.9) 0.077
Previous Clinical History
Hypertension, n (%) 637 (51.5) 64 (33.0) <0.001
Diabetes Mellitus, n (%) 226 (18.3) 34 (17.5) 0.799
Chronic Anaemia, n (%) 114 (9.2) 17 (8.8) 0.836
Coronary Artery Disease, n (%) 531 (43.0) 78 (40.2) 0.471
Peripheral Artery Disease, n (%) 131 (10.6) 16 (8.2) 0.316
Chronic Heart Failure, n (%) 581 (47.0) 88 (45.4) 0.669
CVF, n (%) 183 (14.8) 27 (13.9) 0.745
CVE, n (%) 29 (2.3) 1 (0.5) 0.098
Previous stroke/TIA, n (%) 258 (20.9) 34 (17.5) 0.282
Mitral Valve Disease, n (%) 195 (15.8) 15 (7.7) 0.003
Aortic Valve Disease, n (%) 151 (12.2) 16 (8.2) 0.109
COPD, n (%) 340 (27.5) 54 (27.8) 0.925
Chronic hepatic pathologies, n (%) 35 (2.8) 7 (3.6) 0.551
CKD, n (%) 230 (18.6) 39 (20.1) 0.620
Active Cancer, n (%) 210 (17.0) 44 (22.7) 0.054
Comorbidities, n median [IQR] 3 [2-4] 2 [2-3] 0.114
Concurrent Clinical Events
TEE, n (%) 177 (14.3) 35 (18.0) 0.175
MH, n (%) 110 (8.9) 23 (11.9) 0.188
Syncope, n (%) 68 (5.5) 2 (1.0) 0.007
Acute Neurologic Disorders, n (%) 47 (3.8) 6 (3.1) 0.627
Acute Coronary Syndrome, n (%) 160 (12.9) 50 (25.8) <0.001
Acute Heart Failure, n (%) 669 (54.1) 99 (51.0) 0.421
Cardiogenic Shock, n (%) 28 (2.3) 43 (22.2) <0.001
Septic Shock, n (%) 106 (8.6) 74 (38.1) <0.001
AKI, n (%) 58 (4.7) 10 (5.2) 0.779
Acute Respiratory Failure, n (%) 319 (25.8) 77 (39.7) <0.001
Infections, n (%) 330 (26.7) 102 (52.6) <0.001
Legend: AF= atrial fibrillation; ACS= acute coronary syndrome; AKI= acute kidney injury;
CKD= chronic kidney disease; COPD= chronic obstructive pulmonary disease; CVE= electrical cardioversion procedure; CVF= pharmacological cardioversion procedure; IQR= interquartile range; TEE= thromboembolic events; TIA= transient ischemic attack.
Thromboembolic and bleeding risk and relationships with outcomes
At baseline, there was no difference in terms of thromboembolic risk according to CHA2DS2-VASc score between patients that experience the composite outcome and those
that did not experience it. Conversely, HAS-BLED score, as well the proportion of patients with high bleeding risk were lower (both p<0.001) patients that reported the main outcome
two scores, no difference was found in the distribution of the MO according to CHA2DS2
-VASc score points (p=0.501). Conversely, the MO occurred more frequently in patients with a lower HAS-BLED score (p<0.001).
Further, considering the occurrence of concurrent clinical events we examined the prevalence of TEE according to CHA2DS2-VASc score and the prevalence of major bleeding
according to HAS-BLED score, finding no significant differences across the two scores’ points and the occurrence of events (respectively p=0.641 and p=0.479).
Also, we found no association between CHA2DS2-VASc score and TEE occurrence
and between HAS-BLED score and major bleeding occurrence (Table 10). Similarly, we found no predictive ability of the two scores regarding the respective events (CHA2DS2
-VASc c-index for stroke/TIA: 0.545, 95% CI: 0.489-0.601; HAS-BLED c-index for major bleeding: 0.503, 95% CI: 0.453-0.554).
We also considered CHADS2 score, which is deemed to be less age and vascular
comorbidities dependent than CHA2DS2-VASc: however, when tested against TEE
occurrence with ROC curve analysis, CHADS2 did not result significantly predictive of
events (AUC: 0.513; 95%CI: 0.487-0.539; p >0.05), with performances similar to CHA2DS2
-VASc (AUC: 0.516; 95%CI: 0.472-0.560; p >0.05). Moreover, when comparing the two scores, the difference between AUCs did not result significantly different in predicting thromboembolic events (difference between areas: 0.00326; p= 0.7108). For this reason, we continued the analyses adopting only the most currently adopted scores, CHA2DS2-VASc and
HAS-BLED.
Considering high thromboembolic risk, we found a high sensitivity (93.4%, 95% CI: 90.9-99.0%) and a high NPV (95.0%, 95% CI: 87.6-98.1%) of CHA2DS2-VASc ≥2 for
stroke/TIA, with a low specificity and PPV (Table 10). Regarding the high bleeding risk, intermediate values for both sensitivity (46.6%, 95% CI: 37.9-55.5%) and specificity (57.1%,
95% CI: 54.4-59.8%) were found, while a high NPV (91.3%, 95% CI: 89.8-92.5%) and a very low PPV were reported (Table 10).
Table 6: Thromboembolic and Bleeding Risk at Baseline
MO P
No N= 1236
Yes N= 194
CHA2DS2-VASc, median [IQR] 4 [3-5] 4 [3-5] 0.057
CHA2DS2-VASc, mean (SD) 4.28 (1.68) 4.04 (1.72) 0.774
CHA2DS2-VASc ≥2, n (%) 1170 (94.7) 180 (92.8) 0.290
HAS-BLED, median [IQR] 2 [2-3] 2 [1-3] <0.001
HAS-BLED, mean (SD) 2.38 (1.08) 2.07 (0.95) <0.001
HAS-BLED ≥3, n (%) 563 (45.6) 55 (28.4) <0.001
Legend: IQR= interquartile range; SD= standard deviation.
Factors affecting the main outcome
Regarding medical therapy, we observed that patients undergoing to the main composite outcome were more likely treated with anticoagulants and less likely treated with antiplatelet drugs at the admission in sICU, as shown in Table 7.
Table 7: Antithrombotic Therapies at Admission in Sub-Intensive Unit
MO P
No N= 1236
Yes N= 194
Anticoagulant Drugs, n (%) None Any Anticoagulant 454 (36.7) 782 (63.3) 46 (23.7) 148 (76.3) <0.001 Type of Anticoagulant, n (%) LMWH OAC 312 (39.9) 470 (60.1) 65 (43.9) 83 (56.1) 0.361 Antiplatelet Drugs, n (%) 515 (41.7) 55 (28.4) <0.001
Legend: LMWH= low-molecular weight heparin; OAC= oral anticoagulant.
When analysing at the multivariate logistic analysis the risk factors for the occurrence of MO, we identified - among the reasons for sICU admission - ACS, CS, SS and ARF. Increasing age was positively associated with the outcome, while hypertension and mitral valve disease were negatively associated with MO, as shown in Table 8.
Table 8: Multivariate Logistic Analysis for Composite Outcome Occurrence
OR 95% CI P
Age (per year) 1.04 1.02-1.06 0.001
Hypertension 0.52 0.36-0.76 0.001
Mitral Valve Disease 0.49 0.25-0.94 0.033
ACS 3.40 2.06-5.60 <0.001
Cardiogenic Shock 20.68 11.03-38.78 <0.001
Septic Shock 7.66 4.67-12.56 <0.001
Acute Respiratory Failure 2.34 1.57-3.50 <0.001
None (reference) LMWH OAC - 1.13 1.73 - 0.68-1.87 1.06-2.83 - 0.640 0.030 Antiplatelet Drugs 0.51 0.34-0.78 0.002
Legend: ACS= acute coronary syndrome; CI= confidence interval; LMWH= low-molecular
weight heparin; OAC= oral anticoagulant; OR= odds ratio; TEE= thromboembolic events; TIA= transient ischemic attack.
CHA2DS2-VASc and HAS-BLED in the prediction of thrombotic and haemorragic events
The rate of TEE according to CHA2DS2-VASc score and MH according to
HAS-BLED score are synthesized in Table 9. The distribution of TEE does not differ significantly among CHA2DS2-VASc classes and, similarly, the distribution of MH does not significantly
differ among HAS-BLED classes.
Table 9: Major Adverse Events Rate according to Risk Scores
CHA2DS2-VASc TEE [n (%)] HAS-BLED MH [n (%)]
0 0 (0.0) 0 3 (7.3) 1 4 (6.1) 1 27 (9.9) 2 10 (7.4) 2 41 (8.2) 3 15 (6.1) 3 49 (11.5) 4 27 (8.1) 4 10 (6.2) 5 24 (7.7) 5 3 (11.1) 6 14 (7.5) 6 0 (0.0) 7 13 (12.6)
8 3 (11.5)
9 0 (0.0)
Legend: TEE= thromboembolic events; MH= major haemorrhage.
We did not observe a significant association between CHA2DS2-VASc and the
occurrence of stroke/TIA, nor a significant association between HAS-BLED and MH adopting c-statistic, as shown in Table 10.
We adopted the currently suggested cut-offs for both scores. CHA2DS2-VASc, when
analysed at a cutoff ≥2, had a high sensitivity and a good negative predictive value. HAS-BLED, adopting a cutoff ≥3 had a low sensitivity and specificity, but a good negative predictive value, as shown in Table 10.
We also evaluated the quality of the clinical scores, CHA2DS2-VASc and
HAS-BLED, used for identifying high-risk patients by comparing them with the ground truth TEE and MH, respectively.
Results are represented and summarized in Figure 5. The classification error, that is 1-accuracy, reports the ration between the number of incorrect classified patients when compared with the overall population.
In our sample, the accuracy of each score was between 49 and 52% (CHA2DS2-VASc
= 52%, HAS-BLED = 49%), meaning that the two scoring systems had the same probability of classifying or misclassifying TEE or MH in this sample of critically-ill patients.
Table 10: Association between Risk Scores, Major Adverse Events and Predictive Analysis
OR (95 %)* P c-index (95%) P CHA2DS2-VASc for TEE 1.09 (0.96-1.22) 0.175 0.545 (0.489-0.601) 0.117
HAS-BLED for MH 1.07 (0.90-1.27) 0.477 0.503 (0.453-0.554) 0.900 Se (95% CI) Sp (95% CI) PPV (95% CI) NPV (95% CI) CHA2DS2-VASc ≥2 for TEE 93.4% (90.9-99.0%) 5.8% (4.6-7.1%) 7.8% (6.4-9.2%) 95.0% (87.6-98.1%) HAS-BLED ≥3 for MH 46.6% (37.9-55.5%) 57.1% (54.4-59.8%) 10.0% (8.4-11.9%) 91.3% (89.8-92.5%)
Legend: *adjusted for type of AF and anticoagulant treatment; CI= confidence interval;
OR= odds ratio; NPV= negative predictive value; PPV= positive predictive value; TIA= transient ischemic attack.
Figure 5: ROC Curve Analysis for CHA2DS2-VASc, HAS-BLED and Classification Error
ROC curve for CHA2DS2-VASC score ROC curve for HAS-BLED score
AUC
Classification Error
CHA2DS2-VASC 0.963 [95%CI:0.955-0.973]
HAS-BLED 0.923 [95%CI: 0.910-0.936]
Legend: ROC= receiver operating curve; AUC= area under the curve.
Medical treatment and outcomes in the critically-ill patient
On the basis of the ESC 2016 guidelines, we found out that 642 (44.9%) were treated as adherent to the current recommendations, while 540 (37.8%) were undertreated and 248 (17.3%) were overtreated. Analyzing the rate of major adverse outcomes according to guidelines’ adherence, while we found that the TEE rate was the lowest in those patients treated as adherent (p<0.001) (Figure 6), in the same patients the prevalence of both major bleeding and composite outcome was the higher (p<0.001 and p=0.020, respectively) (Figure 6). The final multivariable model (Table 11) found out that while undertreatment was associated with an increased risk of TEE, an inverse association with both major bleeding and composite outcome was found out. Conversely, overtreatment only showed a trend with occurrence of TEE, even though did not reach the statistical significance (Table 11).
Figure 6: Events distribution according to current guidelines adherence
Legend: TEE= thromboembolic events; MH= major bleeding; MO= main outcome; GL=
guidelines.
Table 11: Multivariable-Adjusted Association between Guidelines Adherence and Major
Adverse Events TEE MH MO OR (95% CI) p OR (95% CI) P OR (95% CI) P GLs Adherent (ref.) - - - - Undertreated 2.38 (1.45.-3.91) 0.001 0.30 (0.18-0.48) <0.001 0.63 (0.42-0.97) 0.034 Overtreated 1.75 0.097 0.67 0.143 0.83 0.481 11,10% 4,80% 11,50% 4,80% 13,20% 16,40% 7,70% 8,90% 10,90% 0,00% 2,00% 4,00% 6,00% 8,00% 10,00% 12,00% 14,00% 16,00% 18,00% TEE MH MO
Undertreatment GL-adherent Overtreatment p < 0,0001
p < 0,0001
(0.90-3.39) (0.39-1.15) (0.48-1.41)
Legend: CI= confidence interval; GLs= guidelines; TIA= transient ischemic attack.
Towards new predictive models in the critically-ill patient
After observing a poor efficiency of CHA2DS2-VASc and HAS-BLED scores in
predicting TEE as well as MH (at least for the considered dataset), we focused on instructing a new data-driven supervised solution for automatically predicting the three outcomes: TEE, MH and MO.
For each target variable, we dropped the other two scores and evaluated the correlation among the clinical variables and target under modeling. Before executing the methodology, we have transformed all the categorical variables in their dummy representation. A dummy variable is an artificial variable created to represent an attribute with two or more distinct categories/levels. The dummy variable represents the original value as a tuple of binary values. For example, if the original categorical variable has n values it will be represented by n-1 new binary variables.
t-SNE results: we evaluated the effect of the perplexities spanning between the values
30-50 with step 5 for the t-SNE algorithm. The t-SNE visualization of the three subsets is reported in Table 12. The red points are patients with target variable equal to 0, while the blue points are the patients with target variable equal to 1. In the plots for the MH and TEE the clusters formed by the blue points are well evident. In the MH plot the blue group is also quite distant from the red cloud indicating a good separation between the two clouds. While, in the last plot representing MO, the blue points are more scattered: at perplexity 35 it is possible to observe two blue subgroups overlapping with red points.
These results encourage the possibility to train a ML classifier to predict automatically the target variables. Due to the scarce separation on the red-blue points in MO,
we hypothesize that for this target variable the ML pipeline will require more steps than the others.
Table 12: Comparison of t-SNE for different target variables with perplexity values from 30
to 50 with step 5.
Outcome t-SNE plot with perplexities from 30 to 50
MH
TEE
MO
Mapper results
In order to mine other insights from the raw data before their manipulation we executed the Mapper algorithms. The inputs to the algorithm are the clinical variables plus their dummy representation, when necessary, plus the target variable under analysis. For Mapper algorithm, we used the Jaccard coefficient as metric and the DBscan as clustering algorithm, overlap percentage equal to 10%. The lens is the sum of the entries plus their MinMax scaling.
Table 13: Comparison of Mapper for different target variables
Outcome Topological Data Analysis (Mapper)
MH
MO
Legend: MH= major hemorrhage; TEE= thromboembolic events; MO= main outcome.
The Mapper analysis identified interesting features and relationships in the dataset confirming t-SNE results and extended previous results by highlighting interesting topological features.
We remark that, from a topological perspective, we focus on forks (flares) and big loops. In our case, each simplicial complex contained at least one fork. The main characteristics of the topological features are shown in Table 13:
• MH: The simplicial complex contains two small loop and a fork. The longest flare contains two nodes for a total of 80 patients, while the other node contains 9 samples.
• TEE: The simplicial complex contains 2 forks. The nodes with largest diameter in the bottom flare contain 27 samples, while the other two nodes contain 7 samples each.
• MO: The simplicial complex contains only one fork. The longest flare contains two nodes with totally 39 samples, while the other node contains 8 samples. Mapper returns also the index of the patients belonging to each node and - driven by this information – we subsampled the dataset by selecting the subjects in the forks and compared them by using chi-squared tests. Results are synthesized in Table 14, Table 15 and Table 16. We report only the features with p-value < 0.05.
Table 14: statistically relevant features that differentiate the nodes in the fork of the MH
simplicial complex
Features c2 p-value
MH type 376.8212 0
Anticoagulant type at discharge 44.89189 0
MH 389 0
Acute Heart Failure 36.35367 0
Haemorragic Shock 92.71738 0
ASA or Clopidogrel use 20.71988 0.000005
Previous GI Bleeding 13.06815 0.0003 Age 10.86397 0.001071 Number of comorbidities 17.96861 0.021463 Diabetes Mellitus 4.287005 0.038405 CVE 4.265441 0.038895 Active Cancer 4.134792 0.04201
Legend: MH= major hemorrhage; ASA= acetylsalicylic acid; GI= gastrointestinal; CVE=
electrical cardioversion.
Table 15: statistically relevant features that differentiate the nodes in the fork of the TEE
simplicial complex Features c2 p-value TEE type 42 0 TEE 42 0 AF Type 23.55294 0.000031 CVE 10.65613 0.001097