Baglietto, L; Neale, RE; Giles, GG; Eyles, DW; English, DR (2016) 25-Hydroxyvitamin D concentration and all-cause mortality: the Mel-bourne Collaborative Cohort Study. Public health nutrition, 20 (10).
pp. 1775-1784. ISSN 1368-9800 DOI: https://doi.org/10.1017/S1368980016000501
Downloaded from: http://researchonline.lshtm.ac.uk/4649089/ DOI:10.1017/S1368980016000501
Usage Guidelines
Please refer to usage guidelines at http://researchonline.lshtm.ac.uk/policies.html or alterna-tively [email protected].
25-Hydroxyvitamin D concentration and all-cause mortality:
the Melbourne Collaborative Cohort Study
Alicia K Heath
1,2, Elizabeth J Williamson
3,4, David Kvaskoff
5, Allison M Hodge
2, Peter R
Ebeling
6, Laura Baglietto
1,2,7,8, Rachel E Neale
9, Graham G Giles
1,2, Darryl W Eyles
5,10and Dallas R English
1,2,*
1Centre for Epidemiology and Biostatistics, Melbourne School of Population and Global Health, The University of
Melbourne, Level 3, 207 Bouverie Street, Melbourne, Victoria 3010, Australia:2Cancer Epidemiology Centre,
Cancer Council Victoria, Melbourne, Victoria, Australia:3Farr Institute of Health Informatics Research, London, UK: 4Department of Medical Statistics, London School of Hygiene & Tropical Medicine, London, UK:5Queensland Brain
Institute, The University of Queensland, St Lucia, Queensland, Australia:6Department of Medicine, School of Clinical Sciences, Monash University, Clayton, Victoria, Australia:7Université Paris-Saclay, Université Paris-Sud, UVSQ,
CESP, INSERM, Villejuif, France:8Institut Gustave Roussy, Villejuif, France:9Population Health Division, QIMR
Berghofer Medical Research Institute, Brisbane, Queensland, Australia:10Queensland Centre for Mental Health
Research, The Park Centre for Mental Health, Wacol, Queensland, Australia
Submitted 21 July 2015: Final revision received 1 February 2016: Accepted 15 February 2016: First published online 29 March 2016
Abstract
Objective: To investigate relationships between mortality and circulating 25-hydroxyvitamin D (25(OH)D), 25-hydroxycholecalciferol (25(OH)D3) and
25-hydroxyergocalciferol (25(OH)D2).
Design: Case–cohort study within the Melbourne Collaborative Cohort Study (MCCS). We measured 25(OH)D2and 25(OH)D3in archived dried blood spots by
LC–MS/MS. Cox regression was used to estimate mortality hazard ratios (HR), with adjustment for confounders.
Setting: General community.
Subjects: The MCCS included 29 206 participants, who at recruitment in 1990–1994 were aged 40–69 years, had dried blood spots collected and no history of cancer. For the present study we selected participants who died by 31 December 2007 (n 2410) and a random sample (sub-cohort, n 2996).
Results: The HR per 25 nmol/l increment in concentration of 25(OH)D and 25(OH)D3
were 0·86 (95 % CI 0·78, 0·96; P = 0·007) and 0·85 (95 % CI 0·77, 0·95; P = 0·003), respectively. Of 5108 participants, sixty-three (1·2 %) had detectable 25(OH)D2; their
mean 25(OH)D concentration was 11·9 (95 % CI 7·3, 16·6) nmol/l higher (P < 0·001). The HR for detectable 25(OH)D2was 1·80 (95 % CI 1·09, 2·97; P = 0·023); for those
with detectable 25(OH)D2, the HR per 25 nmol/l increment in 25(OH)D was 1·06
(95 % CI 0·87, 1·29; P interaction = 0·02). HR were similar for participants who reported being in good, very good or excellent health four years after recruitment. Conclusions: Total 25(OH)D and 25(OH)D3 concentrations were inversely
associated with mortality. The finding that the inverse association for 25(OH)D was restricted to those with no detectable 25(OH)D2 requires confirmation in
populations with higher exposure to ergocalciferol.
Keywords Ergocalciferol Cholecalciferol 25-Hydroxyvitamin D All-cause mortality
Many cohort studies have reported inverse associations between circulating 25-hydroxyvitamin D (25(OH)D) and mortality(1). Vitamin D exists in two forms, ergocalciferol (vitamin D2) and cholecalciferol
(vitamin D3); 25-hydroxyergocalciferol (25(OH)D2) and
25-hydroxycholecalciferol (25(OH)D3) can be quantified
separately; and a large study of their relative prevalence in New York has been published(2). However, no cohort studies of mortality have presented associations separately
for 25(OH)D2 and 25(OH)D3; many used assays such as
RIA and chemiluminescent immunoassays(1) that cannot quantify them separately.
Cholecalciferol is the natural form of vitamin D in man, endogenously synthesised following UVB irradiation of 7-dehydrocholesterol in skin(3). Dietary sources of cholecalciferol include fatty fish, fortified foods and supplements(3). Ergocalciferol, an exogenous form of vitamin D, is produced in fungi following UVB irradiation
Public Health Nutrition: 20(10), 1775–1784 doi:10.1017/S1368980016000501
of ergosterol. People can obtain ergocalciferol from some fortified foods (e.g. margarine)(4) and some species of mushrooms, and it is used in supplements in some countries(3,5). In Australia, margarine contains low levels of ergocalciferol (1μg/100 g)(6).
A systematic review and meta-analysis of randomised controlled trials (RCT) comparing the effects of ergocalci-ferol and cholecalciergocalci-ferol supplementation on 25(OH)D concentrations found that cholecalciferol is more effective than ergocalciferol at increasing serum 25(OH)D(4), especially when given as large weekly or monthly doses. Ergocalciferol might also increase catabolism of cholecalciferol; several RCT have reported that ergocalci-ferol supplementation lowered 25(OH)D3
concentra-tions(7–13). Reviews of RCT of the effects of vitamin D supplementation on mortality show that there was a modest decrease in mortality for trials of cholecalciferol supplementation, but no decrease for trials of ergocalci-ferol supplementation, although the ergocalciergocalci-ferol trials were few and of relatively low quality(1,5).
Given limited evidence from trials that ergocalciferol and cholecalciferol supplementation might have different effects on mortality, observational studies of 25(OH)D and mortality should separate the two forms. The advent of liquid chromatography–tandem mass spectrometry (LC–MS/MS) now makes this possible because it enables simultaneous separate measurement of 25(OH)D2 and
25(OH)D3. We report here analyses of 25(OH)D,
25(OH)D3and 25(OH)D2in relation to all-cause mortality
in a prospective cohort study of middle-aged men and women. The large size of the study and the availability of data on self-reported health about four years after recruitment also enabled us to assess the potential impact of reverse causality, which has been a major limitation of existing cohort studies.
Methods Study design
A case–cohort study to investigate vitamin D status and risk of cancer, diabetes and mortality was conducted within the Melbourne Collaborative Cohort Study (MCCS), a prospective cohort study of 41 514 participants (25 % Southern European migrants) aged predominantly between 40 and 69 years at study recruitment (1990– 1994). Details of the study design, recruitment and pro-cedures are published elsewhere(14).
At baseline participants were interviewed about lifestyle and medical history, completed a self-administered 121-item FFQ developed for the MCCS(15), and anthropometric mea-surements (height, weight, waist and hip circumferences) were performed according to a standard protocol. Blood samples were collected and from the second year of recruitment (approximately 75 % of participants), whole blood was spotted on to Guthrie cards that were air dried
and stored in the dark at room temperature. About four years after baseline, participants were mailed a ques-tionnaire that included a question about their general health status, rated as poor, fair, good, very good or excellent. Case–cohort study
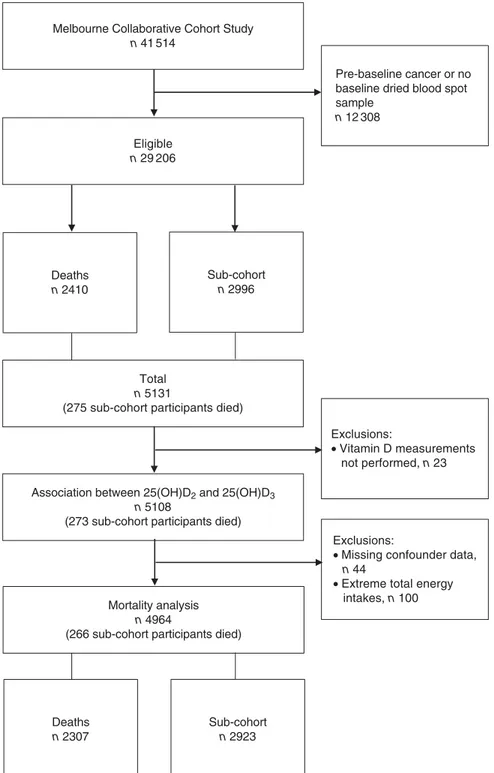
Eligibility for the case–cohort study was restricted to 29 206 participants who had dried blood spot samples and, to reduce the possibility of reverse causality, no cancer diagnosed before baseline. The present analysis was restricted to the 2410 people who died by 31 December 2007 and the sub-cohort, a sex-stratified random sample of 2996 participants, with sampling fractions of 7·8 % for women and 13·6 % for men, approximately double the number of incident breast cancer and prostate cancer cases, respectively (Fig. 1).
Measurement of 25-hydroxyvitamin D
The mean time between blood sampling and 25(OH)D measurement was 18·1 (SD 0·8) years. Concentration of
25(OH)D3has previously been shown to be stable in dried
blood spots stored for 8–22 years(16). Measurements of
25(OH)D2and 25(OH)D3were made in the laboratory of
D.W.E. using LC–MS/MS(16)over 15 months in thirty-one
batches of approximately 230 samples each. This labora-tory uses National Institute of Standards and Technology calibrants and participates in the Vitamin D External Quality Assessment Scheme. The absolute limits of detection were 1 nmol/l for 25(OH)D3 and 2 nmol/l for
25(OH)D2(16). We have previously reported high reliability
of dried blood spot 25(OH)D measurements using 493 replicates from the case–cohort study; within- and between-batch intraclass correlations were 0·82 (95 % CI 0·80, 0·85) and 0·73 (95 % CI 0·68, 0·78), respectively(17).
To estimate the reliability of the 25(OH)D2measurements,
we calculated the intraclass correlation coefficient for the presence v. absence of 25(OH)D2 for the 493 replicate
measurements. For a binary variable with two replicates, the intraclass correlation is the same as Cohen’s κ. We calculated bias-corrected CI using a bootstrap method with 10 000 replications. The intraclass correlation for detectability of 25(OH)D2was 0·54 (95 % CI 0·25, 0·72).
Direct comparison between dried blood spot and serum/plasma 25(OH)D concentrations is problematic because 25(OH)D is excluded from erythrocytes. Therefore, for initial descriptions of the concentrations, we corrected the observed concentrations for mean sex-specific haematocrit(17). For all other analyses of 25(OH)D
and 25(OH)D3, we used a calibration equation to
predict plasma concentration(17). In a subset of sixty-two MCCS participants who had dried blood spot and match-ing plasma samples (two replicates for each biospecimen type), we found good agreement between dried blood spot 25(OH)D and plasma 25(OH)D concentrations (R2= 0·73) and developed an equation to estimate plasma 25(OH)D concentration from the dried blood spot
concentration(17). Because few participants in that study had detectable 25(OH)D2, the calibration equation applies to
total 25(OH)D and 25(OH)D3 only. The sensitivity and
specificity of 25(OH)D2 detection in the dried blood spot
samples compared with the plasma samples was respec-tively 100·0 (95 % CI 29·0 100·0) % and 94·9 (95 % CI 85·9, 98·9) % for the first replicate, and 50·0 (95 % CI 7·0, 93·0) % and 100·0 (95 % CI 93·8, 100·0) % for the second replicate.
Ascertainment of deaths
Deaths to 31 December 2007 were identified by linkage to the Victorian Registry of Births, Deaths and Marriages and the National Death Index at the Australian Institute of Health and Welfare.
Statistical analysis
Association between 25-hydroxyergocalciferol and 25-hydroxycholecalciferol
One participant whose 25(OH)D2concentration was several
times higher than the next highest value was excluded from these analyses. For participants with detectable 25(OH)D2,
we estimated Spearman’s correlation between the raw 25(OH)D3 and 25(OH)D2 concentrations. We used linear
regression to estimate the difference in mean plasma 25(OH)D and 25(OH)D3concentrations for participants with
and without detectable 25(OH)D2, with adjustment for sex.
For the regression analyses, we used estimated plasma 25(OH)D and 25(OH)D3 concentrations derived from our
calibration equation(17), but did not remove season and batch effects. The adjustment for sex was necessary because men had higher 25(OH)D and 25(OH)D3 concentrations
and were more likely to have detectable 25(OH)D2.
Association between vitamin D and mortality
Participants with missing data for covariates (n 44) and those with extreme total energy intakes (<1st and >99th sex-specific percentiles; n 100) were excluded (Fig. 1).
Total 25(OH)D and 25(OH)D3 concentrations were
adjusted for batch and season, then converted to plasma-equivalent values using our calibration equation(17). To remove batch effects, wefirst fitted a mixed-effects linear regression model with a random effect for batch to the sub-cohort observations. Next, for all observations, the predicted batch-specific deviations from the overall mean were subtracted from the observed values. Seasonal variation was removed byfitting linear regression models for 25(OH)D and 25(OH)D3as a sinusoidal function of the
time of year when blood was sampled(18), then standar-dising measurements to represent 25(OH)D and 25(OH)D3
measurements on the dates when the annual mean was attained (15 May and 14 November; late autumn and late spring in Australia). Participants were grouped into sex-specific quintiles based on the distribution of batch- and season-adjusted 25(OH)D or 25(OH)D3 in
the sub-cohort. For 25(OH)D2, batch and seasonal
adjustments were not performed because there were too few participants with detectable 25(OH)D2.
Cox regression was used to estimate hazard ratios (HR) and 95 % CI. Barlow’s method, robustSE(19)and Wald tests
were used to account for the case–cohort design. Age was the timescale and models were stratified by sex and country of birth. Follow-up began at baseline and ended at the date of death, date left Australia or 31 December 2007, whichever came first. The proportional hazards assump-tion was assessed by fitting interactions between each covariate separately and attained age. There was no evidence that any covariate violated the assumptions.
We estimated HR for all-cause mortality for each quin-tile of 25(OH)D and 25(OH)D3 relative to the lowest
quintile and for the presence v. absence of detectable 25(OH)D2, adjusting for confounders described below.
For 25(OH)D and 25(OH)D3we also estimated the HR per
25 nmol/l by using the continuous forms of the variables. We fitted models with each vitamin D variable alone, a model including continuous 25(OH)D and its interaction with detectable 25(OH)D2, and a model including main
effects for continuous 25(OH)D3and detectable 25(OH)D2.
The interaction model assesses whether the relationship between 25(OH)D and mortality depends on the source of the 25(OH)D. Effect modification by sex was assessed by fitting interactions between each vitamin D variable (continuous for 25(OH)D and 25(OH)D3) and sex.
Confounders
The following confounders were selected using a causal diagram and a priori knowledge from existing literature: age, sex, country of birth (Australia/New Zealand/North-ern Europe or SouthZealand/North-ern Europe), an area-based measure of socio-economic disadvantage (quintiles from most dis-advantaged to least disdis-advantaged), highest education level attained (primary school, some secondary school, secondary school, tertiary qualification), total energy intake (sex-specific quartiles, kJ/d), Mediterranean diet score (three categories indicating dietary pattern, with the highest representing high adherence to a Mediterranean diet), alcohol (never, former and sex-specific tertiles of current intake), smoking (never, former, current), physical activity (four categories reflecting frequency and intensity of exercise in the past 6 months), waist circumference (sex-specific quartiles, centimetres), and self-reported history of diabetes mellitus, hypertension and CVD (angina, myocardial infarction or stroke).
Sensitivity analyses
We repeated the analyses for the continuous versions of 25(OH)D and 25(OH)D3after excluding participants whose
values were greater than the 99th percentiles to assess whether outliers had undue influence on the HR. We also assessed non-linearity of the dose–response relationships by fitting restricted cubic spline models with four knots at fixed, equally spaced percentiles (5 %, 35 %, 65 %, 95 %).
People in poor health may have had reduced sun expo-sure, leading to lower 25(OH)D3. They may also have taken
supplements, leading to higher 25(OH)D2, since vitamin D
supplements in Australia in the early 1990s contained ergocalciferol(20). Thus, observed associations between vitamin D and mortality could potentially be explained by reverse causality. To assess this possibility, a sensitivity analysis was conducted by restricting the analysis to people who reported having good, very good or excellent health on the 4-year up questionnaire. For that analysis, follow-up began on the date of completion of that questionnaire.
Analyses were performed using the statistical software package Stata version 13·1.
Results
Dried blood spots were not located for sixteen participants and seven deaths were identified after the study began, leaving 5108 for analysis (Fig. 1). All samples had detect-able concentrations of 25(OH)D3(range for
haematocrit-corrected values, 2·4–146·9 nmol/l; to convert 25(OH)D in nmol/l to ng/ml, divide by 2·496), whereas 25(OH)D2was
detected in sixty-three samples (1·2 %; range for haematocrit-corrected values, 4·1–195·0 nmol/l). The median plasma-equivalent 25(OH)D concentration, adjusted for batch and season, was 48·4 nmol/l; 99 % of values were greater than 19·7 nmol/l and 1 % greater than 107·3 nmol/l.
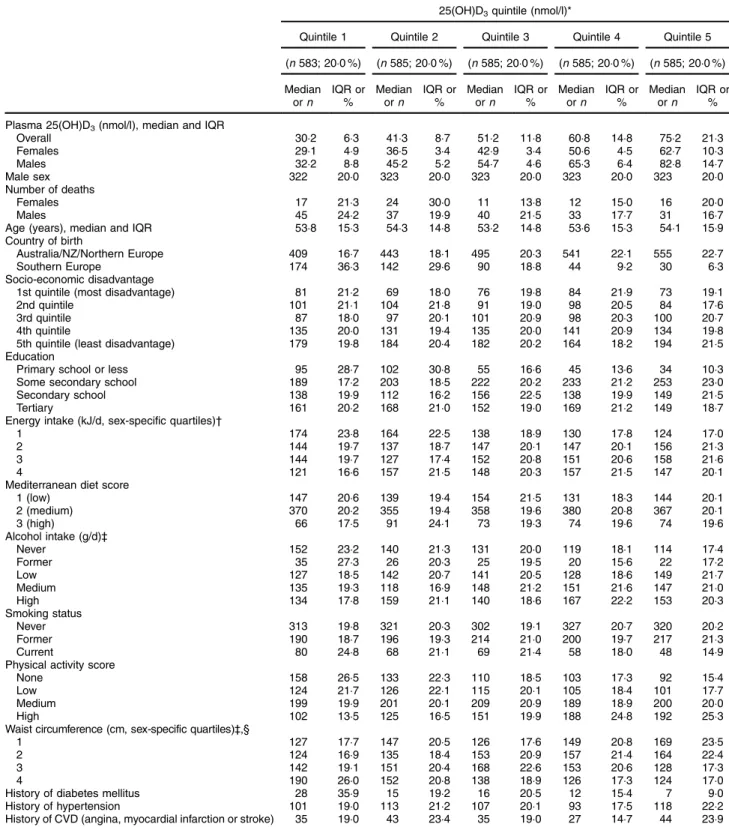
Participants who were born in Southern Europe, had primary school education or less, were in the lowest energy intake quartile, did not consume alcohol (both lifetime abstainers and former drinkers), were current smokers, did not do any physical activity, were in the largest waist circumference quartile or had diabetes mellitus at baseline were more likely to have low 25(OH)D3
concentrations (Table 1). These patterns were almost identical for 25(OH)D (data not shown). Participants with high alcohol consumption and current smokers were less likely to have 25(OH)D2, while those who took
multi-vitamins were more likely to have 25(OH)D2(Table 2).
The mean plasma 25(OH)D concentration was 11·9 (95 % CI 7·3, 16·6) nmol/l higher (P < 0·001) when 25(OH)D2 was detected than when it was not detected,
whereas the mean plasma 25(OH)D3 concentration was
4·9 (95 % CI −9·6, −0·3) nmol/l lower (P = 0·04). For participants with detectable 25(OH)D2there was a weak,
non-significant inverse correlation between their raw 25(OH)D2 and 25(OH)D3 concentrations (Spearman’s
correlation = −0·09, P = 0·50).
Vitamin D and mortality
During a mean of 13·7 (SD 2·2) years of follow-up
(max-imum 16·9 years), 2410 (8·3 %) participants died. The present analysis included 4964 participants, 2307 of whom died (Fig. 1).
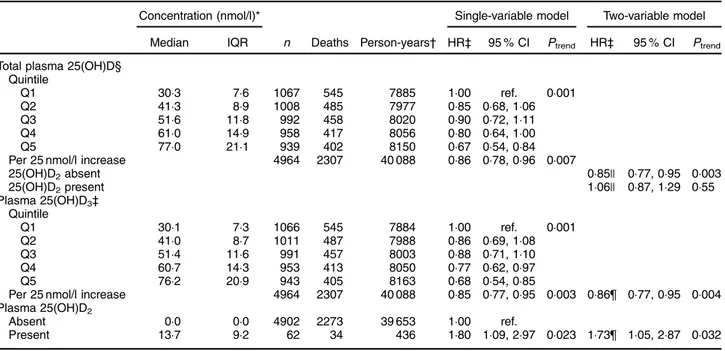
The HR for the highest compared with the lowest total 25(OH)D quintile was 0·67 (95 % CI 0·54, 0·84) and the HR per 25 nmol/l increment in 25(OH)D was 0·86 (95 % CI 0·78, 0·96; P = 0·007; Table 3). There was no evidence that the splinesfitted better than a linear trend (P = 0·44) and the HR was unchanged after excluding outliers (data not shown).
Because few participants had 25(OH)D2, the HR for
25(OH)D3 were essentially identical to those for total
25(OH)D (Table 3). The splines fitted no better than a linear trend (P= 0·42) and excluding outliers did not affect the HR (data not shown). The HR for the presence of detectable 25(OH)D2 was 1·80 (95 % CI 1·09, 2·97;
P= 0·02; Table 3). One batch of measurements had a disproportionate number of samples with 25(OH)D2;
results were similar when this batch was excluded (HR= 1·88; 95 % CI 1·07, 3·28; P = 0·03).
When 25(OH)D3 and detectable 25(OH)D2 were
included in the same model, their HR changed little (Table 3). The interaction between the continuous 25(OH)D and 25(OH)D2was significant (P = 0·02). From
this model, the HR per 25 nmol/l increment in 25(OH)D concentration was 0·85 (95 % CI 0·77, 0·95) when there was no detectable 25(OH)D2and 1·06 (95 % CI 0·87, 1·29)
when there was detectable 25(OH)D2.
There was little evidence that the HR for any of the vitamin D variables varied by sex (interactions: 25(OH)D, P= 0·30; 25(OH)D3, P= 0·28; 25(OH)D2, P= 0·25).
Vitamin D and mortality in people reporting good health
When restricted to the 3159 participants (1136 of whom died) who reported good, very good or excellent health four years after baseline blood sample collection, forty-six had detectable 25(OH)D2. The HR per 25 nmol/l
incre-ment in 25(OH)D and 25(OH)D3were 0·85 (95 % CI 0·73,
0·98; P = 0·021) and 0·83 (95 % CI 0·72, 0·95; P = 0·009), respectively. The HR for detectable 25(OH)D2 was 1·75
(95 % CI 0·98, 3·10; P = 0·06). The HR from the model including 25(OH)D and the interaction with detectable 25(OH)D2 were also similar to those for all participants
(data not shown).
Discussion
Higher 25(OH)D3 and 25(OH)D concentrations were
associated with a moderately reduced risk of death, whereas the presence of 25(OH)D2was associated with a
moderately increased risk of death, despite participants with detectable 25(OH)D2 having higher mean 25(OH)D
concentration. The inverse association between mortality and 25(OH)D was restricted to those with no detectable 25(OH)D2. The HR for 25(OH)D3 and detectable
25(OH)D2 changed little when they were included in
analysis was restricted to people who reported being in good to excellent health about four years after blood draw. Strengths of the current study include its prospective design, long follow-up, use of highly sensitive LC–MS/MS for separate measurement of both 25(OH)D forms, availability of extensive information on potential con-founders, accurate and complete mortality data, and broad generalisability. Measurement error is unlikely to explain
the associations: the samples were analysed in random order and blind to outcome status and so any measure-ment error would be non-differential and attenuate associations. We had no data on vitamin D supplementa-tion, but only 16 % of participants reported using multi-vitamins at baseline (which at the time in Australia contained ergocalciferol only, but which now contain cholecalciferol only). We controlled for history of disease Melbourne Collaborative Cohort Study
n 41 514
Eligible n 29 206
Exclusions:
• Missing confounder data, n 44
• Extreme total energy intakes, n 100 Total
n 5131
(275 sub-cohort participants died)
Deaths n 2307 Sub-cohort n 2923 Exclusions: • Vitamin D measurements not performed, n 23 Pre-baseline cancer or no baseline dried blood spot sample n 12 308 Deaths n 2410 Sub-cohort n 2996
Association between 25(OH)D2 and 25(OH)D3 n 5108
(273 sub-cohort participants died)
Mortality analysis n 4964
(266 sub-cohort participants died)
Fig. 1 Flow of participants in the present study. The sub-cohort was a sex-stratified random sample of eligible participants. Deaths were all deaths between baseline (1990–1994) and 31 December 2007 (25(OH)D2, 25-hydroxyergocalciferol; 25(OH)D3,
25-hydroxycholecalciferol)
Table 1 Baseline characteristics of sub-cohort participants included in the mortality analyses (n 2923) according to quintiles of batch-and season-adjusted plasma 25-hydroxycholecalciferol (25(OH)D3) concentrations (plasma concentration estimated from calibration equation(17)); Melbourne Collaborative Cohort Study
25(OH)D3quintile (nmol/l)*
Quintile 1 Quintile 2 Quintile 3 Quintile 4 Quintile 5
(n 583; 20·0 %) (n 585; 20·0 %) (n 585; 20·0 %) (n 585; 20·0 %) (n 585; 20·0 %) Median orn IQR or % Median orn IQR or % Median orn IQR or % Median orn IQR or % Median orn IQR or % Plasma 25(OH)D3(nmol/l), median and IQR
Overall 30·2 6·3 41·3 8·7 51·2 11·8 60·8 14·8 75·2 21·3 Females 29·1 4·9 36·5 3·4 42·9 3·4 50·6 4·5 62·7 10·3 Males 32·2 8·8 45·2 5·2 54·7 4·6 65·3 6·4 82·8 14·7 Male sex 322 20·0 323 20·0 323 20·0 323 20·0 323 20·0 Number of deaths Females 17 21·3 24 30·0 11 13·8 12 15·0 16 20·0 Males 45 24·2 37 19·9 40 21·5 33 17·7 31 16·7
Age (years), median and IQR 53·8 15·3 54·3 14·8 53·2 14·8 53·6 15·3 54·1 15·9
Country of birth
Australia/NZ/Northern Europe 409 16·7 443 18·1 495 20·3 541 22·1 555 22·7
Southern Europe 174 36·3 142 29·6 90 18·8 44 9·2 30 6·3
Socio-economic disadvantage
1st quintile (most disadvantage) 81 21·2 69 18·0 76 19·8 84 21·9 73 19·1
2nd quintile 101 21·1 104 21·8 91 19·0 98 20·5 84 17·6
3rd quintile 87 18·0 97 20·1 101 20·9 98 20·3 100 20·7
4th quintile 135 20·0 131 19·4 135 20·0 141 20·9 134 19·8
5th quintile (least disadvantage) 179 19·8 184 20·4 182 20·2 164 18·2 194 21·5
Education
Primary school or less 95 28·7 102 30·8 55 16·6 45 13·6 34 10·3
Some secondary school 189 17·2 203 18·5 222 20·2 233 21·2 253 23·0
Secondary school 138 19·9 112 16·2 156 22·5 138 19·9 149 21·5
Tertiary 161 20·2 168 21·0 152 19·0 169 21·2 149 18·7
Energy intake (kJ/d, sex-specific quartiles)†
1 174 23·8 164 22·5 138 18·9 130 17·8 124 17·0
2 144 19·7 137 18·7 147 20·1 147 20·1 156 21·3
3 144 19·7 127 17·4 152 20·8 151 20·6 158 21·6
4 121 16·6 157 21·5 148 20·3 157 21·5 147 20·1
Mediterranean diet score
1 (low) 147 20·6 139 19·4 154 21·5 131 18·3 144 20·1 2 (medium) 370 20·2 355 19·4 358 19·6 380 20·8 367 20·1 3 (high) 66 17·5 91 24·1 73 19·3 74 19·6 74 19·6 Alcohol intake (g/d)‡ Never 152 23·2 140 21·3 131 20·0 119 18·1 114 17·4 Former 35 27·3 26 20·3 25 19·5 20 15·6 22 17·2 Low 127 18·5 142 20·7 141 20·5 128 18·6 149 21·7 Medium 135 19·3 118 16·9 148 21·2 151 21·6 147 21·0 High 134 17·8 159 21·1 140 18·6 167 22·2 153 20·3 Smoking status Never 313 19·8 321 20·3 302 19·1 327 20·7 320 20·2 Former 190 18·7 196 19·3 214 21·0 200 19·7 217 21·3 Current 80 24·8 68 21·1 69 21·4 58 18·0 48 14·9
Physical activity score
None 158 26·5 133 22·3 110 18·5 103 17·3 92 15·4
Low 124 21·7 126 22·1 115 20·1 105 18·4 101 17·7
Medium 199 19·9 201 20·1 209 20·9 189 18·9 200 20·0
High 102 13·5 125 16·5 151 19·9 188 24·8 192 25·3
Waist circumference (cm, sex-specific quartiles)‡,§
1 127 17·7 147 20·5 126 17·6 149 20·8 169 23·5
2 124 16·9 135 18·4 153 20·9 157 21·4 164 22·4
3 142 19·1 151 20·4 168 22·6 153 20·6 128 17·3
4 190 26·0 152 20·8 138 18·9 126 17·3 124 17·0
History of diabetes mellitus 28 35·9 15 19·2 16 20·5 12 15·4 7 9·0
History of hypertension 101 19·0 113 21·2 107 20·1 93 17·5 118 22·2
History of CVD (angina, myocardial infarction or stroke) 35 19·0 43 23·4 35 19·0 27 14·7 44 23·9
IQR, interquartile range; NZ, New Zealand.
Values are median and interquartile range for 25(OH)D3concentrations and age, or number and percentage for categorical variables.
*To convert 25(OH)D in nmol/l to ng/ml, divide by 2·496.
†Quartiles of total energy intake (kJ/d): 1, females = 3149–6301, males = 3755–7399; 2, females = 6302–8007, males = 7400–9192; 3, females = 8008–9827, males= 9193–11 397; 4, females = 9828–18 831, males = 11 398–22 150.
‡Categories of alcohol intake (g/d): low, females 0·1–4·2, males 0·1–9·2; medium, females 4·3–14·9, males 9·3–25·7; high, females 15·0–117·6, males 25·8–221·4. §Quartiles of waist circumference (cm): 1, females= 52·7–70·6, males = 62·0–85·9; 2, females = 70·7–76·9, males = 86·0–91·9; 3, females = 77·0–85·9, males = 92·0–98·4; 4, females = 86·0–134·9, males = 98·5–131·0.
and several risk factors, but cannot rule out the possibility of residual confounding. Given the small number of people with detectable 25(OH)D2, chance is also a
potential explanation for its positive association with mortality.
Inclusion of middle-aged adults with no pre-baseline cancer reduced the possibility of reverse causality explaining the results. However, reverse causality might explain the positive association with 25(OH)D2 and
inverse association with 25(OH)D3 if people in poor
health were more likely to take supplements and spend less time outdoors, thus having lower concentra-tions of 25(OH)D3. Our sensitivity analysis, restricted to
participants in good to excellent health several years after baseline, was designed to assess this possibility. While it is not possible to rule out reverse causality, the sensitivity analysis showed no evidence of its occur-rence. The HR for total 25(OH)D and 25(OH)D3 were
very similar; this might not be the case in populations with more ergocalciferol use, such as in the USA(2). Finally, the absolute 25(OH)D values reported should be interpreted cautiously as these were plasma-equivalent 25(OH)D concentrations estimated from measurements of 25(OH)D in dried blood spots and with adjustment for batch and season.
A recent meta-analysis of cohort studies of vitamin D and all-cause mortality found a relative risk (RR) of 1·16 (95 % CI 1·08, 1·23) for a 10 ng/ml decrease in 25(OH)D, which is equivalent to 0·86 (95 % CI 0·81, 0·93) for a 25 nmol/l increase, and thus identical to the estimate from our study for 25(OH)D(1). There was substantial hetero-geneity between studies (I2= 90 %) that did not appear to be explained by any of the study characteristics used to form subgroups (no formal meta-regression was per-formed). The association was similar when stratified by latitude (≤40° v. >40°) and by age at baseline (<70 v. ≥70 years)(1). It was slightly stronger for males, whereas we found similar associations for men and women. The association was stronger in thefirst five years after base-line(1). One possible explanation for thisfinding is reverse
causality– our study is one of few that have been able to assess this possibility by performing an analysis restricted to people in good health several years after baseline. Our results for 25(OH)D are also consistent with a recent meta-analysis of individual data from eight cohort studies from Europe and the USA, in which the RR for mortality in the lowest v. the highest quintile was 1·57 (95 % CI 1·36, 1·81), which is equivalent to RR of 0·64 (= 1/1·57) for the highest v. the lowest quintile (our corresponding HR was 0·67)(21).
In that study, there was also little heterogeneity by age and sex(21). Some cohort studies have found U-shaped or reverse J-shaped relationships between 25(OH)D and all-cause mortality(22–25)but we found no such evidence. However, because few of our participants had con-centrations above 100 nmol/l, our ability to assess curvi-linear relationships was limited.
Table 2 Presence of 25-hydroxyergocalciferol (25(OH)D2) according to baseline characteristics of study participants; Melbourne Collaborative Cohort Study
25(OH)D2present N n % Participants 5108 63 1·2 Sex Female 2255 22 1·0 Male 2853 41 1·4 Country of birth Australia/NZ/Northern Europe 4260 56 1·3 Southern Europe 848 7 0·8 Socio-economic disadvantage
1st quintile (most disadvantage) 755 10 1·3
2nd quintile 940 15 1·6
3rd quintile 857 11 1·3
4th quintile 1111 13 1·2
5th quintile (least disadvantage) 1422 14 1·0 Education
Primary school or less 729 9 1·2
Some secondary school 1988 16 0·8
Secondary school 1190 23 1·9 Tertiary 1200 15 1·3 Alcohol intake (g/d)* Never 1251 20 1·6 Former 245 2 0·8 Low 1169 16 1·4 Medium 1083 15 1·4 High 1352 10 0·7 Smoking status Never 2520 36 1·4 Former 1877 23 1·2 Current 710 4 0·6
Physical activity score
None 1067 12 1·1
Low 964 10 1·0
Medium 1899 29 1·5
High 1177 12 1·0
Waist circumference (cm, sex-specific quartiles)†
1 1127 17 1·5 2 1149 19 1·7 3 1295 10 0·8 4 1525 17 1·1 Multivitamin use No 4297 33 0·8 Yes 811 30 3·7
Mushroom consumption (frequency, categorized)
Never or less than once per month 1565 24 1·5
Monthly 1624 17 1·1
Weekly 1919 22 1·2
Margarine intake (times/week, quartiles)
0–0·4 1101 14 1·3 0·5–6·9 1363 17 1·3 7·0–17·4 1186 19 1·6 ≥ 17·5 1450 13 0·9 History of hypertension No 3860 44 1·1 Yes 1246 18 1·4
History of CVD (angina, myocardial infarction or stroke)
No 4563 56 1·2
Yes 544 7 1·3
NZ, New Zealand.
All values are number and percentage.
*Categories of alcohol intake (g/d): low, females= 0·1–4·2, males = 0·1–9·2; medium, females= 4·3–14·9, males = 9·3–25·7; high, females = 15·0–157·9, males= 25·8–232·2.
†Quartiles of waist circumference (cm): 1, females = 47·0–70·5, males= 62·0–85·9; 2, females = 70·6–76·9, males = 86·0–91·9; 3, females = 77·0–85·4, males= 92·0–98·3; 4, females= 85·5–153·6, males= 98·4–143·0.
We are not aware of any cohort studies of 25(OH)D2
and 25(OH)D3 and mortality. According to a Cochrane
review of RCT of vitamin D supplementation, cholecalci-ferol reduced all-cause mortality by 6 % (RR= 0·94; 95 % CI 0·91, 0·98; P = 0·002). Ergocalciferol had no apparent beneficial effect (RR = 1·02; 95 % CI 0·96, 1·08; P = 0·54), but in RCT involving participants with vitamin D insuffi-ciency, the risk of mortality was elevated (RR= 1·20; 95 % CI 1·05, 1·37; P = 0·008)(5). The authors commented that
‘the effect of vitamin D2 may be neutral or even
detri-mental’(5). In another meta-analysis of RCT, cholecalciferol supplementation reduced all-cause mortality (RR= 0·89; 95 % CI 0·80, 0·99). Overall, ergocalciferol had no bene-ficial effect (RR = 1·04; 95 % CI 0·97, 1·11), but increased mortality risk in RCT using doses of 15–50 µg/d (600– 2000 IU/d; RR= 1·20; 95 % CI 1·05, 1·38), in RCT with shorter mean intervention periods (<1·5 years; RR = 1·20; 95 % CI 1·05, 1·37) and in RCT with shorter follow-up (<2·5 years; RR = 1·19; 95 % CI 1·04, 1·36)(1). The median
follow-up from the included RCT was only 1·4 years, the median age of participants was 77 years, there were relatively few deaths in each study, and thirteen out of the twenty-two RCT involved participants with pre-existing chronic disease(1). Thus, existing RCT are not necessarily generalisable to younger/middle-aged community-dwelling populations.
Ourfindings that participants with detectable 25(OH)D2
had higher mean 25(OH)D but lower mean 25(OH)D3
concentration is consistent with the Osteoporotic Fractures in Men Study (MrOS)(26). These findings complement evidence from RCT showing that ergocalciferol might interfere with production of 25(OH)D3 and/or induce
processes that degrade 25(OH)D3(7–13).
Several potential mechanisms could explain differences in effects of ergocalciferol and cholecalciferol. The pre-sence of a methyl group on C24 of ergocalciferol meta-bolites may slightly alter their ability to bind to, or their affinity for, vitamin D binding protein(27), vitamin D hydroxylases and the vitamin D receptor(28). The lower affinity of 25(OH)D2for vitamin D binding protein relative
to 25(OH)D3means its free fraction in blood is likely to be
higher, consistent with the faster turnover of 25(OH) D2(8,27). The shorter circulating half-life of ergocalciferol
metabolites may lead to up-regulation of enzymes that not only metabolise ergocalciferol, but also con-comitantly induce accelerated catabolism and clearance of 25(OH)D3(8,11).
Differential specificities of the various cytochrome P450 (CYP) enzymes that metabolise vitamin D may also help to explain the apparent effect of ergocalciferol on 25(OH)D3 concentration. While the microsomal
vitamin D 25-hydroxylase, CYP2R1, 25-hydroxylates both
Table 3 Hazard ratios (HR) and 95 % CI for all-cause mortality for total 25-hydroxyvitamin D (25(OH)D), 25-hydroxycholecalciferol (25(OH)D3) and 25-hydroxyergocalciferol (25(OH)D2); Melbourne Collaborative Cohort Study
Concentration (nmol/l)* Single-variable model Two-variable model
Median IQR n Deaths Person-years† HR‡ 95 % CI Ptrend HR‡ 95 % CI Ptrend
Total plasma 25(OH)D§ Quintile Q1 30·3 7·6 1067 545 7885 1·00 ref. 0·001 Q2 41·3 8·9 1008 485 7977 0·85 0·68, 1·06 Q3 51·6 11·8 992 458 8020 0·90 0·72, 1·11 Q4 61·0 14·9 958 417 8056 0·80 0·64, 1·00 Q5 77·0 21·1 939 402 8150 0·67 0·54, 0·84
Per 25 nmol/l increase 4964 2307 40 088 0·86 0·78, 0·96 0·007
25(OH)D2absent 0·85|| 0·77, 0·95 0·003 25(OH)D2present 1·06|| 0·87, 1·29 0·55 Plasma 25(OH)D3‡ Quintile Q1 30·1 7·3 1066 545 7884 1·00 ref. 0·001 Q2 41·0 8·7 1011 487 7988 0·86 0·69, 1·08 Q3 51·4 11·6 991 457 8003 0·88 0·71, 1·10 Q4 60·7 14·3 953 413 8050 0·77 0·62, 0·97 Q5 76·2 20·9 943 405 8163 0·68 0·54, 0·85
Per 25 nmol/l increase 4964 2307 40 088 0·85 0·77, 0·95 0·003 0·86¶ 0·77, 0·95 0·004
Plasma 25(OH)D2
Absent 0·0 0·0 4902 2273 39 653 1·00 ref.
Present 13·7 9·2 62 34 436 1·80 1·09, 2·97 0·023 1·73¶ 1·05, 2·87 0·032
IQR, interquartile range; ref., reference category. *To convert 25(OH)D in nmol/l to ng/ml, divide by 2·496. †Sub-cohort participants.
‡Adjusted for age, area-based index of socio-economic disadvantage, education, total energy intake, Mediterranean diet pattern, alcohol intake, smoking status, physical activity, waist measurement, diabetes mellitus at baseline, history of hypertension, history of angina, history of myocardial infarction, history of stroke, and stratified by sex and Southern European migrant status.
§Adjusted for batch and seasonal effects. ||Interaction between 25(OH)D and 25(OH)D2.
ergocalciferol and cholecalciferol equally well(29,30), mitochondrial CYP27A1 25-hydroxylates cholecalciferol(31), but not ergocalciferol(32).
Another enzyme, CYP3A4, 25-hydroxylates ergocalci-ferol and not cholecalciergocalci-ferol, but also 24-hydroxylates several vitamin D metabolites(33–35). In particular, CYP3A4 plays a major role in 23- and 24-hydroxylation of the biologically active form of cholecalciferol, 1,25-dihydroxy-cholecalciferol (1,25(OH)2D3), in the liver and small
intestine(35). CYP3A4 is the most abundant liver cyto-chrome P450 enzyme and has broad specificity, catabolising more than 50 % of known drugs(34,36). Many drugs inhibit or induce CYP3A4, thereby potentially increasing vitamin D turnover(33,35). It is possible that ergocalciferol similarly induces CYP3A4, leading to enhanced 23- and 24-hydroxylation of 1,25(OH)2D3;
inactivating cholecalciferol and ultimately eliminating it from the body. Thus, a plausible explanation for the inverse association between circulating 25(OH)D2 and
25(OH)D3, and any potential detrimental effect of
ergocalciferol on health, is enhanced CYP3A4-induced cat-abolism of 1,25(OH)2D3in the presence of ergocalciferol.
In summary, our results confirm those of previous stu-dies that higher levels of 25(OH)D are associated with reduced mortality. For our study at least, this was due to the inverse association between 25(OH)D3and mortality.
Our findings with respect to 25(OH)D2 require con
firma-tion in other populafirma-tions with higher exposure to this form of vitamin D.
Acknowledgements
Acknowledgements: This study was made possible by the contribution of many people, including the original investi-gators, the Programme Manager, and the diligent team who recruited the participants and who continue working on follow-up. The authors would like to express their gratitude to the many thousands of Melbourne residents who con-tinue to participate in the study. Participants’ vital status was ascertained through the Victorian Cancer Registry (VCR) and the Australian Institute of Health and Welfare (AIHW), including the National Death Index. Financial support: Cohort recruitment was funded by VicHealth and The Cancer Council Victoria. This work was supported by the National Health and Medical Research Council (project grant 623208). A.K.H. is supported by an Australian Postgraduate Award. The funding source had no role in the design, analysis or writing of this article. Conflict of interest: None. Authorship: D.W.E. and D.R.E. made equal contributions. A.K.H. formulated the research question, conducted the literature search, analysed and interpreted the data, and wrote thefirst draft of the report. E.J.W. oversaw the design, statistical analysis, interpretation of the data and drafting of the report. D.K. carried out laboratory measurements of vitamin D status. A.M.H., P.R.E. and R.E.N. reviewed the manuscript. L.B. was involved in the design of the
case–cohort study, obtained funding and reviewed the manuscript. G.G.G. conceived and designed the cohort study and reviewed the manuscript. D.W.E. obtained funding, oversaw measurements of vitamin D status and reviewed the manuscript. D.R.E. obtained funding, over-saw the data analysis and interpretation, and reviewed the manuscript. All authors read and approved thefinal manuscript. Ethics of human subject participation: This study was conducted according to the guidelines laid down in the Declaration of Helsinki and all procedures involving human subjects were approved by the Cancer Council Victoria’s Human Research Ethics Committee. Written informed consent was obtained from all participants.
References
1. Chowdhury R, Kunutsor S, Vitezova A et al. (2014) Vitamin D and risk of cause specific death: systematic review and meta-analysis of observational cohort and randomised intervention studies. BMJ 348, g1903.
2. Zhang YV, Stolla M & Kwong TC (2015) Prevalence of 25-hydroxyvitamin D2in western New York: a 3-year study.
Clin Chim Acta 444, 3–8.
3. Holick MF (2007) Vitamin D deficiency. N Engl J Med 357, 266–281.
4. Tripkovic L, Lambert H, Hart K et al. (2012) Comparison of vitamin D2and vitamin D3supplementation in raising serum
25-hydroxyvitamin D status: a systematic review and meta-analysis. Am J Clin Nutr 95, 1357–1364.
5. Bjelakovic G, Gluud LL, Nikolova D et al. (2014) Vitamin D supplementation for prevention of mortality in adults. Cochrane Database Syst Rev 1, CD007470.
6. Food Standards Australia New Zealand (2015) NUTTAB 2010 – Vitamin D File. http://www.foodstandards.gov. au/science/monitoringnutrients/nutrientables/pages/default. aspx (accessed December 2015).
7. Tjellesen L, Hummer L, Christiansen C et al. (1986) Serum concentration of vitamin D metabolites during treatment with vitamin D2and D3in normal premenopausal women.
Bone Miner 1, 407–413.
8. Armas LA, Hollis BW & Heaney RP (2004) Vitamin D2is
much less effective than vitamin D3 in humans. J Clin
Endocrinol Metab 89, 5387–5391.
9. Binkley N, Gemar D, Engelke J et al. (2011) Evaluation of ergocalciferol or cholecalciferol dosing, 1,600 IU daily or 50,000 IU monthly in older adults. J Clin Endocrinol Metab 96, 981–988.
10. Lehmann U, Hirche F, Stangl GI et al. (2013) Bioavailability of vitamin D2and D3in healthy volunteers, a randomized
placebo-controlled trial. J Clin Endocrinol Metab 98, 4339–4345.
11. Logan VF, Gray AR, Peddie MC et al. (2013) Long-term vitamin D3supplementation is more effective than vitamin
D2in maintaining serum 25-hydroxyvitamin D status over
the winter months. Br J Nutr 109, 1082–1088.
12. Glendenning P, Chew GT, Seymour HM et al. (2009) Serum 25-hydroxyvitamin D levels in vitamin D-insufficient hip fracture patients after supplementation with ergocalciferol and cholecalciferol. Bone 45, 870–875.
13. Nimitphong H, Saetung S, Chanprasertyotin S et al. (2013) Changes in circulating 25-hydroxyvitamin D according to vitamin D binding protein genotypes after vitamin D3or D2
supplementation. Nutr J 12, 39.
14. Giles GG (1990) The Melbourne study of diet and cancer. Proc Nutr Soc Aust 15, 61–68.
15. Ireland P, Jolley D, Giles G et al. (1994) Development of the Melbourne FFQ: a food frequency questionnaire for use in an Australian prospective study involving an ethnically diverse cohort. Asia Pac J Clin Nutr 3, 19–31.
16. Eyles D, Anderson C, Ko P et al. (2009) A sensitive LC/MS/ MS assay of 25OH vitamin D3and 25OH vitamin D2in dried
blood spots. Clin Chim Acta 403, 145–151.
17. Heath AK, Williamson EJ, Ebeling PR et al. (2014) Measure-ments of 25-hydroxyvitamin D concentrations in archived dried blood spots are reliable and accurately reflect those in plasma. J Clin Endocrinol Metab 99, 3319–3324. 18. Cox NJ (2006) Speaking Stata: in praise of trigonometric
predictors. Stata J 6, 561–579.
19. Barlow WE, Ichikawa L, Rosner D et al. (1999) Analysis of case–cohort designs. J Clin Epidemiol 52, 1165–1172. 20. Nowson CA, Diamond TH, Pasco JA et al. (2004) Vitamin D
in Australia. Issues and recommendations. Aust Fam Phy-sician 33, 133–138.
21. Schöttker B, Jorde R, Peasey A et al. (2014) Vitamin D and mortality: meta-analysis of individual participant data from a large consortium of cohort studies from Europe and the United States. BMJ 348, g3656.
22. Durup D, Jørgensen HL, Christensen J et al. (2012) A reverse J-shaped association of all-cause mortality with serum 25-hydroxyvitamin D in general practice: the CopD study. J Clin Endocrinol Metab 97, 2644–2652.
23. Sempos CT, Durazo-Arvizu RA, Dawson-Hughes B et al. (2013) Is there a reverse J-shaped association between 25-hydroxyvitamin D and all-cause mortality? Results from the US nationally representative NHANES. J Clin Endocrinol Metab 98, 3001–3009.
24. Michaëlsson K, Baron JA, Snellman G et al. (2010) Plasma vitamin D and mortality in older men: a community-based prospective cohort study. Am J Clin Nutr 92, 841–848. 25. Zittermann A, Iodice S, Pilz S et al. (2012) Vitamin D deficiency
and mortality risk in the general population: a meta-analysis of prospective cohort studies. Am J Clin Nutr 95, 91–100.
26. Swanson CM, Nielson CM, Shrestha S et al. (2014) Higher 25(OH)D2 is associated with lower 25(OH)D3 and
1,25(OH)2D3. J Clin Endocrinol Metab 99, 2736–2744.
27. Hollis BW (1984) Comparison of equilibrium and dis-equilibrium assay conditions for ergocalciferol, cholecalciferol and their major metabolites. J Steroid Biochem 21, 81–86. 28. Jones KS, Assar S, Harnpanich D et al. (2014) 25(OH)D2
half-life is shorter than 25(OH)D3half-life and is influenced
by DBP concentration and genotype. J Clin Endocrinol Metab 99, 3373–3381.
29. Cheng JB, Motola DL, Mangelsdorf DJ et al. (2003) De-orphanization of cytochrome P450 2R1: a microsomal vitamin D 25-hydroxylase. J Biol Chem 278, 38084–38093. 30. Shinkyo R, Sakaki T, Kamakura M et al. (2004) Metabolism of vitamin D by human microsomal CYP2R1. Biochem Biophys Res Commun 324, 451–457.
31. Sawada N, Sakaki T, Ohta M et al. (2000) Metabolism of vitamin D3 by human CYP27A1. Biochem Biophys Res
Commun 273, 977–984.
32. Guo YD, Strugnell S, Back DW et al. (1993) Transfected human liver cytochrome P-450 hydroxylates vitamin D analogs at different side-chain positions. Proc Natl Acad Sci U S A 90, 8668–8672.
33. Gupta RP, Hollis BW, Patel SB et al. (2004) CYP3A4 is a human microsomal vitamin D 25-hydroxylase. J Bone Miner Res 19, 680–688.
34. Gupta RP, He YA, Patrick KS et al. (2005) CYP3A4 is a vitamin D-24- and 25-hydroxylase: analysis of structure function by site-directed mutagenesis. J Clin Endocrinol Metab 90, 1210–1219.
35. Xu Y, Hashizume T, Shuhart MC et al. (2006) Intestinal and hepatic CYP3A4 catalyze hydroxylation of 1 α,25-dihydroxy-vitamin D3: implications for drug-induced osteomalacia. Mol
Pharmacol 69, 56–65.
36. Prosser DE, Jones G (2004) Enzymes involved in the acti-vation and inactiacti-vation of vitamin D. Trends Biochem Sci 29, 664–673.