Antonio Di Pietro
METHODOLOGIES FOR EMERGENCY MANAGEMENT IN CRITICAL INFRASTRUCTURES
Doctoral Thesis in
Computer Science and Automation Dept. of Engineering
University of "Roma Tre" Doctoral Thesis in
Computer Science and Automation Dept. of Engineering
XXVII Cycle
METHODOLOGIES FOR EMERGENCY MANAGEMENT IN CRITICAL INFRASTRUCTURES
Ph. D. Student: Antonio Di Pietro Signature: ________________________ Advisor: Stefano Panzieri Signature: ________________________ Course Coordinator: Stefano Panzieri Signature: ________________________
in Critical Infrastructures
A Thesis presented by Antonio Di Pietro
in partial fulfillment of the requirements for the degree of Doctor of Philosophy
in Computer Science and Automation Dept. of Engineering
University of "Roma Tre"
April 2015
I went to the woods because I wished to live deliberately, to front only the essential facts of life, and see if I could not learn what it had to teach, and
not, when I came to die, discover that I had not lived. — Henry David Thoreau
Dedicated to Laura, Francesco, Benedetta and to the loving memory of my dad.
A B S T R A C T
Critical Infrastructure Protection (CIP) is a concept that relates to the preparedness and response to severe incidents involving the critical infrastructures of a country. These incidents include terrorist attacks or large black-outs that may produce severe consequences for the citizens and the society in general.
Traditionally, each infrastructure takes care of its own system. For example, reliability indexes are used by the electrical utility to mea-sure the quality of the electrical service. However, after the events of 9/11, Katrina, and others, it became clear that considering infras-tructures separately was not sufficient to prepare for and respond to large disasters in an effective manner that prioritizes not the individ-ual infrastructure states but the overall societal impact. A new era of research on interdependencies and best decisions during emergencies emerged.
A relatively large body of knowledge has built in recent years for modeling the CI interdependencies problem from a number of points of view. This is an area that affects society as a whole and, therefore, many disciplines have to come together for its understanding includ-ing computer science, systems engineerinclud-ing, and human aspects.
This thesis represents an extensive and thorough work not only in reviewing the state-of-the art in critical infrastructure protection but also in bringing together, within an integrated structural framework, a number of models that represent various aspects of the problem. This framework is applied to build and analyze realistic scenarios.
The body of the thesis can be divided into three aspects: I) Prelimi-nary Notions (Chapters 2 and 3), II) Situation Awareness and Impact Analysis Methodologies (Chapters 4, 5, and 6), and III) Decision Sup-port Systems (Chapter 7). This sequence builds the path from data collection to situational awareness, to best responses.
A C K N O W L E D G E M E N T S
These years of research and this doctoral thesis would have not been possible without the help and support of some people. That’s why I want to express my gratitude to some of them.
First and foremost, I extend my gratitude to my Ph.D supervisor, Professor Stefano Panzieri, for his guidance and support throughout this work.
My special thanks also go to Dr. Vittorio Rosato for giving me the opportunity to attend this Ph.D. and for its useful suggestions on how to improve this work.
I also thank Dr. Andrea Gasparri for his dedication and teachings and for stimulating me to do a quality work.
I also like to thank Professor Josè Martì for inviting me twice at the Department of Electrical and Computer Engineering at the Univer-sity of British Columbia in Vancouver, Canada. My experience spent there in his research group was really stimulating and gave me the opportunity to address new research areas.
I would like to thank all the staff of the MCIP Lab of the Depart-ment of Engineering of the University of Roma Tre. My special thanks go to Dr. Chiara Foglietta for sharing this course of study and for its support during these years.
I would like to thank all my colleagues of UTMEA-CAL Lab of ENEA for the fruitful discussions I had with many of them that al-lowed me to complete this work.
Finally, I extend my utmost gratitude to Laura and my family for their encouragement, patience and love, which made this work a re-ality.
Antonio Di Pietro
University of Roma Tre April 2015
C O N T E N T S
1 i n t r o d u c t i o n 1
1.1 Overview . . . 1
1.2 Contributions . . . 2
1.2.1 Algorithms for Distributed Data Fusion . . . 3
1.2.2 Impact assessment of Cyber-Attacks and Natu-ral Hazards . . . 4
1.2.3 Decision Support . . . 4
1.3 Organization of the Dissertation . . . 4
i p r e l i m i na r y n o t i o n s 7 2 m u lt i-sensor data fusion 9 2.1 Data Fusion . . . 9
2.2 Data Fusion Models . . . 10
2.3 Approaches to Handling Uncertainty . . . 11
2.3.1 Bayesian Probability Theory . . . 12
2.3.2 Possibility Theory . . . 12
2.3.3 Dempster-Shafer Theory . . . 13
2.4 Notions of Dempster-Shafer Theory . . . 13
2.4.1 Basic Notions . . . 13
2.4.2 Evidence Combination . . . 14
2.4.3 Evidence Discounting . . . 15
2.4.4 Pignistic Probability . . . 16
2.5 Data Fusion Architectures . . . 16
2.6 Chapter Summary . . . 17
3 m o d e l i n g a n d s i m u l at i o n o f i n t e r d e p e n d e n t s y s -t e m s 19 3.1 Overview . . . 19
3.2 Modeling and Simulation Approaches . . . 20
3.2.1 Empirical Approaches . . . 20
3.2.2 Agent Based Approaches . . . 21
3.2.3 System Dynamics Based Approaches . . . 21
3.2.4 Economic Theory Based Approaches . . . 21
3.2.5 Network Based Approaches . . . 22
3.2.6 Other Approaches . . . 23
3.3 Network based tools . . . 23
3.3.1 i2Sim . . . 24 3.3.2 CISIA . . . 26 3.4 Other approaches . . . 27 3.4.1 WebSimP . . . 27 3.5 Chapter Summary . . . 29 ii s i t uat i o n awa r e n e s s m e t h o d o l o g i e s 31 4 d i s t r i b u t e d d ata f u s i o n f o r s i t uat i o n awa r e n e s s 33
4.1 Data Fusion Using Distributed Gossip Algorithm . . . 35
4.1.1 Data Fusion Algorithm . . . 35
4.1.2 Convergence Criteria . . . 37
4.1.3 Case Study . . . 37
4.2 Data Fusion using Distributed Gossip Algorithm with Evidence Discounting . . . 49
4.2.1 Data Fusion Algorithm . . . 50
4.2.2 Simulation Results . . . 55
4.3 Chapter Summary . . . 58
5 i m pa c t a s s e s s m e n t o f c y b e r t h r e at s 61 5.1 Overview . . . 62
5.2 Detailed Review of SCADA Security Testbeds . . . 62
5.2.1 Reference Model . . . 62
5.2.2 Comparing SCADA Security Testbeds . . . 65
5.3 An i2Sim Based SCADA Security Testbed . . . 66
5.3.1 Software Architecture . . . 67
5.3.2 Case Study . . . 69
5.4 A CISIA Based SCADA Security Testbed . . . 73
5.4.1 Software Architecture . . . 73
5.4.2 Case Study . . . 76
5.5 Chapter Summary . . . 78
6 i m pa c t a s s e s s m e n t o f nat u r a l h a z a r d s 79 6.1 Overview . . . 79
6.2 Decision Support System Architecture . . . 80
6.2.1 Risk Analysis . . . 80
6.2.2 Software Architecture . . . 82
6.3 Impact Assessment in Electrical Distribution Grids . . 86
6.3.1 Short Time Scale Impact Assessment . . . 86
6.3.2 Implementation . . . 87
6.3.3 Case Study . . . 89
6.4 Chapter Summary . . . 91
7 r e s o u r c e s a l l o c at i o n i n e m e r g e n c y s c e na r i o s 93 7.1 Overview . . . 93
7.2 Genetic Algorithms Based Approaches . . . 94
7.2.1 Load Shedding Problem . . . 94
7.2.2 Crewmen Optimization Problem . . . 101
7.3 Ordinal Optimization Based Approach . . . 105
7.3.1 Problem Overview . . . 105
7.3.2 Case Study . . . 108
7.4 Simulation Based Approach . . . 109
7.4.1 Problem Overview . . . 109
7.4.2 Case Study . . . 110
7.5 Chapter Summary . . . 116
iii e p i l o g u e 119
c o n t e n t s xiii iv a p p e n d i x 123 a p r o o f s 125 a.1 Lemma 1 Proof . . . 125 a.2 Lemma 2 Proof . . . 126 b i b l i o g r a p h y 129
Figure 1 Approaches covered grouped according to the capability of situation awareness and the use
of sensor. . . 3
Figure 2 An example of a production cell. . . 25
Figure 3 Input-Output representation of a CISIA entity. 26 Figure 4 DR-NEP-WebSimP architecture. . . 28
Figure 5 Communication framework among the infras-tructures in the considered scenario. . . 38
Figure 6 Communication framework among the infras-tructures in the considered scenario. . . 39
Figure 7 Sample scenario. . . 41
Figure 8 An example of expected damage scenario ([44] and [69] modified). . . 45
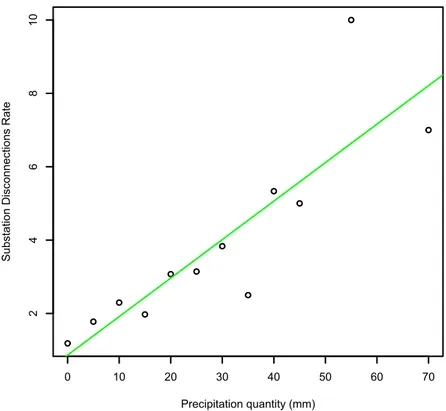
Figure 9 Linear regression between the average discon-nections rate and the quantity of rain precipi-tation. . . 46
Figure 10 Fragility curve for the segmented pipeline [49]. 47 Figure 11 Sample scenario: resources exchanged among the infrastructures. . . 51
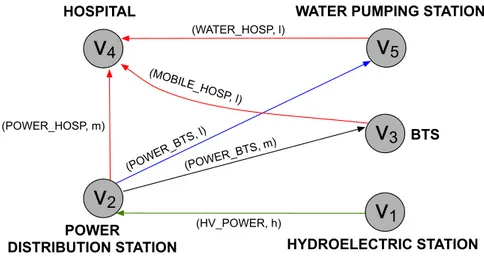
Figure 12 Sample scenario: dependency layer graph G. Values l, m, h stand for low, medium and high degree of coupling respectively. . . 54
Figure 13 Main components of the reference model of the SCADA security testbed. . . 62
Figure 14 Enhanced SIEM platform architecture. . . 67
Figure 15 Sample scenario. . . 70
Figure 16 MHR model of the example scenario. . . 71
Figure 17 OSSIM rule. . . 72
Figure 18 i2Sim results. . . 73
Figure 19 Reference architecture. . . 74
Figure 20 Main components and connections of Integrated Risk Predictor system. . . 75
Figure 21 Data workflow for a simple attack scenario. . . 76
Figure 22 Interdependences model in the MHR approach. 78 Figure 23 Functional Block Diagram of the Decision Sup-port System. . . 83
List of Figures xv
Figure 24 Examples of Physical Harms Scenarios. Upper side: Shake map of a seismic event; Lower side: Flood risk. Each physical component is associ-ated an estimassoci-ated damage level resulting from the occurrence of the natural hazard (seismic and flooding event respectively). . . 85 Figure 25 The electrical distribution grid model. . . 87 Figure 26 Representation of a section of a power
distri-bution grid of Rome. Rome scenario at time t = t0. . . 89 Figure 27 Representation of a section of a power
distri-bution grid of Rome. Rome scenario at time t = t2 (hypothesis: BTS are working properly). 90 Figure 28 Profile of the estimated substations in failure
state. . . 91 Figure 29 Sample scenario: functional dependencies
in-volving a power grid, water distribution net-works, hospitals and manufacturing plants. . . 96 Figure 30 Sample scenario: geographic representation the
shake map relative to the seismic event. The lightning indicates the physical components that are estimated to be damaged due to the occur-rence of the seismic event. . . 97 Figure 31 Power grid model. Grey boxes: power
genera-tors; red boxes: High Voltage substations; yel-low boxes: Medium Voltage substations; arrow: electrical loads. . . 98 Figure 32 Case study: representation of a section of the
electrical distribution grid of Rome. Arrows in-dicate the interdependency among Electrical and SCADA systems. . . 103 Figure 33 Case study: a candidate sequence solution for
the optimization problem and a representation of the sequences of manual interventions over time. . . 104 Figure 34 Ordinal Optimization solution space [47]. . . . 107 Figure 35 Curves trend of the Physical Modes of the i2sim
model. . . 108 Figure 36 Hospital simulation results. . . 108 Figure 37 Power distribution grid and SCADA system. . 111 Figure 38 SCADA System. . . 112 Figure 39 i2sim Model. . . 113
Figure 40 Steady-state convergence at different time-intervals. The number inside each circle represents the weight function set value wi(ti, γa)of a generic
L I S T O F TA B L E S
Table 1 An example of application of the cautious
com-bination rule. . . 15
Table 2 An example of BBA m(·) and its relative dis-counting function mα(·) obtained for α = 0.2. 15 Table 3 Monitoring agents considered in the scenario. 42 Table 4 BBA generated by agent v1. . . 43
Table 5 BBA generated by agent v2. . . 43
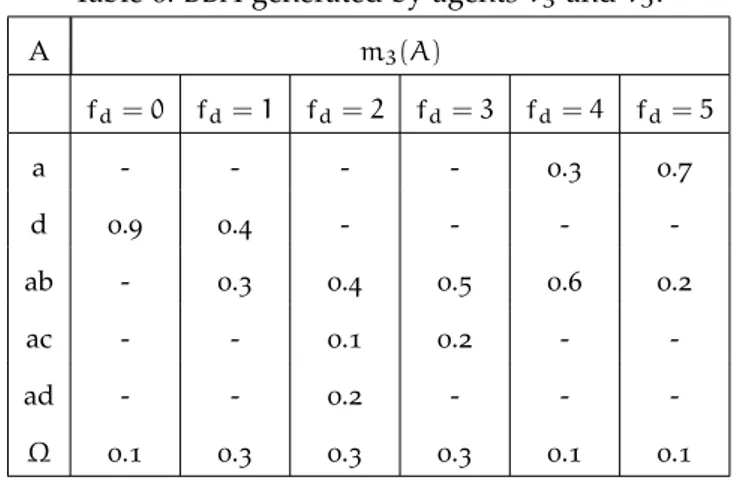
Table 6 BBA generated by agents v3 and v5. . . 44
Table 7 BBA generated by agent v4. . . 45
Table 8 BBA generated by agent 6 (P denotes PGA). . 47
Table 9 An example of initial BBAs for agents vi with i = 1..11 at time t = 0 and convergent BBA at time t = 106. . . 48
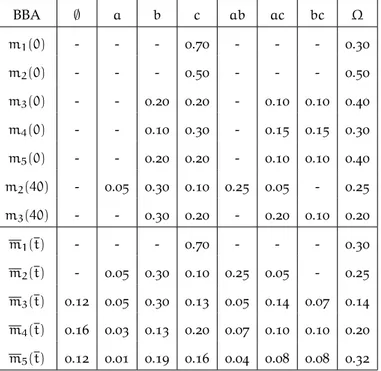
Table 10 BBA mf i(0) applied to node vi in case of link failure of eij. . . 53
Table 11 Simulation results obtained with a static topol-ogy and time-unvarying confidences with con-vergent BBAs reached at time t = 5. . . 56
Table 12 Simulation results obtained with a static topol-ogy and time-varying confidences with con-vergent BBAs reached at time t = 43. . . 56
Table 13 Simulation results obtained with a dynamic topol-ogy and time-unvarying confidences with con-vergent BBAs reached at time t = 31. . . 57
Table 14 Simulation results obtained with a dynamic topol-ogy and time-varying confidences with con-vergent BBAs reached at time t = 50. . . 58
Table 15 Capabilities required for each of the identified categories. . . 65
Table 16 Electric demands of the CIs considered in the scenario. . . 70
Table 17 Electrical Power balance (active power, MW) resulting from the load shedding actions in case I and II. . . 97
Table 18 Critical Infrastructure Service Layer (Case I and II). . . 98
Table 19 Considered Consequence Criteria. . . 102
Table 20 Electricity demand for loads/customers. . . 111
Table 21 SCADA network model assumptions. . . 112
Table 22 Sequence of events for the simulated scenarios. 113 Table 23 Feasible configurations for 100% power supply to the water pumping station. . . 114
Table 24 Decision space for the three scenarios. . . 115 Table 25 Simulation results. . . 116
1
I N T R O D U C T I O N1.1 ov e r v i e w
Critical infrastructure are the assets, systems, and networks, whether physical or virtual that are essential for the functioning of a society and economy. Typical examples of critical infrastructures are electric power systems, telecommunication networks, water distribution sys-tems, transportation syssys-tems, wastewater and sanitation syssys-tems, fi-nancial and banking systems, food production and distribution, and oil/natural gas pipelines.
The damage to a critical infrastructure, its destruction or disrup-tion by natural disasters, terrorism, criminal activity or malicious be-haviour, may produce a significant negative impact for the security and the well-being of its citizens. In particular, the existence of depen-dencies of various type (e.g., physical or cyber) with different degree of coupling [60] [73] among the infrastructures expose them the
possi-bility of cascading failures not only within the facility or the company, but also cascading effects that might affect other infrastructures [89].
For example, a black-out occurring in an electrical distribution net-work can produce disruptions for the telecommunication services which in turn may alter the normal functioning of banking services in a specific area thus causing negative effects for the citizens.
The protection of critical infrastructures is relevant in all industri-alized countries. To this regard, specific policies have been produced to increase their security. In 2008, in the context of the European Pro-gramme for Critical Infrastructure Protection (EPCIP), a specific di-rective [33] establishes a procedure for identifying and designating
European Critical Infrastructures (ECI) and a common approach for assessing the need to improve their protection.
The literature on critical infrastructure protection is mostly pro-vided by states that publish their national strategies to address the
challenge of protecting their critical infrastructures. The investiga-tions of researchers have encompassed issues of national security, pol-icymaking, infrastructure system organization, and behavior analysis and modeling.
Regarding the latter subject, in order to evaluate the risk of degra-dation of critical infrastructure services which may result in cascad-ing failures, an improved situation awareness, aimcascad-ing at identifycascad-ing the state of a system and predict its evolution, can be of help for decision makers to take appropriate countermeasures.
Situation awareness [71] is formally defined as "the perception of the
elements in the environment within a volume of time and space, the compre-hension of their meaning and the projection of their status in the near future". When applied to critical infrastructures contexts, situation awareness encompass approaches at different hierarchical level according to the capability of providing high-level support to decision makers and the use of raw data coming from sensors. Hence, situation awareness is highly connected to the data fusion concept, where multiple informa-tion sources have to be combined, in order to provide a robust and complete description of an environment or process of interest [56].
In the field of physical security such as field surveillance, data fu-sion techniques are typically based on a huge availability of sensorial data used, for instance, to determine the presence of entities in the patrolled area (e.g., ships, submarines, air-crafts, etc.), with the aim of identifying them on the base of specific properties.
Hence, it is fundamental to provide adequate raw data aggrega-tion methodologies, in order to obtain high-level behaviour detecaggrega-tion and prediction to implement mitigating risks procedures addressing prevention, protection, preparedness, and consequence management.
1.2 c o n t r i b u t i o n s
In order to present the topics addressed in this dissertation, in Figure Figure 1we show the different contributions ordered by the grade of situation awareness provided by each of them and the relative use of sensors which they require.
As mentioned, data fusion make high use of raw data coming from several sources to produce new raw data so that fused data is more informative and synthetic than the original inputs. To this regard, we defined specific algorithms and proposed how the fused data pro-duced by such algorithms may be used to increase the security of critical infrastructures. However, the algorithms proposed cannot be regarded as a means to provide an high situation awareness as they provide a raw estimation in a limited temporal horizon and make little use of past data.
Approaches for impact assessment have been proposed to predict the impact of specific cyber threats and natural hazards to critical
in-1.2 contributions 3
frastructures. Such approaches can model the relationships between functional components of critical infrastructures and the provided ser-vices to perform risk assessment and predict service level variations. Although they are based on data provided by sensors to detect cyber and natural threats, the focus of such approaches is to integrate raw data inside models that can estimate the service evolution in terms of expected damages or service losses and the effect of specific actions on the actors and entities involved.
Procedures to mitigate the risk of service degradations in critical infrastructures have been proposed in contexts where the resources, that are vital to ensure normal service levels, are limited. Such ap-proaches can provide high situation awareness to decision makers and estimate the impact of decisions.
Figure 1: Approaches covered grouped according to the capability of situa-tion awareness and the use of sensor.
1.2.1 Algorithms for Distributed Data Fusion
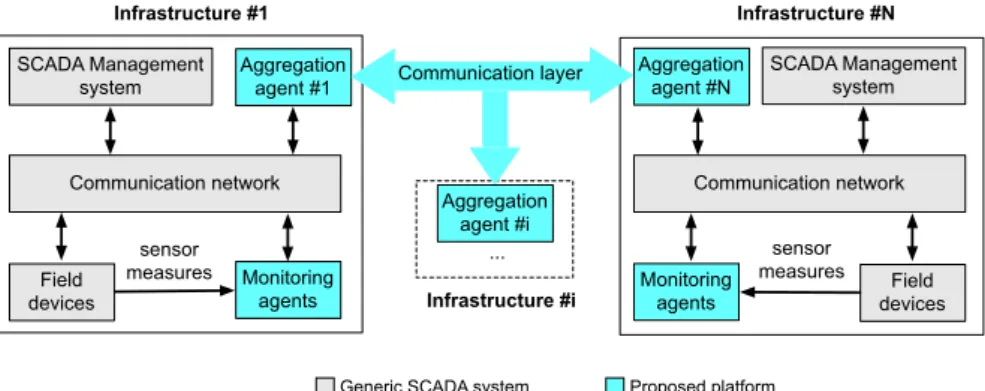
We propose a distributed communication framework to be imple-mented among dependent critical infrastructures based on informa-tion sharing of possible adverse events (e.g., physical, cyber) that af-fect the infrastructures.
The proposed framework, based on distributed data fusion algo-rithms, allows to produce early warnings against possible events that may cause cascading failures. This information can be useful for de-cision makers to take appropriate countermeasures.
For one of the two algorithms, we demonstrate the convergence in case of temporary failures affecting the communication channels that allow the sharing of the adverse events.
1.2.2 Impact assessment of Cyber-Attacks and Natural Hazards
We present a methodology to analyze realistic scenarios of cyber at-tacks and natural hazards and measure their consequences in terms of the impact on multiple interdependent infrastructures. This is a new key concept in the electric power grid at the present time, when the traditional "confined" grid is being "opened-up" to allow for dis-tributed energy resources to be supplied by independent providers. The traditional concept of "reliability" of individual components in the grid is shifting towards the concept of "resiliency" of the grid, thus recognizing that the focus should be the ultimate impact on so-ciety.
Regarding the assessment of cyber attacks, we present two plat-forms and show how threats against wireless sensor network nodes and SCADA components can be detected to conduct real-time assess-ments of the impact of the attacks on the services provided by critical infrastructures.
Regarding the assessment of natural hazards, we describe the main features of a Decision Support System (DSS) employing modeling and simulation techniques to forecast the effects of natural hazards. Then, we present a predefined procedure that produces an estimate of the number of electrical substations of an electric distribution grid by considering the interdependency phenomena with the relative SCADA system.
1.2.3 Decision Support
We present methodologies that can be valuable for decision makers to define optimal allocation of resources that maximize the delivery of infrastructure services during emergency crisis.
The actions proposed to decision makers are produced by keeping into account the interdependency existing among the power domain and the SCADA system so that the consequences for the society may be reduced.
1.3 o r g a n i z at i o n o f t h e d i s s e r tat i o n
The rest of the dissertation is organized into two main parts and an epilogue dedicated to the future research directions and concluding remarks.
Part I: Preliminary Notions contains introductory material that is
1.3 organization of the dissertation 5
Chapter 2provides a brief introduction to data fusion with a
special focus to Dempster-Shafer formalism relevant to the work presented in this dissertation.
Chapter 3 presents a review on modeling and simulation of
interdependent critical infrastructures methodologies. In particular, we describe the methodologies and tools used to implement impact assessment and procedures for emer-gency management.
Part II: Situation awareness methodologies contains approaches
analysed to implement situation awareness.
Chapter 4presents two data fusion frameworks based on
dis-tributed gossip algorithms to exchange the possible cause(s) of fault or threat affecting critical infrastructures to increase their security security. We also present practical methods that can be implemented by sensor points installed at each infrastructure to estimate specific threats.
Chapter 5 studies the problem of how to estimate the
im-pact of cyber threats affecting critical infrastructures. We first present a taxonomy of SCADA security testbeds taken from the literature which allow to recreate cyber-attacks on the de facto standard communication protocol. Then, we present specific technological frameworks able to as-sess the impact of cyber threats against specific nodes of SCADA systems controlling interdependent physical sys-tems.
Chapter 6 studies the problem of how to estimate the
im-pact of natural hazards affecting critical infrastructures. We present the functionalities of a Decision Support System (DSS) and show an application of the system to a sample crisis scenario induced by an earthquake. We then present a procedure to assess the impact of natural hazards in elec-tric and SCADA systems.
Chapter 7provides methodologies based on optimization
tech-niques to implement mitigation strategies.
Part III: Epilogue contains the concluding chapters of the
dis-sertation.
Chapter 8 provides concluding remarks and presents future
Part I
2
M U LT I - S E N S O R D ATA F U S I O NMulti-sensor data fusion techniques provide refined information from multiple sensor data sources by spatio-temporal data integration and the available context.
In the context of public security, it is of outstanding importance to aggregate raw data obtained from multiple sources in order to pro-vide an improved picture of a situation as well as to gather knowledge about all the actors in a scenario. In tactical operations, either in the military or for civil purposes, data fusion is a process that increases intelligence tasks and provides important support for planning oper-ations.
This Chapter is organized as follows: in Section2.1 we present an overview on data fusion; in Section 2.2 we discuss the popular data fusion models; in Section 2.3 we describe the main formalisms to handle uncertainty in data fusion contexts; in Section2.4we focus on the Dempster-Shafer data fusion formalism, and finally in Section2.5 we discuss the different data fusion architectures.
2.1 d ata f u s i o n
In general, the terms information fusion and data fusion are used as synonyms even if in some cases the term data fusion is used for raw data i.e., data obtained directly from the sensors whereas the term information fusion is employed when considering already processed data. In the literature, there are different terms related to data fusion which include decision fusion, data combination, data aggregation, multi-sensor data fusion, and sensor fusion.
White [92] defines data fusion as "a process dealing with the
associ-ation, correlassoci-ation, and combination of data and information from sin-gle and multiple sources to achieve refined position and identity esti-mates, and complete and timely assessments of situations and threats,
and their significance. The process is characterized by continuous re-finements of its estimates and assessments, and the evaluation of the need for additional sources, or modification of the process itself, to achieve improved results".
Briefly, we can define multi-sensor data fusion as the process through which data are combined from multiple sources whereas single-sensor fusion refers to the case where multiple data coming from a single source are fused. In both cases, data aggregation is performed to ob-tain improved information i.e., information that has higher quality or more relevant information content.
Data fusion techniques can be grouped into three categories: (i) data association, (ii) state estimation, and (iii) decision fusion [17].
Data association techniques try to establish the set of measure-ments that are generated by the same target over time (e.g., a track can be defined as a sequence of points along a path provided by the same target). Data association is often executed before the state estimation of the detected targets. Data association process can be performed in all of the fusion levels with a granularity that depends on the specific level.
State estimation techniques allow to estimate the state of the tar-get under movement given a set of measurements. Tartar-get observa-tions may or may not be relevant, which means that in general only some of the observations could actually be associated to the target. State estimation methods include linear and nonlinear dynamics and measurements. In first case, the equations of the object state and the measurements are linear and the noise follows the Gaussian distribu-tion; theoretical solution are based on the Kalman filter. In nonlinear dynamics, the state estimation problem there are methods based on control theory and probability to define a vector state from vector measurements.
Decision fusion techniques produce a high-level inference about the events and activities that are generated from the detected tar-gets. These techniques can be based on Bayesian methods, Dempster-Shafer inference, adductive reasoning or semantic methods.
2.2 d ata f u s i o n m o d e l s
Endsley [34] proposed a data fusion model known as Joint
Direc-tors of Laboratories (JDL) based on four-layered hierarchical structure where each layer provides a descriptive representation of the scenario. In this model, moving from the lower to the higher layer, the degree of information is decreased whereas the degree of information is in-creased due to the data aggregations implemented at each layer.
Level 1 Object Refinement: This layer attempts to identify objects
2.3 approaches to handling uncertainty 11
the objects from multiple sources. Data gathered at this stage provide a low degree of abstraction (e.g., position, speed).
Level 2 Situation Assessment: This layer attempts to evaluate the
relations among the different entities and the observed events provided by level 1.
Level 3 Threat Assessment: This layer predicts the effect of the
sit-uation identified by level 2 in terms of possible opportunities for operation (e.g., expected damages given the enemy’s be-haviour).
Level 4 Process Refinment: This layer allocates sources to mission
goals and highlights the impact of these decisions.
Thomopoulos [84] proposed a model for data fusion
consist-ing of three modules, each integratconsist-ing data at different lev-els namely Signal, Evidence and Dynamics level fusion. Signal level fusion applies data correlation through learning due to the lack of a mathematical model describing the phenomenon being measured. Evidence level fusion combines the data at dif-ferent levels of inference based on a statistical model and the assessment required by the user. Dynamics level fusion applies the fusion of data through the support of specific mathematical models.
The presented two models should not be considered as opera-tive procedures, but rather methodologies that may be useful to adequately define the steps for the extrapolation of high-level and abstract information from raw low-level data.
2.3 a p p r oa c h e s t o h a n d l i n g u n c e r ta i n t y
Mechanisms to handle uncertain data is required in every data fu-sion framework. Uncertain data result from lack of information in a specific area of interest. The types of uncertainty can be grouped as follows [23]:
Incompletness: relates to the situation where part of the
informa-tion required is missing (e.g., if the posiinforma-tion of the detected hos-tile unit is missing from a report then the report information is incomplete).
Imprecision: relates to the situation where the value of a variable
of interest is given but not with enough information (e.g., the temperature value detected by a thermometer is between 15 and 25Celsius degrees).
Uncertainty: relates to the situation where the information is
tem-perature value detected by a thermometer is probably 25 Celsius degrees).
Depending on the mechanism used to handle uncertainty, the kinds of uncertainty that can be treated for data representation, fusion, in-ferencing and decision-making by a specific approach may vary.
In the following, we present a brief introduction of the popular methodologies to handle uncertainty in order to show each approach can accommodate specific properties of uncertain data.
2.3.1 Bayesian Probability Theory
The Bayesian Probability Theory provides an interpretation of the con-cept of probability. This can be seen as an extension of propositional logic that enables reasoning with hypotheses, i.e., the propositions which deal with uncertainty.
In contrast to interpreting probability as the frequency of some phe-nomenon, Bayesian probability is a quantity that denotes a state of belief or knowledge. Beliefs are always subjective, and therefore all the probabilities in the Bayesian Probability Theory are conditional to the prior assumptions and experience of the learning system. Some disadvantages of this Bayesian Probability Theory are the difficulty in defining prior likehoods when information is not available and the fact that the hypotheses must be mutually exclusively.
2.3.2 Possibility Theory
Possibility theory was introduced by Zadeh [94] as an extension of
his theory of fuzzy sets and fuzzy logic. It differs from classical prob-ability theory by the use of a pair of dual set-functions i.e., possibility and necessity measures instead of only one. A possibility measure is a set function that returns the maximum of a possibility distribution over a subset indicating an event. A necessity measure is a set func-tion associated to a possibility measure through a relafunc-tion expressing that an event is more certain than another one. This feature makes it easier to capture partial ignorance.
Where the vagueness of information needs to be modeled, approaches based on possibility theory are more suitable than those based on probability theory. The high number of computations re-quired by this approach w.r.t. other ones and the complexity in gener-ating appropriate membership functions are the main disadvantages of this technique.
2.4 notions of dempster-shafer theory 13
2.3.3 Dempster-Shafer Theory
This theory, introduced by Dempster [27] and Shafer [79] also known
as Dempster-Shafer Theory (DST), embraces the intuitive idea of as-sociating a number between zero and one to model the degree of confidence for a proposition from partial (uncertain, imprecise) evi-dence.
DST has become one of the most used frameworks for handling uncertainty in various fields of applications. One of the major ad-vantages of DST over probability theory is to allow one to specify a degree of ignorance in a situation instead of being forced to sup-ply prior probabilities. Respect to probabilistic approaches that can reason only on singletons, DST allows not only to affect belief on ele-mentary hypotheses but also on composite ones. The latter illustrates the fact that DST manages also imprecision and inaccuracies.
Based on these facts, the decision-making capabilities implemented with DST are much more flexible than the probability theory. One disadvantage of this methodology is given by the exponentially large computation overhead that is required to implement the additional modeling flexibility.
2.4 n o t i o n s o f d e m p s t e r-shafer theory
In this Section, we introduce some concepts of DST that are relevant for the data fusion contributions presented in Chapter 4.
2.4.1 Basic Notions
In the DST, the set propositions that a node can evaluate is called Frame of Discernment (FoD) Ω ={ω1, ..., ωn} where the elements ωi
are assumed to be mutually exclusive.
Let Γ (Ω) , 2Ω = {γ1, ..., γ|Γ|} be the power set associated to it. In this framework, the interest is focused on quantifying the confidence of propositions of the form: "The true value of ω is in γ," with γ ∈ 2Ω.
Definition 1 (Basic definitions). A function m : 2Ω → [0, 1] is called
a basic belief assignment (BBA) m if Pγa∈2Ωm(γa) = 1with m(∅) = 0.
A BBA m can equivalently represented by its associated commonality q : 2Ω→ [0, 1] defined as:
q(γa) = X
γb⊇γa
m(γb), γa ∈ 2Ω (1)
Thus, for γa ∈ 2Ω, m(γa) is the part of confidence that supports
exactly γa i.e., the fact that the true value of ω is in γa but, due to
the lack of further information, does not support any strict subset of γa.
2.4.2 Evidence Combination
The limitation of the DST formulation regards the application of the Dempster combination rule [79], that produces counterintuitive
re-sults whenever there is a strong conflict among the sources to be combined [93]. A different approach is based on the Transferable
Be-lief Model (TBM) defined by Smets [80], which relies on the concept
of BBA but removes the assumption of m(∅) = 0. The removal of this assumption applies when the frame of reference is not exhaustive, so that it is reasonable to believe that another event, not modeled in the considered frame, will occur. This allows to define a more refined rule, the TBM conjunctive rule [28], that is more robust than the Dempster
combination rule, in the presence of conflicting evidence.
Definition 2 (TBM conjunctive rule ⊗). In the TBM, the combination
rule removes the normalization constant in the Dempster combination rule and therefore is defined as follows:
mij(γa) =
X
γb,γc;γb∩γc=γa
mi(γb)mj(γc), γa ∈ 2Ω (2)
The TBM conjunctive rule is associative and its use is appropri-ate when the conflict is relappropri-ated to poor reliability of some of the sources. However, such a rule, together with the Dempster combi-nation rule, relies on the distinctness assumption of the sources or, in other words, that the information sources be independent. This limitation can be avoided using a combination rule that observes the idempotence property. Denoeux [29] defines an associative,
commu-tative and idempotent operator, called cautious rule of combination, that is appropriate when all sources are considered reliable and does not require the assumption of independence.
Definition 3(weight function). Let m be a generic BBA, the weight
func-tion w : 2Ω\ Ω → R+ is defined as: w(γa) = Y γb⊇γa q(γb)(−1) |γb|−|γa|+1 , ∀γa∈ 2Ω\ Ω (3) = Q γb⊇γa,|γb|/∈2Nq(γb) Q γb⊇γa,|γb|∈2Nq(γb) , if|γa| ∈ 2N, Q γb⊇γa,|γb|∈2Nq(γb) Q γb⊇γa,|γb|/∈2Nq(γb) , otherwise,
Definition 4(Cautious rule of combination ?). Let mi and mj be two
generic BBAs in the TBM with weight functions wi and wj respectively.
Their combination using the cautious conjunctive rule is noted wi?j =
wi? wj. It is defined as the following weight function: wi
?j(γa) = wi(γa)? wj(γa) =min(wi(γa), wj(γa)), ∀ γa∈ 2 Ω\ Ω
2.4 notions of dempster-shafer theory 15
Table 1: An example of application of the cautious combination rule.
BBA ∅ a b Ω
w1(·) 1 0.5 0.3 w2(·) 0.8 0.7 0.2 w1?2(·)
0.8 0.5 0.2
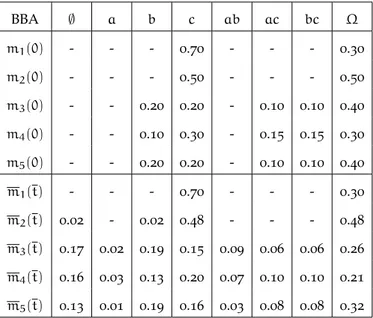
Table 2: An example of BBA m(·) and its relative discounting function mα(·) obtained for α = 0.2. BBA ∅ a b Ω m(·) - 0.3 0.4 0.3 w(·) 1.4 0.5 0.4 m0.2(·) - 0.06 0.08 0.86 w0.2(·) 1 0.93 0.91
The data aggregation algorithms presented in Chapter4work with the weight function w(·), which is obtained from masses using com-monality function q(·), derived from the initial set of BBAs.
Table 1 shows the function w1
?2(·) obtained by applying the
cau-tious combination rule among two weight functions w1and w2. From
now on, we denote with wij(·) the weight function obtained from
the application of the cautious combination rule among two generic weight functions wi(·) and wj(·).
2.4.3 Evidence Discounting
The evidence discounting concept was introduced by Shafer [79] for
accounting the reliability of a source information. Other works by Cherfaoui et al. [19, 20] applied the evidence discounting in a
net-work of agents according to the distance and the age of the received message before to combine it with a local knowledge.
Definition 5 (Discounting function). Let m be a generic BBA. The
rela-tive discounting function mα(γ
a)can be defined as follows:
mα(γa) = α m(γa), for γa⊂ Ω, 1 − α + α m(γa). for γa= Ω.
where α ∈ [0, 1] is called the discounting factor.
Table2shows an example of BBA m(·) and its relative discounting function mα(·) obtained for α = 0.2. The table also reports the weight
When the reliability α of an information source is known, it can be used to discount evidence before executing fusion operations.
2.4.4 Pignistic Probability
Pignistic probability [80], in decision theory, is a probability that can
be assigned to an option in order to make a decision although there might be lack of knowledge or uncertainty about the options and their actual likelihoods.
As it will be clear in Chapter4, we use pignistic probability to pro-vide an indication of the results obtained by our data aggregation algorithms. In particular, we use the pignistic transformation to trans-form a BBA m(·) into a probability measure Pm = Bet(m)as follows:
Pm(γa) = X ∅6=γb⊆Ω m(γb)|γa∩ γb| |γb| , γa∈ 2Ω (5) 2.5 d ata f u s i o n a r c h i t e c t u r e s
Depending on the architecture type, data fusion techniques can be classified as: (i) centralized, (ii) distributed, and (iii) decentralized [17].
In a centralized architecture, the fusion node is placed in the central processor that acquires the information from all of the input sources. Hence, the fusion processes are implemented in a central processor that uses the provided raw measurements from the different sources. In a distributed architecture, measurements from each source node are processed independently before the information is sent to the fu-sion node, which receives information from all the nodes. This type of architecture provides different variations that range from only one fusion node to several intermediate fusion nodes. Distributed algo-rithms usually share their state (e.g., position, velocity) with the asso-ciated probabilities to perform the fusion process.
In a decentralized architecture, each node combines its local infor-mation with the inforinfor-mation that is received from its peers to reach a common knowledge about an event of interest. Considering that the decentralized data fusion algorithms exchange information instead of states and probabilities, they have the advantage of easily separating old knowledge from new knowledge.
In the ideal case, the decentralized common knowledge should con-verge to the centralized solution, which is considered to be optimal. In general, this can be easily achieved when the states are static. How-ever, for dynamic states, additional constraints are required.
In Chapter4we present a decentralized data fusion algorithm and show results proving the convergence of the algorithm.
2.6 chapter summary 17
2.6 c h a p t e r s u m m a r y
In this Chapter, we gave an presented the data fusion problem and discussed the methodologies used to handle uncertain information in data fusion frameworks.
Then, we presented key notions of Dempster-Shafer Theory and motivated why this approach is suitable for handling uncertain data w.r.t. other methodologies.
Finally, we presented different data fusion architectures and pre-sented the main advantages of decentralized approaches w.r.t. dis-tributed approaches.
3
M O D E L I N G A N D S I M U L AT I O N O FI N T E R D E P E N D E N T S Y S T E M S
Modeling and simulation of interdependencies of critical infrastruc-tures has become a considerable field of research with the aim to im-prove infrastructure support planning, maintenance and emergency decision making. Ouyang [64] reviewed all the research in this field by
grouping the existing modeling and simulation approaches into six branches: (i) empirical; (ii) agent based; (iii) system dynamics based; (iv) economic based (v) network based, and (vi) other approaches.
In this Chapter, we recall the main principles and applications of the mentioned approaches and focus on two network based ap-proaches that have been used as tools for impact assessment pre-sented in Chapters5 and6. We also present an approach based on a distributed simulation platform that was adopted to implement emer-gency resources allocation problems presented in Chapter7.
3.1 ov e r v i e w
Interdependencies increase the vulnerability of the corresponding in-frastructures as they the propagation of failures from one infrastruc-ture to another with the consequence that the impact due to failures of infrastructure components and their severity can be exacerbated compared to failures confined to single infrastructures.
There different definitions of infrastructure interdependencies. Ri-naldi et al. [74] grouped them according to six dimensions:
• the type of interdependencies e.g., physical, cyber, and logical; • the infrastructure environment e.g., technical, business,
politi-cal, legal;
• the couplings among the infrastructures and their effects on their response behavior (loose or tight, inflexible or adaptive);
• the infrastructure characteristics: organizational, operational, tem-poral, spatial;
• the state of operation (normal, stressed, emergency, repair), the degree to which the infrastructures are coupled;
• the type of failure affecting the infrastructures: common-cause (when two or more infrastructures are affected simultaneously because of some common cause), cascading (when a failure in one infrastructure causes the failure of one or more compo-nent(s) in a second infrastructure), and escalating (when an ex-isting failure in one infrastructure exacerbates an independent failure in another infrastructure).
The latter definitions together with governmental reports containg recommendations and policies for the protection of critical in-frastructures, can be considered as conceptual and qualitative based approaches. In fact, both provide the definitions of infrastructures and their interdependencies and highlight the importance to protect critical infrastructures by proposing specific strategies to reach this objective.
However, these approaches do not provide any detailed modeling and simulation approach to analyze infrastructures behavior.
3.2 m o d e l i n g a n d s i m u l at i o n a p p r oa c h e s
3.2.1 Empirical Approaches
Empirical approaches consider infrastructure interdependencies based on historical disruptions data and expert experience. Contributions in this area try to identify frequent and significant failure patterns, model interdependency strength metrics and propose approaches based on risk analysis.
In order to identify frequent and significant failure patterns, special databases have been created from incidents reports such as the earth-quake in Japan and the hurricanes in Florida and some others. These data are usually extracted from media reports and official documents issued by infrastructure operators and can be used to define metrics to assess the consequences of a failure under extreme events. For ex-ample, McDaniels et al. [57] defined to indexes: (i) an impact index
given by the product of the failure duration and severity weights; and (ii) an extent index given by the product of the failure spatial extent and the number of people involved.
Zimmerman et al. [97] introduced several interdependency related
indicators to have information about: (i) the infrastructure compo-nents that frequently produce an impact for other infrastructures; (ii) the ratio of being a cause of failure to being impacted by failures and (iii) the number of people affected by a failure.
3.2 modeling and simulation approaches 21
Utne et al. [88] designed a cascade diagram showing how an
initi-ating event can be propagated across different infrastructures. Based on historical failure data and the knowledge of past incidents, they were able to assess the frequency of the initiating event, the probabil-ities of all involved events, the number of people being affected, and the duration of the subsequent events.
3.2.2 Agent Based Approaches
Agent bases approaches adopt a bottom-up view and consider the overall behavior of the system of interconnected infrastructures emerg-ing from a plethora of interactemerg-ing agents where each agent models one or more physical infrastructure components or services.
Aspen [13] is an agent based model used to model the economic
consequences of decisions and was used to assess the outcome of fed-eral monetary policies. RePast [22] is an agent framework for the
de-velopment of agent models allowing creation and execution of simu-lations. RePast contains libraries for implementing genetic algorithms and neural networks to design agents business rules. NetLogo [86] is
a multi-agent programming language addressing natural and social sciences phenomena where each agent allows to discover of emergent behaviors.
3.2.3 System Dynamics Based Approaches
System Dynamics (SD) based approaches adopt a top-down view to study interdependent systems. In this kind of approaches, there exist constructs that can be used inside each model to represent specific behavior and objects. In particular, feedback loops allow to model an effect between infrastructure components or services (e.g., the electri-cal power provided by a system feeding an hospital) whereas stocks can be used to model the level of a specific resource (e.g., the quantity of water in a tank). SD based approaches can model dynamic (i.e., in-ertial) states through the use of differential equations to describe the system level behaviors of the infrastructures.
CIP/DSS [78] is a Decision Support System based on SD that was
used to model the interdependencies existing among water, public health, emergency systems, telecom, energy and transportation in-frastructures. Its application allows to estimate the effect of possible disruptions occurring in such systems and to evaluate the effect of mitigations actions.
3.2.4 Economic Theory Based Approaches
Economic theory based approaches fall in two main areas: Input-Output (I-O) and Computable General Equilibrium (CGE) models.
I-O models [52] were defined by Leontief to represent the
techno-logical relationships of productions. Leontief proposed a linear model where the total production output of each industry sector is related to the production of other sectors according to specific weights. The re-sulting system provides a unique solution so that a final demand vec-tor can be found. Based on the Leontief I-O model, Haimes and Jiang proposed the Input-Output Inoperability (IIM) [45] model where they
consider the output of the Leontief model as the inability or inoperabil-ity of an infrastructure to perform specific services. Given a perturba-tion from one or more infrastructures or industries of the economy, the model can assess the consequences in terms of infrastructures or industry inoperability.
Computable General Equilibrium (CGE) can be considered as an extension of the I-O models. Based on actual economic data, they can estimate how an economy might react to changes in policy, technol-ogy or other external factors. Rose and Liao [75] developed a CGE
model to study the economic resilience of the city of Portland to an earthquake that produces disruptions on the water supply network. The model allowed to evaluate the effectiveness of resilience improve-ments actions such as prevent water pipeline replacement. A similar approach was used by Rose et al. [10] to analyze the economic effects
of a terrorist attack against the Los Angeles power grid. The economic estimate produced by the CGE based model demonstrated the bene-fit of mitigation actions aiming at improving the power grid such as onsite electricity generation and rescheduling of production.
3.2.5 Network Based Approaches
Network based approaches model infrastructure interdependencies by representing each infrastructure through its network topology where nodes mimic physical components and the relations among them. There exist two main approaches: (i) topology based methods where each network node exhibit two states (normal and failed) de-pending if the work properly or they affected by the occurrence of hazards or due to intra- or interdependencies phenomena and (ii) flow based methods that take focus on the services provided and distributed among the infrastructures.
Topology based methods allow to define various metrics to eval-uate the performance response of the infrastructures under differ-ent hazards. For instance, the performance of each network can be assessed by the connectivity loss, the number of normal or failed physical components, the duration of components unavailability, the number of customers served or affected [31, 67]. By quantifying the
interdependent effect, performance metrics can facilitate the assess-ment of mitigation actions such as adding bypass or hardening spe-cific components performance. In this regard, spespe-cific strategies can
3.3 network based tools 23
be compared by considering the response of networks with different topological structures in terms of component degree, component be-tweenness etc.
In Flow based methods, nodes and edges are entities able to pro-duce and distribute the services. Following this approach, Lee et al. [51] proposed a model where each node includes a supply or a
de-mand node or a transshipment node and each arc has a predefined capacity. It allows to mathematically define the interdependencies re-lations and to and evaluate specific restoration plans. Such a model was used to evaluate the operations of health care facilities in crisis scenarios. Rosato et al. [77] modeled an electrical network through
Direct Current (DC) power flow model and investigates the relation among the variation of Internet Quality of Service (QoS) and the vari-ation of the QoS of the electrical network using a data packet model to model the Internet communication layer. Based on this model, they develop a Decision Support System to test mitigation and healing strategies.
3.2.6 Other Approaches
Besides the contributions presented, there are some other approaches to model and simulate the interdependency phenomena among in-frastructures. These include the High Level Architecture (HLA) based method, the Petri-net (PN) based method and so on.
HLA is a general purpose architecture for distributed computer simulation systems. Eusgeld et al. [36] proposed a HLA-based
inter-dependency modeling architecture based on three layers: the lower level includes the physical models of single infrastructures, the mid-dle level manages the interactions among models of different infras-tructures and the high level represents the overall system model. This approach simulates the interdependencies through a distributed sim-ulation environment through communications among the three layers. Such an approach was used to simulate the interdependencies among a power network and its own SCADA system [35].
Based on the Petri-net (PN) based approach, Laprie et al. [50]
devel-oped a petri-net to represent the interdependencies between electric-ity and communication network whereas Sultana and Chen [82]
mod-eled the effect produced by floods on a set of interdependent infras-tructures which exhibit vulnerabilities specified according to fragility curves.
3.3 n e t w o r k b a s e d t o o l s
In this Section, we focus on two specific network based tools namely i2Sim and CISIA which were adopted for the impact assessment and the emergency resources allocation problems covered in Chapters5,6
and7. Both tools adopt a flow based approach to model the different resources exchanged among the entities.
i2Sim captures the behavior of infrastructures with matrices that describe how input resources interact to produce a specific kind of resource. Being built under Matlab/Simulink, i2Sim offers a usable graphical user interface to build the interdependency model. Com-pared to i2Sim, CISIA offers more capabilities to build the model such as the possibility to define different kinds of faults and out-put resources for each entity and the possibility to model uncertainty through fuzzy variables. However, CISIA lacks usability as the inter-dependency model should be entirely coded.
3.3.1 i2Sim
i2Sim [72] allows to model interdependencies among different
criti-cal infrastructures based on a mathematicriti-cal approach. Components defined in physical layer can interact with the decision-making layer through event forwarding approach.
Such a model is based on the following key components:
• Production cell: A production cell is an entity that performs a function. For example, a hospital is a cell that uses input tokens e.g., electricity, water, doctors, and produces an output token e.g., the number of patients treated. Each production cell is as-sociated a table, called Human Readable Table (HRT), that de-fines how quantities of input resources are combined to produce quantity of output resource.
• Channel: A channel is a means through which tokens flow from an entity (e.g., a cell) to another one.
• Token: Tokens are goods and services that are provided by some entity to another one that uses them. Such tokens can be electricity, water, medical supplies, etc.
• Control: These are Distributor and Aggregator units allowing to change their state based on the events received from the deci-sion making layer. Distributors divide a specific resource among different channels according to specific quantity ratios. Aggre-gators group resources coming from different channels into one channel.
• Storage: Storage cells are able to keep an initial amount of to-kens and release them based on an external signal.
Figure 2 shows an example of a production cell modeling a hos-pital together with its relative Human Readable Table. In the upper part, the hospital operates normally with an output called Resource
3.3 network based tools 25
Figure 2: An example of a production cell.
Mode (RM) of 4 patients healed per minute. In the lower part, the re-source amounts varied so that the operability of the hospital changes accordingly. In particular, to determine the new RM of the cell and the respective output every input value is located within the work-ing threshold on the correspondwork-ing column. Thus, electricity value of 12, 000 is associated to the third row, water with 46 to the second row and natural gas to the first row. Electricity is thus is the limiting factor and the cell output is thus 2 patients healed per minute.
The generation and flow of tokens among different entities is given by physical capability of each of the cells (e.g., power generation ca-pacity), their environmental constraint (e.g., damage of cells) or hu-man decision factor (e.g., redirection of water supply to a hospital rather than to a resident area). The operational characteristics of each of the cell are provided by a non-linear behavior that is encapsulated within a block through a production cell. This allows to model in-terdependencies between different infrastructures through non-linear relationships.
In order to establish benchmark cases, i2Sim was applied to study the interdependency phenomena inside the University of British Columbia (UBC) campus that has the properties of a small city [53]. Specific HRT were built based on the input-output relations
among the different networks with the support of infrastructure op-erators. The model allowed to measure the response of the UBC se-curity facilities w.r.t. disastrous events and to test resource allocation policies.
3.3.2 CISIA
CISIA [25] is a modeling framework that considers the overall system
of system as being composed of a set of entities produces various resources. In this framework, the different classes of interaction are represented through specific interconnection matrices so that make the overall system can be considered a multigraph allowing the im-plementation of complex topological and dynamical analyses.
Operative Level Internal Faults External causes Output Resources Output Failures Input Resources Input Failures CISIA entity
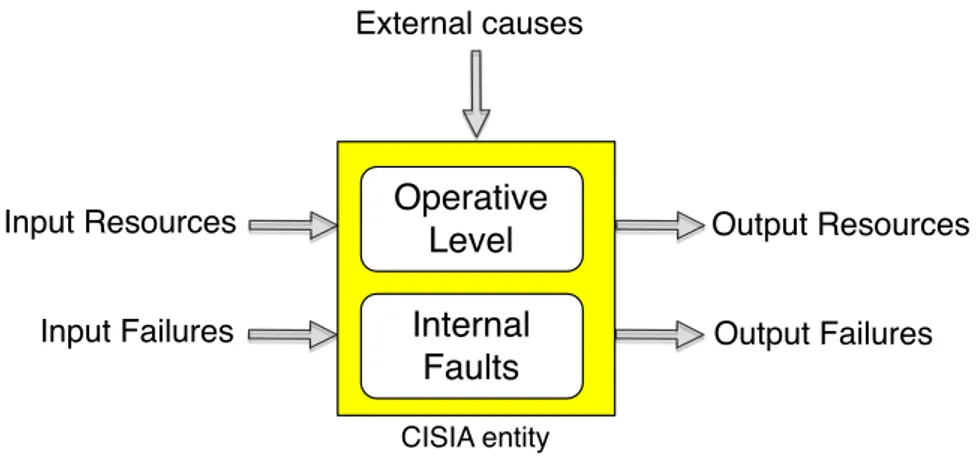
Figure 3: Input-Output representation of a CISIA entity.
Figure3, represents the components of an entity modeled in CISIA: • Entities can produce, transport or consume tangible or
intangi-ble resources (e.g., goods, services, policies); • Entities can be affected by faults;
• Faults can be propagated across entities;
• The capacity of each entity to distribute resources depends on its operative level and on the severity of the faults that affect the entity.
Each entity is associated an operative level that represents the state of the entity and can receive input resources and failures that in-fluence, together with the operative level, the capacity to generate resources and failures. External causes representing disruptive phe-nomena can also reduce the operability level of an entity.
To model the interaction of the agents that provide mutual require-ments or disseminate failure, three kinds of matrices have been de-vised: Operative Level Incidence Matrix, Requirement Incidence Ma-trix, and Fault Incidence Matrices. Fault incidence matrices allow the analysis of different types of failure propagation (e.g., physical, cy-ber). In order to represent the uncertainty of human operators inter-acting or representing entities in CISIA, all the variables describing the dynamics of entities are expressed as Triangular Fuzzy Numbers.
3.4 other approaches 27
CISIA adopts a discrete-time simulation approach where each sim-ulation step is driven by a clock routine that synchronizes the mes-sage exchange among entities. In order to model the different flow rate of resources, it is possible to model delays for the communica-tion channels connecting different entities. At the beginning of each simulation step, different instant cycles are performed, until the sys-tem reaches a steady state.
CISIA was effectively used in several research projects [3, 2] to
model the interdependencies power distribution grid, the relative SCADA system and the Telecom network allowing the communica-tion between the power grid and the SCADA infrastructures.
3.4 o t h e r a p p r oa c h e s
In Section 3.2.6, we presented a distributed simulation environment based on HLA to simulate interdependency phenomena.
In the following Section, we present a similar approach based on WebSimP, a platform allowing the simulation of the physical layer of single infrastructures.
3.4.1 WebSimP
In this Section, we present Web-Service based simulation platform for critical infrastructures (WebSimP) [11], a distributed environment for
the simulation of the behaviour of the electrical and telecommunica-tion domains.
WebSimP is integrated inside the Disaster Response Network En-abled Platform (DR-NEP) [55], a platform enabling decision making
for the validation of resource allocation policies.
As shown in Figure 4, DR-NEP is a web service platform that en-ables different simulators to communicate results to each other via a common enterprise service bus (ESB) and a database. A distributed computing architecture is employed to support decision making. Ev-ery simulator is connected to DR-NEP using an adapter that listens on the ESB for instructions about running simulations, gathers inputs from the other simulators and the database and pushes results from the simulators to the database. After the simulators and adapters are configured, a controller in the ESB pushes input to the simulators at predefined intervals. By linking the i2Sim interdependency simulator (presented in Section3.3.1) with a power grid and telecom simulator, DR-NEP enables the validation of resource allocation in the electrical domain.
WebSimP enables disaster support systems that are integrated with DR-NEP to be invoked separately through web service technologies. Such a service based platform offers many benefits over other types of
distributed computing architectures in terms of interoperability and ubiquity.
In particular, WebSimP allows the simulation of the electrical and telecommunications domains. Each simulation layer incorporates three software components: (i) a web service that receives operation re-quests to execute a particular simulation; (ii) a software adapter that implements the details of each requested operation and oversees com-mand execution in the simulator and output data post-processing; and (iii) a simulator (e.g., discrete/continuous, deterministic/stochas-tic) that executes a simulation model for a certain domain.
Figure 4: DR-NEP-WebSimP architecture.
Electrical Adapter. The electrical adapter is a software component
that is responsible for invoking operations in a pre-existing model. The possible operations are:
• Disconnection of electrical lines. Disconnection of a line may simulate a damage event on the power network.
• Reclosure of breakers. The operation simulates the closure of breakers that may be needed in case of distribution network reconfiguration.
• Load flow calculation. The operation executes a load flow calcu-lation on the power network including information on voltage, current and power.
3.5 chapter summary 29
• Power load shedding. The operation sets new values of active and reactive power that a certain load consumes.
The simulator determines the loads that the grid may support with-out damaging the infrastructure by considering physical limits on pa-rameters such as current and voltage. The PSS Sincal electrical simu-lator [5] is used; it supports network planning for power transmission
and distribution networks (e.g., load flow calculations, dynamics and network protection).
Telecommunication Adapter. The telecommunications adapter is
a software component that is in charge of invoking operations in a pre-existing telecommunications simulation model. The possible op-erations are: (i) network configuration (e.g., disconnecting telecom-munications and SCADA elements to simulate damage events); (ii) constraint computation (e.g., communications bandwidth); and (iii) electrical network reconfiguration time computation (e.g., response time required to send and execute specific commands). The telecom-munications simulation uses ns-2 [4], a discrete event simulator that
allows the modeling and simulation of communications protocols, routing and multicast protocols over wired and wireless networks.
As an application of the DR-NEP-WebSimP platform, in Chapter 7 we present how this platform can supports decision making in a scenario with interdependencies existing between a power grid and a supervisory control and data acquisition (SCADA) system.
3.5 c h a p t e r s u m m a r y
In this Chapter, we presented different approaches for the modeling and simulation of interdependencies among critical infrastructures.
Network based approaches based on networks theory consider crit-ical infrastructures as graphs where each node represents an infras-tructure. In these approaches, it is possible to introduce relationships and hierarchies between quantities arriving and leaving the nodes and to model physical states of the nodes.
The fact that many of the relationships between causes and con-sequences are non-linear is a limiting factor of many of the models considered. In this regard, agent based techniques or non-linear trans-fer function approaches are usually more flexible.
In addition to being able to represent relationships, physical states, and external events, dynamic (i.e., inertial) states can be modeled in System Dynamics (SD) approaches through the use of differential equations. Being based on discretized states where the current state is a function of past states, dynamic states can also be modeled with CISIA.
We focused on two network based approaches, namely i2Sim and CISIA, and a distributed simulation environment provided by Web-SimP. i2Sim and CISIA are flow based approaches where nodes and
edges are able to produce and distribute the services respectively. WebSimP adapters facilitate the exchange of information between the impact assessment module (based on i2Sim) and the infrastructure simulators, controls the execution of the simulators and calculates the constraints on the loads to insure that they are feasible.
Part II
4
D I S T R I B U T E D D ATA F U S I O N F O R S I T U AT I O NAWA R E N E S S
Data fusion provides means for combining pieces of information com-ing from different sources and sensors. This can help to enhance the security of critical infrastructure systems (e.g., power grids, water dis-tribution networks) by providing an improved situation awareness that is relevant for decision making.
Usually, critical infrastructure systems combine the information coming from their sensors individually, without sharing any informa-tion regarding the state of their funcinforma-tioning with other infrastructures. This originates mainly from the fact that the delivery of sensitive in-formation to third-parties infrastructures can be a security issue, and this has been investigated in several research initiatives [83,2].
How-ever, during real-time situations, there may be scenarios in which allowing a full exchange of information could be beneficial.
Foglietta et al. [41] applied an algorithm based on Gasparri et al.
[42] to share information among a set of critical infrastructures in
or-der to produce common knowledge and decrease the possibility of producing cascading effects. In this framework, the set of infrastruc-tures, or agents, constitute a connected network and combine their lo-cal information, regarding their functioning state, using a distributed algorithm. However, the approach requires the network topology to form a spanning tree.
Denoeux [30] proposed a distributed algorithm that implements
data fusion over an unknown topology. This algorithm computes the confidence of each node, by combining all the data coming from the neighbors, using a discounted cautious operator and without relying on a central node for the data collection. Convergence of the algorithm is proved in finite time for any initial configuration and for any un-known network topology. However, this algorithm requires the net-work topology to become stable, i.e., nodes and links are fixed and