RESEARCH
Pharmacokinetics of high-dose tigecycline
in critically ill patients with severe infections
Gennaro De Pascale
1,2*†, Lucia Lisi
3,4†, Gabriella Maria Pia Ciotti
3,4, Maria Sole Vallecoccia
1,2,
Salvatore Lucio Cutuli
1,2, Laura Cascarano
1,2, Camilla Gelormini
1,2, Giuseppe Bello
1,2, Luca Montini
1,2,
Simone Carelli
1,2, Valentina Di Gravio
1,2, Mario Tumbarello
5,6, Maurizio Sanguinetti
7,8, Pierluigi Navarra
3,4†and Massimo Antonelli
1,2†Abstract
Background: In critically ill patients, the use of high tigecycline dosages (HD TGC) (200 mg/day) has been recently increasing but few pharmacokinetic/pharmacodynamic (PK/PD) data are available. We designed a prospective obser-vational study to describe the pharmacokinetic/pharmacodynamic (PK/PD) profile of HD TGC in a cohort of critically ill patients with severe infections.
Results: This was a single centre, prospective, observational study that was conducted in the 20-bed mixed ICU of a 1500-bed teaching hospital in Rome, Italy. In all patients admitted to the ICU between 2015 and 2018, who received TGC (200 mg loading dose, then 100 mg q12) for the treatment of documented infections, serial blood samples were collected to measure steady-state TGC concentrations. Moreover, epithelial lining fluid (ELF) concentrations were determined in patients with nosocomial pneumonia. Amongst the 32 non-obese patients included, 11 had a treatment failure, whilst the other 21 subjects successfully eradicated the infection. There were no between-group differences in terms of demographic aspects and main comorbidities. In nosocomial pneumonia, for a target AUC 0-24/ MIC of 4.5, 75% of the patients would be successfully treated in presence of 0.5 mcg/mL MIC value and all the patients obtained the PK target with MIC ≤ 0.12 mcg/mL. In intra-abdominal infections (IAI), for a target AUC 0-24/MIC of 6.96, at least 50% of the patients would be adequately treated against bacteria with MIC ≤ 0.5 mcg/mL. Finally, in skin and soft-tissue infections (SSTI), for a target AUC 0-24/MIC of 17.9 only 25% of the patients obtained the PK target at MIC values of 0.5 mcg/mL and less than 10% were adequately treated against germs with MIC value ≥ 1 mcg/mL. HD TGC showed a relevant pulmonary penetration with a median and IQR ELF/plasma ratio (%) of 152.9 [73.5–386.8].
Conclusions: The use of HD TGC is associated with satisfactory plasmatic and pulmonary concentrations for the treatment of severe infections due to fully susceptible bacteria (MIC < 0.5 mcg/mL). Even higher dosages and combi-nation strategies may be suggested in presence of difficult to treat pathogens, especially in case of SSTI and IAI. Keywords: Tigecycline, High dose, Pharmacokinetics, Epithelial lining fluid, Critically ill patients, Severe infections
© The Author(s) 2020. This article is licensed under a Creative Commons Attribution 4.0 International License, which permits use, sharing, adaptation, distribution and reproduction in any medium or format, as long as you give appropriate credit to the original author(s) and the source, provide a link to the Creative Commons licence, and indicate if changes were made. The images or other third party material in this article are included in the article’s Creative Commons licence, unless indicated otherwise in a credit line to the material. If material is not included in the article’s Creative Commons licence and your intended use is not permitted by statutory regulation or exceeds the permitted use, you will need to obtain permission directly from the copyright holder. To view a copy of this licence, visit http://creat iveco mmons .org/licen ses/by/4.0/.
Background
Tigecycline (TGC), the first antimicrobial of glycilcycline class, has shown an expanded-spectrum activity against gram-positive, gram-negative, aerobic, anaerobic and atypical bacterial species, including antibiotic-resist-ant strains [1]. Indeed, it has been demonstrated that methicillin-resistant Staphylococcus aureus (MRSA), penicillin-resistant Streptococcus pneumoniae, vanco-mycin-resistant enterococci (VRE), extended-spectrum
Open Access
*Correspondence: [email protected]
†Gennaro De Pascale and Lucia Lisi contributed equally to this work †Pierluigi Navarra and Massimo Antonelli contributed equally to this work 1 Dipartimento di Scienza dell’Emergenza, Anestesiologiche e della
Rianimazione - UOC di Anestesia, Rianimazione, Terapia Intensiva e Tossicologia Clinica, Fondazione Policlinico Universitario A. Gemelli IRCCS-Università Cattolica del Sacro Cuore, Largo A. Gemelli 8, 00168 Rome, Italy Full list of author information is available at the end of the article
β-lactamase (ESBL)/carbapenem-producing
Enterobacte-rales and extensively drug-resistant (XDR) Acinetobacter baumannii are susceptible to TGC [2–4].
TGC is currently approved by the U.S. Food and Drug Administration (FDA) for complicated skin and skin-structure infections, complicated intra-abdominal infec-tions, community-acquired pneumonia with an initial dose of 100 mg, followed by 50 mg every 12 h. Neverthe-less, due to an increased risk of death compared to other antimicrobials, its use has recently been restricted in sit-uations when alternative treatments are not suitable ([5],
https ://www.fda.gov/drugs /drug-safet y-and-avail abili ty/ fda-drug-safet ycomm unica tion-fda-warns -incre ased-risk-death -iv-antib acter ial-tygac il-tigec yclin e).
However, the alarming increase in antimicrobial resist-ance amongst the nosocomial pathogens is leading the clinicians to consider the use of TGC as an important therapy in the management of difficult to treat infec-tion, particularly in critically ill patients. This is also sup-ported by recent studies suggesting that previous failures of TGC therapy in critically ill patients were likely due to a drug underdosage [6, 7] and that standard doses provide serum concentrations that are below the min-imum-inhibitory concentrations (MICs) of most MDR pathogens. Moreover, it has been reported an increased effectiveness of high-dose TGC (HD TGC) regimen to improve the clinical outcome, without safety issues [8–11].
Therefore, we designed this prospective observational study to describe the pharmacokinetic/pharmacody-namic (PK/PD) profile of HD TGC in a cohort of criti-cally ill patients with severe infections.
Methods
Patients and study design
This was a prospective, observational study that was per-formed between 2015 and 2018 in the 20-bed ICU of a 1500-bed teaching hospital in Rome, Italy. The proto-col was approved by the Catholic University’s Ethical Committee (approval number Prot.sf 8431/13). Written informed consent was obtained from the patients’ legally authorized representative. Critically ill adult patients were considered eligible for the study when the attend-ing physician prescribed TGC as empirical treatment (within 12 h from microbiological sampling) of a pos-sible MDR infection, or as targeted therapy based on definitive results, in the absence of any exclusion crite-ria: known TGC allergy, creatinine clearance less than 40 mL/min (calculated according to the Cocrockft–Gault formula) apart from those ones who were anuric and on continuous renal replacement therapy (CRRT), hyperbili-rubinemia (bilirubin level higher than 3 mg/dL), severe hepatic failure (Child–Pugh C), little chance of survival
as defined by the Simplified Acute Physiology 2 (SAPS 2) score > 80, concomitant treatment with other drugs that can potentially interfere with TGC (i.e., rifampin and cyclosporine). Patient without microbiologically con-firmed infection were not excluded. TGC was adminis-tered intravenously at loading dose (LD) of 200 mg over 30-min, followed by 100 mg over 30-min bid. On day 4 after the commencement of the HD TGC, at steady state, pharmacokinetic analyses of the study group were per-formed. Clinical and demographic data were recorded upon enrolment. Safety and adverse events were deter-mined through the observed biochemical abnormalities, documented according to the Department of Health and Human Services–Common Terminology Criteria for Adverse Events (DHHS-CTCAE v.3.0) classification [12].
Clinical cure was defined as the complete resolution of all signs and symptoms of the infection by the end of TGC therapy. In case of ventilator-associated pneumonia (VAP), improvement or lack of progression of all abnor-malities on chest radiographs was also required [13]. Otherwise, the outcome was classified as treatment fail-ure. Clinical outcomes were independently evaluated by two physicians (GDP, MSV) when judgments were dis-cordant (two cases), the reviewers reassessed the data and reached a consensus decision. The quality of source control was considered adequate when it included drain-age of infected fluid collections, debridement of infected solid tissue, removal of devices/foreign bodies, and defin-itive measures to correct anatomic derangements result-ing in on-goresult-ing microbial contamination and to restore optimal function within 48 h after diagnosis [14].
Sample collection
Although TGC concentration–time profiles are stable dose just on day 3, blood samples were collected after the seventh dose (on day 4 of treatment) at T0 (imme-diately before the initiation of the infusion) and 1, 1.5, 2, 4, 6, 8, 10, and 12 after the start of infusion. According to patients’ respiratory status, one mini-bronchoalveo-lar lavage (BAL) (40 mL sterile 0.9% saline solution was blindly instilled through a telescopic catheter and imme-diately aspirated in a trap) was performed on day 4, in case of suspected HAP.
Preparation of stock solution and calibration standard Stock solution of TGC and the internal standard (IS), propranolol hydrochloride, were prepared by dissolving accurately weighed amounts of each compound in MeOH to obtain a final concentration of 0.1 mcg/mL. Calibra-tion standards were prepared by diluting stock soluCalibra-tions of TGC in drug-free human plasma to yield TGC concen-trations of 5000, 2500, 1250, 625, 312.5, 156.25, 78.125, 39.1, 19.5 and 9.76 ng/mL.
Sample preparation
Tigecycline liquid/liquid extraction from plasma samples (see Additional file 1).
Tigecycline solid-phase extraction from BAL samples (see Additional file 1).
Chromatographic and Mass-Spectrometric Conditions (see Additional file 1)
Urea assay
Determination of urea in plasma and BAL samples
Urea levels were detected by the QuantiChrom Urea Assay kit (BIOassay System, Hayward, CA, USA), which was used according to the manufacturer’s instructions. Pharmacokinetic/pharmacodynamics analysis
A one-compartment model with first-order elimination determined pharmacokinetic parameters. The 0–12 h area under the time–concentration curve (AUC 0–12) was determined by the linear trapezoidal rule. TGC AUC
0–24 was calculated as AUC 0–12 X 2. TGC maximum
and minimum concentrations (Cmax, Cmin) were directly obtained from observed peak and trough concentrations. Epithelial lining fluid (ELF) tigecycline (TGC ELF) concen-tration was calculated from BAL concenconcen-tration (TGC BAL) using urea as dilution marker: TGC ELF = TGC BAL X urea dilution index (plasma urea concentration/BAL urea concentration) [15]. In all patients, distribution volume (Vd), drug clearance (CL), and elimination half-life (t1/2) were calculated after a single 100-mg intravenous dose at steady state.
According to previous literature, based on early ani-mal efficacy studies using a classification and regression tree approach, area under the concentration curve (AUC) 0–24/MIC ratio ≥ 4.5, 6.96 and 17.9 were used as PD tar-gets for VAP, intra-abdominal infections (IAI) and skin– soft-tissue infections (SSTI), respectively [6]. Graphing of data was undertaken using Prism version 6.0 for Win-dows (graphPad Software, San Diego, CA).
Microbiological analysis
Isolates were identified by matrix-assisted laser desorp-tion ionizadesorp-tion-time-of-flight (MALDI-TOF) mass spec-trometry (MALDI Biotyper, Bruker Daltonics GmbH, Leipzig, Germany). The in vitro susceptibility of the iso-lates was assessed with the Vitek 2 system (bioMérieux, Marcy l’Etoile, France) or with panels manufactured by MERLIN Diagnostica GmbH (Bornheim, Germany). Results were interpreted in accordance with the Euro-pean Committee on Antimicrobial Susceptibility Testing (EUCAST) clinical breakpoints. The presence of carbap-enemase genes of blaKPC, blaNDM, blaVIM, blaOXA-48, blaOXA-23, and blaOXA-58 types was determined by
polymerase chain reaction and DNA sequencing analysis using previously described protocols (Endemiani, Poirel, Woodford) [16].
Statistical analysis
All statistical analyses were performed using MedCalc software, version 12.2.1 (MedCalc®, MariaKerke, Bel-gium). Kolmogorov–Smirnov test was used to value the variables distribution. The data with a non-Normal dis-tribution were assessed with Mann–Whitney test and the median and selected centiles’ (25th–75th) value were given (interquartile range, IQR). The data with a Normal distribution were assessed with Student’s test. Categori-cal variables are presented as proportions and were ana-lysed with the use of the Chi square test or Fisher’s exact test, as appropriate. A p value < 0.05 was considered sig-nificant. Due to the PK/PD design of the study, a sample size was not calculated, foreseeing the recruitment of at least 30 patients during the predefined study period (July 2015–July 2017).
Results
Patients’ characteristics
The clinical details of the 32 non-obese patients included in the study are listed in Table 1. Albumin levels were quite low with an overall positive fluid balance at enrol-ment. Median SAPS II score was 53.5 and the most relevant comorbidities were cardiovascular diseases, chronic obstructive pulmonary disease, chronic renal failure and neoplasm (Table 1). Median SOFA score was 7 and many patients were in septic shock or presented with acute respiratory failure (ARF) and acute kidney injury (AKI) requiring mechanical ventilation (MV) and CRRT, respectively. More than half of the patients had VAP, followed by intra-abdominal infections and skin and soft-tissue infections: in the microbiological case-mix Gram-negative bacteria were mostly represented (90.6%). Median duration of TGC therapy was 12 days and it was started empirically in half of the cases. The use of vasopressors and MV during TGC therapy was high and 30-day mortality rate was 28.1%. Eleven patients had a treatment failure, whilst the other 21 successfully eradicated the infection. There were no between-group differences in terms of demographic aspects and main comorbidities. Further the two groups were similar in terms of presenting features and outcomes with the exception of VAP rate which was higher in the treatment success group (76.2% vs. 27.3%, p = 0.02) and a trend to a higher percentage of skin and soft-tissue infections and source control amongst patients who failed TGC treat-ment (p = 0.06 and p = 0.07, respectively).
Pharmacokinetic results
A one-compartment model with first-order disposi-tion processes adequately described the concentra-tion–time curve, although significant interindividual variability was observed. Vd, Cl and t1/2 were 438.6 L, 42.1 L/h and 7.2 h, respectively. Median and IQR val-ues of Cmax and Cmin were 0.34 [0.15–1.03] mcg/mL and 0.09 [0.05–0.26] mcg/mL (Table 1). Figure 1 shows the
mean ± SD time–concentration profile at different time points of plasma tigecycline concentrations, compared with most frequently observed MIC values (0.12–0.25–
0.5 mcg/mL). AUC 0-24 and IQR were calculated for
each patient and the percentage of target attainment was also computed for nosocomial pneumonia (NP) (AUC 0-24/MIC breakpoint of 4.5), complicated intra-abdominal infections (cIAI) (AUC 0-24/MIC breakpoint Table 1 Baseline patients’ characteristics
Data are presented as median [IQR], unless otherwise indicated
Pts patients, VAP ventilator-associated pneumonia; TGC tigecycline, SAPS II Simplified Acute Physiology Score, COPD chronic obstructive pulmonary disease, LOS length of stay, ICU Intensive Care Unit, MV mechanical ventilation, SOFA Sequential Organ Failure Assessment, AKI acute kidney injury; CRRT continuous renal replacement therapy, ARF acute respiratory failure, MV mechanical ventilation; kg kilogram, IQR interquartile range
* Evaluated at TGC starting day
** i.e. Staphylococcus aureus (n = 6), enterococci (n = 3), streptococcus spp. (n = 2)
*** i.e. Acinetobacter baumannii (n = 10), carbapenem-resistant Klebsiella pneumonia (n = 6), Escherichia coli (n = 6), Proteus spp. (n = 5), Bacteroides spp. (n = 2)
# Ten intra-abdominal infections and three skin and soft-tissue infections
Total cohort (n = 32) Treatment failure (n = 11) Treatment success (n = 21) p value
Demographics and comorbidities
Age, years 56 [46–68.5] 55 [49.75–71] 56 [45–68.25] 0.75 Male sex, N (%) 17 (53.1) 5 (45.5) 12 (57.1) 0.8 Weight, (kg) 76.5 [60–90] 75 [67.8–80] 90 [60–100] 0.45 Albumin, (g/dL)* 23 [21.5–26.5] 22 [19.25–26.25] 24 [22.75–26.5] 0.17 Fluid balance, (mL)* +762.9 [−393 to +3703.5] +3332 [−1124.2 to + 4112] 616.3 [−358.5 to + 2592.7] 0.5 SAPS II score 53.5 [44.5–67.5] 61 [44.7–66.5] 52 [43.5–67.5] 0.92 Cardiovascular diseases, N (%) 6 (18.75) 3 (27.3) 3 (14.3) 0.39 COPD, N (%) 5 (15.6) 1 (9.1) 4 (19.1) 0.64
Chronic renal failure, N (%) 7 (21.9) 3 (27.3) 4 (19.1) 0.4
Diabetes, N (%) 3 (9.4) 0 3 (14.3) 0.53
Neoplasm, N (%) 7 (21.9) 4 (36.4) 3 (14.3) 0.2
Presenting features and outcomes
ICU LOS before TGC, (days) 7.5 [2.5–16] 5 [0.5–11.25] 12 [3.75–18.25] 0.13 MV duration before TGC (days) 8 [3–12] 5 [0.5–11.25] 8 [3.75–14.75] 0.19 Vasopressors duration before TGC (days) 4.5 [0–8.5] 5 [0.25–8.25] 4 [0–8.25] 0.89
SOFA score* 7 [4–10] 8 [4.75–12] 6 [4–9] 0.2
Septic shock, N (%)* 18 (56.3) 7 (63.6) 11 (52.4) 0.71
ARF requiring MV, N (%)* 28 (87.5) 10 (90.9) 18 (85.7) 1
AKI requiring CRRT, N (%)* 11 (34.4) 3 (27.3) 8 (38.1) 0.7
Creatinine clearance (ml/min)* 97.3 [32–150.8] 63.2 [32–155] 104 [30–142] 0.85
VAP, N (%) 19 (59.4) 3 (27.3) 16 (76.2) 0.02 Non-pulmonary infections, N (%)# 13 (40.6) 8 (72.7) 5 (23.8) 0.02 Secondary bacteraemia, N (%) 13 (40.6) 4 (36.4) 9 (42.9) 1 Source control, N (%) 13 (40.6) 7 (63.6) 6 (28.6) 0.07 TGC therapy duration,(days) 12 [9–15] 12 [10–15] 11 [8–17] 0.69 TGC empirical therapy, N (%) 17 (53.1) 7 (63.6) 10 (47.6) 0.47 Gram-positive bacteria N (%)** 11 (34.4) 4 (36.4) 7 (33.3) 1 Gram-negative bacteria N (%)*** 29 (90.6) 10 (90.9) 19 (90.5) 1
ICU LOS after TGC, (days) 15 [10.5–27] 14.5 [12–19] 16 [10–31.4] 0.42
MV duration after TGC (days) 10 [5–15] 14 [9.75–15.75] 8 [2–13.5] 0.04 Vasopressors duration after TGC (days) 3 [1.5–13] 8 [2.25–13] 3 [0–10.75] 0.12
of 6.96) and complicated skin and soft-tissue infections (cSSTI) (AUC 0-24/MIC breakpoint of 17.9). Consider-ing a target AUC 0-24/MIC of 4.5, 75% of the patients would be successfully treated in presence of 0.5 mcg/ mL MIC value and all the patients obtained the PK target with MIC ≤ 0.12 mcg/mL. Considering a target AUC 0-24/MIC of 6.96, at least 50% of the patients would be adequately treated against bugs with MIC ≤ 0.5 mcg/ mL, whilst only 15.6% obtained the PK target with MIC of 2 mcg/mL. Finally, with a target AUC 0-24/MIC of 17.9 only 25% of the patients obtained the PK target at MIC values of 0.5 mcg/mL and less than 10% were ade-quately treated against germs with MIC value ≥ 1 mcg/ mL (Fig. 2).
Pulmonary concentrations
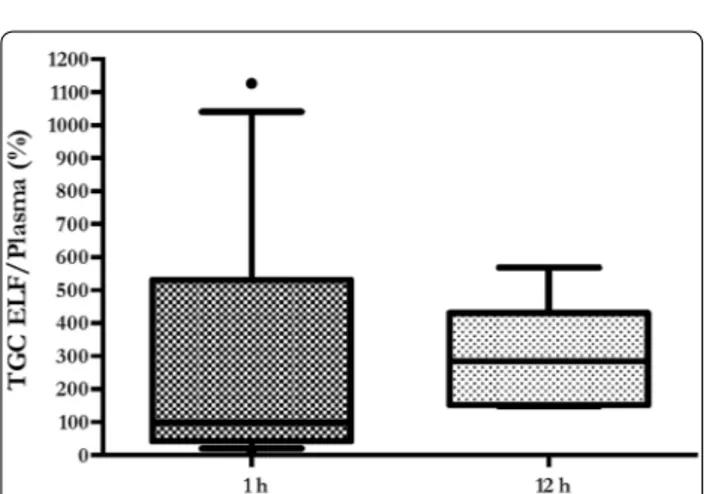
Tigecycline pulmonary concentrations were measured in 12 (1 h) and 7 (12 h) patients, respectively. Main rea-sons to exclude samples were presence of blood and excessive dilution, whilst five patients did not undergo BAL due to severe respiratory failure. Median and IQR ELF Cmax was 0.42 [0.15–1.2] and ELF Cmin was 0.32 [0.17–0.43]; median and IQR ELF/plasma ratio (%) was 152.9 [73.5–386.8] (Table 2). Mean ± SE ELF concentrations were similar at 1 h and 12 h (0.78 ± 0.2 mcg/mL vs. 0.36 ± 0.1 mcg/mL; p = 0.19) (Fig. 3). Con-versely, no significant differences were found com-paring mean ± SE ELF/plasma ratio at 1 h and 12 h (281 ± 107.6 vs. 298.3 ± 60.7; p = 0.9) (Fig. 4).
Fig. 1 Total tigecycline plasma concentration (mean ± SE) versus time of administration 0.12 0.25 0.5 1 1.5 2 3 4 0 10 20 30 40 50 60 70 80 90 100
Minimum Inhibitory Concentration (mcg/mL)
Pr ob ab ilit yo fT ar ge tA ttai nm en t (AUC 0-24 /M IC ) AUC/MIC (HAP) AUC/MIC (IAI) AUC/MIC (SSTI)
Fig. 2 Probability of target attainment of pharmacodynamics indices in plasma, according to infection types and MIC. HAP: hospital-acquired pneumonia; IAI: intra-abdominal infection; SSTI: skin and soft-tissue infection; AUC: area under the curve; MIC: minimum inhibitory concentration (mcg/mL)
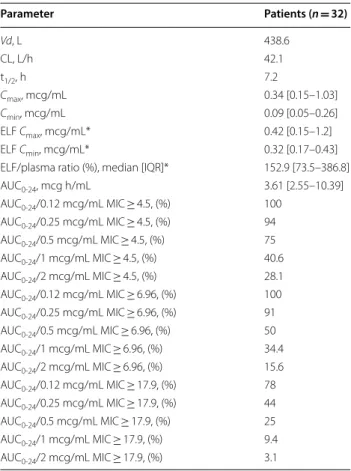
Table 2 Steady-state serum and alveolar TGC PK
parameters in the 32 enrolled patients
Data are expressed as median [IQR] and N (%)
TGC tigecycline; PK pharmacokinetic; Vd volume of drug distribution, IQR interquartile range; CL drug clearance; t1/2 elimination half-life; Cmax peak
plasmatic concentration; Cmin trough plasmatic concentration; ELF epithelial
lining fluid; MIC minimum inhibitory concentration; AUC total drug area under the time–concentration curve
*TGC ELF concentrations were measured in 12 (1 h) and 7 (12 h) samples,
respectively Parameter Patients (n = 32) Vd, L 438.6 CL, L/h 42.1 t1/2, h 7.2 Cmax, mcg/mL 0.34 [0.15–1.03] Cmin, mcg/mL 0.09 [0.05–0.26] ELF Cmax, mcg/mL* 0.42 [0.15–1.2] ELF Cmin, mcg/mL* 0.32 [0.17–0.43] ELF/plasma ratio (%), median [IQR]* 152.9 [73.5–386.8] AUC 0-24, mcg h/mL 3.61 [2.55–10.39] AUC 0-24/0.12 mcg/mL MIC ≥ 4.5, (%) 100 AUC 0-24/0.25 mcg/mL MIC ≥ 4.5, (%) 94 AUC 0-24/0.5 mcg/mL MIC ≥ 4.5, (%) 75 AUC 0-24/1 mcg/mL MIC ≥ 4.5, (%) 40.6 AUC 0-24/2 mcg/mL MIC ≥ 4.5, (%) 28.1 AUC 0-24/0.12 mcg/mL MIC ≥ 6.96, (%) 100 AUC 0-24/0.25 mcg/mL MIC ≥ 6.96, (%) 91 AUC 0-24/0.5 mcg/mL MIC ≥ 6.96, (%) 50 AUC 0-24/1 mcg/mL MIC ≥ 6.96, (%) 34.4 AUC 0-24/2 mcg/mL MIC ≥ 6.96, (%) 15.6 AUC 0-24/0.12 mcg/mL MIC ≥ 17.9, (%) 78 AUC 0-24/0.25 mcg/mL MIC ≥ 17.9, (%) 44 AUC 0-24/0.5 mcg/mL MIC ≥ 17.9, (%) 25 AUC 0-24/1 mcg/mL MIC ≥ 17.9, (%) 9.4 AUC 0-24/2 mcg/mL MIC ≥ 17.9, (%) 3.1
Discussion
Our study shows an HD TGC (200 mg LD, then 100 mg q12) time–curve concentration with mean peak and trough levels of 0.65 mcg/mL and 0.25 mcg/mL, respec-tively (Fig. 1). AUC 0-24/MIC targets for nosocomial pneumonia (≥ 4.5) and complicated intra-abdominal infections (≥ 6.96) were obtained in the majority of cases in presence of bacteria with MIC values ≤ 0.25. Other-wise, lower MIC values (≤ 0.12 mcg/mL) were required to have satisfactory AUC 0-24/MIC results (78%), whilst treating a skin/soft-tissue infection (Fig. 2, Table 2). Similar to plasma 1 h and 12 h, pulmonary concentra-tions (0.78 mcg/mL and 0.36 mcg/mL, respectively) were
observed with a good median ELF/plasma ratio of 152.9% (Table 2, Fig. 3). This high-dose regimen was associated with a 65.6% of treatment success rate in a normal weight population including 60% of VAP, 31% of cIAI and 9% of SSTI. TGC was used in half of the cases as targeted regi-men for a median duration of 12 days. The rates of septic shock, acute respiratory failure requiring MV and acute kidney injury requiring CRRT were also high, with a mortality rate of 28.1% (Table 1).
The pharmacokinetics/pharmacodynamics and tissue penetration of tigecycline have been extensively stud-ied in various in vitro and human models [17]. How-ever, these studies were generally carried out in healthy volunteers, and few pharmacokinetic data concerning infected patients are available, which may present patho-physiologic conditions influencing the pharmacokinetic profile of this molecule. In addition, the majority of avail-able data in infected patients derive from studies where normal doses are used, although for severe nosocomial infections a double-dose regimen is warranted [18, 19].
Recently, standard-dose TGC pharmacokinetics in ten critically ill patients has been studied [6]. The authors observed that a larger body mass index was associated with increased TGC Cl, but standard doses produced sat-isfactory plasmatic levels for VAP and cIAI treatment due to Enterobacter cloacae, Esherichia coli, Klebsiella
pneu-moniae and methicillin-resistant Staphylococcus aureus.
However, higher dosages were required for the treatment of SSTI, especially in obese patients.
Eleven out of 32 patients in our cohort were receiving CRRT whilst being treated with high-dose TGC. Interest-ingly, in a recent paper, Broeker and cow [20] described the PK/PD of standard-dose TGC in eleven patients on continuous veno-venous haemodialysis (CVVHD) or haemodiafiltration (CVVHDF). TGC dialysability, as expressed by saturation coefficients (0.79 and 0.9 for CVVHD and CVVHDF, respectively), was very high, but the contribution of CRRT TGC clearance was mini-mal (about 2 L/h), compared with the total body clear-ance (18.3 L/h). Peak drug concentrations were below 1 mcg/mL and trough levels about 0.2 mcg/mL. The authors, considering the AUC0-24/MIC referral value for cIAI (6.96), observed that such target was accomplished in 88% of the case if MIC was ≤ 0.5. This result is quite different from our findings where lower MIC values are required to get the optimal PK/PD target.
Indeed, our results are in line with current available data, underlying the plus-value of increased dosages whilst treating critically ill patients especially with severe cIAI and SSTI. In addition, there is a high need of PK/PD data on TGC administered at higher than approved dos-ages, in light of the wide spread of increased resistance to TGC amongst Gram-negative rods and Acinetobacter
Fig. 3 Boxplot showing tigecycline ELF concentrations. Boxes represent interquartile ranges (lower border 25th percentile; upper border 75th percentile), and the horizontal lines within the boxes indicate the medians (50th percentile). Whiskers indicate minimum and maximum values
Fig. 4 Boxplot showing tigecycline ELF to plasma ratio (%). Boxes represent interquartile ranges (lower border 25th percentile; upper border 75th percentile), and the horizontal lines within the boxes indicate the medians (50th percentile). Whiskers indicate minimum and maximum values
spp. The first investigation on PK/PD of HD TGC derives from Ramirez et al. who conducted a randomized phase 2 trial to evaluate the clinical efficacy of two high-dos-age regimen of TGC (75 mg bid and 100 mg bid) versus imipenem–cilastatin (1 g every 8 h) for the treatment of nosocomial pneumonia [8]. In the clinically evalu-able population, clinical cure with TGC 100 mg bid was numerically higher than with 75 bid and imipenem– cilastatin (1 g every 8 h) (85% vs. 69.6% vs. 75%). Mean peak TGC concentration was about 1 mcg/mL, declin-ing to less than 0.5 mcg/mL after 8 h, observdeclin-ing a safety profile comparable to that one known for the approved those. The only other study investigating the PK/PD of HD TGC profile was conducted by Borsuk-De Moor et al. in 37 ICU patients with severe infections [21]. The time–concentration curve was similar to our data, dis-playing a peak concentration about 1 mcg/mL and 12 h level below 0.5 mcg/mL. Interestingly, the authors devel-oped a model which showed that no individual covariates may influence target concentrations, advising to modify TGC daily dosage according to pathogens type, suscepti-bility pattern and PK targets.
Tissue concentrations of antibiotics at the target site contribute to therapeutic effects: using plasma concen-trations may frequently overestimate the target site con-centrations and therefore clinical efficacy. This is the first study to report steady-state ELF percentage penetration of TGC administered 100 mg q12 after 200 mg LD. Con-sidering the AUC 0-24/MIC target of 4.96, our data show satisfactory pulmonary concentrations with potential clinical success in 100%–94% to 75%–41% of the cases treating bacteria with MIC of 0.12–0.25 mcg/mL to 0.5–1 mcg/mL, respectively (Fig. 2). These data confirm the results observed in healthy subjects by Conte et al., where the Cmax/MIC90, AUC/MIC90 ratios, T > MIC90 and extended serum and intrapulmonary half-lives following the standard regimen are favourable for the treatment of TGC-susceptible pulmonary infections [22]. Penetration ratio may be even higher when in presence of infected lungs. Crandon et al. demonstrated in infected and non-infected mice lungs that the baseline penetration ratio of 8.1 is incremented to 23.3 in case of Acinetobacter pneu-monia [23]. Conversely, the majority of lung penetra-tion occurs in alveolar cells, than in ELF, as suggested by Welte et al. in three cases of MDR lung infections [24]. Finally in a recent study on 58 healthy subjects treated with standard TGC dose, the ratio of ELF and AUC to total plasma concentration of tigecycline was 1.71 and 20.8, respectively [25].
Our study has several limitations. First, we adopted a single high-dose of tigecycline and we do not know if even higher dosages may result in better PK/PD
profiles. Second, we measured only pulmonary tissue concentration trough ELF collection and we can only postulate the real tissue/plasma ratio for cIAI and SSTI which, additionally, accounted only for less than 50% of the cases. Third, our analysis focused on total TGC
concentration rather unbound AUC 0-24, due to the
lack of clinical reliable breakpoint of fAUC 0-24/MIC90. Fourth, we did not provide real MIC values and we only simulated a wide range (0.12–2 mcg/mL) to compute AUC/MIC ratios and PTA percentages. Fifth, we did not sampled BAL from most hypoxemic/most severely patients, introducing a bias in the final results. Finally, the sample size may be likely responsible of an under-estimated interindividual variability in the observed PK/PD profile.
Conclusions
Our study is the first investigation where not only plas-matic but also pulmonary tigecycline concentrations are investigated during the treatment of severe infections in critically ill patients with high-dose TGC. Observed plas-matic concentrations suggest the efficacy of this molecule for the treatment of susceptible pathogens, including pneumonia. Higher than 200 mg/day dosages and com-bination with other active molecules may be suggested whilst treating Enterobacteriaceae and Acinetobacter spp. with MIC values close to the clinical breakpoint, espe-cially in case of SSTI and IAI.
Supplementary information
Supplementary information accompanies this paper at https ://doi.
org/10.1186/s1361 3-020-00715 -2.
Additional file 1. Sample collection. Abbreviations
HD: High dosages; TGC : Tigecycline; PK/PD: Pharmacokinetic/pharmacody-namic; ICU: Intensive Care Unit; ELF: Epithelial lining fluid; AUC : Area under the curve; MIC: Minimum inhibitory concentration; IQR: Interquartile range; MRSA: Staphylococcus aureus; VRE: Vancomycin-resistant enterococci; ESBL: Extended-spectrum β-lactamase; XDR: Extensively drug-resistant; FDA: Food and Drug Administration; CRRT : Continuous renal replacement therapy; SAPS II: Simplified Acute Physiology Score; LD: Loading dose; DHHS-CTCAE: Department of Health and Human Services–Common Terminology Criteria for Adverse Events; VAP: Ventilator associated pneumonia; BAL: Bronchoalveolar lavage; IS: Internal standard; SPE: Solid-phase extraction; TQD: Triple quadru-pole tandem; ESI: Electrospray ionization; MRM: Multi reaction monitoring; MS: Mass spectroscopy; Cmax: Maximum concentration; Cmin: Minimum
concentra-tion; Vd: Distribution volume; CL: Drug clearance; t1/2: Elimination half-life; IAI: Intra-abdominal infection; SSTI: Skin–soft-tissue infection; MALDI-TOF: Matrix-assisted laser desorption ionization-time-of-flight; EUCAST: European Committee on Antimicrobial Susceptibility Testing; SOFA: Sequential Organ Failure Assessment; ARF: Acute respiratory failure; AKI: Acute kidney injury; MV: Mechanical ventilation; cIAI: Complicated intra-abdominal infection; cSSTI: Complicated skin and soft tissue infection; CVVHD: Continuous veno-venous haemodialysis; CVVHDF: Continuous veno-venous hemodiafiltration.
Acknowledgements
None.
Authors’ contributions
GDP and MA had full access to all the data in the study and take responsibil-ity for the integrresponsibil-ity and the accuracy of the data analysis. GDP, MS, PN and MA conceived the study, and participated in its design and coordination and helped to draft the manuscript. GDP was in charge of the statistical analysis, participated in analysis and interpretation of data, helped to draft the manuscript, and critically revised the manuscript for important intellectual content. LL, GMPC, MSV, SLC, LC, CG, GB, LM, SC and VDG collected the data for the study, recruited patients and did sample analyses. GDP, LL, GMPC, MT, MS, PN and MA participated in the conception, design and development of the database, helped in analysis and interpretation of data, helped in drafting of the manuscript and critically revised the manuscript for important intellectual content. All authors read and approved the final manuscript.
Funding
Fondi d’Ateneo 2015 PN, Università Cattolica del Sacro Cuore (IT).
Availability of data and materials
The datasets used and/or analysed during the current study are available from the corresponding author on reasonable request.
Ethics approval and consent to participate
The protocol was approved by the Catholic University’s Ethical Committee (approval number Prot.sf 8431/13). Written informed consent was obtained from the patients’ legally authorized representative.
Consent for publication
Written informed consent was obtained from the patients’ legally authorized representative. No individual person’s data in any form are presented in this manuscript.
Competing interests
The authors declare that they have no competing interests.
Author details
1 Dipartimento di Scienza dell’Emergenza, Anestesiologiche e della
Rianimazi-one - UOC di Anestesia, RianimaziRianimazi-one, Terapia Intensiva e Tossicologia Clinica, Fondazione Policlinico Universitario A. Gemelli IRCCS-Università Cattolica del Sacro Cuore, Largo A. Gemelli 8, 00168 Rome, Italy. 2 Istituto di Anestesia
e Rianimazione, Università Cattolica del Sacro Cuore, Rome, Italy. 3 Institute
of Farmacologia, Università Cattolica del Sacro Cuore, L.go F. Vito 1, Rome, Italy.
4 Fondazione Policlinico Universitario Agostino Gemelli IRCCS, Rome, Italy. 5 Dipartimento di Scienze di Laboratorio e Infettivologiche, UOC di Malattie
Infettive, Fondazione Policlinico Universitario A. Gemelli IRCCS, Rome, Italy.
6 Istituto di Malattie Infettive, Università Cattolica del Sacro Cuore, Rome, Italy. 7 Istituto di Microbiologia, Università Cattolica del Sacro Cuore, Rome, Italy. 8 Dipartimento di Scienze di Laboratorio e Infettivologiche, UOC di
Microbio-logia, Fondazione Policlinico Universitario A. Gemelli IRCCS, Rome, Italy. Received: 12 March 2020 Accepted: 8 July 2020
References
1. Testa R, Petersen P, Jacobus N, Sum P, Lee V, Tally F. In vitro and in vivo antibacterial activities of the glycylcyclines, a new class of semisynthetic tetracyclines. Antimicrob Agents Chemother. 1993;37(11):2270–7.
2. Zha L, Pan L, Guo J, French N, et al. Effectiveness and safety of high dose tigecyclinefor the treatment of severe infections: a systematic review and meta-analysis. Adv Ther. 2020;37(3):1049–64.
3. Rodloff A, Dowzicky M. In vitro activity of tigecycline and compara-tors against a European collection of anaerobes collected as part of the Tigecycline Evaluation and Surveillance Trial (TEST) 2010–2016. Anaerobe. 2018;51:78–88.
4. Gong J, Su D, Shang J, Yu H, Du G, Lin Y, et al. Efficacy and safety of high-dose tigecycline for the treatment of infectious diseases: a meta-analysis. Medicine. 2019;98(38):e17091.
5. FDA. FDA Drug Safety Communication: FDA warns of increased risk of death with IV antibacterial Tygacil (tigecycline) and approves new Boxed Warning. Rockvile: FDA; 2013.
6. Xie J, Roberts JA, Alobaid AS, Roger C, Wang Y, Yang Q, et al. Population pharmacokinetics of tigecycline in critically ill patients with severe infections. Antimicrob Agents Chemother. 2017;61(8):e00345. 7. Stein G, Babinchak T. Tigecycline: an update. Diagn Microbiol Infect Dis.
2013;75(4):331–6.
8. Ramirez J, Dartois N, Gandjini H, Yan J, Korth-Bradley J, McGovern P. Randomized phase 2 trial to evaluate the clinical efficacy of two high-dosage tigecycline regimens versus imipenem–cilastatin for treatment of hospital-acquired pneumonia. Antimicrob Agents Chemother. 2013;57(4):1756–62.
9. De Pascale G, Montini L, Pennisi M, Bernini V, Maviglia R, Bello G, et al. High dose tigecycline in critically ill patients with severe infections due to multidrug-resistant bacteria. Crit Care. 2014;18(3):R90.
10. Humphries R, Kelesidis T, Dien Bard J, Ward K, Bhattacharya D, Lewinski M. Successful treatment of pan-resistant Klebsiella pneumoniae pneu-monia and bacteraemia with a combination of high-dose tigecycline and colistin. J Med Microbiol. 2010;59(Pt 11):1383–6.
11. Falagas M, Vardakas K, Tsiveriotis K, Triarides N, Tansarli G. Effective-ness and safety of high-dose tigecycline-containing regimens for the treatment of severe bacterial infections. Int J Antimicrob Agents. 2014;44(1):1–7.
12. Department of Health and Human Services. Cancer therapy evaluation program, common terminology criteria for adverse events, v.3.0. 13. Niederman M, Chastre J, Corkery K, Fink J, Luyt C, García M.
BAY41-6551 achieves bactericidal tracheal aspirate amikacin concentrations in mechanically ventilated patients with Gram-negative pneumonia. Intensive Care Med. 2012;38(2):263–71.
14. De Pascale G, Carelli S, Vallecoccia M, Cutuli S, Taccheri T, Montini L, et al. Risk factors for mortality and cost implications of compli-cated intra-abdominal infections in critically ill patients. J Crit Care. 2019;50:169–76.
15. Boselli E, Breilh D, Rimmelé T, Djabarouti S, Toutain J, Chassard D, et al. Pharmacokinetics and intrapulmonary concentrations of linezolid administered to critically ill patients with ventilator-associated pneu-monia. Crit Care Med. 2005;33(7):1529–33.
16. Rasheed J, Tenover F. Detection and characterization of antimicrobial resistance genes in pathogenic bacteria*. In: Versalovic J, Carroll K, Funke G, Jorgensen J, Landry M, Warnock D, editors. Manual of clinical microbiology. 10th ed. Washington: ASM Press; 2011. p. 1239–61. 17. Agwuh K, MacGowan A. Pharmacokinetics and pharmacodynamics
of the tetracyclines including glycylcyclines. J Antimicrob Chemother. 2006;58(2):256–65.
18. Geng T, Xu X, Huang M. High-dose tigecycline for the treatment of nosocomial carbapenem-resistant Klebsiella pneumoniae bloodstream infections: a retrospective cohort study. Medicine. 2018;97(8):e9961. 19. Cunha B, Baron J, Cunha C. Once daily high dose tigecycline—phar-macokinetic/pharmacodynamic based dosing for optimal clinical effectiveness: dosing matters, revisited. Expert Rev Anti Infect Ther. 2017;15(3):257–67.
20. Broeker A, Wicha S, Dorn C, Kratzer A, Schleibinger M, Kees F, et al. Tigecycline in critically ill patients on continuous renal replacement therapy: a population pharmacokinetic study. Crit Care. 2018;22(1):341. 21. Borsuk-De Moor A, Rypulak E, Potręć B, Piwowarczyk P, Borys M, Sysiak
J, et al. Population pharmacokinetics of high-dose tigecycline in patients with sepsis or septic shock. Antimicrob Agents Chemother. 2018;62(4):e02273. https ://doi.org/10.1128/aac.02273 -17 (Print 2018
Apr).
22. Jr Conte JE, Golden J, Kelly M, Zurlinden E. Steady-state serum and intrapulmonary pharmacokinetics and pharmacodynamics of tigecy-cline. Int J Antimicrob Agents. 2005;25(6):523–9.
23. Crandon J, Kim A, Nicolau D. Comparison of tigecycline penetration into the epithelial lining fluid of infected and uninfected murine lungs. J Antimicrob Chemother. 2009;64(4):837–9.
24. Burkhardt O, Rauch K, Kaever V, Hadem J, Kielstein J, Welte T. Tigecy-cline possibly underdosed for the treatment of pneumonia: a pharma-cokinetic viewpoint. Int J Antimicrob Agents. 2009;34(1):101–2. 25. Gotfried M, Horn K, Garrity-Ryan L, Villano S, Tzanis E, Chitra S, et al.
Comparison of omadacycline and tigecycline pharmacokinetics in the plasma, epithelial lining fluid, and alveolar cells of healthy adult subjects. Antimicrob Agents Chemother. 2017;61(9):e01135.
Publisher’s Note
Springer Nature remains neutral with regard to jurisdictional claims in pub-lished maps and institutional affiliations.