1
"La presente tesi è cofinanziata con il sostegno della Commissione Europea, Fondo Sociale Europeo e della Regione Calabria. L’autore è il solo responsabile di questa tesi e la Commissione Europea e la Regione Calabria declinano ogni responsabilità sull’uso che potrà essere fatto delle informazioni in essa contenute".
2
Table of Contents
Introduction
Pag.4
Materials and Methods
Pag.11
Cell culture Pag.11
Cancer Associate Fibroblasts (CAF) isolation Pag.11
Immunofluorescence Pag.12
Conditioned medium (CM) and Leptin-immunodepleted CM Pag.12
Patient-derived Samples Pag.12
Mammosphere culture Pag.13
Flow cytometry Pag.13
Reverse transcription and real-time reverse transcriptase PCR assays Pag.13
Protein expression analysis using western-blot Pag.15
Transmigration assays Pag.16
Lentiviral and Retroviral transfections Pag.16
Microarray and data analysis Pag.17
Construction of RNA-seq database Pag.18
Patient derived xenografts and in vivo experiments Pag.18
Aldefluor assay (Stemcell Technologies) Pag.19
Notch transcriptional assay Pag.19
Notch4 targeting using CRISPR-Cas9n technology Pag.20
Growth assay (SRB assay) Pag.20
3
Evaluation of the role of leptin, as a mediator of the
tumor troma interaction, in regulating breast CSC
activity (Aim 1)
Cafs and adipocytes induce mammosphere formation in breast cancer cells through leptin secretion
Pag.23
Targeting leptin signaling reduces stem cell activity mediated by stromal cells
Pag.26
Leptin signaling regulates mammosphere formation/self-renewal activity of breast cancer cells
Pag.28
Gene expression profiling in leptin or stromal CM-treated mammosphere-derived cells
Pag.31
Leptin increases patient-derived mammosphere formation/self-renewal activity
Pag.35
OBR expression correlates with reduced overall survival in breast carcinomas
Pag.38
Investigation of the role of NOTCH4 signaling in breast
cancer stem cell activity induced by endocrine
treatments (Aim 2)
BCSC activity is enriched by Tamoxifen and Fulvestrant Pag.41 Tamoxifen or Fulvestrant treatment upregulates Notch target genes Pag.44 JAG1 and Notch4 receptor signaling drives endocrine resistance Pag.45 GSI RO4929097 abrogates Tamoxifen and Fulvestrant stimulated CSC
activity
Pag.49
Discussion
Pag.51
Introduction
4
Introduction
Breast cancer is the most common malignancy and the leading cause of cancer-related death in women worldwide (Jemal A. et al., 2010). Approximately 75% of primary breast cancers are estrogen receptor (ER) positive and endocrine therapies such as selective estrogen receptor (ER) modulators (SERMs; e.g., tamoxifen), selective ER downregulators (SERDs; e.g., fulvestrant), and the aromatase inhibitors are the standard treatment options for estrogen receptor-positive breast cancer patients. However, the effectiveness of these agents is limited by the development of the novo or acquired resistance that limits the success of this therapeutic strategy. Indeed, resistance to hormonal therapy is seen in 50%–60% of early breast cancer (BC) cases and develops in almost all patients with advanced disease (Davies C et al., 2011; Palmieri C et al., 2014).
In the last years, several studies have been supported the hypothesis that cancers are maintained and re-populated by stem-like cells within the tumor, termed cancer stem cells (CSCs). CSCs, first identified in Al-Hajj work using cells isolated from pleural effusions and primary tumors of breast cancer patients (Al-Hajj M et al., 2003), were characterized on the basis of their expression profile of specific cell surface markers, including EpCAM+, CD24- and CD44+, and by their ability to undergo self-renewal, a process that drives tumorigenesis, or to differentiate into the non-self-renewing cells forming the tumor bulk (Visvader JE et al., 2008) (Figure 1).
5
Figure 1: The cancer stem cell model. Cancer stem cells retain the ability to self-renew and are able to produce daughter cells, through multiple asymmetric cell divisions, that may form the tumor bulk.
From a clinical point of view, the main concern with CSCs is related to their ability to evade the effects of conventional therapies (e.g. endocrine, chemo- and radiotherapy), and thereby repopulate the tumour following treatment (Li X et al., 2008; Phillips TM et al., 2006; Kakarala M et al., 2008).
Similar to embryonic and somatic stem cells, the self-renewal and differentiation of CSCs are regulated by both intrinsic and extrinsic pathways whose dysregulation may be a key event initiating carcinogenesis. Among the intrinsic pathways, an important role is displayed by developmental signals such as Wnt, Hedgehog, Janus kinase 2-signal transducer and activator of transcription 3 (JAK2-STAT3) and Notch pathways that are frequently deranged in cancers (Liu S et al., 2005) (Figure 2).
Introduction
6
Figure 2: Intrinsic signals regulating cancer stem cells. Cancer stem cells, like the normal stem cells, are finely regulated by the classical embryonic signals shown in the figure.
In particular, it has been shown that aberrant Notch activation transforms normal breast cells, is found in pre-invasive and invasive humanBCs, and correlates with early recurrence (Stylianou S et al., 2006;Farnie G et al., 2007). Moreover, Harrison et al. reported that, inhibition of Notch signaling, particularly NOTCH4 receptor, reduced breast CSCactivity (BCSC) (Harrison H et al., 2010).
CSCs also rely on a specific tumor microenvironment, termed as cancer stem niche, that provides paracrine and juxtacrine signals for maintaining CSC properties.
The cancer stem niche contains a number of cell types, including mesenchymal stem cells (MSCs), cancer-associated fibroblasts (CAFs), adipocytes, endothelial and immune cells, all of which, through networks of cytokines and growth factors, have been shown to influence tumor growth and metastasis (Korkaya H. et al., 2011) (Figure 3).
7
Figure 3: Schematic representation of tumor microenvironment.
Adipocytes and CAFs are the major components in breast cancer microenvironment, and along with their secreted factors represent key players in stroma-epithelial cell interactions. As an important paracrine mediator, the adipocyte-derived cytokine leptin, that we have recently demonstrated to be also secreted by CAFs (Barone I et al.,
2012), has been correlated with breast cancer occurrence. Leptin exerts its biologic
function through binding to its receptor (OBR) which activates multiple downstream signaling pathways such as those involving JAK2-STAT3, mitogen-activated protein kinase (MAPK), and phosphatidylinositol 3-kinase/protein kinase B (PI3K/AKT)(Cirillo D et al., 2008) (Figure 4). Leptin and both short and long OBR isoforms are overexpressed in breast cancer, especially in higher grade tumors and are associated with distant metastases (Ishikawa M et al., 2004; Miyoshi Y et al., 2006).
Introduction
8
Figure 4: Leptin signaling. Binding of leptin to its receptor, LEP-R, results in the activation of its downstream pathways such as JAK2-STAT3, mitogen-activated protein kinase (MAPK), and phosphatidylinositol 3-kinase/protein kinase B (PI3K/AKT).
It has been extensively demonstrated using both in vitro and in vivo experimental models, that leptin modulates many aspects of breast cancer biology: e.g., increases cell proliferation and transformation, induces the expression of several cell cycle modulators, exerts anti-apoptotic effects, reduces efficacy of breast cancer treatment, influences cancer initiation processes (Table 1). Moreover, leptin is able to shape the tumor microenvironment within the mammary gland by inducing multiple concurrent events: potentiated migration of endothelial cells, promotion of angiogenesis and sustained recruitment of macrophages and monocytes (Andò S et al., 2014; Saxena NK et al., 2013; Newman G et al., 2014).
9
Table 1. Overview of current knowledge about the involvement of leptin in the pathogenesis and progression of breast cancer.
Recent studies have also reported that leptin signaling may be involved in the promotion of CSC phenotype. In particular, it has been reported that leptin is able to regulate several signaling pathways and oncogenes, such as HER2, and AKT as well as transcription factors, such as STAT3 and NF-kB, that it is known are implicated in BCSCs (Guo S et al., 2012). In addition, leptin also activates the Notch signaling pathway (Guo S et al., 2011; Knight BB et al., 2011) and induces the expression of CD44 and ALDH1 which have been found to be important mediators of BCSCs biology. Interestingly, Zheng et al. have reported a decreased tumor outgrowth and a functional depletion of BCSCs in obese leptin-deficient mice transplanted with murine mammary tumor virus (MMTV)-Wnt-1 tumor cells, showing that leptin signaling plays an important role in tumor cell growth and stem-cell survival (Zheng Q et al., 2011). More recently, it has been shown that the leptin receptor is necessary for maintaining CSC-like and metastatic properties in triple-negative breast cancer cells (Zheng Q et al., 2013) , and that inhibition of STAT3 suppresses leptin-induced CSCs and cancer progression in diet-induced obese rats (Chang CC et al., 2015).
Introduction
10
On the basis of the above observations, the aims of the current study were:
1. To evaluate the role of leptin, as a mediator of the tumor-stroma interaction, in regulating BCSC activity using breast cancer cell lines and patient-derived breast cancer cells isolated from metastatic ascites and pleural effusions. Particularly, we investigated: i) the impact of CAFs and adipocytes isolated from stromal breast tissues on mammosphere formation and self-renewal in breast cancer cells; ii) the specific role of leptin and its receptor in influencing BCSC phenotype in the context of the tumor microenvironment; iii) the effect of inhibiting leptin signaling as potential therapeutic target to reduce BCSC activity in in vitro and ex vivo models.
2. To investigate the role of NOTCH4 signaling in breast cancer stem cell activity induced by Tamoxifen and Fulvestrant treatments. In particular, we evaluated: i) the effect of the anti-estrogen Tamoxifen and Fulvestrant on BCSC activity using patient-derived ER+ tumor cells and early and metastatic ER+ patients derived xenografts (PDX); ii) the expression and activity of Notch4 signaling in breast cancer cell lines and BC PDX tumors; iii) the effects of anti-estrogens administered in the presence of the gamma-secretase inhibitor (GSI) RO4929097, which targets NOTCH4 signaling, on BCSC activity in ER+ PDX tumors.
11
Materials and Methods
Cell culture
Human MCF-7, MDA-MB-231, T47D and ZR-75-1 breast cancer epithelial cells were authenticated, cultured according to supplier's instructions, and used within 4 months after frozen aliquots recovery. Breast subcutaneous human female preadipocytes (Lot. #:BR071812B; BR070810) were from Zen-Bio. Adipocytes, obtained following differentiation procedure, were routinely maintained in Adipocyte maintenance medium (Zen-Bio). Every 4 months, cells were authenticated by single tandem repeat analysis at our Sequencing Core; morphology, doubling times, estrogen sensitivity, and mycoplasma negativity were tested (MycoAlert, Lonza).
MCF-7, T47D and ZR-75-1 cells were treated for 6 days with ethanol (control), 10-6M 4-OH-tamoxifen or 10-7M fulvestrant.
MCF7 Tamoxifen- and Fulvestrant-resistant cell lines were generated by Dr Julia Gee (University of Cardiff, Wales) and were cultured in phenol red-free DMEM/F12 media with LGlutamine (Gibco) supplemented with 5% charcoal stripped serum and in the presence of 10-7M 4-OH-tamoxifen or 10-7M fulvestrant, respectively . MCF7 resistant cell lines were authenticated by comparative karyotyping to ATCC derived MCF7.
Cancer Associated Fibroblast (CAF) isolation
Human breast cancer specimens were collected in 2011 from primary tumors of patients who signed informed consent. Following tumor excision, small pieces were digested (500 IU collagenase in Hank's balanced salt solution; Sigma; 37C for 2 hours). After differential centrifugation (90 g for 2 minutes), the supernatant containing CAFs was centrifuged (500 g for 8 minutes), resuspended, and cultured in RPMI-1640 medium supplemented with 15% FBS and antibiotics. CAFs between 4 and 10 passages were used, tested by mycoplasma presence, and authenticated by morphology and expression of fibroblast activation protein (FAP), Vimentin and α-smooth muscle actin (α-SMA).
Materials and Methods
12
Immunofluorescence
Cells were fixed with 4% paraformaldehyde, permeabilized with PBS 0.2% Triton X-100 followed by blocking with 5% bovine serum albumin (1 hour at room temperature), and incubated with anti-α-SMA (Sigma) and anti-ER-α (Santa Cruz) (4C, overnight) and with fluorescein isothiocyanate–conjugated secondary antibody (30 minutes at room temperature). IgG primary antibody was used as negative control. 40, 6-Diamidino-2-phenylindole (DAPI; Sigma) staining was used for nuclei detection. Fluorescence was photographed with OLYMPUS BX51 microscope, 20X objective.
Conditioned medium (CM) and Leptin-immunodepleted CM
CAFs and Adipocytes were incubated with regular full media (48–72 hours). Conditioned media were collected, centrifuged to remove cellular debris, and used in respective experiments. Protein G-agarose (Santa Cruz) beads were incubated with anti-leptin (Santa Cruz) or IgG antibodies. Antibody–beads complexes were incubated with CAF and Adipocytes conditioned media and centrifuged. Leptin immunodepletion was verified by ELISA (LDN).
Patient-derived Samples
Early BC samples were collected in RPMI (GIBCO), dissected into 1- to 2-mm3 cubes and digested with the Human Tumor Dissociation Kit (Miltenyi Biotec) for 2 hr at 37°C. Digested tissue was filtered sequentially through 100- and 40-mmcell strainers, then centrifuged at 300 g for 5 min and washed in PBS.
Pleural effusion and ascites samples were obtained from patients with metastatic breast cancer undergoing palliative drainage at The Christie Hospital NHS Foundation Trust Manchester (UK). Metastatic breast sample details in Table 1. Ascites and pleural effusions were centrifuged at 1000 g for 10 min at 4°C and suspended in PBS. Erythrocytes and leucocytes were removed by centrifugation through Lymphoprep solution (Axis Shield), followed by removal of CD45-positive cells using anti-CD45 magnetic beads (Miltenyi Biotec). Single cell suspension of breast cancer epithelial cells was then used to perform mammosphere assay.
13
Mammosphere culture
MCF-7 and MDA-MB-231 monolayer cells were enzymatically and manually disaggregated to obtain single-cells suspension. Single cells were plated in ultralow attachment plates (Corning) at a density of 500 cells/cm2 in a serum-free Human mammary epithelial cell growth medium (HUMEC), supplemented with B27, 20ng/mL human epidermal growth factor (EGF), 4μg/mL heparin, 5μg/ml insulin, 1ng/ml hydrocortisone, 1mg/ml penicillin-streptomycin and 0,25μg/ml amphotericin B (Life Technologies). Growth factors and treatments (leptin, Life Technologies; AG490 Sigma; PD98059/LY294002 Calbiochem) were added to the mammosphere cultures every 3 days. After 7 days mammospheres >50μm (primary mammospheres-M1) were counted using a microscope (x40 magnification), collected, enzymatically dissociated, plated at the same seeding density used in the primary generation to obtain secondary mammospheres-M2. Mammospheres forming efficiency (MFE) was calculated as number of mammospheres per well/number of cells seeded per well and reported as fold versus control.
Flow cytometry
Mammospheres were dispersed to obtain single-cell suspension. Cells were washed in PBS with 2,5% BSA and stained with FITC anti-human CD44 and PE anti-human CD24 (BD Biosciences,), according to the supplier’s protocol. Flow cytometric analysis was performed on a FACScan and acquisition was performed with WinDI software (Becton Dickinson).
Reverse transcription and real-time reverse transcriptase PCR assays
Total RNA was extracted from cells using TRIzol reagent and the PPARγ, OB, FAP, 36B4 gene expression was performed by the reverse transcription-PCR method using a RETROscript kit (Applied Biosystem). Analysis gene expression of the other genes used in this study was performed by Real-time reverse transcription–PCR. Total RNA (2μg) was reverse transcribed with the RETROscript kit; cDNA was diluted 1:2 in nuclease-free water and 5μl were analysed in triplicates by real-time PCR in an iCycler iQ Detection System (Bio-Rad, USA) using SYBR Green Universal PCR Master Mix with 0.1Materials and Methods
14
mmol/l of each primer in a total volume of 30 μl reaction mixture following the manufacturer’s recommendations. Negative control contained water instead of first strand cDNA was used. Each sample was normalized on its GAPDH mRNA content. The relative gene expression levels were normalized to a calibrator that was chosen to be the basal, untreated sample. Final results were expressed as n-fold differences in gene expression relative to GAPDH mRNA and calibrator, calculated using the ΔCt method as follows: n-fold=2- (ΔCtsample–ΔCtcalibrator) where ΔCt values of the sample and calibrator were determined by subtracting the average Ct value of the GAPDH mRNA reference gene from the average Ct value of the gene analysed.
Primers used for the amplification were reported in Table 2.
Table2. Sequences of primers and probes. Gene
Symbol
Gene Name Primer Sequences
PPAR Peroxisome Proliferator-Activated Receptor gamma
For 5’-GAGTTCATGCTTGTCAAGGATGC- 3’ Rev 5’-CGATATCACTGGAGATCTCGCC-3’
OB Leptin For 5’ -GAGACCTCCTCCATGTGCTG-3’
Rev 5’- TGAGCTCAGATATCGGGCTGAAC-3’
FAP Fibroblast activation protein For 5’-AGAAAGCAGAACTGGATGG-3’ Rev 5’-ACACACTTCTTGCTTGGAGGAT-3’ 36B4 36B4 For 5’-CTCAACATCTCCCCCTTCTC-3’ Rev 5’- CAAATCCCATATCCTCGT -3’ GAPDH glyceraldehyde-3-phosphate dehydrogenase For 5’-CCCACTCCTCCACCTTTGAC-3’ Rev 5’-TGTTGCTGTAGCCAAATTCGTT-3’
OBRL Leptin Receptor Long Isoform For 5’-GATAGAGGCCCAGGCATTTTTTA-3’
Rev 5’- CACCACTCTCTCTCTTTTTGATTGA-3’
OBRS Leptin Receptor Short Isoform For 5’-ATTGTGCCAGTAATTATTTCCTCTTCC-3’
Rev 5’-CCACCATATGTTAACTCTCAGAAGTTCA-3’
CD44 CD44 molecule For 5’- CCTTTGATGGACCAATTACCATAAC-3’
Rev 5’- TCAGGATTCGTTCTGTATTCTCCTT-3’
OCT4 POU class 5 homeobox 1
(POU5F1)
For 5’- AGCGACTATGCACAACGAGA- 3’ Rev 5’- CCATAGCCTGGGTACCAAA- 3’
N-CAD N-cadherin For 5’- ACAGTGGCCACCTACAAAGG-3’
Rev 5’- CCGAGATGGGGTTGATAATG-3’
NOTCH1 Notch 1 For 5’-GTGACTGCTCCCTCAACTTCAAT- 3’
Rev 5’-CTGTCACAGTGGCCGTCACT- 3’
SMO Smoothened, frizzled family receptor
For 5’- CACCCTGGCCACATTCGT- 3’
Rev 5’- CGCATTGACGTAGAAGAGAATAACA- 3’
BMI1 Polycomb ring finger oncogene For 5’- GTGCTTTGTGGAGGGTACTTCAT- 3’
Rev 5’-TACACGTTTTACAGAAGGAATGTAGAC-3’
SUZ12 SUZ12 polycomb repressive
complex 2 subunit
For 5’- AGCTTACGTTTACTGGTTTCTTCCA- 3’ Rev 5’- GCAAACTTTCACAAGCAGGACTT- 3’
BMP7 Bone morphogenetic protein 7 For 5’-GGGAACGCTTCGACAATGAG- 3’
Rev 5’- CGATTCCCTGCCCAAGTG- 3’
BMPR2 Bone morphogenetic protein receptor, type II
For 5’- GCCTTTGGGAGAAATCAAAAGGGG- 3’ Rev 5’- CATTCTGAATTGAGGGAGGAGTGG- 3’
15
YES1 v-yes-1 Yamaguchi sarcoma viral oncogene homolog 1
For 5’- CCTCGAGAATCTTTGCGACTAGA- 3’ Rev 5’-CCATTCCATGTTCCCATCCA- 3’
SMAD4 SMAD family member 4 For 5’-GGAGCTCATCCTAGTAAATG-3’
Rev 5’-GACGGGCATAGATCACATGA-3’
SOX4 SRY (sex determining region Y)-box 4
For 5’- GGCCTCGAGCTGGGAATCGC-3’ Rev 5’- GCCCACTCGGGGTCTTGCAC-3’
MAPK6 Mitogen-activated protein kinase 6 For 5’-GTCGGAGAAGTCCCGTTGTATC- 3’ Rev 5’-TCCAGCTCACCACAATCACAAT- 3’
SKT36 Serine/threonine kinase 36 For 5’- CGCATCCTACACCGAGATATGA- 3’
Rev 5’- GCAAATCCAAAGTCACAGAGCTT- 3’
BIRC6 Baculoviral IAP repeat-containing protein 6
For 5’- GGACCACCGCATCTCTACAT -3’ Rev 5’- GCAGTGGATGAAGCCAGCCT- 3’
HSPA1A Heat shock 70kDa protein 1A For 5’- CCTGTGTTTGCAATGTTGAAATTT -3’
Rev 5’- CTCTGCATGTAGAAACCGGAAA- 3’
HSPD1 Heat shock 60kDa protein 1 (chaperonin)
For 5’-GATGTTGATGGAGAAGCTCTAAGTACA-3’ Rev 5’-TGCCACAACCTGAAGACCAA-3’
HSPH1 Heat shock 105kDa/110kDa
protein 1
For 5’-AAATCAGCAAATCACTCATGCAA-3’ Rev 5’-ATGCTCGGCCATGAAATCTT-3’
HSP90AA1 Heat shock protein 90kDa alpha, class A member 1
For 5’-ATTGCCCAGTTGATGTCATTGA-3’ Rev 5’-ATGCATCTGATGAATTTGAAATGAG-3
HEY1 Hes-Related Family BHLH
Transcription Factor With YRPW Motif 1
For 5’- CGAGCTGGACGAGACCAT-3’ Rev 5’-GAGCCGAACTCAAGTTTCCA-3’
HES1 Hes Family BHLH Transcription
Factor 1
For 5’- GAAGCACCTCCGGAACCT-3’ Rev 5’-GTCACCTCGTTCATGCACTC-3’
Protein expression analysis using western-blot
Proteins were extracted with Protein Lysis Buffer (25mM HEPES, 50mM NaCl, 30mM NaPP, 50mM NaF, 1% Triton-X-100, 10% Glycerol, 5mM EDTA, Protease Inhibitor cocktail, 1μM PMSF). Lysates were placed on a rotator for 1 hour at 4°C, then were centrifuged at 10000g at 4°C for 10min, and supernatants were collected. Protein concentrations were assessed using the BCA Protein Assay Kit (Thermo Scientific). Proteins were separated on a 10% gel (Biorad) by SDS-PAGE at 200V for 1 hour, and then were transferred on polyvinylidene difluoride (PVDF) membranes (BioRad) at 25 V/1,300 mA for 15 min using a Trans Blot Turbo (BioRad). Membranes were blocked in a solution of PBS containing 0,05% Tween-20 and 5% skimmed milk (Marvel) for 1h at room temperature and primary antibodies were incubated overnight at 4°C. Primary antibodies used were anti-ERα( Santa Cruz), anti-Vimentin (Santa Cruz), pan-Cytokeratin (Santa Cruz), p-STAT3 (Santa Cruz), p-AKT (Santa Cruz), p42/44 MAPK (Cell Signalling), HSP90 (Santa Cruz), NOTCH1 (Rockland), anti-NOTCH2 (Cell Signalling), anti-NOTCH3 (Santa Cruz), anti-NOTCH4 (Abcam), anti-HES1
Materials and Methods
16
(Millipore), anti-JAG1 (Santa Cruz), anti-DLL1 (Abcam), anti-DLL4 (Abcam), anti-GAPDH (Santa Cruz) and anti-β-actin (Sigma). Horseradish peroxidase-conjugated secondary antibodies (Dako) were incubated for 1h at room temperature. Proteins were visualized with Luminata Classico or Luminata Forte (Millipore) by exposing the membranes to X-ray films (HyperfilmTM MP, Amersham).
Transmigration assays
Mammosphere derived MCF-7, treated with or without leptin, were placed in the upper compartments of Boyden chamber (8-μm membranes/Corning Costar. Bottom well contained regular full media. After 24 hours, migrated cells were fixed and stained with Coomassie brilliant blue. Migration was quantified by viewing 5 separate fields per membrane at 20 magnification and expressed as the mean number of migrated cells. Data represent 3 independent experiments, assayed in triplicate.
Lentiviral and Retroviral transfection
We established stable OBR sh MCF-7 cell line using the lentiviral expression system (GeneCopoeia; lentiviral plasmid sh-clone #HSH010584). 48h after transfection with packaging plasmids and pLentiviral plasmids of target gene in HEK293 cells, supernatants containing lentiviral particles were filtered (0.45μm PES), mixed with polybrene (8μg/ml) and used to infect MCF-7 cells. 24h after infection, cells were selected with 2μg/mL puromycin overtime to eliminate un-infected cells. OBR mRNA in stable MCF-7 clones was confirmed by real-time RT-PCR.
Overexpression of Notch IntraCellular Domain 4 (NICD4) or Jagged 1 ligand (JAG1) in MCF-7 cells was carried out by lenti- and retro-viral transduction, respectively. Lentiviruses were produced by co-transfection of pPsPax2, pMD2.G vectors and the relevant pCDH lentiviral vector (containing NICD4 or empty vector) in HEK293T cells using polyethylenimine (Millipore). Virus-containing supernatant was collected after 48h. Full length human JAG1 cDNA cloned into the retroviral vector LZRSpBMN-linker-IRES GFP was kindly provided by ML Toribio (CBMSO, Madrid). To obtain retroviral particles, the retroviral vectors (hJAG1-expressing vector or the empty vector) were co-transfected with pMD2.G (envelope system) into PhoenixGP packaging cells following
17
the calcium phosphate method (CalPhos Mammalian Transfection kit, Clontech Laboratories). Retroviruses-containing supernatants were harvested 24, 48 and 72h post-transfection. Once virus-containing supernatants were collected, they were centrifuged at 400 g for 5min and filtered through 0.45 μm filter to remove cell debris. The viral supernatants were concentrated by ultracentrifugation using an AH-629 rotor (Sorvall Ultra Pro80, Sorvall) at 20000 rpm for 2h at 4°C. The viral pellets were resuspended in PBS and aliquots were stored at -80°C. MCF-7 cells were transduced with either lenti- or retro-viral particles in the presence of 8 μg/ml polybrene (Sigma). Stable transduced MCF-7 cells were selected by FACS based on GFP expression.
Microarray and data analysis
Microarray analyses were carried out on total RNA from MCF-7-M2 mammosphere-derived cells treated with CAF-CM, Adipocyte-CM or Leptin by pooling equal amounts of nucleic acids extracted from three independent cell cultures. Gene expression profiling was performed in triplicate using 500ng of each RNA pool as described (Nassa G et al., 2014), cRNAs were hybridized for 18h at 55°C on Illumina HumanHT-12 v4.0 BeadChips (Illumina Inc.) and scanned with an Illumina iSCAN. Data analyses were performed with GenomeStudio software version 2011.1 (Illumina Inc.). Data were normalized with the quantile algorithm and genes were considered if the detection p-value was <0.01. Statistical significance was calculated with the Illumina DiffScore, a proprietary algorithm that uses the bead standard deviation to build an error model. Transcripts showing a DiffScore ≤−30 and ≥30, corresponding to a p-value of 0.001 and significant fold change in treated vs untreated≥1.5 were considered. Venn diagram was generated using Venny 2.0 software. Heat-maps were generated with the Multiexperiment Viewer 4.9 software after performing one way hierarchical clustering of transcripts with the average linkage method and Euclidian distance.
Raw microarray data have been deposited, in a format complying with the Minimum Information About a Microarray Gene Experiment (MIAME) guidelines of the Microarray Gene Expression Data Society (MGED), in the EBI ArrayExpress database (http://www.ebi.ac.uk/ arrayexpress) with Accession Number: E-MTAB-3641.
Materials and Methods
18
Total RNA from 8 different metastatic breast cancer samples was extracted using the RNeasy Plus Mini Kit (QIAGEN). The Exon Gene Array ST1 platform (Affimetrix) was used to assess gene expression. Data obtained were analysed using Bioconductor R Software. The mean of log2 gene expression values was calculated across all 8 patient derived samples for each individual gene.
Construction of RNA-seq database
RNA-seq data was obtained from the TCGA depository. We transferred the pre-processed level 3 data generated by the Illumina HiSeq 2000 RNA Sequencing Version 2 platform. Expression levels for these samples were computed using a combination of MapSplice and RSEM. Individual patient files were merged into a single database using the plyr R package (Wickham 2011).
Patient derived xenografts and in vivo experiments
Mouse studies commenced in 8- to 12-week-old female mice and were conducted in accordance with the UK Home Office Animals (Scientific Procedures) Act 1986, using NSG (NOD.Cg-Prkdcscid Il2rgtm1Wjl/SzJ) mice. All in vivo work was performed with a minimum of n = 4 mice per condition. Serial passaging of the PDX was carried out by implanting small fragments of the tumor subcutaneously into dorsal flanks of NSG mice. Early (HBCx34) and metastatic (BB3RC31) BC estrogen-dependent PDXs were administered with 8 mg/ml of 17-beta estradiol in drinking water at all times and were
treated with drugs when tumors reached 200–300 mm3. Experiments were performed
using PDX tumors between passages 5 and 8. Animal weight and tumor size was measured bi-dimensionally using callipers twice a week. Tamoxifen citrate (Sigma, 10 mg/kg/day) and RO4929097 (Cellagen Technology, 3 mg/kg/day) were administered by oral gavage (0.1 ml per dose) on a basis of 5 days out of 7 (weekends excluded) for 14 days. Tamoxifen citrate and RO4929097 were prepared in 1% carboxymethylcellulose (Sigma) dissolved in distilled water. Fulvestrant (kindly provided by AstraZeneca, 200 mg/kg/week) was administered by subcutaneous injection (0.1 ml per dose) on a weekly basis for 14 days.
19
To determine tumor initiation capacity of metastatic (BB3RC31) PDX cells treated in vivo, respectively, NSG mice were injected subcutaneously with cells in mammosphere media mixed 1:1 with Matrigel. 90-day slow release estrogen pellets were implanted sub-cutaneously into mice two days before cell injection (0.72 mg, Innovative Research of America). Positive tumor growth was assessed at day 60 or 90 after cell injection by determining the mice bearing a tumor greater than 100 mm3 and is represented as mice positive for growth/mice tested (n=4 per condition in all experiments). p values were calculated with Chisquared test.
Aldefluor assay (Stemcell Technologies)
Dissociated single cells were suspended in Aldefluor assay buffer containing an ALDH substrate, bodipyaminoacetaldehyde (BAAA) at 1.5 mM, and incubated for 45 min at 37ºC. To distinguish between ALDH-positive and -negative cells, a fraction of cells was incubated under identical conditions in the presence of a 2-fold molar excess of the ALDH inhibitor, diethylaminobenzaldehyde (DEAB). Mouse cells were excluded from the FACS analysis with anti-mouse MHC Class I (H-2Kd) antibody conjugated with Pacific Blue (BioLegend). 7-aminoactinomycin D (7AAD, BD) was added for dead cell exclusion. Data were acquired on a LSR II (BD) flow cytometer and analysed using the BD FACSDiva™ software.
Notch transcriptional assay
To measure the activation of Notch dependent transcription, cells were transfected with CBF1 firefly luciferase reporter (containing 10 copies of a CBF1 consensus sequence) and CMV-Renilla luciferase reporter. Plasmids were incubated with X-tremegene (Roche) in a ratio of 3:1 (μl of X-X-tremegene: μg of DNA) in OptiMEM (Life Technologies) for 15 minutes, before addition to the culture media. After 48 hours cells were lysed with 1x Passive lysis buffer (5x, Promega), put on the rocker for 15 minutes and luminescence was assayed with the Dual-Glo Luciferase assay system (Promega) following manufacturer’s instructions. Luciferase activity was measured using a luminometer (Promega, Glomax Multi+ Detection System with Instinct
Materials and Methods
20
Software). Luminescence of the firefly luciferase was normalised to that of the renilla luciferase.
NOTCH4 targeting using CRISPR-Cas9n technology
To generate MCF-7 clones with genomic alterations in NOTCH4, a double-nickase approach was used by expressing a D10A mutant version of Cas9 (Cas9 nickase) together with a pair of sgRNAs complementary to opposite strands of the targeted genomic locus. sgRNA oligo sequences (sgRNA-A, 5’-ACCTGCCTGAGCCTGTCTCT-3’; sgRNA-B, 3’-TCTTGGGACACGGTTACCT-5’) targeting exon 2 of NOTCH4 gene were designed using the CRISPR design tool (http://crispr.mit.edu/) - Figure S2D. sgRNA-coding sequences were cloned into pSpCas9n (BB)-2A-GFP (Addgene, PX461) vector. MCF-7 cells were co-transfected with PX461-sgRNA-A and PX461-sgRNA-B plasmids using X-tremeGENE Transfection reagent (Roche, 06366244001). Two days post-transfection, GFP-positive cells were directly FACS sorted as single cells into 96-well plates. After 14 days in culture, clones were screened for CRISPR-mediated indels. Genomic DNA was extracted using the Wizard Genomic DNA Purification Kit (Promega, A1120) and genotyping PCR was performed using a set of primers flanking the CRISPR
target site (forward 5’-GGGTACCATGTGGAGAGTGG-3’; reverse
5’-CACAAGAAGCTGGGTGTCAA-3’). PCR products purified with QIAquick PCR Purification Kit (Qiagen) were cloned into pGEM-T Easy vector and then Sanger sequenced using T7 sequencing primer. Absence of wild-type alleles was confirmed by using a specific restriction enzyme for target sequence (BanI, Biolabs). Proteins were extracted and separated on 10% SDS-PAGE gel. Membranes were incubated with anti-NOTCH4 (Santa Cruz) and anti-β-actin (Sigma) antibodies.
Growth assay (SRB assay)
6000 cells were seeded per well in a 96 well-plate at least in triplicate for each condition used. Plates were incubated in a humidified incubator at 37°C with 5% CO2 and an SRB assay was performed at different time points to assess cellularity. Briefly, cells were fixed with 25μl/well of 50% (w/v) trichloroacetic (TCA) and incubated at 4°C for a minimum of 1hour. Fixed cells were washed 5 times with water and left to air dry.
21
Cells were then stained with 100μl/well of 0.4% (w/v) Sulforhodamine B (SRB) dissolved in 1% acetic acid for 30 minutes at room temperature. Residual SRB was washed away with 3 washes of 1% acetic acid and plates were left to air dry. Finally, SRB was solubilized with 100μl/well of 10mM Tris-base (pH 10.5) for 20 minutes at room temperature and absorbance was measured at 490 nm with an automated plate reader(BioTek ELx800).
Statistical analyses
Each datum point represents the mean±s.d. of three different experiments. Data were analyzed by Student’s t test using the GraphPad Prism 4 software. P<0.05 was considered as statistically significant. Pearson correlation coefficient (r) was used to measure the correlation between OBR or Heat Shock Protein 90 (HSP90) gene expression of 8 metastatic breast cancer samples and mean MFE; a 2-tailed p ≤0.05 was considered statistically significant.
Meier analysis was performed as described (Gyorffy B et al., 2010). Kaplan-Meier survival graph, and hazard ratio with 95% confidence intervals and logrank P value were calculated and plotted in R using Bioconductor packages.
22
AIM 1
Evaluation of the role of leptin, as a
mediator of the tumor-stroma
interaction, in regulating breast CSC
23
Results
CAFs and adipocytes induce mammosphere formation in breast cancer
cells through leptin secretion
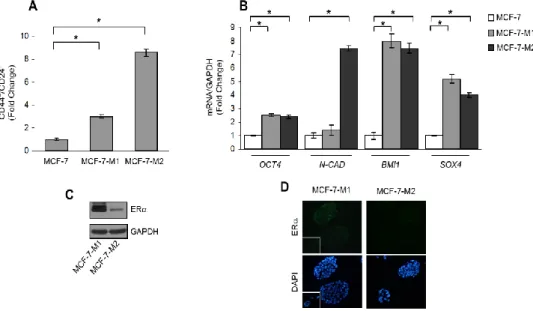
To assess the ability of stromal cells to affect CSC activity in breast cancer cells we performed co-culture experiments. As experimental models for breast CSCs (BCSCs), we used estrogen receptor (ER)-α-positive MCF-7 cells grown as mammospheres. This culture system has been used to characterize, enrich and propagate breast cancer cells with stem-like phenotype, relying on the feature of stem cells to escape anoikis and grow as spheroids in anchorage-independent conditions (Dontu G et al., 2003). MCF-7 mammosphere cells were characterized by flow cytometric analysis that revealed an enrichment of CD44+ / CD24− subpopulation compared to MCF-7 monolayer cells (Figure 5A). In addition, real-time PCR further revealed that genes associated with stem cell phenotype, including OCT4, N-CAD, BMI1, SOX4, were expressed in mammosphere cells at higher levels than in monolayer cells (Figure 5B). Moreover, MCF-7 mammosphere cells were also analyzed for the expression of ERα (Figure 5C and 5D).
Figure 5: Characterization of MCF-7 cells grown as mammospheres: A) Flow cytometric analysis of CD44+ /CD24− phenotype in MCF-7 monolayer cells, and in MCF-7 cells grown as primary (MCF-7-M1) and secondary-mammospheres (MCF-7-M2). B) OCT4, N-CAD, BMI1 and SOX4 mRNA content evaluated by real-time RT–PCR in MCF-7, MCF-7-M1 and MCF-7-M2 cells.
Results
24
Each sample was normalized to its GAPDH mRNA content. The values represent the means ± s.d. of three different experiments each performed in triplicate. *p < 0.05. C) Immunoblotting for estrogen receptor (ER)-α in MCF-7-M1 and MCF-7-M2 cells. GAPDH as loading control. D) Immunofluorescence of ERα and DAPI staining (for nuclei detection) in M1 and MCF-7-M2 cells. Small squares, negative control.
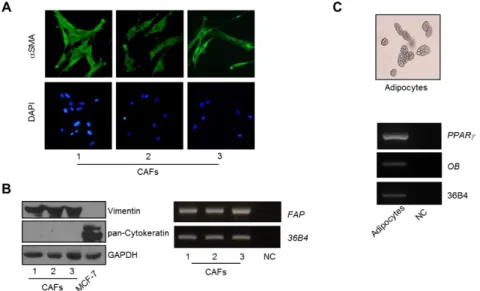
As stromal cells, we used either CAFs isolated from biopsies of primary breast tumors or human breast adipocytes obtained after preadipocyte differentiation. CAFs possessed the basic fibroblast characteristics with long and spindle-shaped morphology and highly expressed alpha-smooth muscle actin (α-SMA), vimentin, and fibroblast activation protein (FAP) (Figure 6A and 6B). Adipocytes displayed a classical morphological phenotype characterized by accumulation of lipid droplets associated with the expression of specific markers as PPARγ and leptin (OB) ( Figure 6C).
Figure 6: Characterization of stromal cells used in this study. A) Cancer Associated Fibroblasts (CAFs) were isolated from primary breast tumour biopsies by collagenase digestion. Immunofluorescence of alpha-smooth muscle actin (α-SMA) and DAPI staining (for nuclei detection). B) Left panel, immunoblotting of Vimentin and pan-Cytokeratin protein expression, GAPDH as loading control. Rigth panel, RT-PCR analysis of Fibroblast Activation Protein (FAP) mRNA levels. C) Subcutaneous preadipocytes from breast tissues were stimulated to differentiate into mature adipocytes. Upper panel, a typical bright-field picture of adipocytes characterized by accumulation of lipid droplets; lower panel, RT-PCR analysis, for expression of the specific adipocyte markers PPARγ and leptin (OB). 36B4 (internal standard). NC, negative control.
25
Using co-culture experiments, we examined mammosphere formation from MCF-7 cells in the presence or absence of conditioned media (CM) harvested from CAFs and adipocytes. Compared to the cells cultured alone, MCF-7 cells co-cultured with CAF- or adipocyte-derived CM showed a significant enhancement in mammosphere forming efficiency (MFE) (Figure 7A). Stem cells are maintained in the primary mammospheres through self-renewal, and are able to give rise to secondary mammospheres when cells from the primary spheres are dissociated and allowed to grow in anchorage-independent conditions. Therefore, we carried out secondary mammosphere cultures to examine the effects of CM on BCSC self-renewal. Our experiments demonstrated an increased self-renewal in MCF-7 cells treated with CAF- and adipocyte-derived CM in the first generation compared with the untreated spheres (Figure 7B and 7C). These data suggest that BCSC activity is influenced by soluble factors secreted from stromal cells. Thus, given the role of leptin as an important cytokine secreted by both CAFs and adipocytes, we assessed the impact of leptin in the context of the heterotypic signaling working in BCSC–stromal interactions. First, ELISA measurement in CM from stromal cells showed that leptin levels were 2,4 ± 0,12 ng/mg protein and 20,32 ± 2 ng/mg protein in CAF and adipocyte-derived CM, respectively. Leptin was then immunodepleted from CAF- and adipocyte-derived CM using a specific leptin antibody, and resulting media were tested for the ability to induce mammosphere formation in breast cancer cells. AS shown in Figure 7D and 7E, leptin depletion significantly decreased the MFE/self-renewal promoted by stromal cell-derived CM.
Results
26
Figure 7: Leptin mediates the effects of stromal cell-CM on breast cancer cell mammosphere formation. A) Mammosphere Forming Efficiency (MFE) evaluated in MCF-7-M1 and MCF-7-M2 (B) in the presence or absence (−) of CAF- and Adipocyte-derived Conditioned Media (CAF-CM and Adipo-CM, respectively). MFE was calculated by dividing the number of mammospheres (colonies >50 μm) formed by the number of the cells plated and expressed as fold change compared to untreated cells (−). C) Representative phase-contrast images of mammospheres treated as in panel (B) are shown. MFE evaluated in MCF-7-M1 (D) and MCF-7-M2 (E) in the presence or absence (−) of leptin-immunodepleted CAF-CM and Adipo-CM (-Lep). IgG: CM immunodepleted with nonspecific antibody. The values represent the means ± s.d. of three different experiments each performed in triplicate. *p < 0.05.
Targeting leptin signaling reduces stem cell activity mediated by stromal
cells
Our previous experiments indicate that leptin may represent an important paracrine molecule that mediates the interaction between stromal cells and BCSCs. To support this observation, we tested the effect of a full leptin receptor antagonist, peptide LDFI, on BCSC activity. We have previously shown that this peptide inhibits leptin induced breast cancer growth in vitro and exhibits antineoplastic activities in vivo (Catalano S et al., 2015). Our data demonstrated that treatment with peptide LDFI significantly reduced MFE/self-renewal promoted by stromal cell-derived CM in MCF-7 cells (Figure 8A). To extend the results obtained, we have grown the ERα-negative MDA-MB-231
27
breast cancer cells as mammospheres and evaluated the effects of CAF- or adipocyte-CM in the presence or absence of peptide LDFI. Treatment of MDA-MB-231 mammosphere cultures with CAF- or adipocyte-derived CM significantly increased MFE/self-renewal and the addition of the OBR antagonist LDFI strongly reduced these effects (Figure 8B), confirming that leptin/leptin receptor may play a crucial role in maintaining the BCSC traits mediated by stromal cells in different cellular backgrounds.
Figure 8: Effects of a selective leptin receptor antagonist on breast cancer stem cell activity. MFE evaluated in MCF-7-M1 and MCF-7-M2 (A) and in M1 and MDA-MB-231-M2 (B) treated with CAF-CM and Adipo-CM with/without peptide LDFI (1 μg/ml). The values represent the means ± s.d. of three different experiments each performed in triplicate. *p < 0.05.
Results
28
Leptin signaling regulates mammosphere formation/self-renewal
activity of breast cancer cells
Having shown that stromal cells regulate BCSC activity through secretion of leptin, we next investigated the direct involvement of this cytokine in the regulation of mammosphere formation/self-renewal in MCF-7 cells. In agreement with previous data demonstrating that leptin receptor plays a crucial role in maintaining cancers in a stem cell-like state (Feldman DE et al., 2012; Zheng Q et al., 2011 & 2013; Chang CC et al., 2015), we found that MCF-7 mammosphere cultures exhibited increased OBR mRNA expression and in a greater extent the long isoform, compared to monolayer cells (Figure 9A). Leptin treatment of mammosphere cultures resulted in a significant increase in MFE/self-renewal and in an enhanced percentage of CD44+/CD24− population compared with untreated cells (Figure 9B, 9C and 9D).
Figure 9: Leptin induces MFE in breast cancer cells. A) Leptin receptor long (OBRL) and short (OBRS) isoform mRNA levels, evaluated by real time RT-PCR, in MCF-7, M1 and MCF-7-M2 cells. Each sample was normalized to its GAPDH mRNA content. B) MFE in MCF-7-M1 and MCF-7-M2 in the presence or absence (−) of leptin 500 ng/ml (Lep). C) Representative phase-contrast images of mammospheres treated as in panel (B) are shown. D) CD44+/CD24− population in MCF-7-M2 cells treated or not (−) with Lep. The values represent the means ± s.d. of three different experiments each performed in triplicate. *p < 0.05.
29
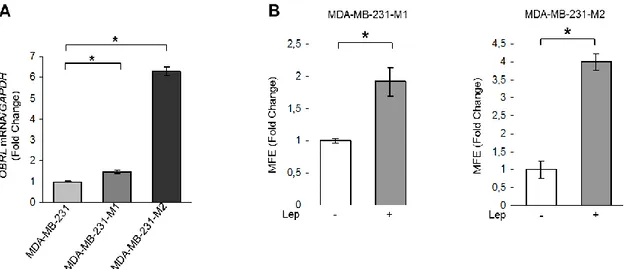
Accordingly, in MDA-MB-231 mammosphere cultures, we observed a significant increase in the long isoform of OBR mRNA expression compared to monolayer cells (Figure 10A), and an enhanced MFE/self-renewal after leptin exposure (Figure 10B), demonstrating that this cytokine can directly regulate BCSC activity.
Figure 10. Leptin induces MFE in ER- breast cancer MDA-MB-231 cells. A) Leptin receptor long (OBRL) mRNA content evaluated by real-time RT–PCR in MDA-MB-231, MDA-MB-231-M1 and MDA-MB-231-M2 cells. Each sample was normalized to its GAPDH mRNA content. B) MFE evaluated in MDA-MB-231-M1 and MDA-MB-231-M2 cells (C) in the presence or absence (−) of leptin 500 ng/ml (Lep) in the mammosphere culture media. The values represent the means ± s.d. of three different experiments each performed in triplicate. *p < 0.05.
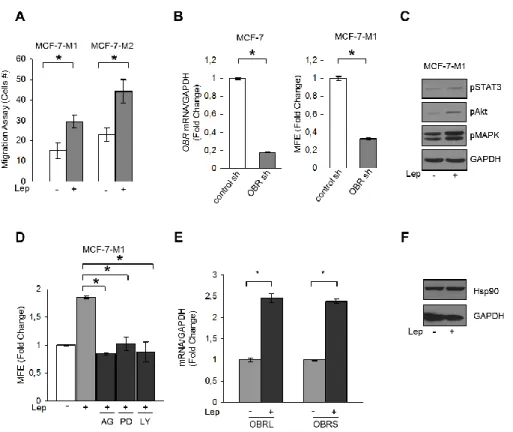
Since BCSCs display increased cell motility and invasion, we tested the effects of leptin on the migratory potential of MCF-7 mammospheres. Our data clearly showed that leptin exposure increased the number of migrated cells suggesting that this cytokine can facilitate the invasive behavior of BCSCs (Figure 11A). Next, OBR expression was stably knocked-down using lentiviral delivered short hairpin RNA (OBR sh) in MCF-7 cells (Figure 11B left panel). Suppression of OBR expression led to a significant inhibition of MFE (Figure 11B right panel), implying that this gene is necessary for maintaining cancer stem-like properties in breast cancer cells. In addition, we observed that leptin treatment induced the phosphorylation of specific OBR downstream signaling molecules such as STAT3, Akt and p42/44 MAPK (Figure 11C). As expected, the increase in MFE induced by leptin was reversed by the JAK2-STAT3 inhibitor AG490, the MEK1 inhibitor PD98059 and the PI3K/AKT inhibitor LY294002 (Figure 11D), suggesting that leptin promotes stem cell properties via activation of classical leptin
Results
30
signaling pathways. In agreement with these observations, we also found an up-regulation of well-known leptin target genes as ObR and the heat shockp rotein 90 (HSP90) (Giordano C et al., 2013) in MCF-7 cells treated with leptin (Figure 11E and 11F).
Figure 11: Leptin signaling directly induces BCSC activity in breast cancer cells. A) Transmigration assays in MCF-7-M1 and MCF-7-M2-derived cells treated or not (−) with Lep. B) MCF-7 cells were stably transfected with either a scrambled shRNA (control-sh) or OBR shRNA (OBR-sh). OBRL mRNA content was evaluated by real time RT-PCR (left panel). Each sample was normalized to its GAPDH mRNA content. MFE in MCF-7-M1 derived from either control-sh or OBR-sh clones (right panel). C) Immunoblotting of phosphorylated (p), STAT3 (Tyr705), Akt (Ser473), and MAPK (Thr202/Tyr204) at the indicated residues measured in cellular extracts from M1 cells treated or not (−) with Lep. GAPDH, loading control. D) MFE in MCF-7-M1 treated with Lep and AG490 (AG-20 μmol/L), PD98059 (PD-10 μmol/L) or LY294002 (LY-10 μmol/L). E) Leptin receptor long (OBRL) and short (OBRS) mRNA content evaluated by real-time RT–PCR in MCF-7-M1 cells in the presence or absence (−) of leptin 500 ng/ml (Lep). Each sample was normalized to its GAPDH mRNA content. F) Immunoblotting analysis of HSP90 levels in total protein extracts from MCF-7-M1 cells in the presence or absence (−) of leptin 500 ng/ml (Lep) in the mammosphere culture media. GAPDH was used as loading control.The values represent the means ± s.d. of three different experiments each performed in triplicate. *p < 0.05.
31
Gene expression profiling in leptin or stromal CM-treated
mammosphere-derived cells
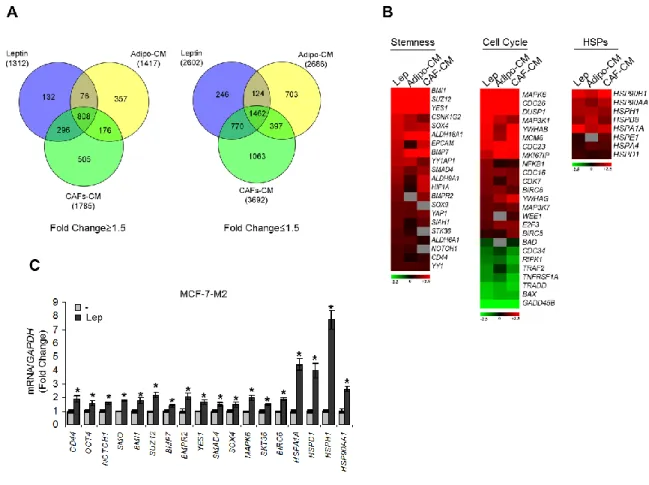
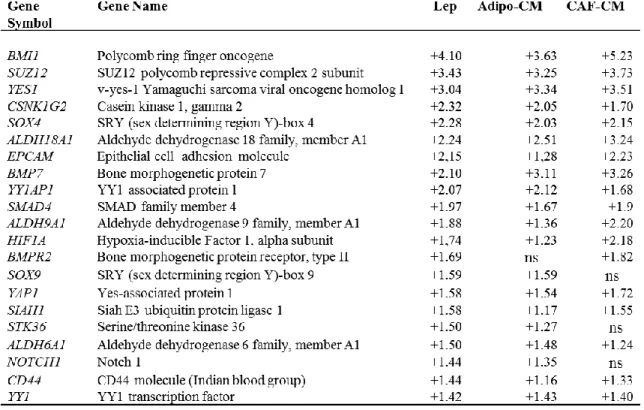
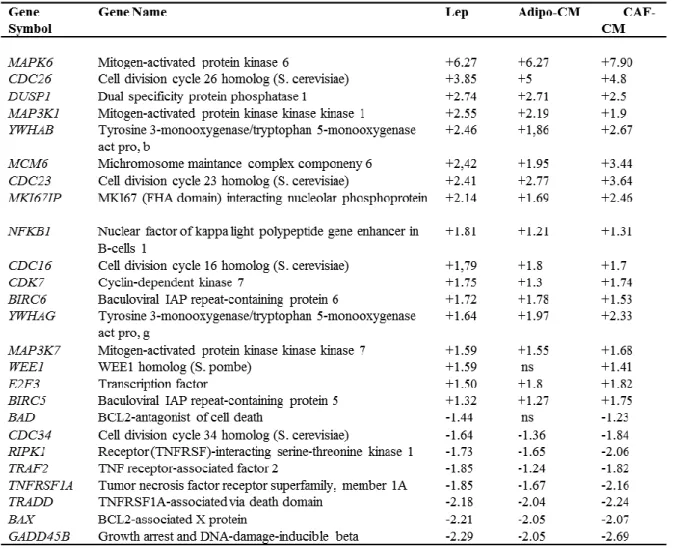
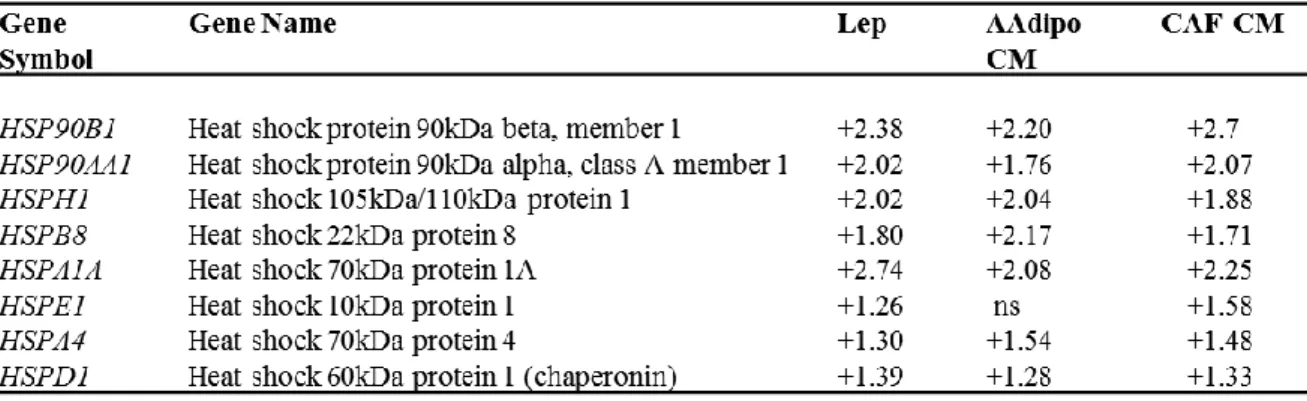
To determine whether leptin, CAF- and adipocyteCM may similarly affect gene expression profile in mammosphere-derived cells, we performed gene expression profiling analysis on total RNA extracted from the second generation spheres. Microarray results highlighted several RNAs differentially expressed in treated vs untreated MCF-7 mammospheres. Venn diagram analysis was used to compare the gene lists and to identify those genes that are unique and in common among the three treatments (Figure 12A). A total of 2270 transcripts were commonly regulated in all treated samples (808 up- and 1462 down-regulated transcripts, respectively). It should be noted that the global overlap among genes expressed in treated samples includes a number of genes known to play a role in stem cell biology such as BMI1, SUZ12, YES1, SOX4 (Figure 12B, left panel, Table 3). Similar trends were also observed for the expression of other genes involved in cell cycle control (Figure 12B, middle panel, Table 4). Moreover, treated samples displayed up-regulation of some transcripts related to the heat shock protein family, that recently have been suggested to be crucial in sustaining proliferation and self-renewal of stem cells (Isolani ME et al.,
2012), (Figure 12B, right panel, Table 5). To validate our microarray study MCF-7
mammospheres treated with leptin were evaluated for the expression of a panel of genes by using real-time PCR (Figure 12C). Taken together, gene expression profile analyses strongly support the role of leptin as a crucial paracrine molecule able to mediate the microenvironment effects on BCSC activity.
Results
32
Figure 12: Gene expression profiling in mammosphere cultures treated with stromal cell-CM or leptin. A) Venn diagram of up-(left panel) and down-(right panel) regulated transcript identified by microarray analysis in MCF-7-M2 cells treated with CAF-CM, Adipo-CM or Lep compared to untreated samples. B) Heat-maps of stemness genes, cell cycle related-genes and HSP family related-genes from microarray data. Gene expression changes were calculated in treated cells with respect to the untreated controls. Transcript showing a DiffScore ≤ − 30 and ≥ 30, corresponding to a p-value of 0.001, and significant fold change in treated vs untreated ≥ 1.5 were considered. C) Real-time RT-PCR validation of a subset of genes in MCF-7-M2 cells treated or not (−) with Lep. Each sample was normalized to its GAPDH mRNA content. The values represent the means ± s.d. of three different experiments each performed in triplicate. *p < 0.05 vs untreated (−) sample.
33
Table 3. Selection of relevant modulated genes involved in stem cell biology in MCF-7
M2 derived cells.
Numbers represent the ratio of the values of treated compared with untreated MCF-7 M2 spheres obtained by microarray data analysis. Statistical significance was calculated with the Illumina DiffScore, only genes with a DiffScore ≤−30 and ≥30, corresponding to a p-value of 0.001, were considered as statistically significant. ns: non significant.
Results
34
Table 4. Selection of relevant modulated genes involved in cell cycle control in MCF-7
M2 derived cells.
Numbers represent the ratio of the values of treated compared with untreated MCF-7 M2 spheres obtained by microarray data analysis. Statistical significance was calculated with the Illumina DiffScore, only genes with a DiffScore ≤−30 and ≥30, corresponding to a p-value of 0.001, were considered as statistically significant. ns: non significant.
35
Table 5. Expression profile of Heat shock protein family related genes in MCF-7 M2
derived cells.
Numbers represent the ratio of the values of treated compared with untreated MCF-7 M2 spheres obtained by microarray data analysis. Statistical significance was calculated with the Illumina DiffScore, only g enes with a DiffScore ≤−30 and ≥30, corresponding to a p-value of 0.001, were considered as statistically significant. ns: non significant.
Leptin increases patient-derived mammosphere formation/self-renewal
activity
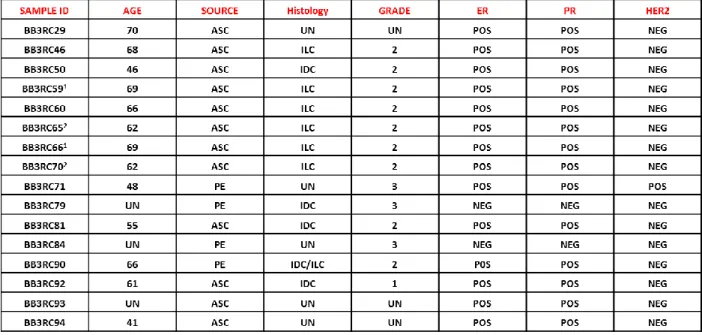
The role of leptin in the regulation of BCSC activity was then evaluated by using patient-derived breast cancer cells isolated from metastatic ascites or pleural effusions. Tumor histology, grade, hormone receptors and HER2 status of the primary tumors were reported in Table 6.
Results
36
Table 6. Summary of metastatic patients-derived cancers.
1,2
These samples were obtained at different time points from the same patients
Sixteen patient-derived breast cancer samples were used in this study. Tumor histology and grade for metastatic samples (ASC and PE) relates to the primary cancer. Abbreviation: UN unknown, PE pleural effusion, ASC ascites sample, ILC invasive lobular carcinoma , IDC invasive ductal carcinoma, POS positive, NEG negative, ER Estrogen Receptor, PR Progesterone Receptor, HER2, epidermal growth factor receptor 2.
Mammosphere cultures treated with leptin resulted in a significant increase in MFE compared to untreated samples (n = 10, Figure 13A). Secondary mammosphere formation was observed only in four samples and treatment with leptin significantly increased self-renewal in three of them (Figure 13B). Besides, four human metastatic samples taken from patients with breast cancer were also treated with peptide LDFI. MFE induced by leptin was significantly decreased with the addition of LDFI (Figure 13C). Interestingly, treatment with peptide LDFI alone reduced the mammosphere formation, underlying how this peptide negatively interferes with leptin autocrine loop (Figure 13C). Then, to investigate the direct involvement of OBR in the regulation of mammosphere formation, OBR gene expression was analyzed in cells from metastatic ascites and pleural effusion fluids using microarray data. There was a significant direct correlation between the expression of OBR RNA in cells from the metastatic fluids and MFE (r = 0.68; p = 0.05, Figure 13D). In agreement with the microarray data obtained in
37
MCF-7 mammospheres, a significant correlation between MFE and HSP90 gene expression in the same metastatic patient-derived samples (r = 0.71; p = 0.036) was also observed (Figure 13E). These data suggest that patients with higher levels of OBR and HSP90 mRNAs in cells of metastatic fluids have greater ex vivo CSC activity.
Figure 13: Leptin enhances mammospheres formation/self-renewal activity in patient-derived metastatic cells. 10 metastatic fluid samples obtained from breast cancer patients (BB3RC59/BB3RC66/BB3RC71–94) undergoing palliative drainage of symptomatic ascites or pleural effusions were used (Table 1). MFE in metastatic patient-derived cells grown as primary Metastatic sample M1 (A) or secondary Metastatic sample M2mammospheres (B) in the presence or absence (−) of Lep. C) MFE in 4 Metastatic sample M1 untreated (−) or treated with Lep, peptide LDFI (1 μg/ml), and Lep+LDFI. The values represent the means ± s.d. of three different experiments each performed in triplicate. *p < 0.05. n.s.: non significant. D-E) Correlation between OBR or HSP90 mRNA expression in cells of the metastatic fluids and MFE (8 patients/BB3RC29–70) (Pearson correlation coefficient, r = 0.68, p = 0.05; r = 0.71, p = 0.036, respectively).
Results
38
OBR expression correlates with reduced overall survival in breast
carcinomas
To investigate the clinical significance of OBR gene expression in human breast cancers the relationship between OBR levels and overall survival (OS) of breast cancer patients (n = 781) was estimated by Kaplan–Meier analysis. Survival curves indicated that women with high OBR expression exhibited a lower rate of OS than those with low OBR expression (HR = 1.9, p = 0.022) (Figure 14A). Similarly, breast carcinoma patients with high HSP90 expression had decreased OS compared with those with low HSP90 expression (HR = 2.2, p = 0.00017) (Figure 14B). Basal-like breast cancer is an aggressive tumor subtype, composed by primitive undifferentiated cells Indeed, basal-like breast tumors, which are enriched for CD44+/CD24− cells, exhibit epithelial– mesenchymal transition features and express high levels of stem cellregulatory genes (May CD et al., 2011;Ben-Porath I et al., 2008; Honeth G et al., 2008; Park SY et al.,
2010; Sarrió D et al., 2008). In agreement with these observations, the results of the
Kaplan-Meier analysis indicated a more relevant discrimination in terms of overall survival between high and low expression of OBR and HSP90 in basal breast cancer patients (n = 143) (HR =4.4, p = 0.011; HR = 5.2, p = 0.013 respectively) (Figure 14C and 14D).
39
Figure 14: Correlation between OBR and HSP90 mRNA levels and overall survival in breast cancer. Kaplan–Meier survival analysis in breast carcinoma patients (n = 781) with high and low OBR (A) or HSP90 (B). expression analyzed as described in Materials and Methods. Kaplan– Meier survival analysis in basal breast cancer patients (n = 143) with high and low OBR (C) or HSP90 expression (D). Kaplan-Meier survival graph, and hazard ratio (HR) with 95% confidence intervals and logrank Pvalue.
40
AIM 2
Investigation of the role of NOTCH4
signaling in breast cancer stem cell
activity induced by endocrine
treatments
41
BCSC activity is enriched by Tamoxifen and Fulvestrant
Having shown that among the extrinsic signals, leptin is an important molecule that mediates the interaction between stromal cells and BCSCs, we next investigated the role of Notch4, as an intrinsic signal, on the regulation of BCSC activity, in particular induced by anti-estrogen treatments. First, we tested the effect of Tamoxifen on the mammosphere formation efficiency of patient-derived ER+ tumor cells, whose characteristics are summarized in table 7.
Table 7. Summary of metastatic patients-derived cancers.
1,2 These samples were obtained at different time points from the same patients
Abbreviations: IDC: invasive ductal carcinoma; ILC: invasive lobular carcinoma; FEC: 5‐FU, Epirubicin and Cyclophosphamide; ECF: Epirubicin, Cisplatin, 5‐FU; EOX: Epirubicin, Oxaliplatin, Capecitabine; ND: not determined.
NB: ER, PR and HER2 were assessed in the primary breast cancer tissue sample.
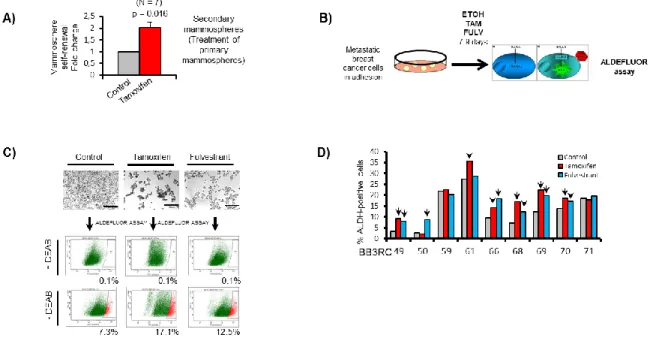
Primary mammospheres cultured in the presence of ethanol (Control) or 10-6 M 4-hydroxy-tamoxifen (Tamoxifen) were dissociated and re-plated in secondary mammosphere suspension culture for a further 7–9 days to measure self-renewal of mammosphere initiating cells treated in the first generation. We found that Tamoxifen increases mammosphere self-renewal by about 2-fold (Figures 15A). Next, nine patient samples were grown in adherence and treated with Tamoxifen or Fulvestrant for 7-9 days to evaluate the ALDH activity, another functional assay for CSCs (Figure 15B ). Our results showed a significant increase in ALDH enzymatic activity after Tamoxifen and
Results
42
Fulvestrant treatment compared to the control condition (Figures 15C and 15D).These data suggest that endocrine therapies, given for a period of a few days, enrich for stem cell activity.
Figure 15: Tamoxifen or Fulvestrant treatment of ER+ patient-derived samples enriches for cells with CSC properties. A) Mammosphere self-renewal of freshly isolated ER+ early and metastatic patient-derived samples. p value was calculated with Wilcoxon signedrank test. B) metastatic BC cells were treated in adherence with Tamoxifene and Fulvestrant and then processed for FACS analysis. C) representative micrographs of metastatic BC cells before fluorescence-activated cell sorting (FACS) analysis of ALDH1 enzymatic activity (ALDEFLUOR assay). ALDH-positive cells were discriminated from ALDH-negative cells using the ALDH inhibitor DEAB. D) Percentage of ALDH-positive cells in nine ER+ metastatic BC patient-derived samples. Arrows indicate fold change greater than 20% compared to control.
Then, we tested the in vivo impact of endocrine therapies on stem cell activity in ER+ BC using PDXs grown subcutaneously in mice. We used both an early (HBCx34) and metastatic (BB3RC31) ER+ PDX tumor that both maintain biological characteristics, such as the expression of ER, PR and HER2 (Figure 16A) and estrogen dependence (Figure 16B) of the patient primary tumor from which they were derived. Using a 14-day in vivo ‘‘window’’ treatment (Figure 16C), we showed that both Tamoxifen and
43
Fulvestrant treatment decrease proliferation (Figure 16D). However, there is an increase in MFE and ALDH enzymatic activity (Figures 16E and 16F), suggesting a mechanism for endocrine resistance driven by enrichment for a stem cell phenotype.
Figure 16: Tamoxifen or Fulvestrant treatment of ER+ patient-derived xenografts enriches for cells with CSC properties. A) Early (HBCx34) and metastatic (BB3RC31) xenograft tumor sections stained for ER, PR, HER2 and Ki67 by immunohistochemistry. Scale bars = 100μm. B) Ovariectomized mice and administration of estrogen in the drinking water (8μg/ml) were used to perform an estrogen dependence test of metastatic BB3RC31 PDX. Graph shows tumor formation and size at 120 days after implantation. Tumor formation was determined by counting tumors greater than 100 mm3 (tumors bigger than 100 mm3 are represented by solid forms and tumors smaller than 100 mm3 are represented by hollow forms). Mean of each group is represented by horizontal bar. OveX- Ovariectomized; E2 – Estrogen. C–F) Early (HBCx34) and metastatic (BB3RC31) BC estrogen-dependent PDX tumors treated for 14 days with Tamoxifen (10 mg/kg/day, oral gavage; red bars) or Fulvestrant (200 mg/ kg/week, subcutaneous injection; blue bars). Gray bars correspond to vehicle control. FFPE, formalin-fixed paraffin-embedded. (D) Representative micrographs and quantification of Ki67 expression determined by immunohistochemistry (IHC). (E) Percentage of MFE. (F) ALDH-positive cells (%) determined using the ALDEFLUOR assay.
Results
44
Tamoxifen or Fulvestrant treatment upregulates Notch target genes
Recently, the contribution of Notch pathway in endocrine therapy resistance has been reported by several studies (Magnani L et al., 2013;O’Brien CS et al., 2011; Yun J et al.,2013). In particular, it has been demonstrated that Notch signaling is increased in
endocrine therapies resistant cells and their growth can be abrogated by blocking Notch signalling, which is activated in these cells. According with these observations, we found, in ER+ cell lines, MCF-7, T47D, and ZR-75-1, an increased expression of Notch target genes, preferentially HEY1 and HES1, after Tamoxifen or Fulvestrant tratment for 6 days (Figure 17A). Similarly, in tamoxifen-resistant (TAMR) or fulvestrant-resistant (FULVR) MCF-7 models, which have acquired resistance after longterm Tamoxifen or Fulvestrant treatment, we found an upregulation of Notch target genes and increased Notch transcriptional activity (Figure 17B).
In addition, the BC PDX tumors treated in vivo with Tamoxifen or Fulvestrant for 2 weeks showed increased HEY1 and HES1 expression (Figure 17C), supporting an increased role for the Notch signaling pathway after endocrine therapies.
Taken together these data, strongly support the hypothesis that Notch signaling is highly activated in endocrine-resistance context.
45
Figure 17: Tamoxifen or Fulvestrant treatment increases Notch target genes expression in ER+ cancer cell lines and ER+ patient-derived xenografts. A) Expression of Notch target genes HEY1 and HES1 was assessed by quantitative real-time PCR analysis and compared to control to determine fold change. MCF-7, T47D and ZR-75-1 cells were treated with 10-6 M tamoxifen (red bar) and 10-7 M fulvestrant (blue bar) for six days. B) Expression of HEY1 and HES1 in endocrine-resistant cells compared to the parental MCF-7 cells (two left hand panels). Notch transcriptional activity in endocrine-resistant cells compared to control was determined by relative firefly luciferase activity of 10x CBF1 reporter (right hand panel).C) Early (HBCx34) and metastatic (BB3RC31) BC PDXs: the effect of in vivo treatment for 14 days with tamoxifen (10 mg/kg/day, oral gavage) or fulvestrant (200 mg/kg/week, subcutaneous injection) on HEY1 and HES1. Data are represented as mean ± SEM. * p < 0.05, ** p < 0.01
JAG1 and NOTCH4 receptor signaling drives endocrine resistance
Notch pathway comprises five ligands in the sending cell that bind to any of four receptors present on the signal-receiving cell. In order to understand which Notch receptors and ligands are regulated by anti-estrogen treatments, we assessed their expression in parental, TAMR, and FULVR cell lines. NOTCH4, its intracellular domain (ICD) and HES1 were upregulated (figure 18A left panel) while NOTCH1, -2, and -3 were downregulated (Figure 18A middle panel) in the resistant versus parental cell lines. Moreover, the Notch ligand JAG1 was found to be highly expressed in both resistantResults
46
models, while the expression of ligands DLL1 and DLL4 was unchanged (Figure 18A right panel). JAG1 and NOTCH4-ICD were also upregulated after 14-day window treatment of PDXs in vivo and short-term treatment with Tamoxifen or Fulvestrant of MCF-7 cells in vitro, suggesting that activation of Notch signaling (demonstrated by increased HES1 expression) is an early event in the acquisition of endocrine resistance (Figures 18B and 18C).
Figure 18: Notch receptors and ligands expression in the resistant models used in the study. A) Notch receptors and Notch ligands protein expression levels determined by Western Blot in MCF-7 endocrine-resistant cells. B) NOTCH4, HES1, and JAG1 protein expression levels determined by western blot in metastatic (Met) (BB3RC31) BC PDX. (C)NOTCH4, HES1 and JAG1 protein expression levels determined by Western Blot in MCF-7 cells treated with 10-6 M Tamoxifen and 10-7 M Fulvestrant for 6 days. β-actin was used as a reference for the loading control.
To further confirm the role of NOTCH4 activity in endocrine resistance and the stem cell phenotype, we analyzed loss-of-function phenotypes for NOTCH4-ICD in MCF-7 cells using CRISPR-cas9 approach.