UNIVERSITÀ DELLA CALABRIA
Facoltà di Scienze MM.FF.NN.
Dipartimento di Ecologia
________________________________________
PhD thesis, Doctorate Research Program in Plant BiologySettore Scientifico Disciplinare BIO 01 XXII Cycle (2006-2009)
Transcriptomic response of plants to external biotic and abiotic factors:
- Defense against pathogens in Olea europaea (L.)
- Functional adaptation along environmental clines in Posidonia oceanica
(L) Delile
Coordinator Prof.A. Musacchio
Supervisor Doctoral student
Prof.ssa A.M. Innocenti Dott.ssa Emanuela Dattolo Co-supervisor Dr. G. Procaccini
________________________________________
Novembre 20092
CHAPTER 1 – GENERAL INTRODACTION AND SCOPE OF THESIS 4
1.1-ADAPTATION AT ENVIRONMENT 2
1.2- STUDY ON ADAPTATION: MOLECULAR APPROACHES 10
1.3-SCOPE OF THESIS 11
CHAPTHER 2 –TARGET SPECIES 12
2.1- OLEA EUROPAEA L. 13
Biological aspects, Genetic resources, Economic contest, Defense against pathogens 2.2- POSIDONIA OCEANICA L. (DELILE) 15
Biological aspects, Ecological features and Genetic diversity CHAPTER 3 – PLANT DEFENSE IN OLEA EUROPAEA 22
3.1-MATERIAL AND METHODS 29
3.2-RESULTS 31
3.3-DISCUSSIONS 47
CHAPTER 4 – FUNCTIONAL ADAPTATION IN POSIDONIA OCEANICA 49
4.1-MATERIAL AND METHODS 55
4.1.1 Estimation of the Genome Size 53
4.1.2 Building of Suppression Subtractive Hybridization (SSH) Library 56
4.1.2.3 Dr. Zompo a EST Seagrasses Database 62
4.2-RESULTS 64
4.2.1 Estimation of the Genome Size 62
4.2.2 Subtractive Hybridization (SSH) Library 65
4.3-DISCUSSIONS 84
CHAPTER 5 – GENERAL CONCLUSION 93 APPENDIX
REFERENCES
4
CHAPTER 1
GENERAL INTRODUCTION AND SCOPE OF THESIS
1-1 ADAPTATION AT ENVIRONMENT
Phenotypic plasticity occurs when variability in an environmental stimulus leads individuals of the same genotype to develop into alternative phenotypes (Stearns, 1989).
Because phenotypic plasticity can be an adaptation to variable environments, it is becoming increasingly recognized that understanding its regulation and evolution may offer general insights into the genetic and developmental bases of morphological evolution (Pigliucci, 1996)
The interaction between genotype and phenotype has often been conceptualized by the following relationship: genotype + environment → phenotype, a slightly more nuanced version of the relationships is: genotype + environment + random-variation → phenotype.
Genotypes often have much flexibility in the modification and expression of phenotypes. In many organisms phenotypes can be very different under varying environmental conditions. Phenotypic variation among individuals can range from being largely of genetic origin, to being largely caused by environmental variation; extreme conditions can influence both the expression of phenotypic variability and the extent to which it is genetically determined (Jablonka and Lamb 1995; Parsons, 1996).
Environmental changes can directly affect the genetic information carried by organisms and the expression of variation in characters. Environmental effects have been detected by looking at the way different conditions influence mutation rates, recombination rates, the stability of an organism’s development, and the way genes interact with the environment to produce phenotypes. Rapid changes under extremes can alter traits other than those under selection; these results from the phenomenon of “pleiotropy” where the same gene influences more than one trait: e.g. gene controlling levels of a hormone are expected to have pleitropic effects because hormones tend to influence multiple physiological processes (Hoffmann and Parsons 1997).
5
Tolerance range is also correlated with phenotypic plasticity, defined as the extent to which the phenotype associated with a particular genotype can be altered by the environment.A high level of plasticity means that environmental factors have a strong influence on the particular phenotype that develops. If there is little plasticity, the phenotype of an organism can be reliably predicted from knowledge of the genotype, regardless of environmental peculiarities during life-cycle.
Genes controlling the expression of novel characters can be selected once the environment is stressful even if effects of these genes are not evident under optimal environmental conditions. Continued selection of the novel characters could favor genes that lead to the expression of novelties even in the absence of a stress; in these conditions the natural selection acts on phenotypes to favor the emerging of the genotypes better adapted to particular range of ecological conditions. Natural populations show a range of variation in phenotypic traits among individuals. Traits that improve competitive ability are thereby selected, and these increase in frequency in a population. The population evolves as traits improving competitive ability are favored, and evolutionary change is largely driven by competitive interactions between individuals (Hofmann and Parsons 1997). Presence of variations among individuals suggests that populations have the potential to evolve and adapt when they encounter unfavourable conditions, but during periods of severe stressful populations can reduce in size and age structure. In extreme cases, stresses may result in the extinction of populations and reduction in the area occupied by a species, and this is truer in populations that live at the boarders of species distributions where conditions can be often marginal to survival (Hofmann and Parsons 1997). These changes can have evolutionary consequences by influencing the ability of populations to adapt to the stressful conditions and to other environmental changes.
Environmental changes can cause the physical fragmentation of species habitat, and when populations remain isolated, population size is reduced. Geographical isolation has a strong influence on the gene flow among populations. The reduction of genetic exchange caused the increasing of inbreeding in a population, small populations are also more prone to loose genetic variation by the process of “genetic drift”. Small, inbreed and less genetically diverse populations are more fragile to external impacts and less capable to adapt to new conditions. From another point of view, genetic isolation among populations can favor the emerging of “ecotypes” or groups of individuals better adapted at the new ecological range.
Understanding why an organism occupies a particular geographic and environmental range could allow predictions of the response to environmental changes and ecological studies of populations
6
living at geographic and environmental extremes can allow the identification of relevant factors constraining species distribution
About the term “Stress”
Biologists used the word “stress” in different ways and different contexts with reference to several forces; generically they refer to stress as a disturbance of the normal steady state (homeostasis) of a biological system.
For Hofmann and Parson (1991), two components are involved in dealing with stress, “the external and internal forces that are applied to organisms and change in biological systems that occur as a consequence of these forces” (Hofmann and Parson, 1991). The degree of stress caused by an environment can only be evaluated in relation to the organism or population experiencing this environment. The term “stress” is moreover used to indicate either the environmental or the biological component. From an evolutionary perspective the environmental force and the biological response should be viewed as integrative.
Stress effects can be analyzed at different biological levels, namely molecular, physiological, and both in single individuals and in populations. Sensitivity at one level does not necessary have to become manifest at another. Phenotypic plasticity, for example, may prevent biochemical changes from being revealed at the individual level, but this process itself may be costly and may be revealed as a change in fitness. Finally, the use of the term “stress” is often associated with the intensity of the stress. The environment is considered to be stressful only if the response it caused exceeds an arbitrary threshold, or when more than a certain fraction of the population is affected.
The interest to study environmental stress has been stimulated by the development in molecular genetics techniques. These have revealed that most organisms evolved sophisticated mechanisms to cope with different environmental stresses such as heat shock proteins to counteract thermal and other stresses, mixed function of enzymes like superoxide dismutase, catalase, glutathione-S-transferase, which contributes somehow to stress tolerance, and peculiar enzymatic mechanisms to fight biotic attacks. A genomic approach to stress-studies allows both fine-scale investigation of response at specific stressor and enlightening of the molecular networks that are involved in the homeostasis’ restoring
7
In the last century global warming and anthropogenic pressure, with consequences such as climatic shifts, chemical pollution and habitat destruction, represent increasing threats for the ecosystems on this planet as well as for the survival of the human community.
Therefore understanding the mechanisms underlying responses of organisms at stressor is of paramount importance to evaluate rate of species plasticity.
Acclimation and response to stress
The perception of stressful conditions will determine its transduction and subsequent responses, including various changes in the activity of single enzymes or changes in several metabolic pathways
Extreme of abiotic factors can cause death when the physiological tolerance limits of organisms are exceeded. These limits can be very different for different species and for different developmental stage of the same organisms. Tolerance range is also correlated with phenotype plasticity, defined as the extent to which the phenotype associated with a particular genotype can be altered by the environment.A high level of plasticity means that environmental factors have a strong influence on the particular phenotype that develops. If there is little plasticity, the phenotype of an organism can be reliably predicted from knowledge of the genotype, regardless of environmental peculiarities during life-cycle.
Plants are particularly exposed to their physical environments, as they cannot move away from disadvantageous surroundings and have to cope with the stress on site, then plants have develop fine-scale mechanisms to protect itself from biotic and abiotic stressors.
Among the most important factors which can affect plant development and survival, we can include light, temperature, chemical pollutants such as heavy metals, and interaction with pathogens and herbivores.
Light
Light affects all aspects during development and growth of plant. Plant responses to light occur in the context of multiple developmental processes, including seed germination, seedling photomorphogenesis, phototropism, gravitropism, chloroplast movement, shade avoidance, circadian rhythms and flower induction (Jiao, 2007). The major threat concerning light limitation is shading as it limits significantly the quantity of light perceived by the plant, in particular red and blue wavelengths photosyntheticaly active radiations.
8
Plants have adopted the ability to sense multiple parameters of ambient light signals, including light quantity (fluency), quality (wavelength), direction and duration. Light signals are perceived through at least four distinct families’ of photoreceptors, which include phytochromes, cryptochromes, phototropins and unidentified ultraviolet B (UVB) photoreceptors (Jiao, et al. 2007 review)
Temperature
The effect of temperature varies extensively, from freezing to hot and cold and freezing conditions are two relevant factors limiting the distribution of plant species. Heat shock proteins were first identified as a set of proteins that exhibit strong induction when cells experience a rapid rise in temperature of 10°C or more and subsequently were found in plants. Since their discovery, the fundamental function of most of the major heat shock proteins has been determined, and the majority has been recognized as being molecular chaperones (Miernyk, 1997).
Moreover an important part of the thermal adjustment is vernalization or photoperiodic response, which might reflect a complex genetic network response.
Heavy-metal tolerance
There are many areas of the world were anthropogenic activities have increased to a greater or lesser extent by heavy metals. Heavy metals, such as cadmium, selenium, mercury, arsenic etc, are micronutrients essential for plant growth, which can become toxic when present in excess in soil (Clements 2006).
Plants respond to heavy metal toxicity in a variety of different way: responses include immobilization, exclusion, chelation and compartmentalization of the metal ions, and the expression of more general stress response mechanisms such as ethylene and stress proteins which are implicated in metal tolerance in plants (Cobbett et al. 2000).
A common mechanism for heavy metal detoxification in plant is the chelation of the metal by a ligand with metal-binding proteins as Metallothioneins (MTs). Metallothioneins are low-molecular-weight, cysteine-rich metal-binding proteins found in a wide variety of organisms including bacteria, fungi and all eukaryotic plant and animal species. MTs bind essential and non-essential heavy metals, and plants appear to contain many different form of these proteins which can to perform distinct roles in the metabolism of different metal ions metal, likely participate in the uptake, transport, and regulation of metal in biological systems also they are implicated in the
9
detoxification of metal excesses. The effect of metals on the expression of Metallothionein varies with the plant species in certain such as rice (Hsieh et al,1995) was enhanced by certain metals; on the contrary in other species (Okomura et al, 1991) Metallothionein gene expression decrease by copper treatment.
Plant resistant to herbivores and pathogens
Plants’ defense include morphological structures such as thorns, and chemical compounds able to struggle herbivores and pathogens. Through the course of evolution, plants have become nature’s organic chemists par excellence, and collectively synthesize a plethora of secondary metabolites to defend themselves against herbivores and microorganisms and adapt to different types of abiotic environmental stresses. Traditionally, plant defense compounds are grouped into preformed defense compounds (phytoanticipins) forming the first chemical barrier to herbivore and pathogen attack and defense compounds synthesized in response to herbivore or pathogen attack (phytoalexins) (Morant et al, 2008).
In addition to their direct effects on pests and pathogens some secondary metabolites may also be important in defence-related signal transduction (Bouarab et al., 2002). The ability of plants to carry out in vivo combinatorial chemistry by mixing, matching and evolving the gene products required for secondary metabolite biosynthetic pathways is likely to have been key for their survival.
10 1.2- STUDY ON ADAPTATION: MOLECULAR APPROACHES
Biological questions concerning how individuals, populations and ecosystems respond to environmental changes or biotic stress can be seen in different way.
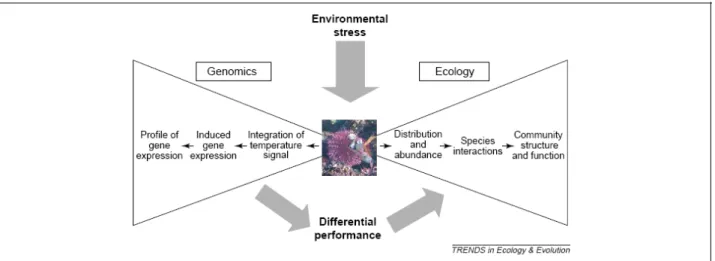
Investigations on biochemical, physiological, morphological and evolutionary mechanisms that underlie stress tolerance need very different approaches (fig1.2.1).
Molecular genetics approach chooses a key gene activated in response to specific factors to decipher the function and the mechanism underlying activation/silencing of these genes.
However, abiotic stress tolerance is a complex trait and, although large numbers of genes have been identified to be involved in the abiotic stress response by genetic approaches, there are large gaps in our understanding of the phenotypic traits involved in the responses.
The recent availability of the genome sequences of certain non-model plant species has enabled the use of strategies, such as genome-wide expression profiling, to identify the genes associated with the stress response. Gene transcription profiling, in particular, is one important step toward identifying those genes and metabolic pathways that underlie ecologically important traits, such as stress tolerance.
Fig 1.2.1 Conceptual diagram for integration of genomics, physiology and ecology in the study of environmental stress. Modified by Hoffman et al, 2005
11 1.3-SCOPE OF THESIS
In this thesis I studied two different plant species, the oleaceae Olea europaea L. and the Mediterranean seagrass Posidonia oceanica L. (Delile), to explore the components and hierarchical structure of the functional adaptation processes that are activated during the plant response to biotic stressors (in O. europaea) and to different environmental conditions (in P. oceanica). I used a “bottom-up” approach to study the plant defence against pathogens in O. europaea; and a “top-down” approach to identify the genetic basis for functional adaptation in P. oceanica.
12
CHAPTER 2
TARGET SPECIES
In the following chapter we selected some information on the biology of Olea europaea L. and
Posidonia (L.) Delile. We mainly focused on those topics that may hopefully enhance the
13 2.1 OLEA EUROPAEA L.
Biological aspects
Olea europaea is member of the family Oleaceae, order of Lamiales, which includes about 10
families for a total of about 11,000 species.
The Olive trees is a plant with over-century longevity, which has persistent leaves and, on the wild status, it starts to bear fruits after a long juvenile period preserving high rate of fruit production for many years.
Leaves are narrowly elliptic to oblong or “laceolate”, 1-8 cm long and 0.3- 2 cm wide, with glabrous upper surface and lower surface moderately to densely grayish-green. Flowers are hermaphroditic and reunited in a small cluster, commonly called "mignola”. Nevertheless a good part of the Italian varieties is auto-sterile; therefore the fertilization is primarily heterogamous. Drupes are green when immature, becoming black or brownish at maturity, sub-globose to narrowly ellipsoid, 6-19 mm long (Baldini 1993).
14 Genetic resource
Hundreds of varieties (cultivar) of olives currently exist, characterized by different ratios between core and pulp and therefore from a middle content of oil varying from 18 to 27%.
The high number of existing cultivars is due to modifications of the genotype, become of mutations fixed for by vegetative or for intersection spontaneous and following dissemination, or for fluctuation of varietal characters following environmental conditions. Olea europaea is a diploid species (2n = 2x = 46), predominantly allogamous, with a genome size of about 1,800 Mb, although several studies report cases of polyploidy among variety that may have played a major role in the diversification of the olive complex (Besnard, 2008) .
In spite of the economical importance and metabolic peculiarities of this species, very few data are available on genome composition.
15 2 .2 POSIDONIA OCEANICA L. (DELILE)
Seagrasses are aquatic angiosperms, belonging to the Monocotyledons, subclass Alismatidae, which are confined to the marine environment and are adapted to develop the whole lifecycle completely submerged. The seagrasses form a distinct ecological groups but not a unique taxonomic group: this implies that the various seagrass families do not necessarily have to be closely related (den Hartog, e Kuo 2006). The evolutionary convergence of morphological and physiological characters among species is driven by the pressure of marine environmental constrains and increases in some cases the difficulties for the precise systematic distinction between species. The almost 60 presently recognized seagrass species are polyphyletic and belong to four different families, Potomagetonaceae, Zosteraceae, Hydrocharitaceae and Cymodoceaceae. Molecular phylogenetic data, i.e. from the plastid gene encoding for Ru-BisCO large subunit (Les et al, 1997) (fig 2..2.1), suggest that the return into the sea occurred at least three times independently, within the families of Zosteraceae, Posidoniaceae/Cymodoceaceae, and Hydrocharitaceae.
16 Fig2.2.1 Maximum parsimony rbcL cladogram of species from the 15 families typically recognized in the monocotyledon subclass Alismatidae with representatives from two outgroup families. The degree of internal support is indicated by bootstrap values. Values for nodes with <50% bootstrap support are excluded. (Les, Cleland e Waycott, 1997)
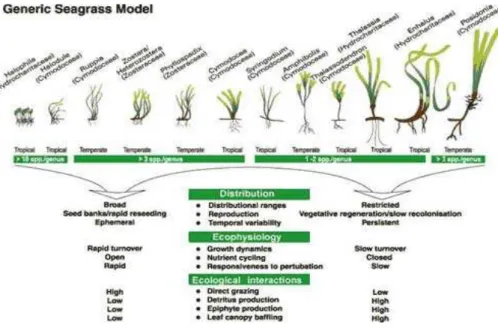
Seagrasses posse’s similar organs and tissues as the other flowering plants, but in contrast with terrestrial monocotyledons, seagrasses have to live in marine or highly saline environments and this has profoundly influenced their morphology and anatomy (fig2.2.2). Theirs unique life-style has brought to the development of unique characteristics. In particular, the most aknowledged are the following:
- Life in estuarine or marine environment, and nowhere else. - Underwater pollination with specialized pollen.
- Production of seeds underwater and seed dispersal by both biotic and abiotic agents.
- Presence of specialized leaves with a reduced cuticle and epidermis which lacks stomata and which represent the main photosynthetic tissue.
- Presence of roots capable of growing in anoxic environment and important in the nutrient transfer processes.
- Presence of a rhizome or underground stem with an important anchoring role.
17
Seagrasses exert a strong influence on the coastal environment and provide spatial structures and resources for rich associated communities. Given their multi-functional role and because of their widespread decline, seagrasses have been described in the UNCED Action Paper as an ecosystem that must be given priority for protection
The global species diversity of seagrasses is low, approximately 60 species, but species can have ranges that extend for thousands of kilometers of coastline. The importance of seagrasses as a key species in shallow coastal waters all over the world including polar areas (Green and Short, 2003) emerged over the last quarter of the 20th Century. Temperate seagrasses play a major role in providing habitat for commercially, recreationally and ecologically important fish and shellfish as well as food for many water fowl species (Green and Short, 2003). Seagrass species in temperate areas are also important in reducing wave and current energy and trapping and binding of fine grained sediments. The close habitat linkage between seagrasses and bivalve species is evident in many temperate parts of the world. Tropical seagrasses are important in their interactions with mangroves and coral reefs (Green and Short, 2003).
Seagrass meadows have been considered as high-value natural ecosystems compared with terrestrial habitats (Costanza et al.,1997). A measure of Productivity Value of seagrass ecosystems has been reported for the global area of 200 x106 ha as 3.801x10⁹ $ yr -1 (total value), the value per hectare being 19.004 $ yr -1 (tropical forest 2.007 $ ha-1 yr-1).
The importance of seagrass systems can be summarized in a set of axioms, which have become familiar to planners and conservationists, now often referred to as “ecosystem services” (Costanza et al. Nature 1997). The parameters utilized to calculate the reported values refer to the monetary resopurces which would be necessary to replace the seagrass meadows “ecosystem services” for one year. Ecosystem services of seagrass meadows are the following:
- Seagrasses are important primary producers, converting sunlight and carbon dioxide efficiently into organ form;
- Seagrasses supply organic food to a variety of dependent food webs; - Seagrasses stabilized the seabed in which they grow;
- Seagrasses structure the seabed on which they grow into a complex environment which provides places form many organisms to exist;
18
Most studies show that seagrass meadows are being lost rapidly in developed and developing parts of the world (Short et al. 2006b), with only occasional efforts at mitigation and restoration. Seagrass losses have been attributed to a broad spectrum of anthropogenic and natural causes: the effects of global climate change on seagrasses are difficult to document, but whether they manifest as sea level change, heat stress, radiation exposure, or increased storm activity, all largely diminish seagrass habitat, distribution and diversity (Short et al, 1999).
Moreover in many parts of the world, recent changes in species distributions have occurred as the result of human alteration of the physical environment or transport of species from their endemic locations (Short et al 2007). The global decrease of seagrass ecosystem has been quantified in a recent research (Waycott et al 2009): this analysis demonstrates that, over the entire period analyzed, 1879-2006, there was a mean decline in seagrass area of 1.5% yr-1. (Waycott et al 2009). The same research reveals that the rate of decline has accelerated over the past 8 decades, and the largest losses occurred after 1980 (Waycott et al 2009).
19 Posidonia oceanica
The genus Posidonia comprises nine species: P. oceanica is endemic of Mediterranean Sea and its distribution is restricted to this basin; the others eighth Posidonia species occur along the Australian coasts. Mediterranean and Australian species of Posidonia are not genetically close. The divergence in their DNA sequences (Waycott et al., 2000) indicates that the separation of the two groups took place at a relatively early time in the history the seagrasses, probably during the Late Eocene.
a
b
c
d
fig2.2.3 Posidonia oceanica: a) plantula b)fruits c) flower and d) meadow
Posidonia oceanica is a clonal plant, monoecius, hermaphroditic with irregular flowering and
fruiting (fig 2.3a;b;c) characterized by slow rhizome elongation rates, a high dispersal potential of reproductive structures and drifting vegetative fragments and long persistence of genotypes (Procaccini et al. 2003). Posidonia oceanica forms extensive monospecific meadows that can persist in situ for millennia, building an organogenic structure (i.e. matte) (fig 2.3d) that rises for meters above the sediment level (Mateo et al. 1997; Procaccini et al. 2003). Posidonia oceanica has been present in the Mediterranean Sea since the Miocene (Pérès 1985) and survived during the last glaciation in refugia from which it re-colonized the basin (Pérès 1984). It has been hypothesized that the plant had its climatic optimum around 4000 to 8000 yr ago, not being well adapted to the present conditions of the basin (Pérès 1984). Posidonia meadows are extremely sensitive to medium-high levels of disturbance. P. oceanica is in regression in particular along the Western Mediterranean coasts, due to external impacts mainly acting on thermal regime and light availably, to the presence of pollutants and competition with introduced seaweed species.
20
Besides general trends of increased coastal erosion and decreased water clarity, possibly related to global climatic changes, the high impact of human communities along the coast can also account for the recorded meadow regression (Short & Wyllie-Echeverria 1996).
Genetic structure of Posidonia oceanica in Mediterranean basin
Existing population genetic data on Posidonia oceanica have been obtained using neutral microsatellite markers (Procaccini and Waycott 1998, Alberto et al , 2003), which allowed a good understanding of the meadows genetic structure and population connectivity (Arnoud-Haond et al, 2005) at the basin scale. These studies showed that within the Mediterranean basin three main population groups were present. The first one including the North-Tyrrhenian populations, north Sardinia, Corsica and Médès Island; the second one with the South- Tyrrhenian populations, South Spain, Pantelleria, Malta and Tunis; the third one with the Adriatic and Aegean populations. Recent analysis shows the existence of a further quarter group including populations of the Sicily Channel (Arnoud-Haond et al 2007; Serra et al, 2009 in press). Serra et al, (2009 in press) also show that the distinction existing between Posidonia oceanica populations growing in the Western and in Eastern Mediterranean basin results from past vicariance events and is maintained at present by low levels of gene flow. Theoretical seed dispersal follows a West-East direction but most of them do not reach suitable substrate for settling along the coast because are transported in open water areas. Nevertheless, the two population groups do not seem to be reproductively isolated, but are maintained in contact by the transition zone represented by meadows at the longitude of the South-Eastern tip of Sicily and of the Malta Island in the Sicily Strait. Meadows in the transition zone present the higher genetic diversity observed and signature of recent admixture from different gene pools. Posidonia oceanica meadows in Sicily do generally show high genetic polymorphism, as also suggested by the frequent record of flowers and beached fruits along the coasts of the Island. Nonetheless very low genotypic richness has been found in meadows either isolated from the main patters of local gene flow (Serra et al., 2009 in press). Low genetic variability has also been found at the geographic boundaries of the species distribution, in isolated North Adriatic populations, where distinct meadows seem to be represented by single clones (Ruggiero et al, 2002), and in the Marmara Sea, where meadows, established since the Middle Holocene, seem to be isolated from the Mediterranean since the catastrophic intrusion of brackish water into the Marmara Sea and the strong and persistent flow coming from the Black Sea, occurred between 10,000 and 5,300 yrs BP
21
(Meinesz et al, 2009).The enhanced meadow isolation, together with the existing low genetic polymorphism and small population size found in P. oceanica (Procaccini et al. 2001) increase risk of survival of this species in the Mediterranean under environmental challenges (Arnaund-Haond et al 2007, Procaccini 2007). Populations living near or at the edges of their distributional ranges will be the first to suffer the environmental changes, and in the absence of local adaptation may be disappear; however populations at edge may have evolved ecophysiological adaptations, (e.g.
P.oceanica at the costal lagoon Stagnone di Marsala, Sicily lives at extreme salinity values,
Tommasello et al, 2009), and the development of selective markers will enable to identified genes underlying adaptation which can represent the baiss for the development of a new set of genetic/genomic tools for proactive monitoring, restoration and conservation of seagrasses ecosystems.
22
3.1 PLANT DEFENSE IN OLEA EUROPAEA
Introduction
Many plant defense compounds are stored in a non-active glucosylated form to chemically stabilize and increase the solubility of the defense compound, to render it suitable for storage in the vacuole, and to protect the plant from the toxic effects of its own defense system (Jones and Vogt, 2001). It has been established that the β-glucosidase and its glycoside substrate system have a role in the response against herbivores and pathogen attacks, and their different localization seems to be physiologically important, because some products of hydrolysis are also toxic to host cells. Upon cell disruption, caused for example by a chewing insect, the defense compounds are bioactivated via hydrolysis of the glucosidic linkage catalyzed by b glucosidases. In intact plant tissue, the β-glucosidases are stored separately from the substrates. This two-component system, of which each of the individual components is chemically inert, provides plants with an immediate chemical defense against attacking herbivores and pathogens (Morant et al, 2008) (fig 3.1.1)
Fig3.1 Model for subcellular compartmentalization of β-glucosidase and glycoside substrate system in plants. Modified from Morant et al, 2008
23
The biological activity of the defense compounds is attributed to their hydrolysis products, and therefore the separation of glucosides and β-glucosidases into different (sub) cellular compartments in intact tissue is a critical feature of the two component defense systems. As illustrated in Fig. 3.1, the glucosides are stored in the vacuole (among the others: Oba et al., 1981; Gruhnert et al., 1994). Subcellular localization of expressed β-glucosidases differ among monocotyledenous and eudicotyledenous plants: monocotyledenous β-glucosidases contain an N-terminal transit peptide resulting in localization to plastids (Gusmayer et al., 1994); in eudicotyledons, the β-glucosidases contain an N-terminal signal peptide that results in direction through the secretory pathway via the endoplasmatic reticulum and in co-translational glycosylation (Cairns et al., 2000;). Their final localization might be either apoplastic or intracellular in protein bodies (Swain et al., 1992; Poulton et al, 1994).
In Oleaceae the β-glucosidases is involved in a constitutive defence system against herbivores and insect attacks by realizing the bioactive molecules produced by oleuropein hydrolysis (Mazzuca t al, 2006). In Ligustrum, a genus of the Oleaceae family, the oleuropein-degradative-β-glucosidase activity has been detected in purified chloroplast fractions of leaf extracts (Mazzuca et al.,2002). Chloroplasts of Olea europaea leaf and fruit parenchyma cells also contain large amounts of an oleuropein-degradative-β-glucosidase which specifically hydrolyses the bitter phenol oleuropein (Konno et al. 1999)
A rising of oleuropein-degradative-β-glucosidase activity was detected in the olive fruit pulp following a biomimed insect attack as the early response of tissue damages (Mazzuca et al., 2008). All these findings suggested that chloroplast -β-glucosidase is related to leaf and fruit defence mechanism by storing and releasing the toxic chemical; the damage of cells and tissues by pests bring in contact -β-glucosidase and oleuropein with the consequent release of toxic aglycones which either deterred herbivores or inhibited the entry, growth and spread of phytophathogens (Konno et al. 1999). The oleuropein degradative-β-glucosidase is expressed in different isoforms, able to segregate in two different cell compartments. They are also differentially expressed in the cells of the outer and inner mesocarp tissues. Since the GH 1 enzyme family is encoded by nuclear genes (Esen 1993) , the chloroplast isoform must moves from the cytoplasm, where it is synthesized, into the chloroplast organelle by the cleavage of the transit peptide sequences located in the N-terminus of the bglucosidase protein precursor (Mieszczak et al., 1992)
24
By means of in situ enzyme assay, performed in olive fruit tissues, It was found enzymatic hydrolysis in the chloroplasts of the outer mesocarp cells (Fig. a1) and in the small cytoplasm oil droplets of the inner mesocarp cells (Fig. b2). By means of proteomic approach three enzyme isoforms were detected in leaf tissue whose the expression seems to be related to the photosynthetic competence, since they are not expressed in young immature leaf parenchyma, but strongly expressed in mature and aged leaves. Even in fruits the three enzyme isoforms were differentially expressed at different stage of ripening. These results suggest that at least three different β-glucosidases, are highly specific to oleuropein. The efficiency of this system could be responsible for the different susceptibility of olive grove to infestation (Mazzuca et al, 2008 in press)
Fig3.2 Models of cell compartmentalization of oleuropein-degradative β-glucosidase and oleuropein s in outer mesocarp cells (a1) and in the inner mesocarp cells (b1) In the outer mesocarp cell the oleuropein is stabilised in the vacuole of cells, the enzyme is located inside the chloroplasts. A β-glucosidase precursor protein is also in the cytoplasm, before going in the chloroplast organelle: alternatively, in the cell of the inner the oleuropein degradative β-glucosidase is localized inside the core of oil droplets and the oleuropein is stay in the vacuole compartment.Modified from Mazzuca et al, 2006
Glycoside hydrolases (EC 3.2.1.-) are a widespread group of enzymes which hydrolyse the glycosidic bonds between two or more carbohydrates or between a carbohydrate and a non-carbohydrate moieties. The completion of genome sequences of model plants Arabidopsis thaliana, which has 48 predicted β-glucosidases, and rice, which has about 50 predicted ß-glucosidases,
25
indicates that in plants these enzymes are encoding by multigene family The high ß-glucosidase multiplicity in plants is not surprising because plants produce hundreds of different ß-linked glucoconjugates (i.e. substrates), and they need a corresponding enzyme repertoire to hydrolyze these glucoconjugates specifically. The IUB-MB Enzyme nomenclature of glycoside hydrolases (GHs) is based on their substrate specificity and occasionally on their molecular mechanism; such a classification does not reflect the structural features of these enzymes. At least 100 families are currently available on CAZYweb server (http://www.cazy.org /CAZY/index.html). On the basis of their three-dimensional structure, GHs can be grouped into clans of related structure (Henrissat et al.,1997). Because there is a direct relationship between sequence and folding similarities, such a classification reflects the structural features of these enzymes better than their sole substrate specificity, helps to reveal the evolutionary relationships between these enzymes, and provides a convenient tool to derive mechanistic information
β-glucosidases belonging to the family 1 glycoside hydrolases, catalyze the hydrolysis of the
glucosidic bond between the anomeric carbon (C1 of the glucose) and the glucosidic oxygen by a mechanism in which the anomeric configuration of the glucose is retained (Davies and Henrissat, 1995). The catalytic mechanism is illustrated in fig. 3.2. Two conserved glutamic acid residues serve as a catalytic nucleophile and a general acid/base catalyst, respectively. In retaining b-glucosidases, the catalytic glutamic acid residues are situated on opposite sides of the b-glucosidic bond of the docked substrate at a distance of _5.5 Å (Davies and Henrissat, 1995). As the initial step in catalysis, the nucleophile performs a nucleophilic attack at the anomeric carbon, which results in formation of a glucose–enzyme intermediate. In this process, aglicone departure is facilitated by protonation of the glucosidic oxygen by the acid catalyst. During the second catalytic step (deglucosylation), a water molecule is activated by the catalytic base to serve as a nucleophile for hydrolysis of the glucosidic bond and release of the glucose (Davies and Henrissat, 1995). Under suitable conditions, β-glucosidases can perform a transglucosylation in which the covalently bound glucose in the enzyme– glucose intermediate is transferred to an alcohol or a second sugar group. Even though this reaction has not been observed to occur in vivo, b-glucosidases such as cassava (Manihot esculenta) linamarase (b-glucosidase specific for the cyanogenic glucosides linamarin and lotaustralin) are used for industrial production of alkyl b-glucosides and show great industrial application potentials (Svasti et al., 2003; Hommalai et al., 2005).
26 Fig. 3.3. Reaction mechanism of retaining b-glucosidases. A glutamic acid residue in the conserved TFNEP motif (Davies and Henrissat, 1995) serves as a general acid/basecatalyst (AH) while a glutamic acid residue in the I/VTENG motif (Davies and Henrissat, 1995) serves as a nucleophile (B). The reaction cycle is specified in the text. Modified from Morant et al 2008.
27 Phylogenetic relationship and structural similarity between β-glucosidases involved in plant defense
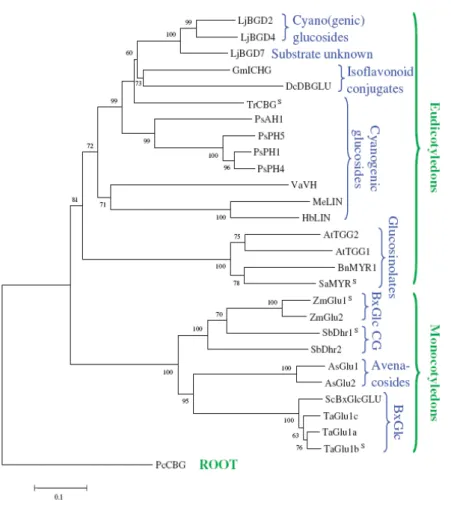
The β-glucosidases involved in hydrolysis of defense compounds upon tissue disruption form three distinct clusters in the phylogenetic tree shown in fig. 3.4: eudicotyledenous O-β-glucosidases, dicotyledenous S-β-glucosidases (myrosinases) and monocotyledenous O-β-glucosidases. Although separated into three different clusters, these b-glucosidases show a high degree of amino acid sequence identities and very similar overall tertiary structures. (Morant et al., 2008).
Fig. 3.4 eudicotyledenous β-glucosidases, dicotyledenous S-β-glucosidases (myrosinases) and monocotyledenous
O-β-glucosidases. Although separated into three different clusters, these b-glucosidases show a high degree of amino acid
28 Genomic features
At the moment, for Olea europaea only one nucleotide sequence encoding for putative GH1 (ACCESSION N°AAL93619.1) have been obtained from mRNA extracted from leaves (cultivar “Koroneiki”. To date, no studies have specifically focused on the identification of individual functions of the ß-glucosidase isozymes in Olea europaea. An EST database which brings about 22,904 gene clusters becomes recently available (Alagna et al 2009).
The specific aim of this section of my work was to obtain preliminary data on DNA and cDNA sequence and organization of the putative members of GH1-family from Olea europaea cv “Carolea”, a grove very susceptible to olive fly infestation, using a PCR approach in order to provide a basis for studying their functioning and expression.
29 3.1 MATERIALS AND METHODS
Genomic DNA and total RNA was extracted using a C-TAB method (Chang et al.1993 mod.) from fresh leaves and fruits. In order to remove contaminant DNA, RNA samples were treated with DNase I. Almost 3 µg of total RNA were used as a template to synthesize first-strand cDNA with Protoscript First Strand cDNA synthesis Kit (BioLabs), according to the manufacture’s protocol. Genomic DNA and cDNA were amplified with a set of primers (Obglc-F; Obglc-R ;tab1) designed on conserved regions of β-glucosidase sequences of eudicotyledons, in particular based on the sequence of Olea bglc-mRNA cv Koroneiki GenBank Accession No. AY083162, in order to obtain fragments overlapping all bglc CDS region and the flanking regions (Tab 1). PCR products, selected according to the hypothetical molecular size assessed on Agarose gel against a molecular size standard, were cut from the gel and cleaned with QIAquick Gel Extraction Kit (QUIAGEN). Eluted fragments were sequenced with Beckman Coulter CEQ2000 .and electropherograms were analyzed with SequenceScanner v1.0 and manually cleaned for reading errors. Cleaned sequences were aligned using the ClustalW algoritm (Thompson et al., 1994), run in the BioEdit 5.0.9 software package (Hall,1999 ) .
Tab3.1 Primers design primers sequences (Obglc-F; Obglc-R). Primers Obglc- 1-6 were designed
based on nucleotidic sequence of bglc-mRNA cv Koroneiki GenBank Accession No. AY083162 Primers Obglc- E-N were designed based on respectively: T(L/F)NEP and V(Y/I)TENG conserved strength among eucotyledons β-glucosidases.
PRIMER CODE SEQUENCE 5’→3’ Tm REGION CONSERVED MOTIF
Obglc- 1F TTA CAC TAC TTC AAA GAG CAC C 62 5’ UTR Obglc- 1R TCC TTT ATT GGA ACA TAA CGA G 60 3’ UTR Obglc- 5F TTG GAT TAC CTT GAA TGA GCC 60 CDS Obglc- 5R GTG CCG GGA TTT CCA TAC T 58 CDS Obglc- 6F ATA TGT TCAA GGA CGA TGT TGT C 64 CDS
Obglc- EF TGG ATT ACC TTG AAT GAG CCA TG 66 CDS TLNEP
Obglc- ER CAT GGC TCA TTC AAG GTA ATC CA 66 CDS TLNEP
Obglc- Nf ATA TAC ATC ACC GAG AAC GGA 60 CDS TENG
30
Proteomic and bioinformatic tools allowed us to identify the enzyme isoforms and their timing of expression in developing organs. To reach these goals we compared the biomolecular data with the immunogold analyses in leaf cells at different stages of leaf development and during fruit ripening, by identification of sequence region encoding for amino acid strength recognized by the antibody against the β-glucosidase from Polygonum tinctorium
Database searching for to identified other putative member of β-glucosidases family in Olea, genomic sequence of Obglc Carolea was used as query against Olea EST database (www.oleadb.it) to search homology sequence
31
3.2 RESULT
Polymorphism analysis of cDNA sequences Carolea and Koroneiki
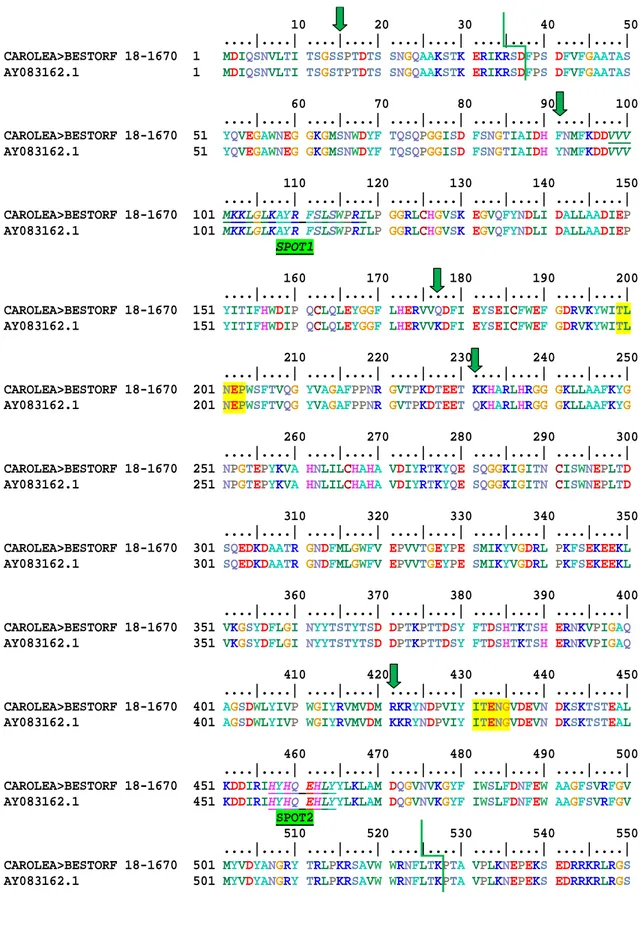
After the PCR amplification of cDNA Carolea using specific primers an amplicones of 1795 bp was obtained. The sequence obtained from cDNA Carolea were alignment with bglc AY083162 obtained from cultivar Koroneiki. Along the alignment were scored sixteen polymorphic positions (Tab 3.2.1). There are nine 9 putative SNP (alignment position 43, 90, 507, 1020, 1511, 1624, 1723, 1798, 2194) between cDNA Carolea and AY083162.1. Among these, six are in the CDS ( 90, 507, 1020, 1511, 1624, 1723) one in the 5’UTR (43) two in the 3’UTR (1798, 2194) . In in the 3’UTR region also there are two deletions. After the conceptual translation of nucleotide sequence bglc Carolea using BESTORF Softberry (http://linux1.softberry.com/), the deduced amino acid sequences were aligns with AY083162.1. Five amino acid substitutions were identified between Carolea and Koroneiki protein sequence (Tab 3.2.2).
Tab 3.2.1 Polymorphic position of bglc sequence among mRNA sequence Carolea and were scored 9 putative SNP and 2 Deletions (see text).
SNP P 43 SNP P 90 SNP P 507 SNP P 1020 SNP P 1511 SNP P 1624 SNP P 1723 SNP P 1798 SNP P 2194 DEL P 2236 DEL P 2244 AY083162.1 C A A A A C C T C T A cDNA Carolea T T T T C T A C T - -
Tab 3.2.2 List of amino acid substitutions between BGCL protein sequences deduced from cDNA Carolea and Koroneiki
P15 P91 P 177 P231 P421
AY083162.1 Koroneiki S F Q K R
32
Identification of region sequence encoding for BGLC extracted from olea tissue .Amino acidic strength recognized by the antibody against the β-glucosidase from Polygonum tinctorium
Tab 3.2.3 Amino acidic sequence of SPOT1 and SPOT2 recognized by the antibody against the β-glucosidase from Polygonum tinctorium
AMINO ACIDIC SEQUENCE SPOT
EPITOPO 1 VVVMKKLGLKAYRFSLSWPRIG SPOT 1
33
10 20 30 40 50 ....|....| ....|....| ....|....| ....|....| ....|....| CAROLEA>BESTORF 18-1670 1 MDIQSNVLTI TSGSSPTDTS SNGQAAKSTK ERIKRSDFPS DFVFGAATAS AY083162.1 1 MDIQSNVLTI TSGSTPTDTS SNGQAAKSTK ERIKRSDFPS DFVFGAATAS 60 70 80 90 100 ....|....| ....|....| ....|....| ....|....| ....|....| CAROLEA>BESTORF 18-1670 51 YQVEGAWNEG GKGMSNWDYF TQSQPGGISD FSNGTIAIDH FNMFKDDVVV AY083162.1 51 YQVEGAWNEG GKGMSNWDYF TQSQPGGISD FSNGTIAIDH YNMFKDDVVV 110 120 130 140 150 ....|....| ....|....| ....|....| ....|....| ....|....| CAROLEA>BESTORF 18-1670 101 MKKLGLKAYR FSLSWPRILP GGRLCHGVSK EGVQFYNDLI DALLAADIEP AY083162.1 101 MKKLGLKAYR FSLSWPRILP GGRLCHGVSK EGVQFYNDLI DALLAADIEP
SPOT1 160 170 180 190 200 ....|....| ....|....| ....|....| ....|....| ....|....| CAROLEA>BESTORF 18-1670 151 YITIFHWDIP QCLQLEYGGF LHERVVQDFI EYSEICFWEF GDRVKYWITL AY083162.1 151 YITIFHWDIP QCLQLEYGGF LHERVVKDFI EYSEICFWEF GDRVKYWITL 210 220 230 240 250 ....|....| ....|....| ....|....| ....|....| ....|....| CAROLEA>BESTORF 18-1670 201 NEPWSFTVQG YVAGAFPPNR GVTPKDTEET KKHARLHRGG GKLLAAFKYG AY083162.1 201 NEPWSFTVQG YVAGAFPPNR GVTPKDTEET QKHARLHRGG GKLLAAFKYG 260 270 280 290 300 ....|....| ....|....| ....|....| ....|....| ....|....| CAROLEA>BESTORF 18-1670 251 NPGTEPYKVA HNLILCHAHA VDIYRTKYQE SQGGKIGITN CISWNEPLTD AY083162.1 251 NPGTEPYKVA HNLILCHAHA VDIYRTKYQE SQGGKIGITN CISWNEPLTD 310 320 330 340 350 ....|....| ....|....| ....|....| ....|....| ....|....| CAROLEA>BESTORF 18-1670 301 SQEDKDAATR GNDFMLGWFV EPVVTGEYPE SMIKYVGDRL PKFSEKEEKL AY083162.1 301 SQEDKDAATR GNDFMLGWFV EPVVTGEYPE SMIKYVGDRL PKFSEKEEKL 360 370 380 390 400 ....|....| ....|....| ....|....| ....|....| ....|....| CAROLEA>BESTORF 18-1670 351 VKGSYDFLGI NYYTSTYTSD DPTKPTTDSY FTDSHTKTSH ERNKVPIGAQ AY083162.1 351 VKGSYDFLGI NYYTSTYTSD DPTKPTTDSY FTDSHTKTSH ERNKVPIGAQ 410 420 430 440 450 ....|....| ....|....| ....|....| ....|....| ....|....| CAROLEA>BESTORF 18-1670 401 AGSDWLYIVP WGIYRVMVDM RKRYNDPVIY ITENGVDEVN DKSKTSTEAL AY083162.1 401 AGSDWLYIVP WGIYRVMVDM KKRYNDPVIY ITENGVDEVN DKSKTSTEAL 460 470 480 490 500 ....|....| ....|....| ....|....| ....|....| ....|....| CAROLEA>BESTORF 18-1670 451 KDDIRIHYHQ EHLYYLKLAM DQGVNVKGYF IWSLFDNFEW AAGFSVRFGV AY083162.1 451 KDDIRIHYHQ EHLYYLKLAM DQGVNVKGYF IWSLFDNFEW AAGFSVRFGV SPOT2
510 520 530 540 550 ....|....| ....|....| ....|....| ....|....| ....|....| CAROLEA>BESTORF 18-1670 501 MYVDYANGRY TRLPKRSAVW WRNFLTKPTA VPLKNEPEKS EDRRKRLRGS AY083162.1 501 MYVDYANGRY TRLPKRSAVW WRNFLTKPTA VPLKNEPEKS EDRRKRLRGS
. CAROLEA>BESTORF 18-1670 551 T AY083162.1 551 T
Fig alignment bglc cDNA Carolea and AY083162.1. allows shows polymorphic position, green line region Glyco_hydro_1 (start position aa 38 end position 527), yellow catalytic site
34 Partial genetic structure of β-glucosidase in Olea europaea
After the PCR reaction using Obglc- 1F Obglc- 5R specific primers, a fragment of approximately 1638 bp was obtained. The putative genomic partial sequence of Obglc Carolea was aligns with sequences of cDNA obtained from Carolea
Alignment of genomic sequences and cDNA coverage a region comprise between 23-1667 nt of cDNA sequence.Five polymorphic positions between cDNA and gDNA were scored: three insertions in P 798, 828, 829; two inversions Purine/Pyrimidine in P 819 and Pyrimidine/Purine in P 812 (Tab 3.2.3)
Tab. 3.2.3 List of polymorphic position scored among genomic and mRNA sequence INS P306 INV P320 INV P762 INS P336 INS P337 GENOMIC Carolea - C A - - mRNA Carolea G G T A A
On the basis of comparison between bglc genomic sequence with the cDNA sequence, the partial genomic structure was established (fig 3.2.1).
Fig 3.2.1 Partial genomic structure of β glucosidases. The gene consist at least of seven exons and six introns
35
Alignment bglc genomic sequence and cDNA carolea
10 20 30 40 50 ....|....| ....|....| ....|....| ....|....| ....|....|
GENOMICO Carolea 1 --- --- ---caaa gcaacgtcct gacgattact
cDNA CAROLEA 1 gagcaccaaa gtttgcaatg gatatccaaa gcaacgtcct gacgattact
60 70 80 90 100 ....|....| ....|....| ....|....| ....|....| ....|....|
GENOMICO Carolea 25 agcggatccT caccaactga cacttcctcc aatggtcagg cagccaaatc
cDNA CAROLEA 51 agcggatccT caccaactga cacttcctcc aatggtcagg cagccaaatc
110 120 130 140 150 ....|....| ....|....| ....|....| ....|....| ....|....|
GENOMICO Carolea 75 caccaaagaa aggatcaaac gctctgattt tcccagtgac tttgtatttg cDNA CAROLEA 101 caccaaagaa aggatcaaac gctctgattt tcccagtgac tttgtatttg
160 170 180 190 200 ....|....| ....|....| ....|....| ....|....| ....|....|
GENOMICO Carolea 125 gcgctgcaac tgcttcatat caagtatata tgtgtcacat attattatac
cDNA CAROLEA 151 gcgctgcaac tgcttcatat caa--- --- ---
210 220 230 240 250 ....|....| ....|....| ....|....| ....|....| ....|....|
GENOMICO Carolea 175 tattctgact tcatttaaaa agaaaaagaa catatatata atttgttaaa
cDNA CAROLEA 173 --- --- --- --- --- 260 270 280 290 300 ....|....| ....|....| ....|....| ....|....| ....|....| GENOMICO Carolea 225 ttctgggcca catatataat tttgcaggtt gaaggtgcat ggaacgaagg cDNA CAROLEA 173 --- --- ---gtt gaaggtgcat ggaacgaagg 310 320 330 340 350
36 ....|....| ....|....| ....|....| ....|....| ....|....|
GENOMICO Carolea 275 aggtaaaggc atgagtaatt gggattactt tacacagagt caaccaggtc
cDNA CAROLEA 197 aggtaaaggc atgagtaatt gggattactt tacacagagt caac---
360 370 380 390 400 ....|....| ....|....| ....|....| ....|....| ....|....| GENOMICO Carolea 325 tcctcttttt ccaatctttt catgaatata ttatatagtg ttccatgtct cDNA CAROLEA 240 --- --- --- --- --- 410 420 430 440 450 ....|....| ....|....| ....|....| ....|....| ....|....| GENOMICO Carolea 375 attgctgaga atatgtttat tggactggca ggtggtattt ccgactttag cDNA CAROLEA 240 --- --- ---ca ggtggtattt ccgactttag 460 470 480 490 500 ....|....| ....|....| ....|....| ....|....| ....|....| GENOMICO Carolea 425 caatggcact attgcaattg atcactTtaa tatgttcaag gtatactttc cDNA CAROLEA 263 caatggcact attgcaattg atcactTtaa tatgttcaag g--- 510 520 530 540 550 ....|....| ....|....| ....|....| ....|....| ....|....| GENOMICO Carolea 475 agtaatattt actatcncat gctctcgagc gagttagata aattcaactt cDNA CAROLEA 303 --- --- --- --- --- 560 570 580 590 600 ....|....| ....|....| ....|....| ....|....| ....|....|
GENOMICO Carolea 525 tttttaactg gcttgtacgc taatatctat gttacnttcg tattaaacat
cDNA CAROLEA 303 --- --- --- --- ---
610 620 630 640 650 ....|....| ....|....| ....|....| ....|....| ....|....|
GENOMICO Carolea 575 ggaatttaga tgaattaaaa aagaaactta aaataaaaat tccgaatttn
cDNA CAROLEA 303 --- --- --- --- ---
660 670 680 690 700 ....|....| ....|....| ....|....| ....|....| ....|....|
GENOMICO Carolea 625 nncttcattt tgctttactc atgaaaaagt tttccatnat tccttttact
37 710 720 730 740 750 ....|....| ....|....| ....|....| ....|....| ....|....| GENOMICO Carolea 675 cttaagacaa ctcaagaatt tttcctttta ttttatttta aattcatata cDNA CAROLEA 303 --- --- --- --- --- 760 770 780 790 800 ....|....| ....|....| ....|....| ....|....| ....|....|
GENOMICO Carolea 725 tcaaattgct gatttac-at gttgtcgtga tCaagaaaAt gggtttg--a
cDNA CAROLEA 303 --- ---acgat gttgtcgtga tGaagaaaTt gggtttgaaa SPOT1 GTTGTCGTGA TGAAGAAATT GGGTTTGaaa
810 820 830 840 850 ....|....| ....|....| ....|....| ....|....| ....|... GENOMICO Carolea 772 gcatacagat tttcactttc atggcctaga atcttgccag gcatgttatt cDNA CAROLEA 339 gcatacagat tttcactttc atggcctaga atcttgccag g--- SPOT1 GCATACAGAT TTTCACTTTC ATGGCCTAGA ATCTTGCCAG G 860 870 880 890 900 ....|....| ....|....| ....|....| ....|....| ....|....|
GENOMICO Carolea 822 ttctaattac tactggagtt tgtgcatcgt tttatgatgt tctattaaat
cDNA CAROLEA 379 --- --- --- --- ---
910 920 930 940 950 ....|....| ....|....| ....|....| ....|....| ....|....|
GENOMICO Carolea 872 gtgtgcactc tattttggtg ttttaggagg aagactgtgt cacggtgtat
cDNA CAROLEA 379 --- --- ---agg aagactgtgt cacggtgtat
960 970 980 990 1000 ....|....| ....|....| ....|....| ....|....| ....|....|
GENOMICO Carolea 922 ctaaagaagg agttcagttc tataacgatc tcattgatgc tctcttggca
cDNA CAROLEA 403 ctaaagaagg agttcagttc tataacgatc tcattgatgc tctcttggca
1010 1020 1030 1040 1050 ....|....| ....|....| ....|....| ....|....| ....|....|
GENOMICO Carolea 972 gctggttaga atcaattgca tggtccttat attgattgtt tcgtaaaaaa
cDNA CAROLEA 453 gct--- --- --- --- ---
1060 1070 1080 1090 1100 ....|....| ....|....| ....|....| ....|....| ....|....|
38
GENOMICO Carolea 1022 actattattg cataaatcat atttcatatt atcttctcac tttctgtcga
cDNA CAROLEA 455 --- --- --- --- --- 1110 1120 1130 1140 1150 ....|....| ....|....| ....|....| ....|....| ....|....| GENOMICO Carolea 1072 tcccttttgt gcagacatag agccatatat aactatcttt cactgggata cDNA CAROLEA 455 --- ---gacatag agccatatat aactatcttt cactgggata 1160 1170 1180 1190 1200 ....|....| ....|....| ....|....| ....|....| ....|....|
GENOMICO Carolea 1122 ttccccaatg tttgcaacta gagtatggtg gcttcctaca tgaaagagtt
cDNA CAROLEA 493 ttccccaatg tttgcaacta gagtatggtg gcttcctaca tgaaagagtt
1210 1220 1230 1240 1250 ....|....| ....|....| ....|....| ....|....| ....|....| GENOMICO Carolea 1172 gtgtaagtaa ctcaatcttt catcctatgg cacattacta agatatttat cDNA CAROLEA 543 gtg--- --- --- --- --- 1260 1270 1280 1290 1300 ....|....| ....|....| ....|....| ....|....| ....|....|
GENOMICO Carolea 1222 tgaacctgaa aagtgtatcc agattttaaa aaaataaaaa ttaaataata
cDNA CAROLEA 545 --- --- --- --- ---
1310 1320 1330 1340 1350 ....|....| ....|....| ....|....| ....|....| ....|....|
GENOMICO Carolea 1272 ataatcattt gctccaacat tataaaagag aaaatacaaa atttttattt
cDNA CAROLEA 545 --- --- --- --- ---
1360 1370 1380 1390 1400 ....|....| ....|....| ....|....| ....|....| ....|....|
GENOMICO Carolea 1322 aaaaataaaa taaaattgat tacaatttta gtaaaatggt ggacaatctt
cDNA CAROLEA 545 --- --- --- --- ---
1410 1420 1430 1440 1450 ....|....| ....|....| ....|....| ....|....| ....|....|
GENOMICO Carolea 1372 ctacaaagat taaagttcca gcttaacaag ttctaccata ttttgatcta
cDNA CAROLEA 545 --- --- --- --- ---
39 ....|....| ....|....| ....|....| ....|....| ....|....| GENOMICO Carolea 1422 ttgagccatt ttttgtgtct ataatacagg Caggatttta ttgagtattc cDNA CAROLEA 545 --- --- --- Caggatttta ttgagtattc 1510 1520 1530 1540 1550 ....|....| ....|....| ....|....| ....|....| ....|....|
GENOMICO Carolea 1472 tgagatttgc ttctgggaat ttggtgatcg ggtgaaatat tggattacct
cDNA CAROLEA 566 tgagatttgc ttctgggaat ttggtgatcg ggtgaaatat tggattacct
1560 1570 1580 1590 1600 ....|....| ....|....| ....|....| ....|....| ....|....| GENOMICO Carolea 1522 tgaatgagcc atggtccttt actgttcaag gatatgtggc tggTgctttt cDNA CAROLEA 616 tgaatgagcc atggtccttt actgttcaag gatatgtggc tggTgctttt 1610 1620 1630 1640 1650 ....|....| ....|....| ....|....| ....|....| ....|....|
GENOMICO Carolea 1572 ccgcccaatc gtggtgtaac tccgaaagat actgaagaaa ctAaaaagca
cDNA CAROLEA 666 ccgcccaatc gtggtgtaac tccgaaagat actgaagaaa ctAaaaagca
1660 1670 1680 1690 1700 ....|....| ....|....| ....|....| ....|....| ....|....|
GENOMICO Carolea 1622 tgcccgtctt catagag cDNA CAROLEA 716 tgcccgtctt catagaggtg gaggaaaact tctagctgct ttcaagtatg
40
As has been observed in fig (3.2.1) the gene bglc comprise at least seven exons, which were interrupted by six introns (Tab3.2.4): first intron long 103bp star with a short repetitive sequence (GTATATATGTG), G+C content = 23.08% A+T content = 76.92%, second intron is long
84 bp star , A+T content = 66.67%,
Tab3.2.4 principal featujre of intron sequence of bglc INTRON JUNCTION LENGTH % A+T content note
INTRON 1 A/G 103 76.92% GTATATATGTG
INTRON 2 C/C 84 66.67% CAGGT flanking region
INTRON 3 G/A 274 73.36%
INTRON 4 G/A 86 68.60%
INTRON 5 T/G 110 70.00%
41
Using blastn analysis was founded positive match for 10 EST clusters (tab 3,2.5). Clusters which have homology with Obglc Carolea were aligned to detect putative mRNA variants (see in appendix complete alignment).
Tab3.2.5: List of EST clusters producing significant alignments with Obglc Carolea Score
EST cluster producing significant alignments: (bits) EValue >OLEEUCl003319|Contig10 954 0.0 >OLEEUCl003319|Contig11 391 e-111 >OLEEUCl003319|Contig2 353 e-100 >OLEEUCl003319|Contig12 305 1e-085 >OLEEUCl003319|Contig3 268 3e-074 >OLEEUCl003319|Contig13 168 2e-044 >OLEEUCl003319|Contig9 125 2e-031 >OLEEUCl003319|Contig6 26 0.16 >OLEEUCl003319|Contig5 26 0.16 >OLEEUCl003319|Contig7 24 0.64
42 Alignment Between bglc Genomic Carolea, mRNA Carolea mRNA Koroneiki, EST sequence which have positive homology against Genomic
Carolea 10 20 30 40 50 ....|....| ....|....| ....|....| ....|....| ....|....| GENOMICO CAROLEA 1 --- --- --- --- --- cDNA CAROLEA 1 --- --- --- --- --- cDNA KORONEIKI 1 --- --- --- --- --- OLEEUCl003319_Contig1 1 --- --- --- --- ---
OLEEUCl003319_Contig2 minus1 ---A AAGCAGTGGT ATCAACGCAG AGTACG-CGG GG---~GC
OLEEUCl003319_Contig5 1 --- AAGCAGTGGT ATCAACGCAG AGTACG-CGG GG--- OLEEUCl003319_Contig4 1 TTGCGTGTCT CAGCAGTGGT ATCAACGCAG AGTACG-CGG G--- OLEEUCl003319_Contig9 1 --- AAGCAGTGGT ATCAACGCAG AGTACG-CGG --- OLEEUCl003319_Contig12 1 --- AAGCAGTGGT ATCAACGCAG AGTACG-CGG G--- OLEEUCl003319_Contig3 1 --- AAGCAGTGGT ATCAACGCAG AGTACGTCGG GGGTT--- OLEEUCl003319_Contig11 1 --- --- --- --- --- OLEEUCl003319_Contig10 1 --- --- --- --- --- OLEEUCl003319_Contig13 1 --- --- --- --- --- 60 70 80 90 100 ....|....| ....|....| ....|....| ....|....| ....|....| GENOMICO CAROLEA 1 --- --- --- --- ---
cDNA CAROLEA 1 --- --- --- gagcaccaaa gtTtgcaatg cDNA KORONEIKI 1 accaaagtct gcaacttaca ctacttcaaa gagcaccaaa gtCtgcaatg OLEEUCl003319_Contig1 1 --- --- --- --- ---
OLEEUCl003319_Contig2 min 35 ACCAAAGTCT GCAACTTACA CTACTTCAAA GAGCACCAAA GTCTGCAATG OLEEUCl003319_Contig5 31 --- --- --- --- --- OLEEUCl003319_Contig4 40 --- --- --- --- --- OLEEUCl003319_Contig9 29 --- --- --- --- --- OLEEUCl003319_Contig12 30 --- --- --- --- --- OLEEUCl003319_Contig3 35 --- --- --- --- --- OLEEUCl003319_Contig11 1 --- --- --- --- --- OLEEUCl003319_Contig10 1 --- --- --- --- --- OLEEUCl003319_Contig13 1 --- --- --- --- --- 110 120 130 140 150 ....|....| ....|....| ....|....| ....|....| ....|....|